Closing the Gap: Global health equity and the Commission ... · PDF fileequity and the...
74
Closing the Gap: Global health Closing the Gap: Global health equity and the Commission on equity and the Commission on Social Determinants of Health Social Determinants of Health Michael Marmot Michael Marmot UCL UCL Chair: Commission on Social Determinants of Health Chair: Commission on Social Determinants of Health McLaughlin McLaughlin - - Gallie Gallie Visiting Professor Lecture Visiting Professor Lecture Montreal, Canada Montreal, Canada February 5 February 5 th th 2009 2009
Transcript of Closing the Gap: Global health equity and the Commission ... · PDF fileequity and the...

Closing the Gap: Global health Closing the Gap: Global health equity and the Commission on equity and the Commission on Social Determinants of HealthSocial Determinants of Health
Michael MarmotMichael MarmotUCLUCL
Chair: Commission on Social Determinants of HealthChair: Commission on Social Determinants of Health
McLaughlinMcLaughlin--GallieGallie Visiting Professor LectureVisiting Professor LectureMontreal, CanadaMontreal, CanadaFebruary 5February 5thth 20092009
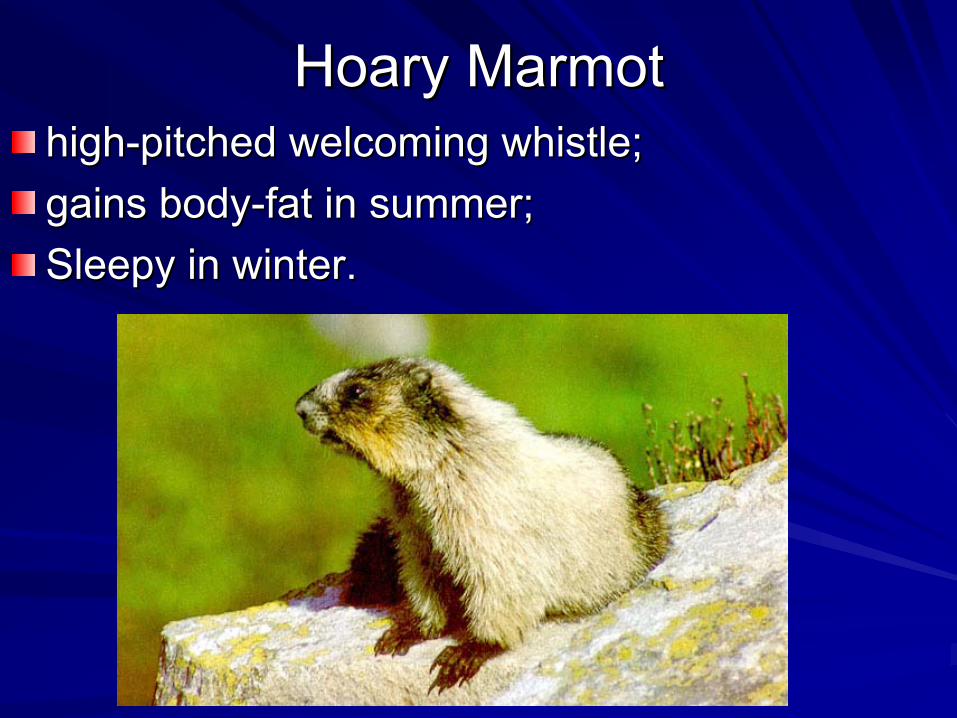
Hoary MarmotHoary Marmothighhigh--pitched welcoming whistle;pitched welcoming whistle;gains bodygains body--fat in summer;fat in summer;Sleepy in winter.Sleepy in winter.

Social justiceSocial justiceEmpowerment Empowerment ––material, material, psychosocial, politicalpsychosocial, politicalCreating the Creating the conditions for people conditions for people to take control of their to take control of their liveslives

““This ends the debate decisively. Health This ends the debate decisively. Health care is an important determinant of health. care is an important determinant of health. Lifestyles are important determinants of Lifestyles are important determinants of health. But it is factors in the social health. But it is factors in the social environment that determine access to environment that determine access to health services and influence lifestyle health services and influence lifestyle choices in the first place.choices in the first place.””
Dr Margaret Chan, the DG of the WHO,at the launch of the CSDH Final Report in Geneva 28th August 2008
Photo: WHO/Chris Black
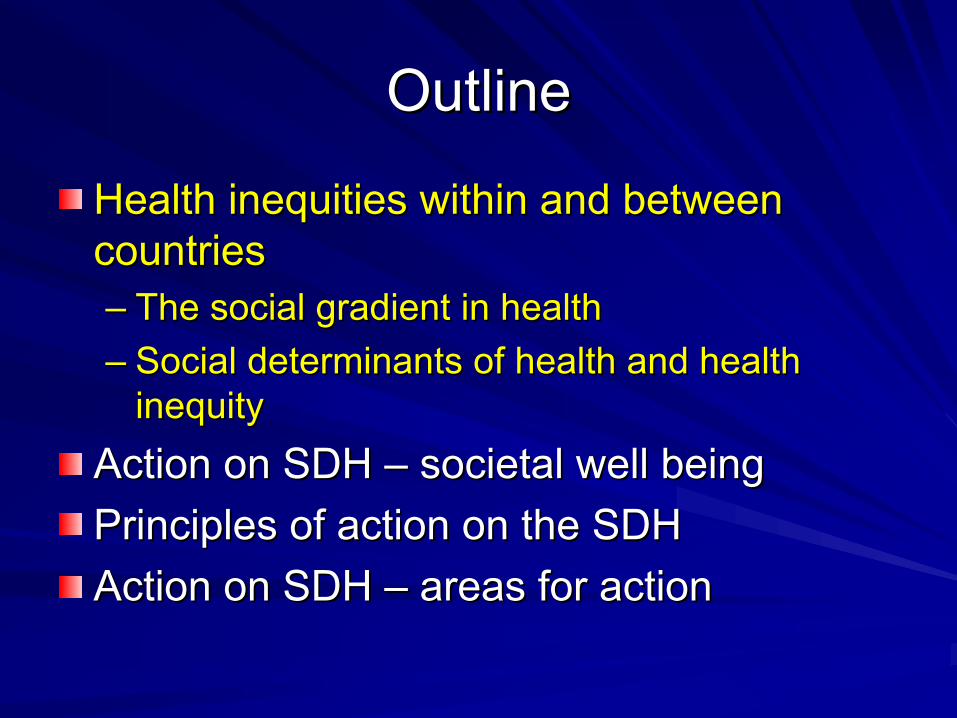
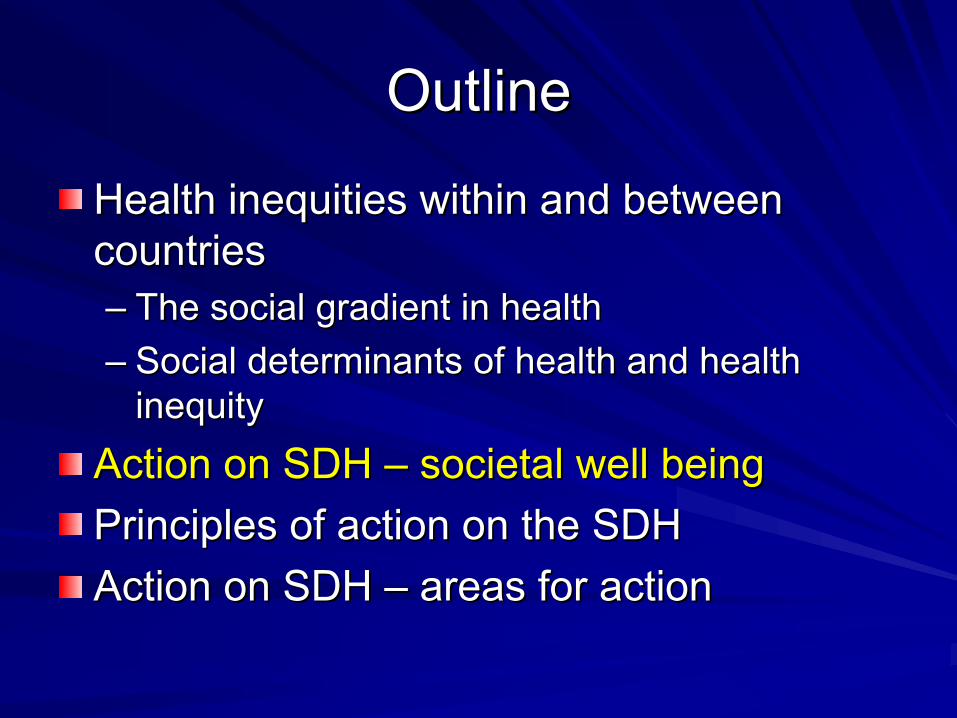
OutlineOutline
Health inequities within and between Health inequities within and between countriescountries–– The social gradient in healthThe social gradient in health–– Social determinants of health and health Social determinants of health and health
inequityinequityAction on SDH Action on SDH –– societal well beingsocietal well beingPrinciples of action on the SDHPrinciples of action on the SDHAction on SDH Action on SDH –– areas for actionareas for action
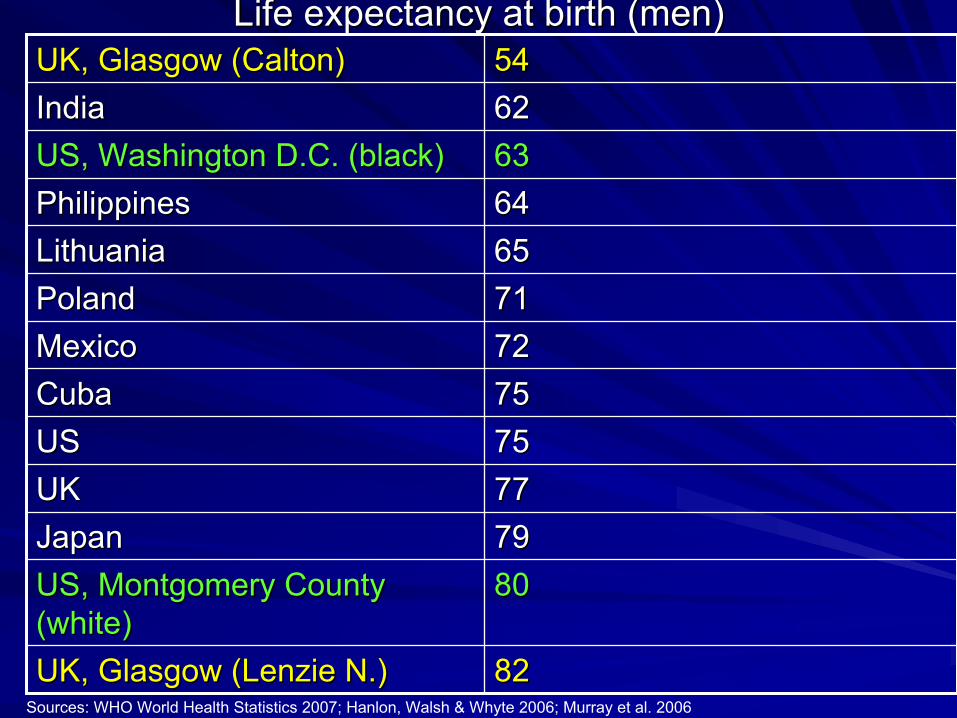
Life expectancy at birth (men)Life expectancy at birth (men)
7979JapanJapan8080US, Montgomery County US, Montgomery County
(white)(white)
6363US, Washington D.C. (black)US, Washington D.C. (black)
8282UK, Glasgow (UK, Glasgow (LenzieLenzie N.)N.)
7777UKUK7575USUS7575CubaCuba7272MexicoMexico7171PolandPoland6565LithuaniaLithuania6464PhilippinesPhilippines
6262IndiaIndia5454UK, Glasgow (UK, Glasgow (CaltonCalton))
Sources: WHO World Health Statistics 2007; Hanlon, Walsh & Whyte 2006; Murray et al. 2006
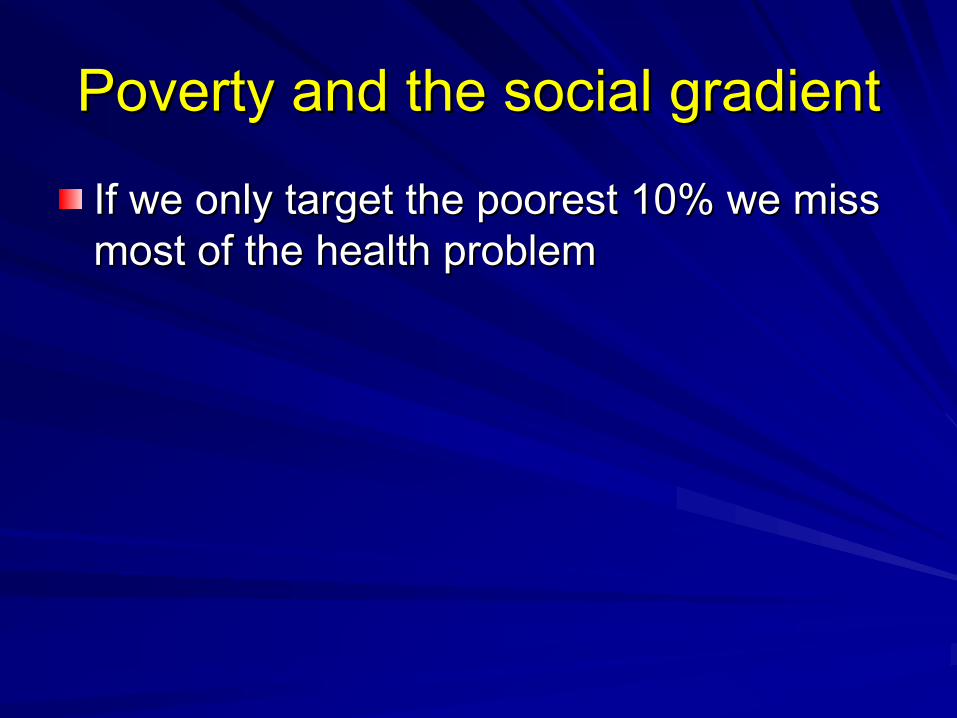
Poverty and the social gradientPoverty and the social gradient
If we only target the poorest 10% we miss If we only target the poorest 10% we miss most of the health problemmost of the health problem

Deaths rates (age standardized) for all causes of death by Deaths rates (age standardized) for all causes of death by deprivation twentieth, ages 15deprivation twentieth, ages 15--64, 199964, 1999--2003, England and Wales2003, England and Wales
males
females
The dashed lines are average mortality rates for men and women inEngland and Wales
women
men
Romeri et al 2006

0
50
100
150
200
Uganda2000/01
India 1998/99
Turkmenistan2000
Peru 2000 Morocco2003/04
Poorest Less poor Middle Less rich Richest
Under 5 mortality per 1000 live births by Under 5 mortality per 1000 live births by wealth quintilewealth quintile
Gwatkin et al, DHS data

PanPan--Canadian selfCanadian self--reported health: percentages reported health: percentages by socioby socio--economic status groupeconomic status group
01020304050607080
Alcoholbinging
Smoking Overwt orobese
Physicalinactivity
Self ratedHealth
High SES Average SES Low SES% of respondents
Source: Canadian Institute for Health Information, Reducing Gaps in Health: A Focus on Socio-EconomicStatus in Urban Canada, 2008

Is change possible?Is change possible?
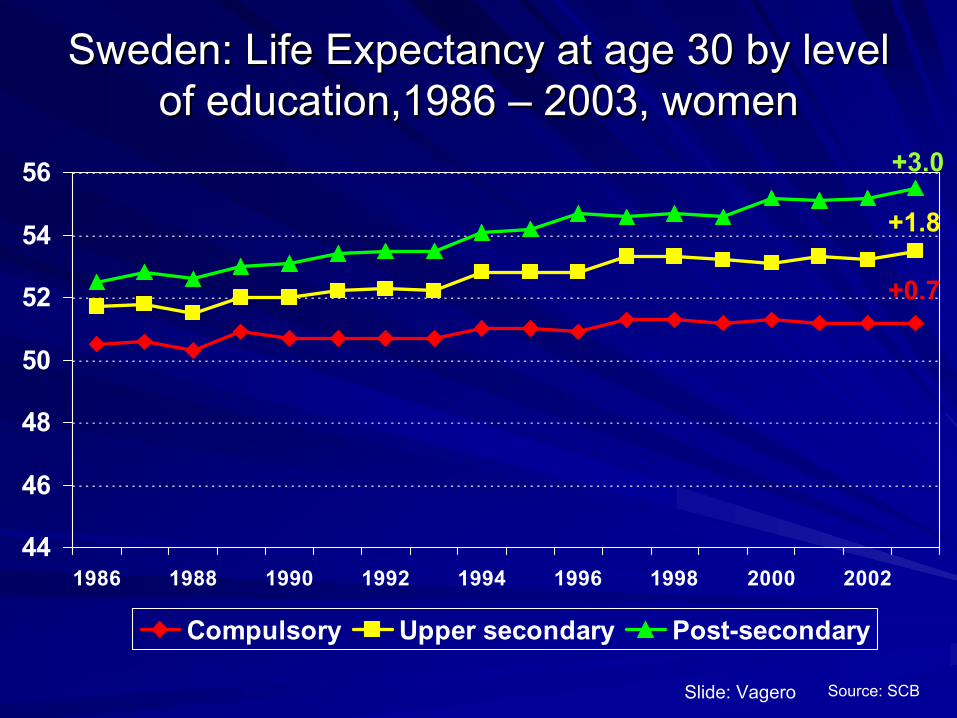
Sweden: Life Expectancy at age 30 by level Sweden: Life Expectancy at age 30 by level of education,1986 of education,1986 –– 2003, women2003, women
44
46
48
50
52
54
56
1986 1988 1990 1992 1994 1996 1998 2000 2002
Compulsory Upper secondary Post-secondary
Source: SCB
+3.0
+1.8
+0.7
Slide: Vagero

The widening trend in mortality by education in The widening trend in mortality by education in Russia, 1989Russia, 1989--20012001
0.4
0.45
0.5
0.55
0.6
0.65
0.7
1989
1990
1991
1992
1993
1994
1995
1996
1997
1998
1999
2000
2001
Calendar year
45 p
20
elementary university
45 p20 = probability of living to 65 yrs when aged 20 yrs
Source: Murphy et al, AJPH, 96, 1293-9, 2006
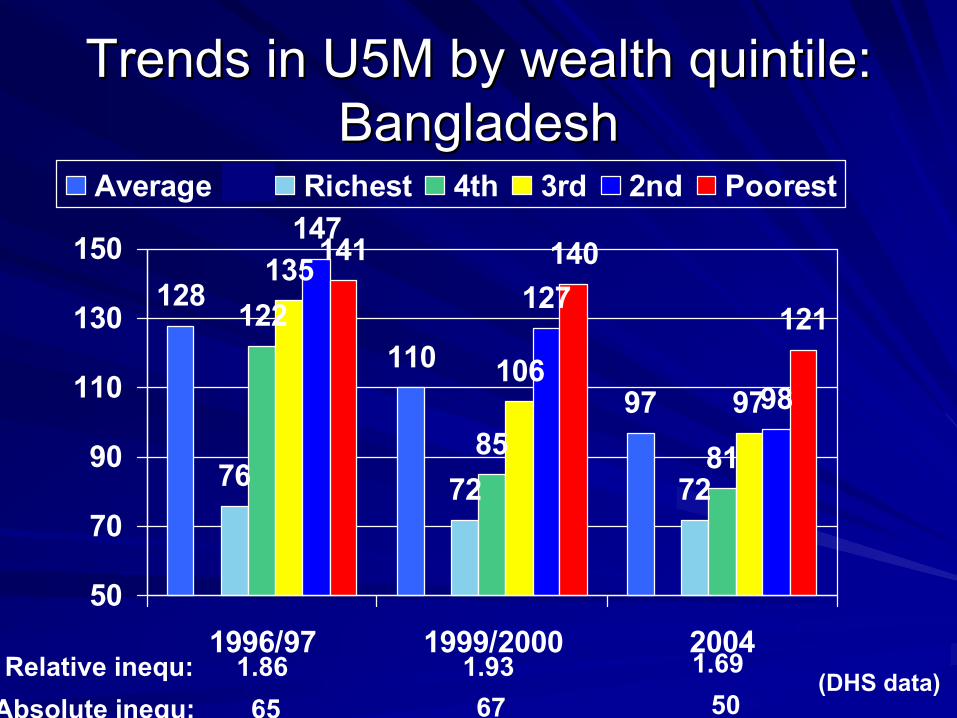
Trends in U5M by wealth quintile: Trends in U5M by wealth quintile: BangladeshBangladesh
128
11097
76 72 72
122
85 81
135
10697
147
127
98
141 140
121
50
70
90
110
130
150
1996/97 1999/2000 2004
Average Richest 4th 3rd 2nd Poorest
Relative inequ: 1.86 1.93 1.69Absolute inequ: 65 67 50
(DHS data)
OutlineOutline
Health inequities within and between Health inequities within and between countries countries –– The social gradient in healthThe social gradient in health–– Social determinants of health and health Social determinants of health and health
inequityinequityAction on SDH Action on SDH –– societal well beingsocietal well beingPrinciples of action on the SDHPrinciples of action on the SDHAction on SDH Action on SDH –– areas for actionareas for action
Inequalities in health that are avoidable Inequalities in health that are avoidable are inequitableare inequitableTackling health inequities is a matter of Tackling health inequities is a matter of social justicesocial justice
Population health and health equity is a Population health and health equity is a performance measure of economic and performance measure of economic and social development social development Fairer distribution of health increased Fairer distribution of health increased societal wellsocietal well--beingbeing

OutlineOutline
Health inequities within and between Health inequities within and between countries countries –– The social gradient in healthThe social gradient in health–– Social determinants of health and health Social determinants of health and health
inequityinequityAction on SDH Action on SDH –– societal well beingsocietal well beingPrinciples of action on the SDHPrinciples of action on the SDHAction on SDH Action on SDH –– areas for actionareas for action
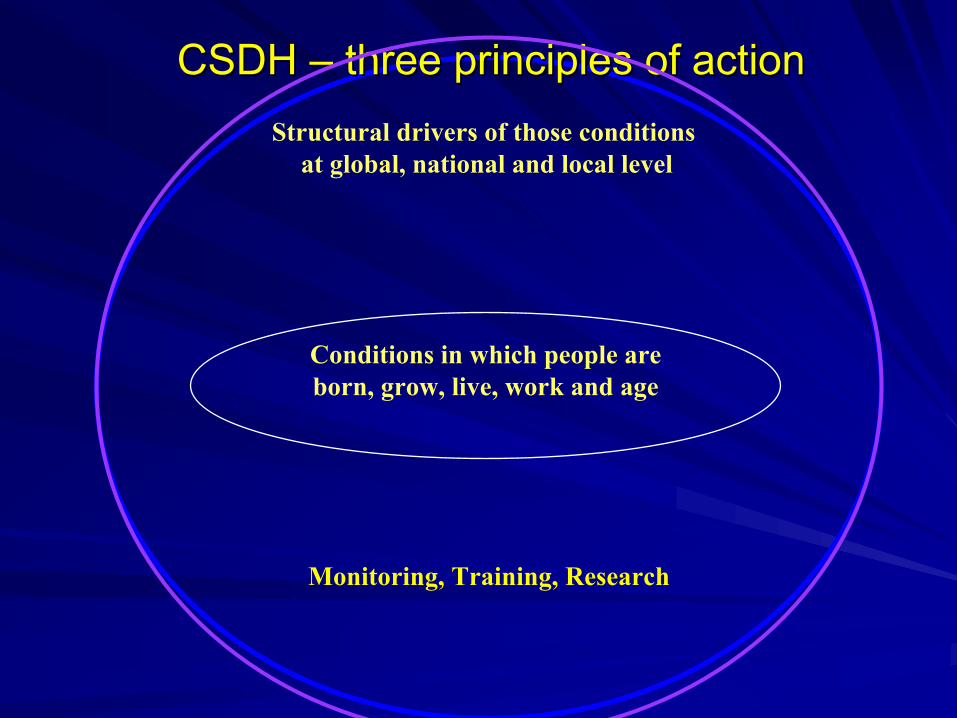
Conditions in which people are born, grow, live, work and age
Structural drivers of those conditions at global, national and local level
CSDH CSDH –– three principles of actionthree principles of action
Monitoring, Training, Research
OutlineOutline
Health inequities within and between Health inequities within and between countries countries Action on SDH Action on SDH –– societal well beingsocietal well beingPrinciples of action on the SDHPrinciples of action on the SDHAction on SDH Action on SDH –– areas for actionareas for action

Conditions in which people are born, grow, live, work and age
Structural drivers of those conditions at global, national and local level
CSDH CSDH –– three principles of actionthree principles of action
Monitoring, Training, Research

National monitoring systems National monitoring systems –– health health equity and the social determinants of equity and the social determinants of healthhealthGlobal health equity surveillance systemGlobal health equity surveillance system

Conditions in which people are born, grow, live, work and age
Structural drivers of those conditions at global, national and local level
CSDH CSDH –– three Linked Areas for Actionthree Linked Areas for Action
Monitoring, Training, Research
Early child development and education
Healthy Places Fair Employment Social Protection
Universal Health Care

Early child development and education
Healthy Places Fair Employment Social Protection
Universal Health Care
Health Equity in all Policies
Fair Financing Good GlobalGovernance
Market Responsibility
Gender Equity
Political empowerment – inclusion and voice
CSDH CSDH –– Areas for ActionAreas for Action

IntersectoralIntersectorallinkage for health linkage for health and health equityand health equity

Early child development and education
Healthy Places Fair Employment Social Protection
Universal Health Care
Health Equity in all Policies
Fair Financing Good GlobalGovernance
Market Responsibility
Gender Equity
Political empowerment – inclusion and voice
CSDH CSDH –– Areas for ActionAreas for Action

‘‘BrettonBretton Woods 2’ Woods 2’ –– international international response to current economic crisis response to current economic crisis
Imperative that the international community re-commits to a multilateral system in which all countries, rich and poor, engage with an equitable voice. Place fairness in health at the heart of the development agendaPlace equality of influence at the heart of decision-making
CSDH FR

Early child development and education
Healthy Places Fair Employment Social Protection
Universal Health Care
Health Equity in all Policies
Fair Financing Good GlobalGovernance
Market Responsibility
Gender Equity
Political empowerment – inclusion and voice
CSDH CSDH –– Areas for ActionAreas for Action

FAMILY POLICY GENEROSITY AND FAMILY POLICY GENEROSITY AND CHILD POVERTYCHILD POVERTY
SWENOR
SWINET
ITAIRE
GERFRA
FIN
CAN
BELAUT
AUS UK
USA
0
5
10
15
20
25
0 10 20 30 40 50 60 70 80 90 100
–– Countries with generous Countries with generous family policies have lower family policies have lower child poverty rateschild poverty rates
–– This association is mainly This association is mainly due to policies that support due to policies that support dual earner familiesdual earner families
–– The contribution may be The contribution may be direct through the amount direct through the amount of benefits paid, or indirect of benefits paid, or indirect by supporting two earners by supporting two earners and thereby raising the and thereby raising the market income of the market income of the household household
Pove
tyPo
vety
(%)
(%)
FamilyFamily Policy Policy GenerosityGenerosity (%)(%)
Lundberg et al 2007 CSDH NEWS group

Proportion relatively poor pre and Proportion relatively poor pre and post welfare state redistributionpost welfare state redistribution
05
1015202530354045
Finland
Norway
Sweden
BelgiumGerm
any
Netherlands
Italy
SpainCanada UK US
poverty rates post tax & transfers poverty reduction by income redistribution
71% 71% 72%
Source: Fritzell & Ritakallio 2004 using Luxembourg Income Study data,CSDH Nordic Network
62% 63% 59%
54%49%
44%50%
24%
Pove
rty
%

Recognising global roleRecognising global role
High income countries and global roleHigh income countries and global roleDebt and overseas development Debt and overseas development assistanceassistanceImplications of trade and trade Implications of trade and trade agreements for global health and health agreements for global health and health equityequity

Donors, multilateral agencies and Member States build and strengthen national capacity for progressive taxation

Taxation in East Asia (left) and subTaxation in East Asia (left) and sub--Saharan Saharan Africa (right), 1970Africa (right), 1970––79, 198079, 1980––89, and 199089, and 1990––9999
Cobham 2005
direct
sales
trade
East Asia sub Saharan Africa

Donor countries honour existing commitments by increasing aid to 0.7% of GDP; expand the Multilateral Debt Relief Initiative; and coordinate aid use through a social determinants of health framework
CSDH FR 2008

Early child development and education
Healthy Places Fair Employment Social Protection
Universal Health Care
Health Equity in all Policies
Fair Financing Good GlobalGovernance
Market Responsibility
Gender Equity
Political empowerment – inclusion and voice
CSDH CSDH –– Areas for ActionAreas for Action

0
20
40
60
80
100
120
140
Sui
cide
Rat
e pe
r 100
,000
0 1 2 3 4 5 6Total Number of Cultural Factors Present
Cultural Factors:Cultural Factors:SelfSelf--government government Land claim Land claim
participation participation
Community Control:Community Control:Health services Health services Education Education Cultural facilities Cultural facilities Police/fire services Police/fire services
Aboriginal Youth Suicide by Factors Aboriginal Youth Suicide by Factors PresentPresent
Chandler & Lalonde, 1998

Early child development and education
Healthy Places Fair Employment Social Protection
Universal Health Care
Health Equity in all Policies
Fair Financing Good GlobalGovernance
Market Responsibility
Gender Equity
Political empowerment – inclusion and voice
CSDH CSDH –– Areas for ActionAreas for Action

Early child development and educationEarly child development and education
Early life Early life –– survival and developmentsurvival and developmentPhysical, language/cognitive and Physical, language/cognitive and social/emotional developmentsocial/emotional development

Sure Start Local Programmes: EnglandSure Start Local Programmes: England
--0.90 0.90 (p value less than 0.001)(p value less than 0.001)Negative parentingNegative parenting
1.3 1.3 ((p value less than 0.001)((p value less than 0.001)Home learning environmentHome learning environment
ParentingParenting
0.32 0.32 (p value less than 0.001)(p value less than 0.001)IndependenceIndependence
0.45 0.45 (p value 0.01)(p value 0.01)Child positive social behaviourChild positive social behaviour
Child developmentChild development
Mean differenceMean difference
Effect of SSLP versus non SSLPEffect of SSLP versus non SSLP
(Melhuish et al 2008)

Gaps in average maths scores among 15 year Gaps in average maths scores among 15 year olds by father’s education: selected OECD olds by father’s education: selected OECD
countriescountries
-80-70-60-50-40-30-20-10
0Sweden US Canada unweighted
OECDaverage
Difference in maths score low to high educationDifference in maths score medium to high education
OECD 2008

Intergenerational mobility across Intergenerational mobility across the earnings distributionthe earnings distribution
0
0.1
0.2
0.3
0.4
0.5
Sweden UK US
Lowest income quintile 2nd quintile3rd quintile 4th quintileHighest income quintile
“Welfare dependency is transmitted across generations” OECD 2008
Probability for son of being in the same income quintile as the father

Early child development and education
Healthy Places Fair Employment Social Protection
Universal Health Care
Health Equity in all Policies
Fair Financing Good GlobalGovernance
Market Responsibility
Gender Equity
Political empowerment – inclusion and voice
CSDH CSDH –– Areas for ActionAreas for Action

Rates of mortality from transportation injury in nine Rates of mortality from transportation injury in nine European countries, by level of education, 1990sEuropean countries, by level of education, 1990s
Figure from Mackenbach 2006

Impact of heat wave in Europe Impact of heat wave in Europe (2003)(2003)
150150BelgiumBelgium13001300PortugalPortugal14001400NetherlandsNetherlands20452045UKUK40004000ItalyItaly42004200SpainSpain70007000GermanyGermany1408214082FranceFranceExcess Deaths*Excess Deaths*CountryCountry
*number of deaths over and above what would normally be expected for the monthof August., source: INSERM 2005 in Environment Alert Bulletin, UNEP

ElderlyElderlyLoss of autonomyLoss of autonomySocial isolationSocial isolationLiving directly below roof of a buildingLiving directly below roof of a buildingLiving in cities Living in cities --‘heat island’ effect ‘heat island’ effect
(Brucker, 2005)

Slum upgrading in IndiaSlum upgrading in India
Slum upgrading in Ahmadabad, India, cost only Slum upgrading in Ahmadabad, India, cost only US$ 500/household. US$ 500/household. community contributions of US$ 50/household.community contributions of US$ 50/household.Following the investment in these slums, there Following the investment in these slums, there was improvement in healthwas improvement in health–– decline in waterborne diseases, decline in waterborne diseases, –– children started going to school, children started going to school, –– women were able to take paid work, no longer having women were able to take paid work, no longer having
to stand in long lines to collect water.to stand in long lines to collect water.

Fast food consumption (1995 and Fast food consumption (1995 and 1999) in selected countries1999) in selected countries
0
50
100
150
200
250
300
350
400
450
Russ
iaPo
land
Hung
aryCz
ech R
epub
licSo
uth Af
rica
Mexico
Chile
Braz
ilAr
genti
naVe
nezu
elaTh
ailan
dMala
ysia
Philip
pines
China India
Mill
ion
tran
sa
1995
1999
Source: Eurobarometer data in Hawkes 2002

Fast food chains more common in Fast food chains more common in deprived areas: England and Scotlanddeprived areas: England and Scotland
012345678
5 (mostdeprived
4 3 2 1 (leastdeprived)
Mean number of fast food outlets* per 100000people
Index of multiple deprivation quintile
Macdonald et al 2007(*McDonald’s, Burger King, KFC and Pizza Hut)

Early child development and education
Healthy Places Fair Employment
Social Protection Universal Health Care
Health Equity in all Policies
Fair Financing Good GlobalGovernance
Market Responsibility
Gender Equity
Political empowerment – inclusion and voice
CSDH CSDH –– Areas for ActionAreas for Action

FAIR EMPLOYMENTFAIR EMPLOYMENTFreedom from coercionFreedom from coercion
Job securityJob security
Fair incomeFair income
Job protection and social benefitsJob protection and social benefits
Respect and dignity at workRespect and dignity at work
Workplace participationWorkplace participation
Enrichment and lack of alienationEnrichment and lack of alienation
CSDH EMCONET 2007

Prevalence of poor mental health in manual Prevalence of poor mental health in manual workers by type of contract: Spainworkers by type of contract: Spain
0
5
10
15
20
25
30
35
Permanent
Fixed termtemporaryNon-fixed termtemporaryNo contract
Source: Artazcoz et al 2005
%

The The IsoIso--strain concept of stress at workstrain concept of stress at work
Socially isolated Socially isolated –– (no supportive co(no supportive co--workers or supervisors)workers or supervisors)High strain High strain –– (High demands and low control)(High demands and low control)

0
0.51
1.5
22.5
33.5
4
4.5
No report of iso strain 1 report 2 reports
under 4546-55
Hazard Ratios of incident CHD by Iso-Strain (phase 1 and 2 of Whitehall II); split by age group
Chandola et al. European Heart Journal (2008)
Coronary heart disease and work stress,Whitehall II study

PAR* for coronary heart disease (fatal CHD/non fatal MI/definite angina)
0
10
20
30
40
50
DCS
ERIJu
stice
CombinedFull a
djustmen
t
PAR%
Each domainCombinedFull adjustment
PAR for all combined *
30% 95% CI 10%-46%
adjusted for other predictors
29% 95% CI 9%-45%
odds ratios adjusted for age, sex, employment grade J Head et al,2007*Population attributable risk

Governments reduce insecurity among people in precarious work arrangements including informal work, temporary work, and part-time work through policy and legislation to ensure that wages are based on the real cost of living, social security, and support for parents
CSDH FR 2008

Early child development and education
Healthy Places Fair Employment
Social ProtectionUniversal Health Care
Health Equity in all Policies
Fair Financing Good GlobalGovernance
Market Responsibility
Gender Equity
Political empowerment – inclusion and voice
CSDH CSDH –– Areas for ActionAreas for Action

Building social protection for the elderlyBuilding social protection for the elderly–– materialmaterial–– psychosocialpsychosocial

Minimum income for healthy living Minimum income for healthy living –– Morris et al.Morris et al.–– DietDiet–– Physical activity/body and mindPhysical activity/body and mind–– Psychosocial relations/social connections/activePsychosocial relations/social connections/active
mindsminds–– Getting aboutGetting about–– Medical careMedical care–– HygieneHygiene–– HousingHousing

Psychosocial relations/social connections/active mindsPsychosocial relations/social connections/active minds
TelephoneTelephoneStationery, stampsStationery, stampsGifts to Gifts to grandchildren/othersgrandchildren/othersCinema, sports, etcCinema, sports, etcMeeting friends, Meeting friends, entertainingentertaining
TV set and licenceTV set and licenceNewspapersNewspapersHolidays (UK)Holidays (UK)Miscellaneous, Miscellaneous, hobbies, gardening hobbies, gardening etcetc
Morris et al 2007

Weekly disposable incomes for Weekly disposable incomes for people over 65, England 2007people over 65, England 2007
State State pensionpension
Pension Pension credit credit guarantee*guarantee*
Minimum Minimum income for income for healthy healthy living **living **
Single Single personperson
£87.30£87.30 £119.05£119.05 £131.00£131.00
CoupleCouple £139.60£139.60 £181.70£181.70 £208.00£208.00
*Rent, mortgage and council tax may be paid after further means testing** people 65+ living independently in the community; excludes rent, mortgageand council taxMorris et al 2007 IJE

Early child development and education
Healthy Places Fair Employment Social Protection
Universal Health Care
Health Equity in all Policies
Fair Financing Good GlobalGovernance
Market Responsibility
Gender Equity
Political empowerment – inclusion and voice
CSDH CSDH –– Areas for ActionAreas for Action

Health sectorHealth sector
Access, availability, acceptability, qualityAccess, availability, acceptability, qualityExemplar of good practice Exemplar of good practice –– major major employeremployerStewardshipStewardshipHealth equity in all policiesHealth equity in all policies

Universal Primary Health Care Universal Primary Health Care Community basedCommunity basedDisease preventionDisease preventionHealth promotion Health promotion –– using social using social determinants frameworkdeterminants framework

3035404550556065707580
0 20 40 60 80 100Private as % of total health expenditure
Hea
lthy
life
expe
ctan
cy: y
ears
Health-adjusted life expectancy (HALE) and privatespending as a percentage of total health spending
(2000)
Koivusalo & Mackintosh (2005)

Catastrophic health expenditure and impoverishment due Catastrophic health expenditure and impoverishment due to outto out--ofof--pocket health expenditure, by WHO regionpocket health expenditure, by WHO region
Source: World Health Statistics, WHO, 2008
0 30 60 90
Number of people (millions)
Eastern Mediterranean
African
Europe
South-East Asia
Americas
Western pacific
People Impoverished
People suffering catastrophic health expenditure

Moving forwardMoving forwardGlobal Conference in London Nov 6/7 2008 to Global Conference in London Nov 6/7 2008 to promote uptake promote uptake –– announcement of review of announcement of review of health inequalities in Englandhealth inequalities in EnglandSri Lanka 2009, practical uptake in SE AsiaSri Lanka 2009, practical uptake in SE AsiaCountries translate findings into programmes, Countries translate findings into programmes, Brazil, Chile, UK, Canada, Argentina?, India?Brazil, Chile, UK, Canada, Argentina?, India?WHO resolutionWHO resolutionECOSOC Agenda ECOSOC Agenda -- ? Core Development Goal? Core Development GoalGlobal Report on Social Determinants and Global Report on Social Determinants and Health equity Health equity Capacity building Capacity building –– Research and TrainingResearch and Training

Global movementGlobal movement


“…And we will learn from other countries along the way…”
Gordon Brown, Prime Minister, UKGordon Brown, Prime Minister, UKat Closing the Gap Conference, 6th Nov 2008at Closing the Gap Conference, 6th Nov 2008
“I am pleased to announce that Sir Michael Marmothas agreed to undertake a new review of health
inequalities in England…”

Optimism?Optimism?

Under 5 mortality rate: change 1990 Under 5 mortality rate: change 1990 --20062006
6
27
27
29
83
46
160
10
53
55
55
123
79
187
0 50 100 150 200
Industrialized countries
CEE/CIS
Latin America & Caribbean
East Asia & Pacific
South Asia
Middle East & North Africa
Sub-Saharan Africa
Reduction 40%
Leastreduction
14%
UNICEF
Reduction 42%
Reduction 33%
Reduction 47%
Reduction 51%
Reduction 49%

www.who.int/social_determinants/en
A world where social
justice is taken
seriously
Closing the Gap in a Generation