“Closing The Achievement Gap for All Students” Pat Davenport & Dr. Gerald E. Anderson.
62
“ “ Closing The Achievement Closing The Achievement Gap for All Students” Gap for All Students” Pat Davenport & Dr. Gerald E. Anderson
-
Upload
clifton-hood -
Category
Documents
-
view
214 -
download
0
Transcript of “Closing The Achievement Gap for All Students” Pat Davenport & Dr. Gerald E. Anderson.

““Closing The Achievement Closing The Achievement
Gap for All Students”Gap for All Students”
Pat Davenport & Dr. Gerald E. Anderson

NO EXCUSES

Who’s To Blame?The college professor
said:
“Such rawness in a student is a shame, lack of preparation in high school is to blame.”

Who’s To Blame?Said the high school teacher:
“Good heavens! That boy’s a fool. The fault of course is with the middle school.”

Who’s To Blame?The middle school
teacher said:
“From stupidity may I be spared. They sent him in so unprepared.”

Who’s To Blame?The primary teacher huffed:
“Kindergarten blockheads all. They call that preparation – why, it’s worse than none at all.”

Who’s To Blame?The kindergarten
teacher said:
“Such lack of training never did I see. What kind of woman must that mother be.”
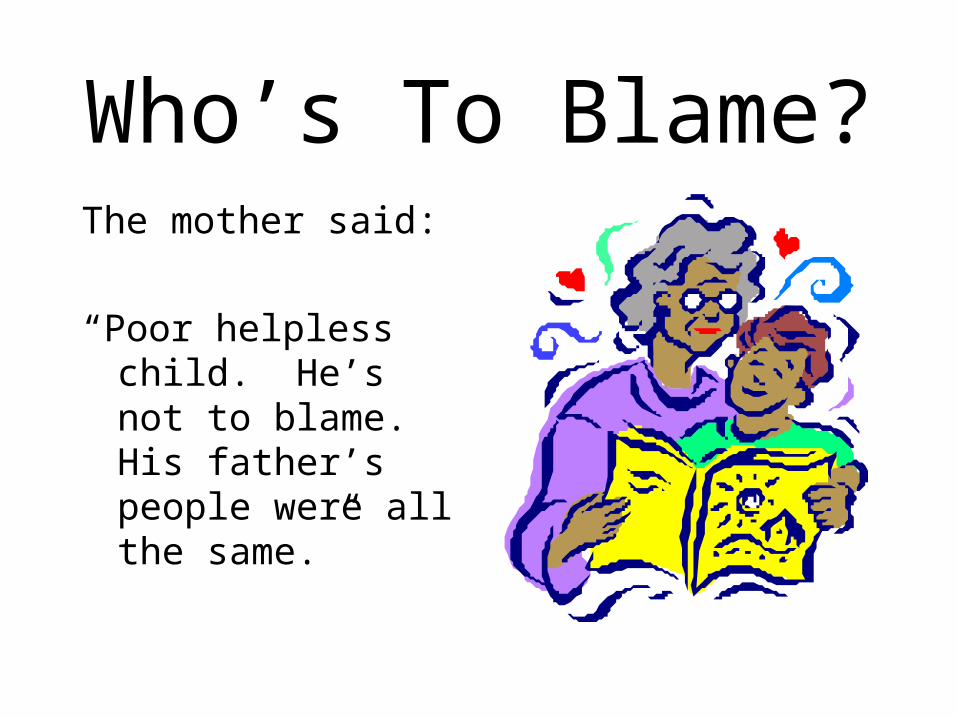
Who’s To Blame?The mother said:
“Poor helpless child. He’s not to blame. His father’s people were all the same.”

Who’s To Blame?Said the father at the end of the line:
“I doubt the rascal’s even mine.”
Anonymous

Building BlocksThe Improvement Process is grounded in an integrated system of:
Effective Schools
Total Quality Management
PDCA Instructional Process
Effective Schools
Total Quality Management
PDCA Instructional Process

A Quality and Effective School A Quality and Effective School District has...District has...
A Quality and Effective School A Quality and Effective School District has...District has...
A belief that they can teach all students
High expectations A Vision Leadership must focus the
organization on the Vision An aligned strategic planning process An Plan-Do-Check-Act Instructional
Process
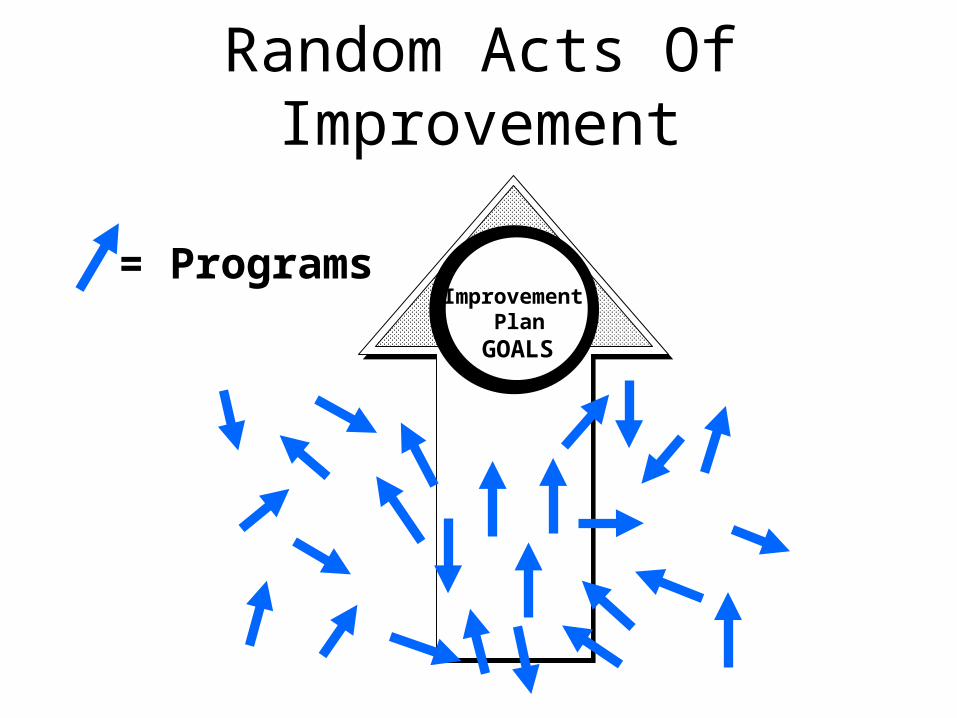
Random Acts Of Improvement
= Programs
GOALS
Improvement Plan
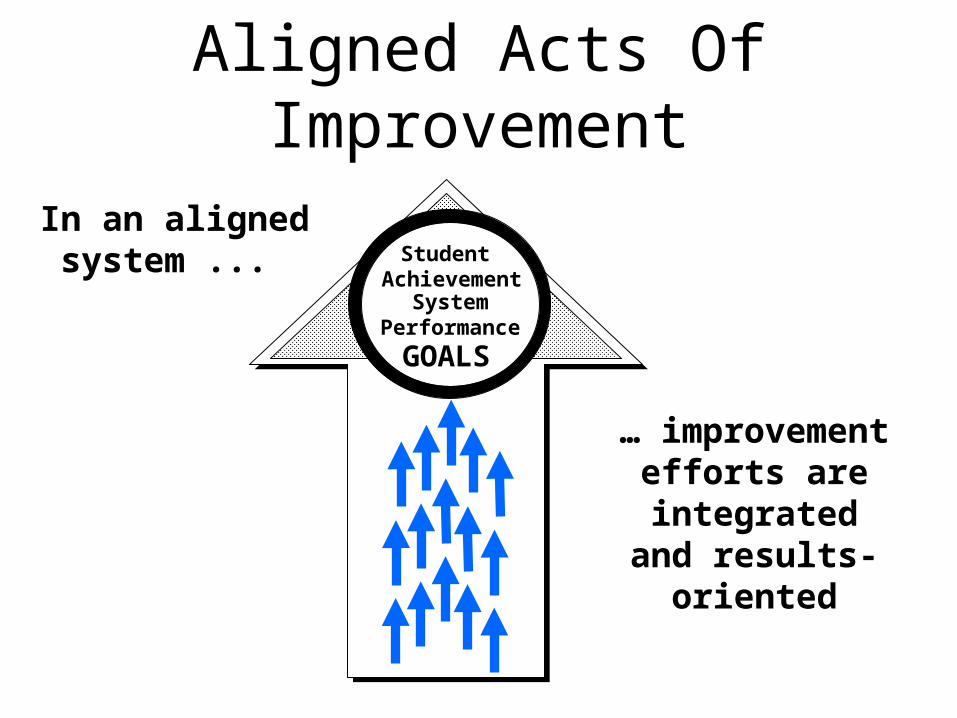
Aligned Acts Of Improvement
In an alignedsystem ... Student
AchievementSystem
Performance
GOALS
… improvementefforts are integratedand results-oriented

The Power of VisionVision without action is
merely a dream;
Action without vision
just passes the time;
Vision with action can
change the world.
- Joel Barker

• 3 out of 4 will go on welfare.
• 68% will commit a criminal offense.
If students are not literate, that is, they can not read,
write, and do basic arithmetic:
Source: National Adult Literacy Survey - 1993

Beliefs & Values Leadership must focus all members of
the organization on our vision

Common Principles of Effective Schools & TQM
• Proven Management Principles
• Advances Organizational Aims & Goals
• Data Driven
• Continuous Improvement
• Simple, not easy
• Commitment, time & resources
• Thinking “outside the Box”

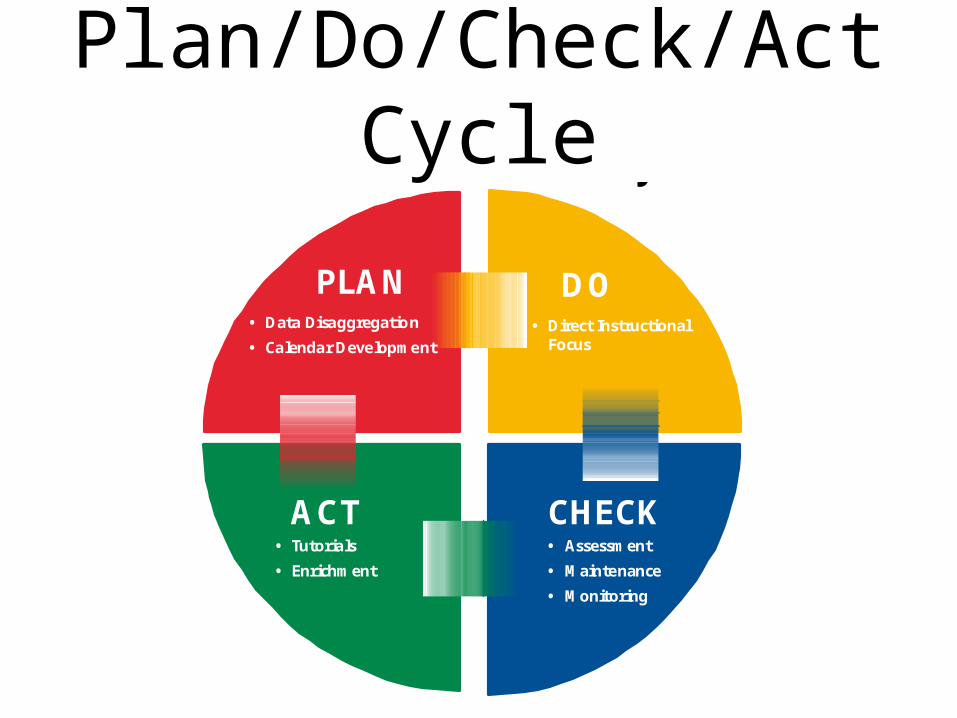
Plan/Do/Check/Act CyclePDCA Instructional Cycle
PLAN
ACT
DO
CHECK
• Data Disaggregation
• Calendar Development• Direct Instructional
Focus
• Tutorials
• Enrichment
• Assessment
• Maintenance
• Monitoring
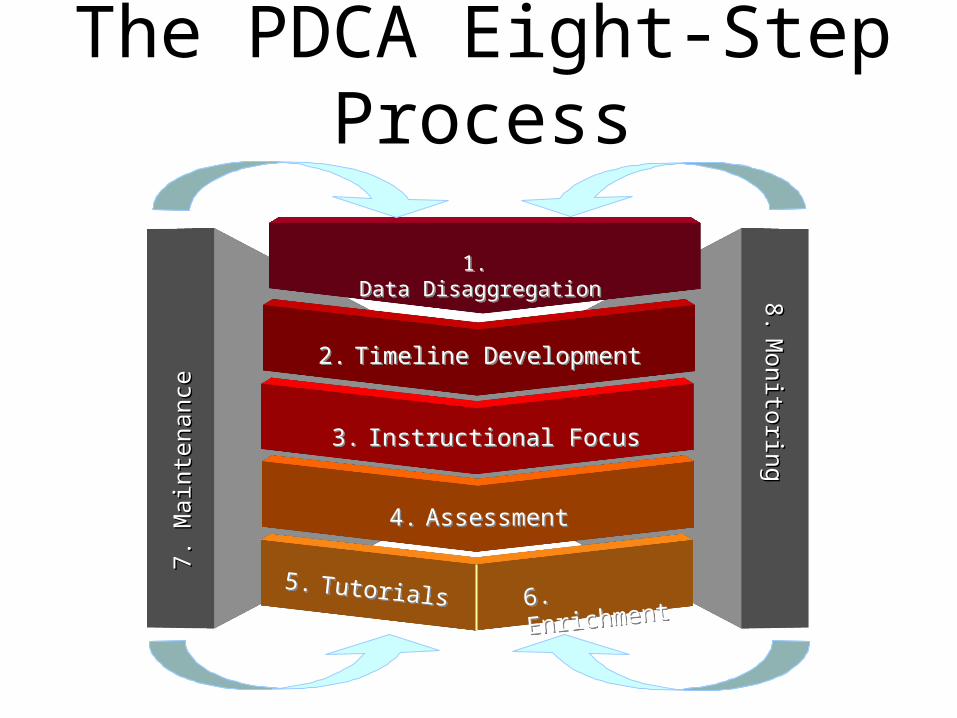
The PDCA Eight-StepProcess
8.8.M
onitoringM
onitoring7.7.
Mai
nten
ance
Mai
nten
ance
2. Timeline Development2. Timeline Development
4. Assessment4. Assessment
3. Instructional Focus3. Instructional Focus
5. Tutorials5. Tutorials 6. Enrichment6. Enrichment
1.Data Disaggregation
1.Data Disaggregation

READING 92-93 93-94 94-95 95-96 96-97 97-98 98-99 00-01
All Students 53.7% 79.3% 84.9% 80.2% 87.1% 97.7% 92.5% 94.6%
African American 50.0% 69.2% 70.8% 76.5% 86.4% 91.7% 100% 91.7%
Hispanic 50.0% 79.2% 87.1% 78.7% 83.8% 98.6% 89.8% 93.6%
White 58.8% 85.4% 87.1% 83.3% 92.7% 100% 95.9% 100%
Eco. Disadvantaged 53.1% 81.3% 87.1% 76.5% 87.1% 97.0% 91.0% 93.2%
DEMOGRAPHICS:
Economically Disadvantaged 86.9% African American 18.5% LEP 33.3% Hispanic 65.4%Mobility 17.8% White 15.8%
TAAS Velasco Elementary

MATH 92-93 93-94 94-95 95-96 96-97 97-98 98-99 00-01
All Students 37.0% 69.5% 83.8% 92.4% 96.2% 95.6% 94.6% 96.7%
African American 8.3% 50.0% 76.0% 82.4% 100% 87.5% 92.0% 91.7%
Hispanic 33.3% 76.4% 87.1% 91.5% 94.1% 98.7% 97.7% 97.3%
White 64.7% 69.0% 83.1% 97.6% 97.5% 94.6% 87.8% 100%
Eco. Disadvantaged 35.5% 72.2% 84.6% 90.1% 97.0% 95.1% 93.5% 96.6%
DEMOGRAPHICS:
Economically Disadvantaged 86.9% African American 18.5% LEP 33.3% Hispanic 65.4%Mobility 17.8% White 15.8%
TAAS Velasco Elementary

WRITING 92-93 93-94 94-95 95-96 96-97 97-98 98-99 00-01
All Students 68.5% 97.8% 90.0% 98.3% 98.5% 97.1% 97.2% 92.8%
African American 50.0% 100% 85.7% 90.9% 100% 91.7% 100% 92.9%
Hispanic 65.2% 96.2% 93.3% 100% 97.3% 97.4% 94.9% 92.3%
White 83.3% 100% 87.0% 100% 100% 100% 100% 94.1%
Eco. Disadvantaged 71.0% 96.0% 85.3% 97.4% 98.0% 96.6% 98.1% 91.4%
DEMOGRAPHICS:
Economically Disadvantaged 86.9% African American 18.5% LEP 33.3% Hispanic 65.4%Mobility 17.8% White 15.8%
TAAS Velasco Elementary

READING 92-93 93-94 94-95 95-96 96-97 97-98 98-99 00-01
All Students 62.7% 72.6% 69.9% 82.7% 90.8% 94.9% 94.4% 98.1%
African American 53.8% 65.6% 59.1% 80.8% 80.3% 94.3% 88.2% 95.6%
Hispanic 52.1% 64.6% 63.3% 75.6% 90.3% 93.5% 92.9% 97.7%
White 80.2% 82.1% 82.6% 92.4% 94.9% 96.7% 98.4% 99.4%
Eco. Disadvantaged 47.6% 64.0% 61.6% 75.8% 88.1% 92.1% 92.3% 97.4%
TAAS Freeport Intermediate
DEMOGRAPHICS:
Economically Disadvantaged 65.1% African American 12.6% LEP 4.4% Hispanic 48.5%Mobility 20.1% White 38.4%

MATH 92-93 93-94 94-95 95-96 96-97 97-98 98-99 00-01
All Students 36.6% 55.9% 55.0% 76.9% 92.0% 97.3% 96.2% 99.1%
African American 19.9% 40.6% 36.6% 67.9% 83.8% 96.2% 95.3% 95.7%
Hispanic 33.3% 44.9% 48.7% 69.3% 91.3% 96.3% 95.8% 99.5%
White 45.8% 70.8% 69.7% 90.1% 95.5% 98.9% 96.9% 99.4%
Eco. Disadvantaged 22.0% 49.0% 46.5% 66.1% 88.9% 96.2% 95.5% 98.9%
TAAS Freeport Intermediate
DEMOGRAPHICS:
Economically Disadvantaged 65.1% African American 12.6% LEP 4.4% Hispanic 48.5%Mobility 20.1% White 38.4%

WRITING 92-93 93-94 94-95 95-96 96-97 97-98 98-99 00-01
All Students 74.0% 71.6% 72.0% 79.1% 89.0% 91.9% 98.0% 96.9%
African American 62.1% 59.4% 75.0% 85.0% 76.7% 84.6% 96.0% 95.5%
Hispanic 67.5% 68.3% 69.1% 71.1% 85.4% 92.4% 97.5% 96.0%
White 80.2% 78.5% 74.3% 90.2% 96.7% 93.3% 99.0% 98.6%
Eco. Disadvantaged 67.3% 60.7% 68.1% 73.2% 83.3% 88.9% 96.7% 95.7%
TAAS Freeport Intermediate
DEMOGRAPHICS:
Economically Disadvantaged 65.1% African American 12.6% LEP 4.4% Hispanic 48.5%Mobility 20.1% White 38.4%

READING 92-93 93-94 94-95 95-96 96-97 97-98 98-99 00-01
All Students 76.8% 76.3% 74.4% 85.0% 89.0% 91.7% 88.5% 97.0%
African American 58.3% 41.2% 44.0% 75.0% 86.7% 82.4% 84.0% 88.0%
Hispanic 68.5% 71.4% 70.8% 83.1% 85.9% 91.4% 84.3% 98.1%
White 86.7% 82.3% 88.4% 89.9% 95.2% 94.0% 95.5% 98.9%
Eco. Disadvantaged 63.9% 61.8% 64.3% 80.0% 84.0% 89.5% 84.7% 94.8%
TAAS Brazosport High School
DEMOGRAPHICS:
Economically Disadvantaged 70.0% African American 14.0%LEP 2.7% Hispanic 47.0%Mobility 23.4% White 38.4%

MATH 92-93 93-94 94-95 95-96 96-97 97-98 98-99 00-01
All Students 65.5% 57.5% 53.5% 82.0% 85.8% 90.9% 94.0% 99.0%
African American 14.3% 29.4% 28.0% 75.0% 75.0% 82.4% 96.2% 96.0%
Hispanic 57.5% 50.0% 50.7% 74.7% 83.5% 91.6% 93.1% 99.0%
White 81.0% 71.8% 63.9% 91.3% 95.2% 91.7% 94.3% 100%
Eco. Disadvantaged 53.2% 45.5% 44.8% 81.7% 81.2% 87.4% 91.7% 99.1%
TAAS Brazosport High School
DEMOGRAPHICS:
Economically Disadvantaged 70.0% African American 14.0%LEP 2.7% Hispanic 47.0%Mobility 23.4% White 38.4%

WRITING 92-93 93-94 94-95 95-96 96-97 97-98 98-99 00-01
All Students 83.6% 79.9% 85.4% 86.6% 89.2% 93.2% 88.7% 93.6%
African American 64.7% 47.1% 62.5% 75.0% 87.1% 88.2% 84.6% 84.6%
Hispanic 78.4% 79.3% 86.5% 80.3% 87.1% 92.4% 87.7% 96.2%
White 91.9% 87.5% 91.5% 96.2% 93.5% 95.3% 92.0% 92.9%
Eco. Disadvantaged 73.4% 76.6% 78.9% 81.4% 86.0% 91.5% 84.4% 90.0%
TAAS Brazosport High School
DEMOGRAPHICS:
Economically Disadvantaged 70.0% African American 14.0%LEP 2.7% Hispanic 47.0%Mobility 23.4% White 38.4%

Economically DisadvantagedEconomically Disadvantaged Least to Greatest - Elementary Least to Greatest - Elementary
BEUTEL 14.0 100 100
BRANNEN 23.2 100 100
ROBERTS 27.1 96.6 98.0
NEY 31.0 95.6 97.4
POLK 47.0 97.7 97.8
AUSTIN 53.6 97.3 96.2
GRIFFITH 66.5 91.8 93.5
OGG 71.2 98.7 98.1
JANE LONG 75.8 94.3 94.3
FLEMING 84.2 90.1 90.5
VELASCO 86.9 93.2 94.6
E.D. % All Students % % E.D.
PASSING PASSING
READING
Economically DisadvantagedEconomically Disadvantaged Least to Greatest - Least to Greatest -
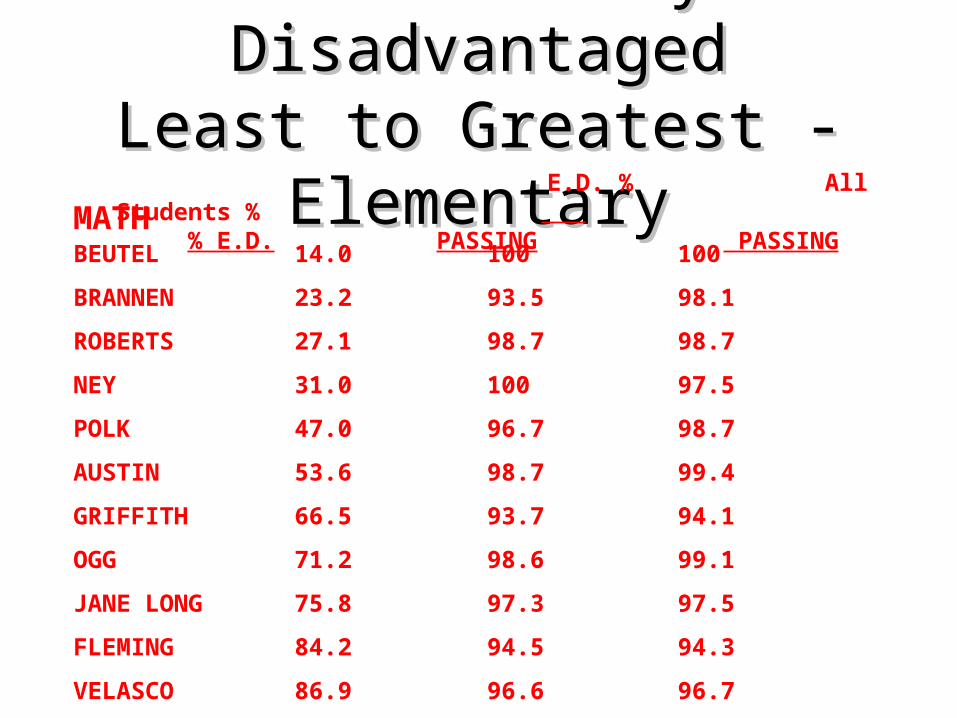
ElementaryElementaryBEUTEL 14.0 100 100
BRANNEN 23.2 93.5 98.1
ROBERTS 27.1 98.7 98.7
NEY 31.0 100 97.5
POLK 47.0 96.7 98.7
AUSTIN 53.6 98.7 99.4
GRIFFITH 66.5 93.7 94.1
OGG 71.2 98.6 99.1
JANE LONG 75.8 97.3 97.5
FLEMING 84.2 94.5 94.3
VELASCO 86.9 96.6 96.7
MATH E.D. % All Students % % E.D.
PASSING PASSING

Economically DisadvantagedEconomically Disadvantaged Least to Greatest - Least to Greatest -
ElementaryElementaryBEUTEL 14.0 85.7 97.7
BRANNEN 23.2 100 100
ROBERTS 27.1 100 98.7
NEY 31.0 87.0 92.7
POLK 47.0 100 100
AUSTIN 53.6 95.7 95.6
GRIFFITH 66.5 90.5 91.3
OGG 71.2 100 100
JANE LONG 75.8 91.5 91.4
FLEMING 84.2 97.1 97.4
VELASCO 86.9 91.4 92.8
WRITING E.D. % All Students % % E.D.
PASSING PASSING

Economically DisadvantagedEconomically DisadvantagedLeast to Greatest - Least to Greatest -
IntermediateIntermediate
LAKE JACKSON 16.3 91.4 97.8
CLUTE 43.4 92.6 93.6
FREEPORT 65.1 97.4 98.1
MATH
LAKE JACKSON 16.3 98.3 98.6
CLUTE 43.4 99.6 99.0
FREEPORT 65.1 98.9 99.1
WRITING
LAKE JACKSON 16.3 94.4 96.9
CLUTE 43.4 87.8 92.9
FREEPORT 65.1 95.7 96.9
READING E.D. % All Students % % E.D.
PASSING PASSING

Economically DisadvantagedEconomically DisadvantagedLeast to Greatest - High Least to Greatest - High
SchoolSchool
BRAZOSWOOD 14.4 94.7 98.3
BRAZOSPORT 70.1 94.6 97.1
MATH
BRAZOSWOOD 14.4 93.8 98.3
BRAZOSPORT 70.1 99.1 99.1
WRITING
BRAZOSWOOD 14.4 91.0 96.9
BRAZOSPORT 70.1 90.0 93.7
READING E.D. % All Students % % E.D.
PASSING PASSING
District 10-Year District 10-Year ComparisonsComparisons
Percentage of BISD Students Percentage of BISD Students Passing Academic Excellence Passing Academic Excellence Indicator System Assessment Indicator System Assessment
Summed Across Grades 3-8 & 10Summed Across Grades 3-8 & 10

50
60
70
80
90
100
1991-92
1992-93
1993-94
1994-95
1995-96
1996-97
1997-98
1998-99
1999-00
2000-01
All Students A. American Hispanic White Eco. Dis.
AEIS READING AEIS READING COMPARISONCOMPARISONAEIS READING AEIS READING COMPARISONCOMPARISON
82
98
70
97
64
9294
57
94
60

50
60
70
80
90
100
1991-92
1992-93
1993-94
1994-95
1995-96
1996-97
1997-98
1998-99
1999-00
2000-01
All Students A. American Hispanic White Eco. Dis.
AEIS MATH COMPARISONAEIS MATH COMPARISONAEIS MATH COMPARISONAEIS MATH COMPARISON
79
70
585554
98
96
9797
92

50
60
70
80
90
100
1991-92
1992-93
1993-94
1994-95
1995-96
1996-97
1997-98
1998-99
1999-00
2000-01
All Students A. American Hispanic White Eco. Dis.
AEIS WRITING AEIS WRITING COMPARISONCOMPARISONAEIS WRITING AEIS WRITING COMPARISONCOMPARISON
80
70
605957
9798
95
9394
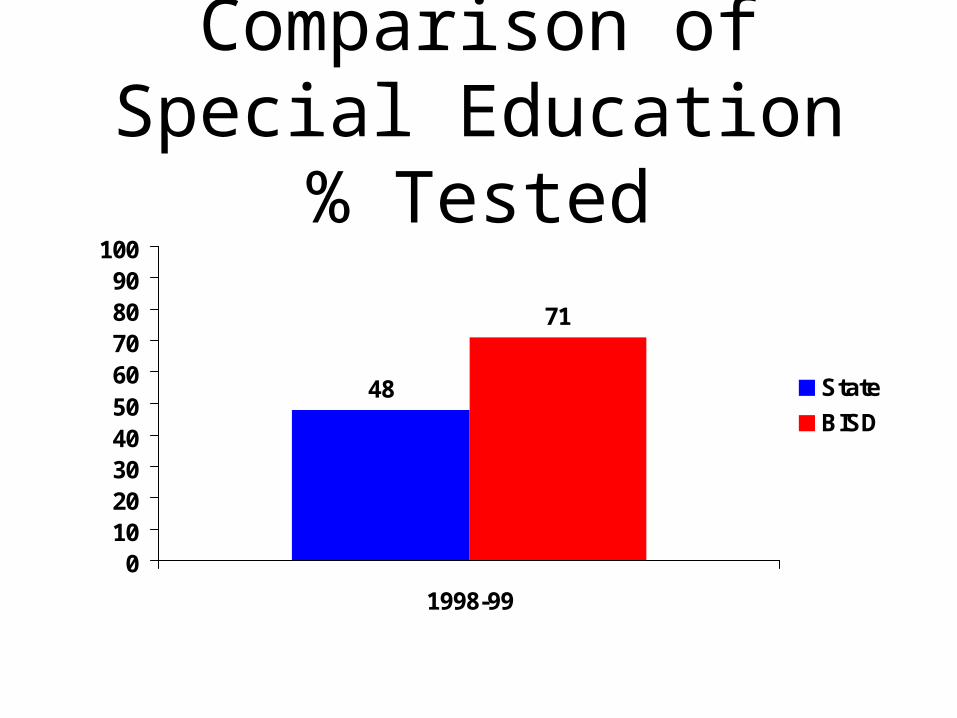
Comparison of Special Education % Tested
48
71
0102030405060708090
100
1998-99
State
BISD

TAAS Special EducationStudents % Passing
67.2
77.4
69.7
78.1
93.2 92.095.9
75.8 77.8
0.010.020.030.040.050.060.070.080.090.0
100.0
Reading Writing Math
State
Region IV
BISD
Grades 3-8 & 10

Percent of Average Daily Attendance
95.395.1
96.2
90.0
95.0
100.0
1999-20
State
Region IV
BISD
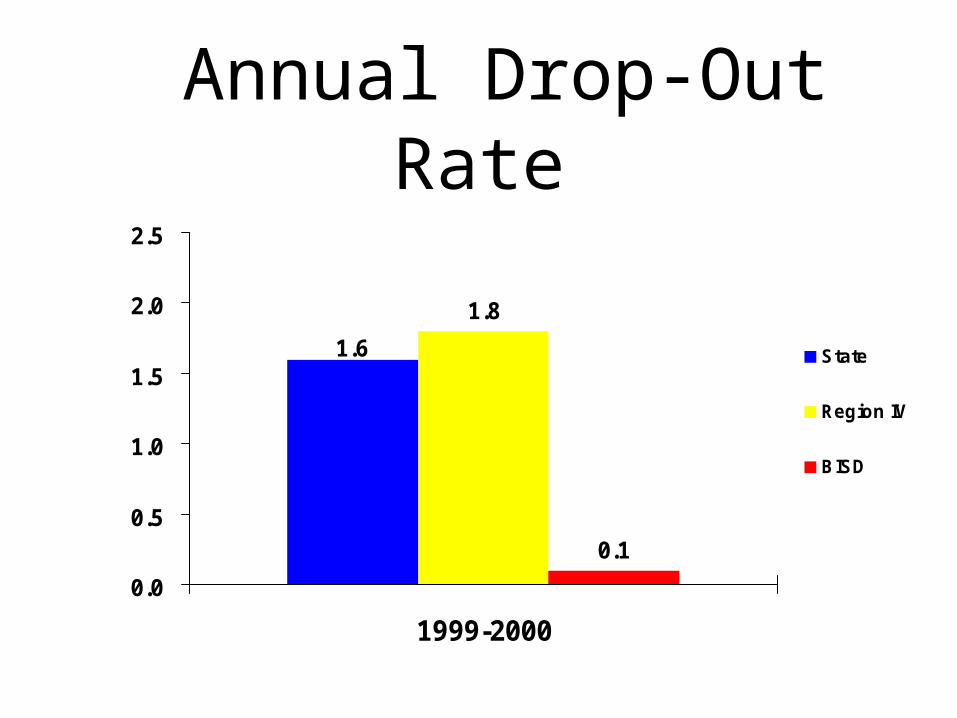
Annual Drop-Out Rate
1.8
0.1
1.6
0.0
0.5
1.0
1.5
2.0
2.5
1999-2000
State
Region IV
BISD
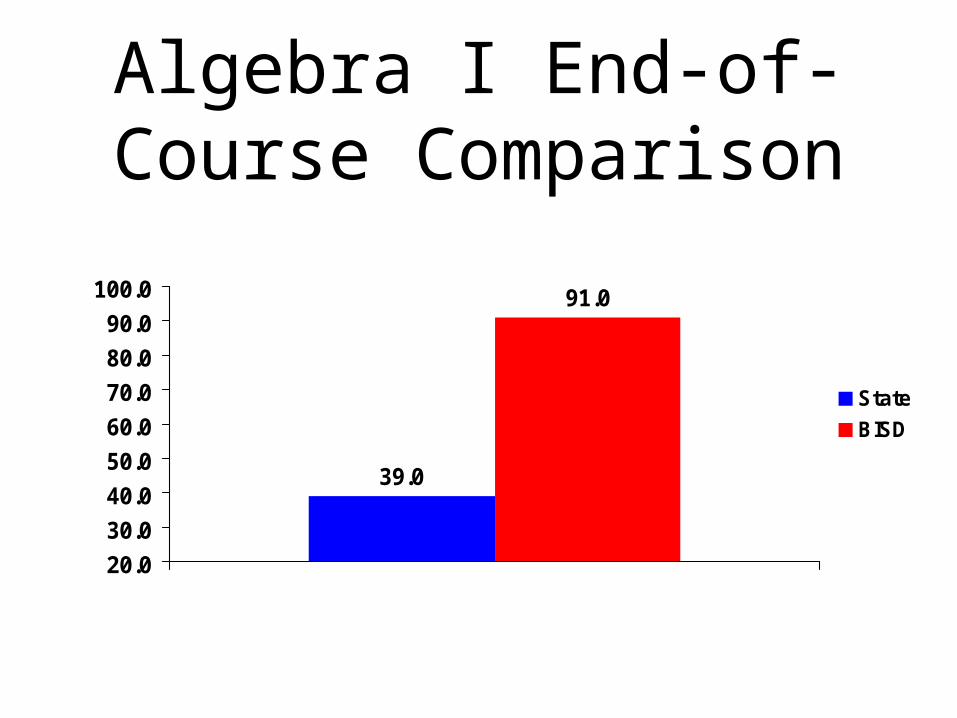
Algebra I End-of-Course Comparison
39.0
91.0
20.0
30.0
40.0
50.0
60.0
70.0
80.0
90.0
100.0
State
BISD

Biology I End-of-Course Comparison
80.0
93.0
20.0
30.0
40.0
50.0
60.0
70.0
80.0
90.0
100.0
State
BISD
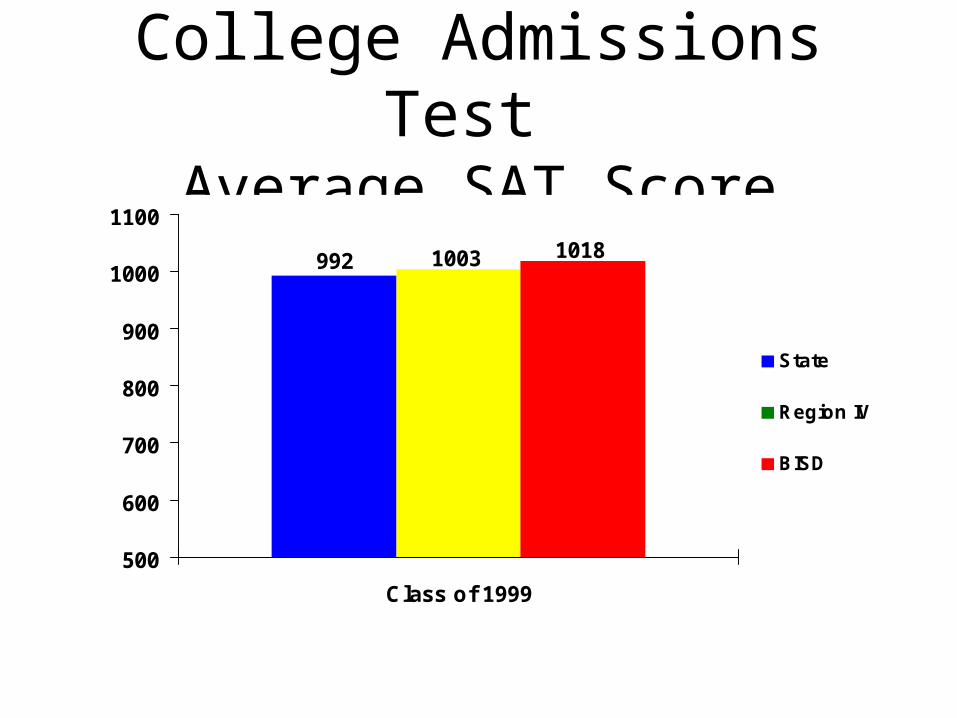
College Admissions Test Average SAT Score
992 1003 1018
500
600
700
800
900
1000
1100
Class of 1999
State
Region IV
BISD

College Admissions Test Average ACT Score
20.3 20.8 21.7
0.0
5.0
10.0
15.0
20.0
25.0
Class of 1999
State
Region IV
BISD
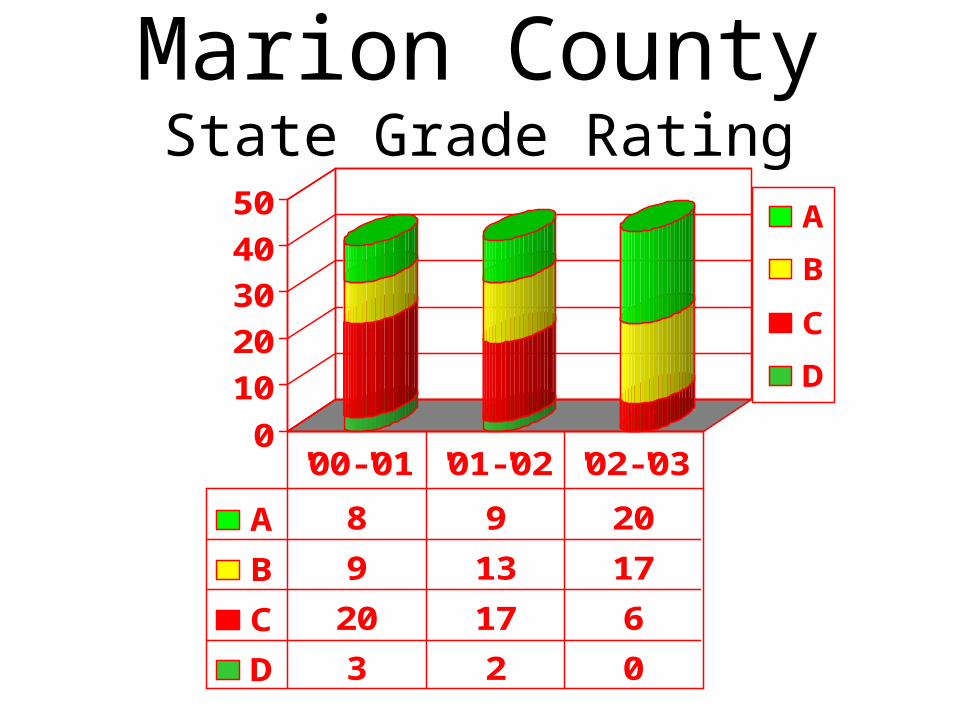
Marion CountyState Grade Rating
0
10
20
30
40
50A
B
C
D
A 8 9 20
B 9 13 17
C 20 17 6
D 3 2 0
'00-'01 '01-'02 '02-'03

Marion CountyState Grade Rating
0
10
20
30
40
50A
B
C
D
A 8 9 20
B 9 13 17
C 20 17 6
D 3 2 0
'00-'01 '01-'02 '02-'03

Martin County, FLState Rating Breakdown
0
5
10
15
20
A's 10 12
B's 4 5
C's 2 0
D's 1 0
2002 2003

Focus on Achievement
Three Focus on Achievement Schools
19
106
16
42
16
44
0
20
40
60
80
100
120
Randall Pepper Alder Fontana H
Academic Performance Index Growth
API Target Growth
API Actual Growth

0
10
20
30
40
50
60
70
JeffersonElementary
LincolnElementary
WashingtonElementary
Growth Target
Actual Growth
Lindsay Unified School District2001-2002
Academic Performance Index Growth

Lindsay Unified School District 2001-2002
Socioeconomically Disadvantaged
0
10
20
30
40
50
60
Lincoln Elementary Washington Elementary
Growth Target
Actual Growth

Center Unified School District (Sacramento, CA)
0
10
20
30
40
50
60
70
SpinelliElem.
Center High
API Target Growth
API Actual Growth

Puesta del Sol Elementary CTBS Scores 2000-01 4th Grade
Rio Rancho Public Schools, NM
0
10
20
30
40
50
60
70
80
90
100
Reading Total Language Total Math Total Science Social Studies
Me
dia
n P
erc
en
tile
Sco
res
1998-99
1999-00
2000-01
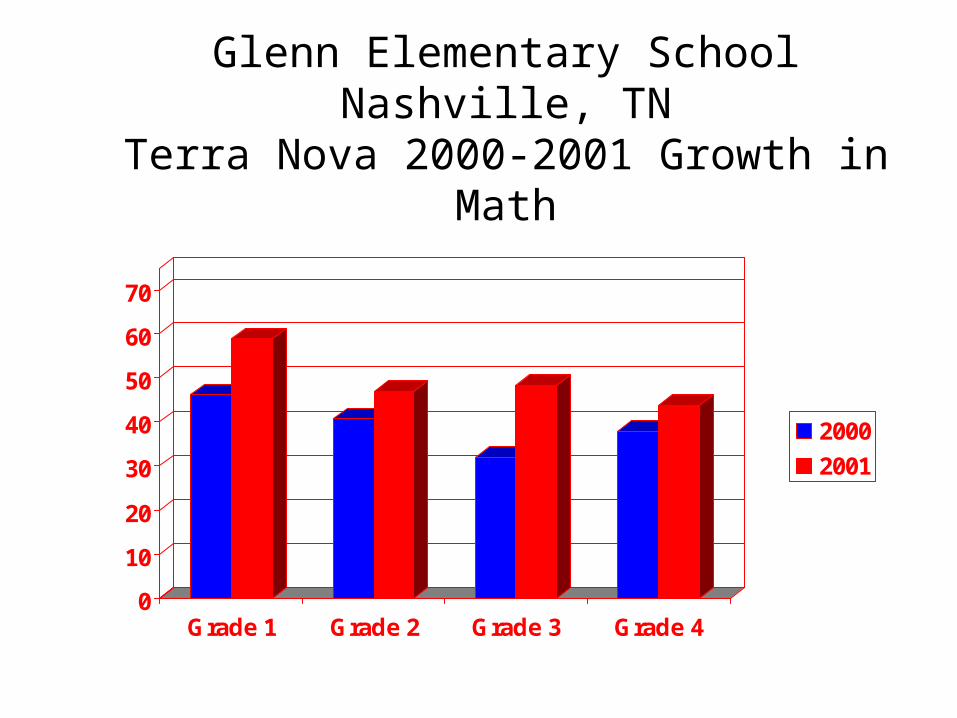
Glenn Elementary SchoolNashville, TN
Terra Nova 2000-2001 Growth in Math
0
10
20
30
40
50
60
70
Grade 1 Grade 2 Grade 3 Grade 4
2000
2001

College Park Elementary SchoolFulton County, GA
CRCT 2000-2001 Fourth Grade Growth
0
10
20
30
40
50
60
70
Reading Writing Math
20002001
100 % Economically Disadvantaged

Camp Creek Middle SchoolFulton County, GA
CRCT 2000-2001 Eighth Grade Growth
0
10
20
30
40
50
60
70
Reading Writing Math
20002001
66 % Economically Disadvantaged

Wood Elementary School, AZ Mean Percentile Ranks for Total Math on
the Stanford Achievement Test
20%
30%
40%
50%
60%
70%
Grade 2 Grade 3 Grade 4 Grade 5
1997
1998
1999
2000
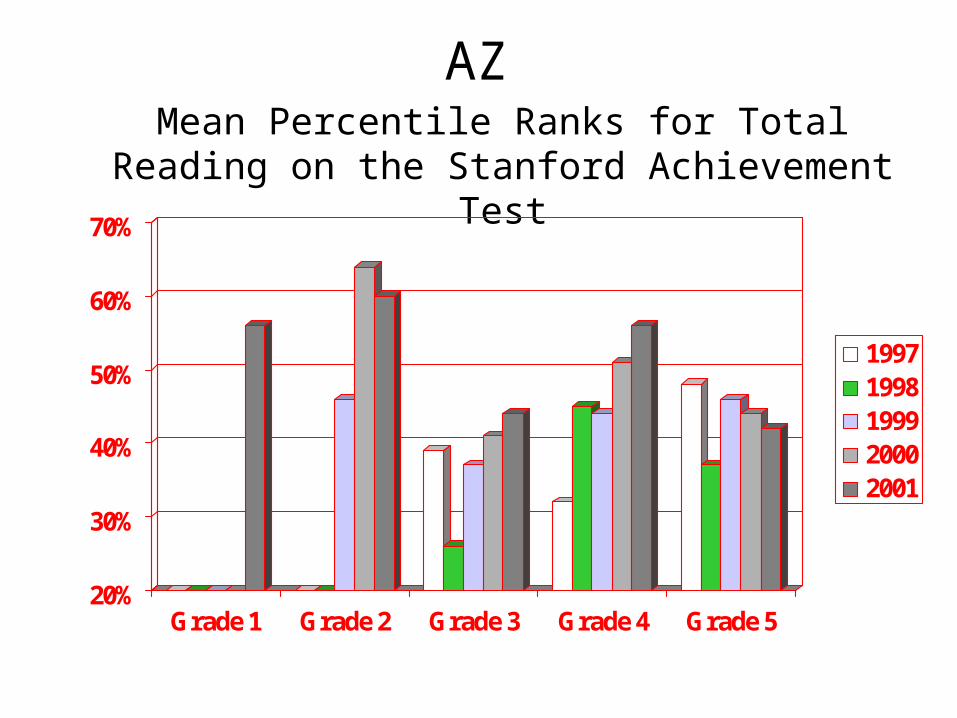
Wood Elementary School, AZ Mean Percentile Ranks for Total Reading on the
Stanford Achievement Test
20%
30%
40%
50%
60%
70%
Grade 1 Grade 2 Grade 3 Grade 4 Grade 5
19971998199920002001

“How many effective schools would you have to see to be persuaded of the educability of poor children? If your answer is more than one, then I submit that you have reasons of your own for preferring to believe that basic pupil performance derives from family background instead of school response to family background. Whether or not we will ever effectively teach the children of the poor is probably far more a matter of politics than of social science and that is as it should be.

We can, whenever and wherever we choose, successfully teach all children whose schooling is of interest to us. We already know more than we need to do that. Whether or not we do it must finally depend on how we feel about the fact that we haven’t so far.” - Dr. Ron Edmonds

THE CHALLENGE:
Our challenge is to provide an education for the kind of kids we have. Not the
kind of kids we used to have or want to have or the kind that exists in our
dreams.
Every Child Counts!