Closing Price (SGD) 1 - PhillipCapitalinternetfileserver.phillip.com.sg/.../SG/SMRT20140429.pdf ·...
17
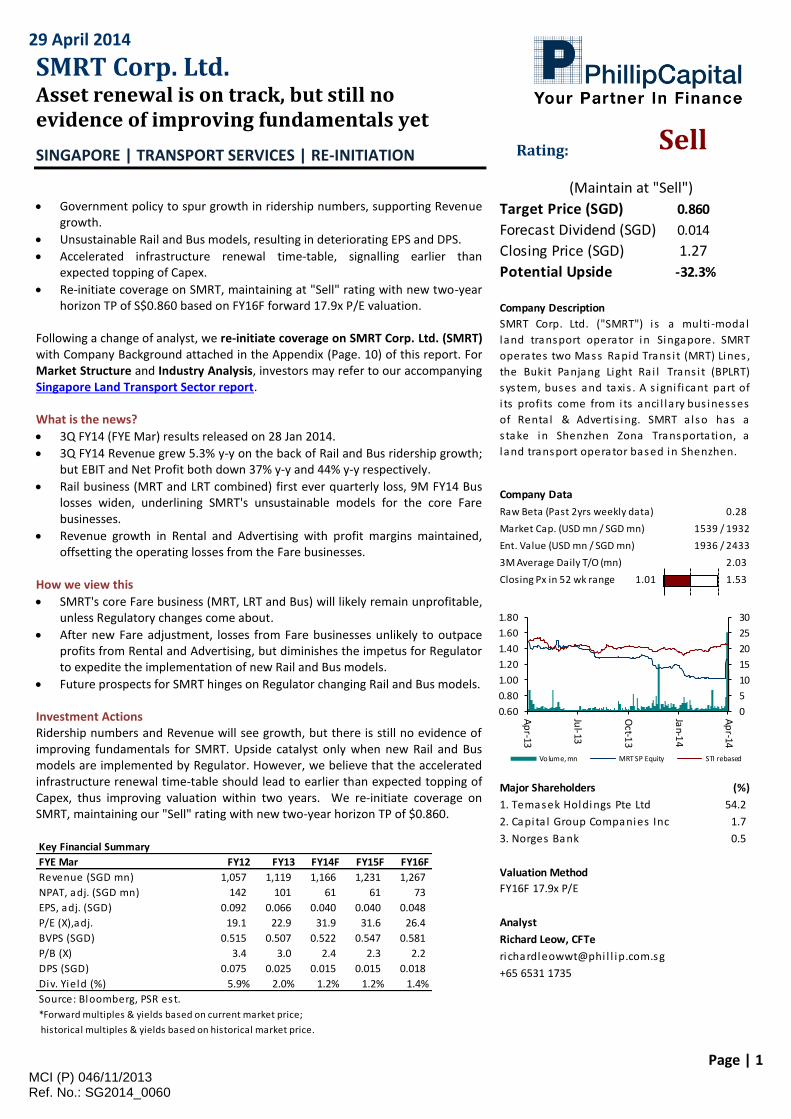
29 April 2014 Page | 1 MCI (P) 046/11/2013 Ref. No.: SG2014_0060 SMRT Corp. Ltd. Asset renewal is on track, but still no evidence of improving fundamentals yet SINGAPORE | TRANSPORT SERVICES | RE-INITIATION Rating: Sell (Maintain at "Sell") Government policy to spur growth in ridership numbers, supporting Revenue growth. Unsustainable Rail and Bus models, resulting in deteriorating EPS and DPS. Accelerated infrastructure renewal time-table, signalling earlier than expected topping of Capex. Re-initiate coverage on SMRT, maintaining at "Sell" rating with new two-year horizon TP of S$0.860 based on FY16F forward 17.9x P/E valuation. Following a change of analyst, we re-initiate coverage on SMRT Corp. Ltd. (SMRT) with Company Background attached in the Appendix (Page. 10) of this report. For Market Structure and Industry Analysis, investors may refer to our accompanying Singapore Land Transport Sector report. What is the news? 3Q FY14 (FYE Mar) results released on 28 Jan 2014. 3Q FY14 Revenue grew 5.3% y-y on the back of Rail and Bus ridership growth; but EBIT and Net Profit both down 37% y-y and 44% y-y respectively. Rail business (MRT and LRT combined) first ever quarterly loss, 9M FY14 Bus losses widen, underlining SMRT's unsustainable models for the core Fare businesses. Revenue growth in Rental and Advertising with profit margins maintained, offsetting the operating losses from the Fare businesses. How we view this SMRT's core Fare business (MRT, LRT and Bus) will likely remain unprofitable, unless Regulatory changes come about. After new Fare adjustment, losses from Fare businesses unlikely to outpace profits from Rental and Advertising, but diminishes the impetus for Regulator to expedite the implementation of new Rail and Bus models. Future prospects for SMRT hinges on Regulator changing Rail and Bus models. Investment Actions Ridership numbers and Revenue will see growth, but there is still no evidence of improving fundamentals for SMRT. Upside catalyst only when new Rail and Bus models are implemented by Regulator. However, we believe that the accelerated infrastructure renewal time-table should lead to earlier than expected topping of Capex, thus improving valuation within two years. We re-initiate coverage on SMRT, maintaining our "Sell" rating with new two-year horizon TP of $0.860. Key Financial Summary FYE Mar FY12 FY13 FY14F FY15F FY16F Revenue (SGD mn) 1,057 1,119 1,166 1,231 1,267 NPAT, adj. (SGD mn) 142 101 61 61 73 EPS, adj. (SGD) 0.092 0.066 0.040 0.040 0.048 P/E (X),adj. 19.1 22.9 31.9 31.6 26.4 BVPS (SGD) 0.515 0.507 0.522 0.547 0.581 P/B (X) 3.4 3.0 2.4 2.3 2.2 DPS (SGD) 0.075 0.025 0.015 0.015 0.018 Div. Yield (%) 5.9% 2.0% 1.2% 1.2% 1.4% Source: Bloomberg, PSR est. *Forward multiples & yields based on current market price; historical multiples & yields based on historical market price. Target Price (SGD) 0.860 Forecast Dividend (SGD) 0.014 Closing Price (SGD) 1.27 Potential Upside Company Description Company Data Raw Beta (Past 2yrs weekly data) 0.28 Market Cap. (USD mn / SGD mn) 1539 / 1932 Ent. Value (USD mn / SGD mn) 1936 / 2433 3M Average Daily T/O (mn) 2.03 Closing Px in 52 wk range 1.01 1.53 Major Shareholders (%) 54.2 1.7 0.5 Valuation Method FY16F 17.9x P/E Analyst Richard Leow, CFTe [email protected] +65 6531 1735 -32.3% SMRT Corp. Ltd. ("SMRT") is a multi-modal land transport operator in Singapore. SMRT operates two Mass Rapid Transit (MRT) Lines, the Bukit Panjang Light Rail Transit (BPLRT) system, buses and taxis. A significant part of its profits come from its ancillarybusinesses of Rental & Advertising. SMRT also has a stake in Shenzhen Zona Transportation, a land transport operator based in Shenzhen. 1. Temasek Holdings Pte Ltd 2. Capital Group Companies Inc 3. Norges Bank 0 5 10 15 20 25 30 0.60 0.80 1.00 1.20 1.40 1.60 1.80 Apr-13 Jul-13 Oct-13 Jan-14 Apr-14 Vo lum e, mn MRT SP Equity STI rebased
Transcript of Closing Price (SGD) 1 - PhillipCapitalinternetfileserver.phillip.com.sg/.../SG/SMRT20140429.pdf ·...
29 April 2014
Page | 1 MCI (P) 046/11/2013 Ref. No.: SG2014_0060
SMRT Corp. Ltd. Asset renewal is on track, but still no evidence of improving fundamentals yet
SINGAPORE | TRANSPORT SERVICES | RE-INITIATION
Rating: Sell
(Maintain at "Sell") Government policy to spur growth in ridership numbers, supporting Revenue
growth.
Unsustainable Rail and Bus models, resulting in deteriorating EPS and DPS.
Accelerated infrastructure renewal time-table, signalling earlier than expected topping of Capex.
Re-initiate coverage on SMRT, maintaining at "Sell" rating with new two-year horizon TP of S$0.860 based on FY16F forward 17.9x P/E valuation.
Following a change of analyst, we re-initiate coverage on SMRT Corp. Ltd. (SMRT) with Company Background attached in the Appendix (Page. 10) of this report. For Market Structure and Industry Analysis, investors may refer to our accompanying Singapore Land Transport Sector report. What is the news?
3Q FY14 (FYE Mar) results released on 28 Jan 2014.
3Q FY14 Revenue grew 5.3% y-y on the back of Rail and Bus ridership growth; but EBIT and Net Profit both down 37% y-y and 44% y-y respectively.
Rail business (MRT and LRT combined) first ever quarterly loss, 9M FY14 Bus losses widen, underlining SMRT's unsustainable models for the core Fare businesses.
Revenue growth in Rental and Advertising with profit margins maintained, offsetting the operating losses from the Fare businesses.
How we view this
SMRT's core Fare business (MRT, LRT and Bus) will likely remain unprofitable, unless Regulatory changes come about.
After new Fare adjustment, losses from Fare businesses unlikely to outpace profits from Rental and Advertising, but diminishes the impetus for Regulator to expedite the implementation of new Rail and Bus models.
Future prospects for SMRT hinges on Regulator changing Rail and Bus models. Investment Actions Ridership numbers and Revenue will see growth, but there is still no evidence of improving fundamentals for SMRT. Upside catalyst only when new Rail and Bus models are implemented by Regulator. However, we believe that the accelerated infrastructure renewal time-table should lead to earlier than expected topping of Capex, thus improving valuation within two years. We re-initiate coverage on SMRT, maintaining our "Sell" rating with new two-year horizon TP of $0.860. Key Financial Summary
FYE Mar FY12 FY13 FY14F FY15F FY16F
Revenue (SGD mn) 1,057 1,119 1,166 1,231 1,267
NPAT, adj. (SGD mn) 142 101 61 61 73
EPS, adj. (SGD) 0.092 0.066 0.040 0.040 0.048
P/E (X),adj. 19.1 22.9 31.9 31.6 26.4
BVPS (SGD) 0.515 0.507 0.522 0.547 0.581
P/B (X) 3.4 3.0 2.4 2.3 2.2
DPS (SGD) 0.075 0.025 0.015 0.015 0.018
Div. Yield (%) 5.9% 2.0% 1.2% 1.2% 1.4%
Source: Bloomberg, PSR est.
*Forward multiples & yields based on current market price;
historical multiples & yields based on historical market price.
Target Price (SGD) 0.860
Forecast Dividend (SGD) 0.014
Closing Price (SGD) 1.27
Potential Upside
Company Description
Company Data
Raw Beta (Past 2yrs weekly data) 0.28
Market Cap. (USD mn / SGD mn) 1539 / 1932
Ent. Value (USD mn / SGD mn) 1936 / 2433
3M Average Daily T/O (mn) 2.03
Closing Px in 52 wk range 1.01 1.53
Major Shareholders (%)
54.2
1.7
0.5
Valuation Method
FY16F 17.9x P/E
Analyst
Richard Leow, CFTe
richardleowwt@phi l l ip.com.sg
+65 6531 1735
-32.3%
SMRT Corp. Ltd. ("SMRT") i s a multi -modal
land transport operator in Singapore. SMRT
operates two Mass Rapid Trans i t (MRT) Lines ,
the Buki t Panjang Light Ra i l Trans i t (BPLRT)
system, buses and taxis . A s igni ficant part of
i ts profi ts come from its anci l lary bus inesses
of Renta l & Adverti s ing. SMRT also has a
stake in Shenzhen Zona Transportation, a
land transport operator based in Shenzhen.
1. Temasek Holdings Pte Ltd
2. Capi ta l Group Companies Inc
3. Norges Bank
0
5
10
15
20
25
30
0.60
0.80
1.00
1.20
1.40
1.60
1.80
Ap
r-13
Jul-13
Oct-1
3
Jan-1
4
Ap
r-14
Volume, mn MRT SP Equity STI rebased
SMRT Corp. Ltd. 29 April 2014
Page | 2
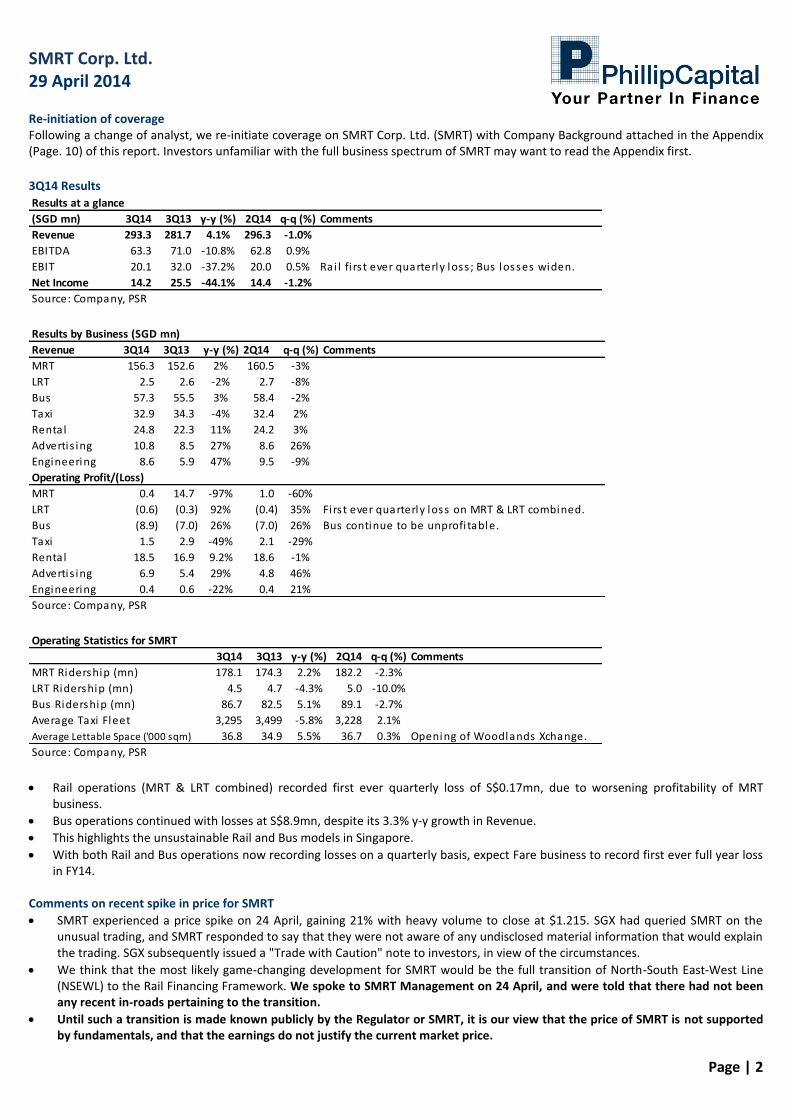
Re-initiation of coverage Following a change of analyst, we re-initiate coverage on SMRT Corp. Ltd. (SMRT) with Company Background attached in the Appendix (Page. 10) of this report. Investors unfamiliar with the full business spectrum of SMRT may want to read the Appendix first.
3Q14 Results
Results at a glance
(SGD mn) 3Q14 3Q13 y-y (%) 2Q14 q-q (%) Comments
Revenue 293.3 281.7 4.1% 296.3 -1.0%
EBITDA 63.3 71.0 -10.8% 62.8 0.9%
EBIT 20.1 32.0 -37.2% 20.0 0.5% Rai l fi rs t ever quarterly loss ; Bus losses widen.
Net Income 14.2 25.5 -44.1% 14.4 -1.2%
Source: Company, PSR Results by Business (SGD mn)
Revenue 3Q14 3Q13 y-y (%) 2Q14 q-q (%) Comments
MRT 156.3 152.6 2% 160.5 -3%
LRT 2.5 2.6 -2% 2.7 -8%
Bus 57.3 55.5 3% 58.4 -2%
Taxi 32.9 34.3 -4% 32.4 2%
Rental 24.8 22.3 11% 24.2 3%
Advertis ing 10.8 8.5 27% 8.6 26%
Engineering 8.6 5.9 47% 9.5 -9%
Operating Profit/(Loss)
MRT 0.4 14.7 -97% 1.0 -60%
LRT (0.6) (0.3) 92% (0.4) 35% Firs t ever quarterly loss on MRT & LRT combined.
Bus (8.9) (7.0) 26% (7.0) 26% Bus continue to be unprofi table.
Taxi 1.5 2.9 -49% 2.1 -29%
Rental 18.5 16.9 9.2% 18.6 -1%
Advertis ing 6.9 5.4 29% 4.8 46%
Engineering 0.4 0.6 -22% 0.4 21%
Source: Company, PSR Operating Statistics for SMRT
3Q14 3Q13 y-y (%) 2Q14 q-q (%) Comments
MRT Ridership (mn) 178.1 174.3 2.2% 182.2 -2.3%
LRT Ridership (mn) 4.5 4.7 -4.3% 5.0 -10.0%
Bus Ridership (mn) 86.7 82.5 5.1% 89.1 -2.7%
Average Taxi Fleet 3,295 3,499 -5.8% 3,228 2.1%
Average Lettable Space ('000 sqm) 36.8 34.9 5.5% 36.7 0.3% Opening of Woodlands Xchange.
Source: Company, PSR Rail operations (MRT & LRT combined) recorded first ever quarterly loss of S$0.17mn, due to worsening profitability of MRT
business.
Bus operations continued with losses at S$8.9mn, despite its 3.3% y-y growth in Revenue.
This highlights the unsustainable Rail and Bus models in Singapore.
With both Rail and Bus operations now recording losses on a quarterly basis, expect Fare business to record first ever full year loss in FY14.
Comments on recent spike in price for SMRT
SMRT experienced a price spike on 24 April, gaining 21% with heavy volume to close at $1.215. SGX had queried SMRT on the unusual trading, and SMRT responded to say that they were not aware of any undisclosed material information that would explain the trading. SGX subsequently issued a "Trade with Caution" note to investors, in view of the circumstances.
We think that the most likely game-changing development for SMRT would be the full transition of North-South East-West Line (NSEWL) to the Rail Financing Framework. We spoke to SMRT Management on 24 April, and were told that there had not been any recent in-roads pertaining to the transition.
Until such a transition is made known publicly by the Regulator or SMRT, it is our view that the price of SMRT is not supported by fundamentals, and that the earnings do not justify the current market price.
SMRT Corp. Ltd. 29 April 2014
Page | 3
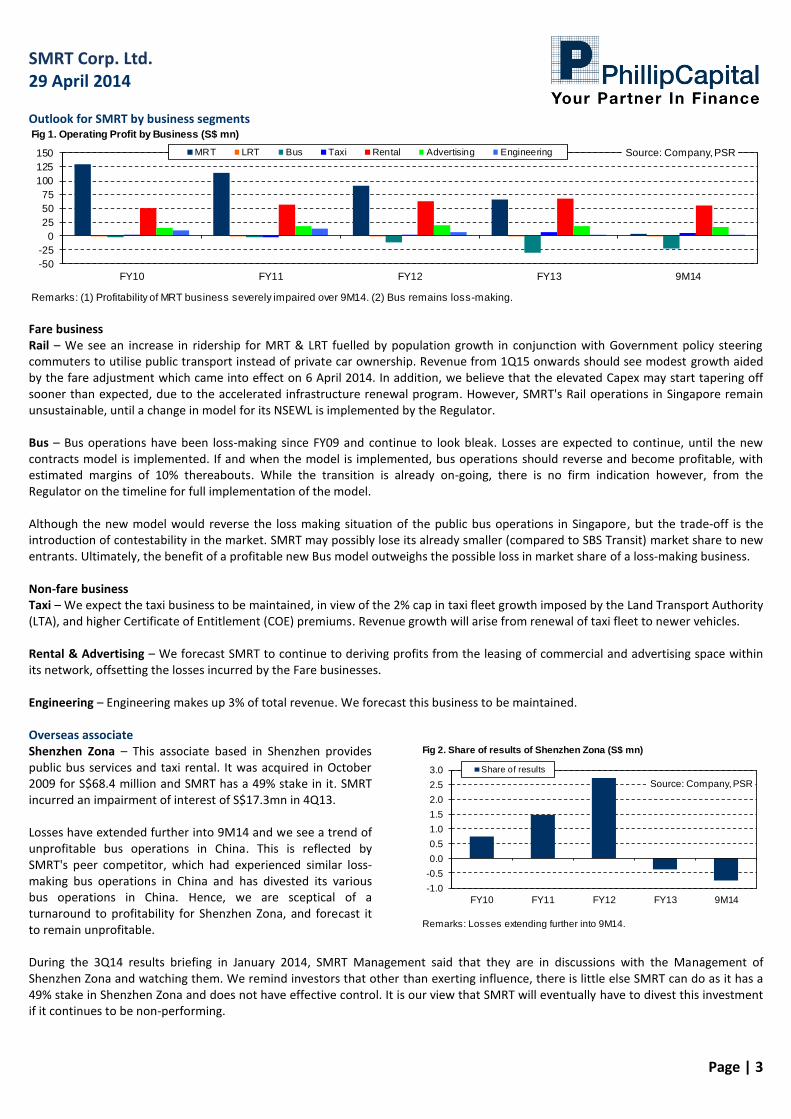
Outlook for SMRT by business segments Fig 1. Operating Profit by Business (S$ mn)
Remarks: (1) Profitability of MRT business severely impaired over 9M14. (2) Bus remains loss-making.
-50
-25
0
25
50
75
100
125
150
FY10 FY11 FY12 FY13 9M14
Source: Company, PSRMRT LRT Bus Taxi Rental Advertising Engineering
Fare business Rail – We see an increase in ridership for MRT & LRT fuelled by population growth in conjunction with Government policy steering commuters to utilise public transport instead of private car ownership. Revenue from 1Q15 onwards should see modest growth aided by the fare adjustment which came into effect on 6 April 2014. In addition, we believe that the elevated Capex may start tapering off sooner than expected, due to the accelerated infrastructure renewal program. However, SMRT's Rail operations in Singapore remain unsustainable, until a change in model for its NSEWL is implemented by the Regulator. Bus – Bus operations have been loss-making since FY09 and continue to look bleak. Losses are expected to continue, until the new contracts model is implemented. If and when the model is implemented, bus operations should reverse and become profitable, with estimated margins of 10% thereabouts. While the transition is already on-going, there is no firm indication however, from the Regulator on the timeline for full implementation of the model. Although the new model would reverse the loss making situation of the public bus operations in Singapore, but the trade-off is the introduction of contestability in the market. SMRT may possibly lose its already smaller (compared to SBS Transit) market share to new entrants. Ultimately, the benefit of a profitable new Bus model outweighs the possible loss in market share of a loss-making business. Non-fare business Taxi – We expect the taxi business to be maintained, in view of the 2% cap in taxi fleet growth imposed by the Land Transport Authority (LTA), and higher Certificate of Entitlement (COE) premiums. Revenue growth will arise from renewal of taxi fleet to newer vehicles. Rental & Advertising – We forecast SMRT to continue to deriving profits from the leasing of commercial and advertising space within its network, offsetting the losses incurred by the Fare businesses. Engineering – Engineering makes up 3% of total revenue. We forecast this business to be maintained. Overseas associate Shenzhen Zona – This associate based in Shenzhen provides public bus services and taxi rental. It was acquired in October 2009 for S$68.4 million and SMRT has a 49% stake in it. SMRT incurred an impairment of interest of S$17.3mn in 4Q13. Losses have extended further into 9M14 and we see a trend of unprofitable bus operations in China. This is reflected by SMRT's peer competitor, which had experienced similar loss-making bus operations in China and has divested its various bus operations in China. Hence, we are sceptical of a turnaround to profitability for Shenzhen Zona, and forecast it to remain unprofitable.
Fig 2. Share of results of Shenzhen Zona (S$ mn)
Remarks: Losses extending further into 9M14.
-1.0
-0.5
0.0
0.5
1.0
1.5
2.0
2.5
3.0
FY10 FY11 FY12 FY13 9M14
Source: Company, PSR
Share of results
During the 3Q14 results briefing in January 2014, SMRT Management said that they are in discussions with the Management of Shenzhen Zona and watching them. We remind investors that other than exerting influence, there is little else SMRT can do as it has a 49% stake in Shenzhen Zona and does not have effective control. It is our view that SMRT will eventually have to divest this investment if it continues to be non-performing.

SMRT Corp. Ltd. 29 April 2014
Page | 4
Sports Hub Retail Mall (SHRM) Management did not give guidance on revenue or margins expected for SHRM, but said during the 3Q14 earnings briefing that occupancy take up rate is within expectations and they would reveal more information in the next quarter. We wish to bring to the attention of investors that the SMRT Alpha JV will be leasing the space from Singapore Sports Council; hence margins for this venture will not be as high as SMRT's existing Rental business. We are positive on SHRM for SMRT, as we expect the margins from rental of this commercial space to be higher than its core Fare business (but lower than existing Rental business). Moreover, the nearest MRT station to SHRM is Stadium, which is on the CCL and the nearest MRT station to SHRM on the NSEWL is Kallang; both of which are operated by SMRT. Hence SMRT is expected to monopolise the Fare revenue collection from commuter traffic travelling to the SHRM by MRT.
Source: streetdirectory.com
Evidence of improvements in service reliability Service Delays and Train Withdrawals are the two key indicators of train reliability that the LTA uses. Statistics from the LTA show that service reliability on the NSEWL and CCL, both operated by SMRT, have improved. The number of Incidents per 100,000km (>5 min delay) has noticeably decreased and are at their lowest in five years. The number of Train Withdrawals also came down sharply in 2013. We view this favourably for SMRT for the following reasons:
Infrastructure renewal program has been effective in improving Rail reliability, and should be completed soon; therefore implying an easing of elevated Opex/Capex levels.
Improved service reliability lowers the likelihood of a major Rail disruption, thereby avoiding hefty fines under the new Rail Transit System Bill.
Fig 3. Incidents per 100,000km (>5 min delay)
0.0
0.5
1.0
1.5
2.0
2.5
3.0
3.5
2009 2010 2011 2012 2013
Source: LTA, PSR
NSEWL NEL CCL
Fig 4. Normalised Train Withdrawals (per 100,000 train-km)
0.0
0.5
1.0
1.5
2.0
2.5
3.0
3.5
2008 2009 2010 2011 2012 2013
Source: LTA, PSR
NSEWL NEL CCL
Impact of Downtown Line (DTL) We currently do not make any estimates on cannibalisation by DTL from the existing NSEWL for the following reasons:
The DTL is a different configuration from the NSEWL. NSEWL is a six-car configuration, while the DTL is three-car configuration. Hence, DTL's capacity is lower than the NSEWL, assuming equal train service intervals.
"Network externalities" may raise ridership throughout the MRT network due to addition of DTL and it would be difficult to predict change in consumer behaviour.
SMRT Corp. Ltd. 29 April 2014
Page | 5
Transfer of NSEWL assets from SMRT back to LTA under Rail Financing Framework (RFR) As per the FY2012/13 SMRT annual report, carrying value of operating assets attributable to MRT was S$1.129 billion. This consists of operating assets such as rolling stock, signalling equipment and MRT stations exclusively attributable to NSEWL, since there has not been any takeover of assets for CCL. At present, the details of the transfer of NSEWL assets back to LTA remain unclear, with Management guiding the following factors in play: (1) agreement on the valuation of assets, (2) adjustments due to previous grants received used to purchase the assets, (3) mechanism of how to return the cash to SMRT. We wish to elaborate to investors that carrying value (historical costs less accumulated depreciation) of the operating assets can differ from the net realisable value (actual amount that the assets can be sold for). Hence, both SMRT and LTA have to come to a mutual agreement on how to value the assets. As SMRT had previously received a grant of S$480 million for the purchase of the NSEWL operating assets, we estimate the actual amount that would be returned to SMRT could be closer to S$350 million, after adjusting for the grant received and repayment of some of SMRT's long-term debt. This works out to an estimated S$0.23 per share being available to equity holders. However, we think it is unlikely that the cash would be returned directly to shareholders; as disbursement of public funds to a listed company is already a contentious issue with the electorate, let alone disbursement to shareholders. Hence ambiguity remains on how to return the funds to SMRT without raising the ire of the electorate, thus contributing to the prolonged transition to the RFR. Analyst Visit to Bishan and Kim Chuan depots SMRT recently hosted an Analyst Visit on 3 April 2014, where we toured the Bishan and Kim Chuan depots. During the visit, we were shown the engineering capabilities of SMRT on;
Preventive maintenance regime: Monitoring of the third rail condition and track inspections for the NSEWL,
Operations, maintenance and incident recovery: Command centre and train maintenance facilities for CCL,
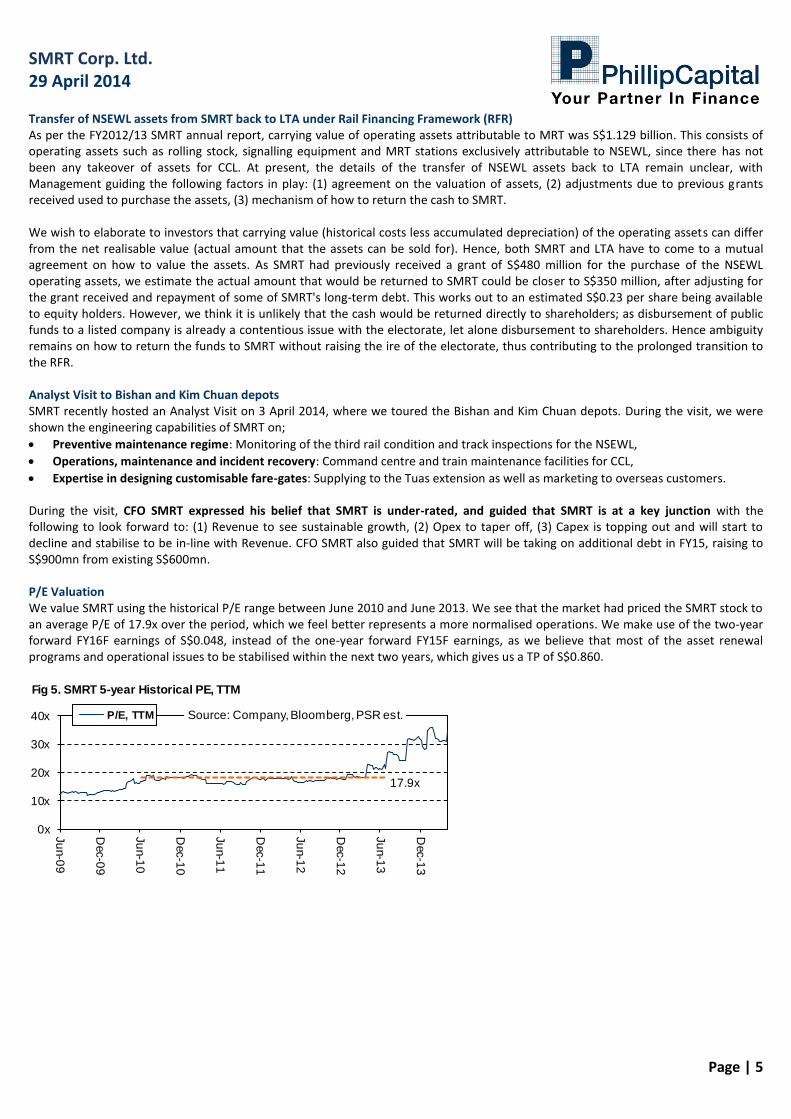
Expertise in designing customisable fare-gates: Supplying to the Tuas extension as well as marketing to overseas customers. During the visit, CFO SMRT expressed his belief that SMRT is under-rated, and guided that SMRT is at a key junction with the following to look forward to: (1) Revenue to see sustainable growth, (2) Opex to taper off, (3) Capex is topping out and will start to decline and stabilise to be in-line with Revenue. CFO SMRT also guided that SMRT will be taking on additional debt in FY15, raising to S$900mn from existing S$600mn. P/E Valuation We value SMRT using the historical P/E range between June 2010 and June 2013. We see that the market had priced the SMRT stock to an average P/E of 17.9x over the period, which we feel better represents a more normalised operations. We make use of the two-year forward FY16F earnings of S$0.048, instead of the one-year forward FY15F earnings, as we believe that most of the asset renewal programs and operational issues to be stabilised within the next two years, which gives us a TP of S$0.860. Fig 5. SMRT 5-year Historical PE, TTM
17.9x
0x
10x
20x
30x
40x
Ju
n-0
9
Dec-0
9
Ju
n-1
0
Dec-1
0
Ju
n-1
1
Dec-1
1
Ju
n-1
2
Dec-1
2
Ju
n-1
3
Dec-1
3
Source: Company, Bloomberg, PSR est.P/E, TTM
SMRT Corp. Ltd. 29 April 2014
Page | 6
Key downside risks for SMRT
Unsuccessful in renewing any of its Rail, Bus or Taxi operator licenses.
Protracted negotiations with Regulator, prolonging unprofitable Rail and Bus models.
Heavy fines imposed by Regulator due to rail disruption, crippling profitability. Future price catalysts to the upside
Potential change in Rail model in Singapore to asset-light model. o NSEWL and CCL to swap over to the new Rail Financing Framework that the Downtown Line is already on. o Higher lease payable to Regulator, but SMRT will be freed from lumpy Capex.
Potential change in Bus model in Singapore to the contracts model. o Better operating margins (estimated about 10%). o Open to contestability and may possibly erode market share; in exchange for a sustainable and profitable model.
Accelerated infrastructure renewal programme. o Earlier than expected topping of Capex, leading to positive valuation surprise and better yield for shareholders.
Winning the tender to operate the new MRT lines that are currently under construction/planning. o Leading to higher EPS, as the new lines would likely be operated under the new Rail Financing Framework.
SMRT Corp. Ltd. 29 April 2014
Page | 7
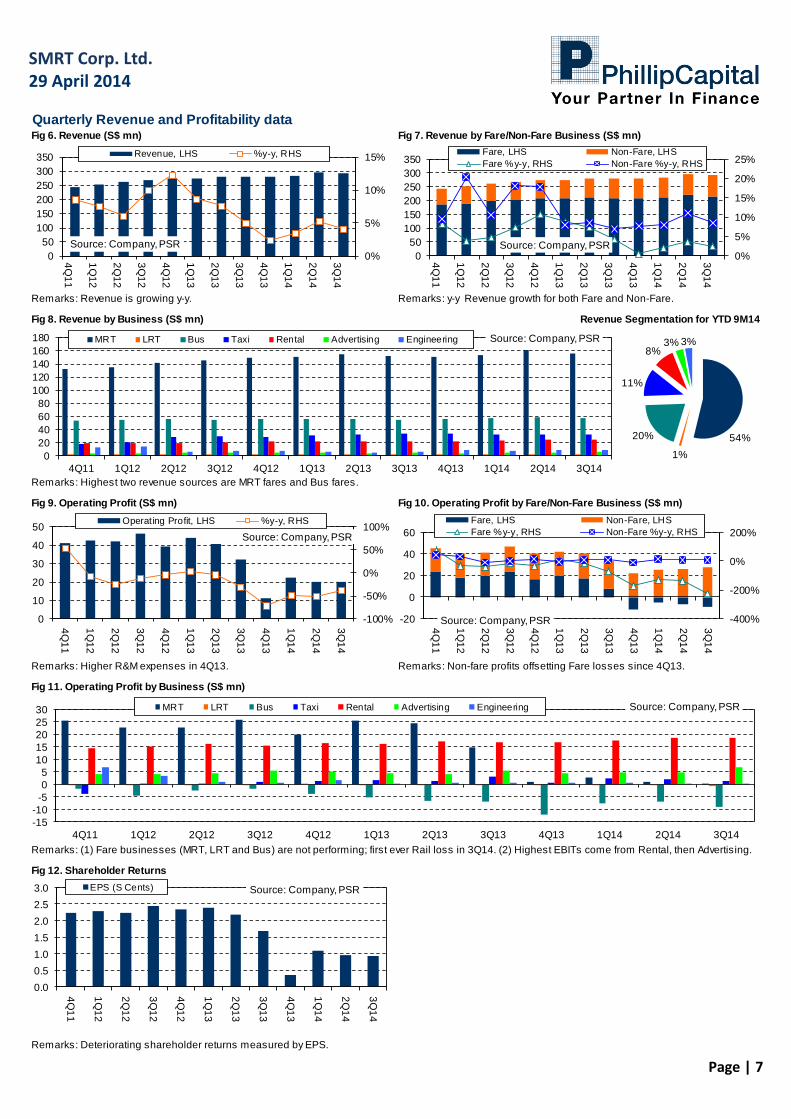
Quarterly Revenue and Profitability dataFig 6. Revenue (S$ mn) Fig 7. Revenue by Fare/Non-Fare Business (S$ mn)
Remarks: Revenue is growing y-y. Remarks: y-y Revenue growth for both Fare and Non-Fare.
Fig 8. Revenue by Business (S$ mn) Revenue Segmentation for YTD 9M14
Remarks: Highest two revenue sources are MRT fares and Bus fares.
Fig 9. Operating Profit (S$ mn) Fig 10. Operating Profit by Fare/Non-Fare Business (S$ mn)
Remarks: Higher R&M expenses in 4Q13. Remarks: Non-fare profits offsetting Fare losses since 4Q13.
Fig 11. Operating Profit by Business (S$ mn)
Fig 12. Shareholder Returns
Remarks: Deteriorating shareholder returns measured by EPS.
Remarks: (1) Fare businesses (MRT, LRT and Bus) are not performing; first ever Rail loss in 3Q14. (2) Highest EBITs come from Rental, then Advertising.
0%
5%
10%
15%
0
50
100
150
200
250
300
350
4Q
11
1Q
12
2Q
12
3Q
12
4Q
12
1Q
13
2Q
13
3Q
13
4Q
13
1Q
14
2Q
14
3Q
14
Source: Company, PSR
Revenue, LHS %y-y, RHS
0%
5%
10%
15%
20%
25%
0
50
100
150
200
250
300
350
4Q
11
1Q
12
2Q
12
3Q
12
4Q
12
1Q
13
2Q
13
3Q
13
4Q
13
1Q
14
2Q
14
3Q
14
Source: Company, PSR
Fare, LHS Non-Fare, LHS
Fare %y-y, RHS Non-Fare %y-y, RHS
54%
1%
20%
11%
8%3% 3%
0
20
40
60
80
100
120
140
160
180
4Q11 1Q12 2Q12 3Q12 4Q12 1Q13 2Q13 3Q13 4Q13 1Q14 2Q14 3Q14
Source: Company, PSRMRT LRT Bus Taxi Rental Advertising Engineering
-100%
-50%
0%
50%
100%
0
10
20
30
40
50
4Q
11
1Q
12
2Q
12
3Q
12
4Q
12
1Q
13
2Q
13
3Q
13
4Q
13
1Q
14
2Q
14
3Q
14
Source: Company, PSR
Operating Profit, LHS %y-y, RHS
-400%
-200%
0%
200%
-20
0
20
40
60
4Q
11
1Q
12
2Q
12
3Q
12
4Q
12
1Q
13
2Q
13
3Q
13
4Q
13
1Q
14
2Q
14
3Q
14
Source: Company, PSR
Fare, LHS Non-Fare, LHS
Fare %y-y, RHS Non-Fare %y-y, RHS
-15
-10
-5
0
5
10
15
20
25
30
4Q11 1Q12 2Q12 3Q12 4Q12 1Q13 2Q13 3Q13 4Q13 1Q14 2Q14 3Q14
Source: Company, PSRMRT LRT Bus Taxi Rental Advertising Engineering
0.0
0.5
1.0
1.5
2.0
2.5
3.0
4Q
11
1Q
12
2Q
12
3Q
12
4Q
12
1Q
13
2Q
13
3Q
13
4Q
13
1Q
14
2Q
14
3Q
14
Source: Company, PSREPS (S Cents)
SMRT Corp. Ltd. 29 April 2014
Page | 8
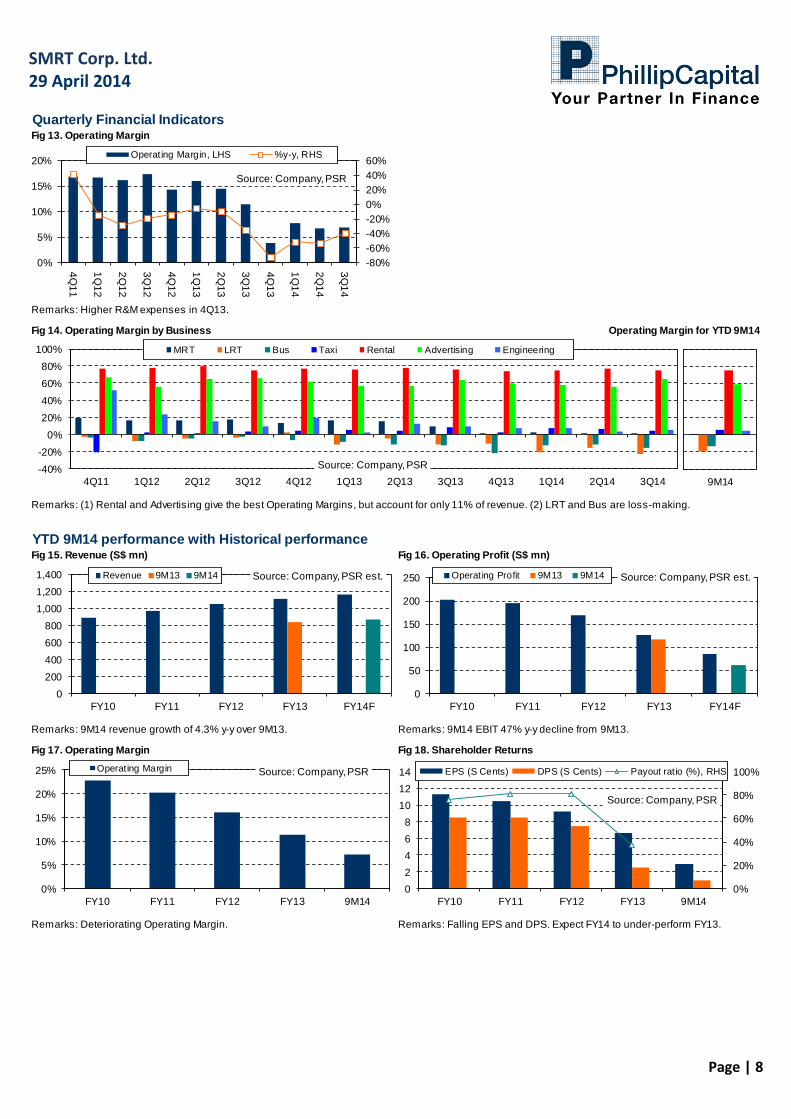
Quarterly Financial IndicatorsFig 13. Operating Margin
Remarks: Higher R&M expenses in 4Q13.
Fig 14. Operating Margin by Business Operating Margin for YTD 9M14
Remarks: (1) Rental and Advertising give the best Operating Margins, but account for only 11% of revenue. (2) LRT and Bus are loss-making.
-80%
-60%
-40%
-20%
0%
20%
40%
60%
0%
5%
10%
15%
20%
4Q
11
1Q
12
2Q
12
3Q
12
4Q
12
1Q
13
2Q
13
3Q
13
4Q
13
1Q
14
2Q
14
3Q
14
Source: Company, PSR
Operating Margin, LHS %y-y, RHS
-40%
-20%
0%
20%
40%
60%
80%
100%
4Q11 1Q12 2Q12 3Q12 4Q12 1Q13 2Q13 3Q13 4Q13 1Q14 2Q14 3Q14
Source: Company, PSR
MRT LRT Bus Taxi Rental Advertising Engineering
9M14
YTD 9M14 performance with Historical performanceFig 15. Revenue (S$ mn) Fig 16. Operating Profit (S$ mn)
Remarks: 9M14 revenue growth of 4.3% y-y over 9M13. Remarks: 9M14 EBIT 47% y-y decline from 9M13.
Fig 17. Operating Margin Fig 18. Shareholder Returns
Remarks: Deteriorating Operating Margin. Remarks: Falling EPS and DPS. Expect FY14 to under-perform FY13.
0
200
400
600
800
1,000
1,200
1,400
FY10 FY11 FY12 FY13 FY14F
Source: Company, PSR est.Revenue 9M13 9M14
0
50
100
150
200
250
FY10 FY11 FY12 FY13 FY14F
Source: Company, PSR est.Operating Profit 9M13 9M14
0%
20%
40%
60%
80%
100%
0
2
4
6
8
10
12
14
FY10 FY11 FY12 FY13 9M14
Source: Company, PSR
EPS (S Cents) DPS (S Cents) Payout ratio (%), RHS
0%
5%
10%
15%
20%
25%
FY10 FY11 FY12 FY13 9M14
Source: Company, PSROperating Margin
SMRT Corp. Ltd. 29 April 2014
Page | 9
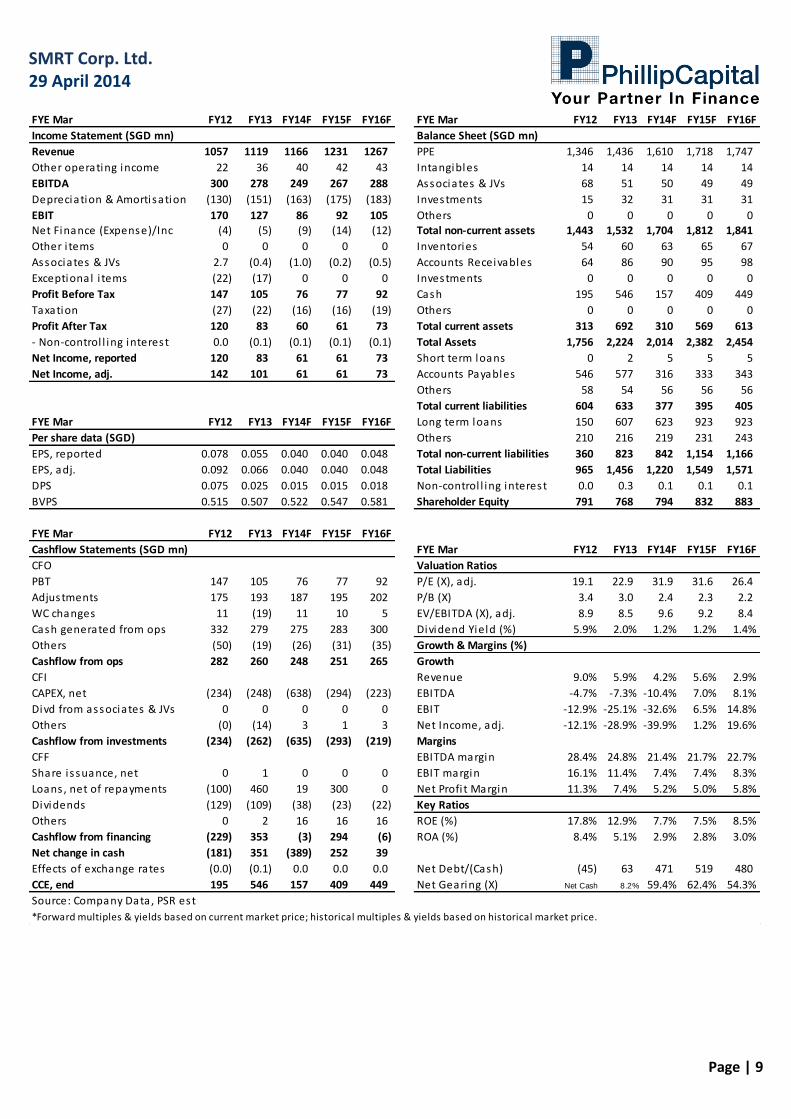
FYE Mar FY12 FY13 FY14F FY15F FY16F FYE Mar FY12 FY13 FY14F FY15F FY16F
Income Statement (SGD mn) Balance Sheet (SGD mn)
Revenue 1057 1119 1166 1231 1267 PPE 1,346 1,436 1,610 1,718 1,747
Other operating income 22 36 40 42 43 Intangibles 14 14 14 14 14
EBITDA 300 278 249 267 288 Associates & JVs 68 51 50 49 49
Depreciation & Amortisation (130) (151) (163) (175) (183) Investments 15 32 31 31 31
EBIT 170 127 86 92 105 Others 0 0 0 0 0
Net Finance (Expense)/Inc (4) (5) (9) (14) (12) Total non-current assets 1,443 1,532 1,704 1,812 1,841
Other i tems 0 0 0 0 0 Inventories 54 60 63 65 67
Associates & JVs 2.7 (0.4) (1.0) (0.2) (0.5) Accounts Receivables 64 86 90 95 98
Exceptional i tems (22) (17) 0 0 0 Investments 0 0 0 0 0
Profit Before Tax 147 105 76 77 92 Cash 195 546 157 409 449
Taxation (27) (22) (16) (16) (19) Others 0 0 0 0 0
Profit After Tax 120 83 60 61 73 Total current assets 313 692 310 569 613
- Non-control l ing interest 0.0 (0.1) (0.1) (0.1) (0.1) Total Assets 1,756 2,224 2,014 2,382 2,454
Net Income, reported 120 83 61 61 73 Short term loans 0 2 5 5 5
Net Income, adj. 142 101 61 61 73 Accounts Payables 546 577 316 333 343
Others 58 54 56 56 56
Total current liabilities 604 633 377 395 405
FYE Mar FY12 FY13 FY14F FY15F FY16F Long term loans 150 607 623 923 923
Per share data (SGD) Others 210 216 219 231 243
EPS, reported 0.078 0.055 0.040 0.040 0.048 Total non-current liabilities 360 823 842 1,154 1,166
EPS, adj. 0.092 0.066 0.040 0.040 0.048 Total Liabilities 965 1,456 1,220 1,549 1,571
DPS 0.075 0.025 0.015 0.015 0.018 Non-control l ing interest 0.0 0.3 0.1 0.1 0.1
BVPS 0.515 0.507 0.522 0.547 0.581 Shareholder Equity 791 768 794 832 883
FYE Mar FY12 FY13 FY14F FY15F FY16F
Cashflow Statements (SGD mn) FYE Mar FY12 FY13 FY14F FY15F FY16F
CFO Valuation Ratios
PBT 147 105 76 77 92 P/E (X), adj. 19.1 22.9 31.9 31.6 26.4
Adjustments 175 193 187 195 202 P/B (X) 3.4 3.0 2.4 2.3 2.2
WC changes 11 (19) 11 10 5 EV/EBITDA (X), adj. 8.9 8.5 9.6 9.2 8.4
Cash generated from ops 332 279 275 283 300 Dividend Yield (%) 5.9% 2.0% 1.2% 1.2% 1.4%
Others (50) (19) (26) (31) (35) Growth & Margins (%)
Cashflow from ops 282 260 248 251 265 Growth
CFI Revenue 9.0% 5.9% 4.2% 5.6% 2.9%
CAPEX, net (234) (248) (638) (294) (223) EBITDA -4.7% -7.3% -10.4% 7.0% 8.1%
Divd from associates & JVs 0 0 0 0 0 EBIT -12.9% -25.1% -32.6% 6.5% 14.8%
Others (0) (14) 3 1 3 Net Income, adj. -12.1% -28.9% -39.9% 1.2% 19.6%
Cashflow from investments (234) (262) (635) (293) (219) Margins
CFF EBITDA margin 28.4% 24.8% 21.4% 21.7% 22.7%
Share i ssuance, net 0 1 0 0 0 EBIT margin 16.1% 11.4% 7.4% 7.4% 8.3%
Loans , net of repayments (100) 460 19 300 0 Net Profi t Margin 11.3% 7.4% 5.2% 5.0% 5.8%
Dividends (129) (109) (38) (23) (22) Key Ratios
Others 0 2 16 16 16 ROE (%) 17.8% 12.9% 7.7% 7.5% 8.5%
Cashflow from financing (229) 353 (3) 294 (6) ROA (%) 8.4% 5.1% 2.9% 2.8% 3.0%
Net change in cash (181) 351 (389) 252 39
Effects of exchange rates (0.0) (0.1) 0.0 0.0 0.0 Net Debt/(Cash) (45) 63 471 519 480
CCE, end 195 546 157 409 449 Net Gearing (X) Net Cash 8.2% 59.4% 62.4% 54.3%
Source: Company Data, PSR est
*Forward multiples & yields based on current market price; historical multiples & yields based on historical market price.
SMRT Corp. Ltd. 29 April 2014
Page | 10
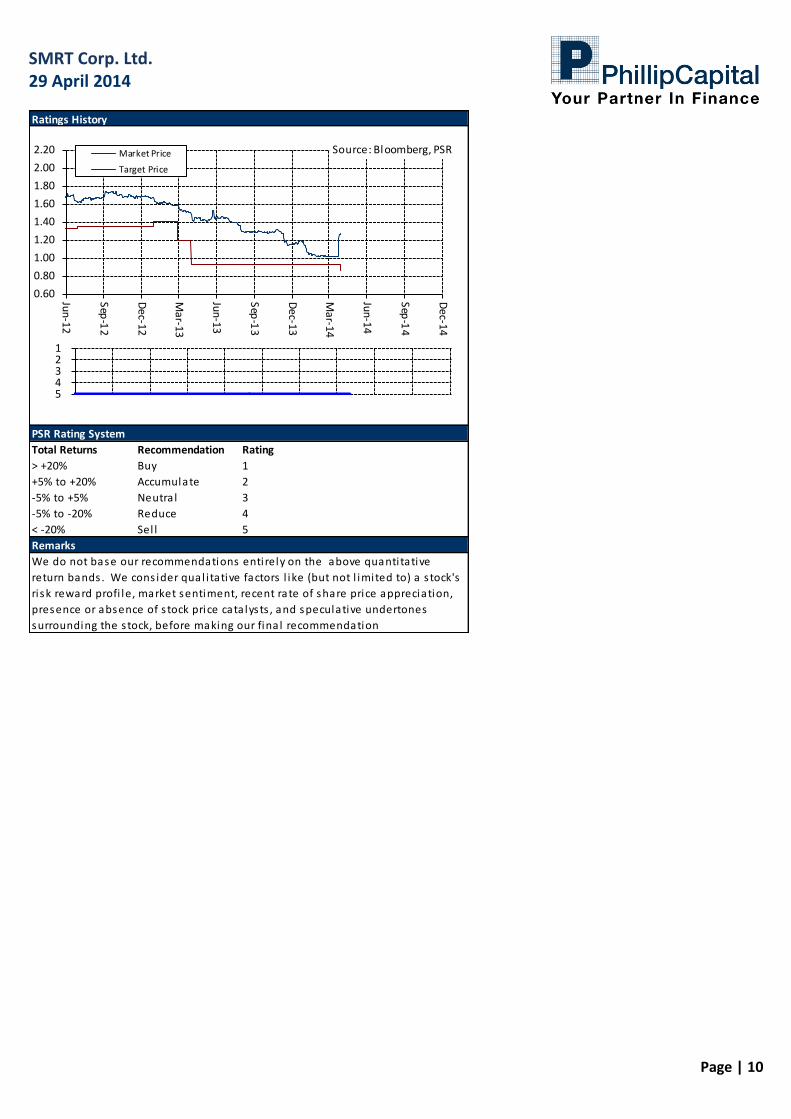
Total Returns Recommendation Rating
> +20% Buy 1
+5% to +20% Accumulate 2
-5% to +5% Neutra l 3
-5% to -20% Reduce 4
< -20% Sel l 5
Ratings History
PSR Rating System
Remarks
We do not base our recommendations entirely on the above quanti tative
return bands . We cons ider qual i tative factors l ike (but not l imited to) a s tock's
ri sk reward profi le, market sentiment, recent rate of share price appreciation,
presence or absence of s tock price cata lysts , and speculative undertones
surrounding the s tock, before making our fina l recommendation
1 2 3 4 5
0.60
0.80
1.00
1.20
1.40
1.60
1.80
2.00
2.20
Jun
-12
Sep
-12
De
c-12
Ma
r-13
Jun
-13
Sep
-13
De
c-13
Ma
r-14
Jun
-14
Sep
-14
De
c-14
Source: Bloomberg, PSRMarket Price
Target Price
SMRT Corp. Ltd. 29 April 2014
Page | 11
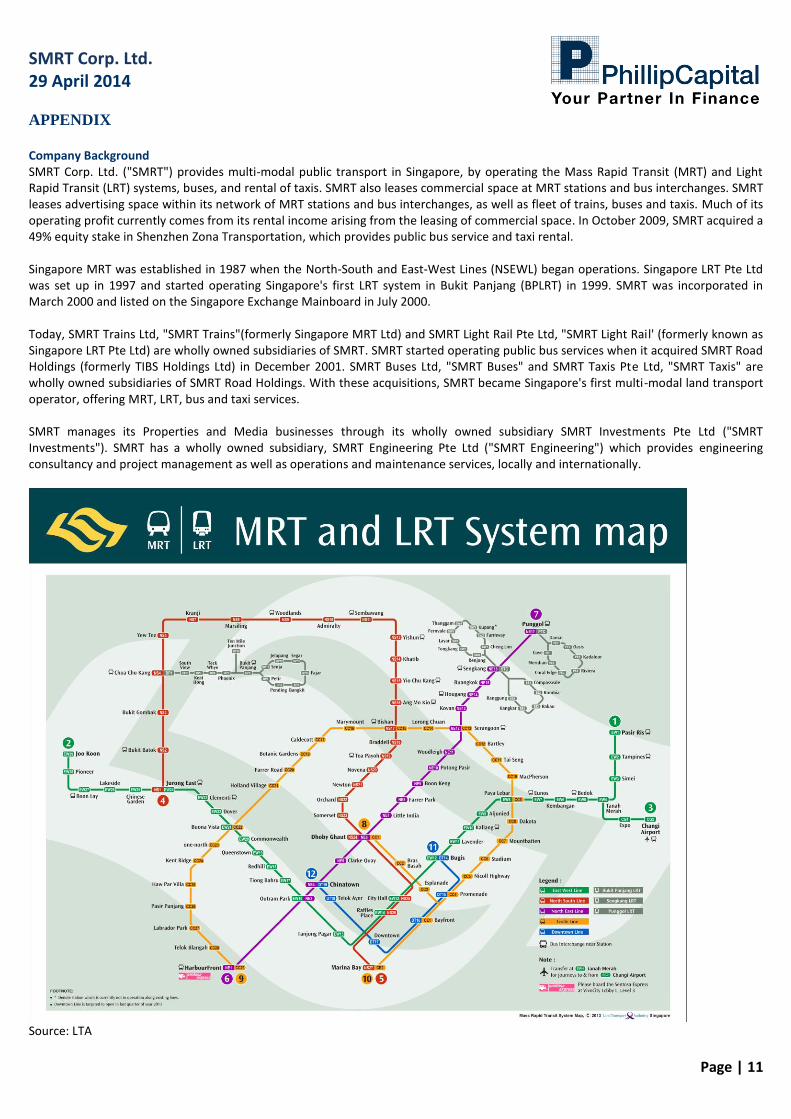
APPENDIX
Company Background SMRT Corp. Ltd. ("SMRT") provides multi-modal public transport in Singapore, by operating the Mass Rapid Transit (MRT) and Light Rapid Transit (LRT) systems, buses, and rental of taxis. SMRT also leases commercial space at MRT stations and bus interchanges. SMRT leases advertising space within its network of MRT stations and bus interchanges, as well as fleet of trains, buses and taxis. Much of its operating profit currently comes from its rental income arising from the leasing of commercial space. In October 2009, SMRT acquired a 49% equity stake in Shenzhen Zona Transportation, which provides public bus service and taxi rental. Singapore MRT was established in 1987 when the North-South and East-West Lines (NSEWL) began operations. Singapore LRT Pte Ltd was set up in 1997 and started operating Singapore's first LRT system in Bukit Panjang (BPLRT) in 1999. SMRT was incorporated in March 2000 and listed on the Singapore Exchange Mainboard in July 2000. Today, SMRT Trains Ltd, "SMRT Trains"(formerly Singapore MRT Ltd) and SMRT Light Rail Pte Ltd, "SMRT Light Rail' (formerly known as Singapore LRT Pte Ltd) are wholly owned subsidiaries of SMRT. SMRT started operating public bus services when it acquired SMRT Road Holdings (formerly TIBS Holdings Ltd) in December 2001. SMRT Buses Ltd, "SMRT Buses" and SMRT Taxis Pte Ltd, "SMRT Taxis" are wholly owned subsidiaries of SMRT Road Holdings. With these acquisitions, SMRT became Singapore's first multi-modal land transport operator, offering MRT, LRT, bus and taxi services. SMRT manages its Properties and Media businesses through its wholly owned subsidiary SMRT Investments Pte Ltd ("SMRT Investments"). SMRT has a wholly owned subsidiary, SMRT Engineering Pte Ltd ("SMRT Engineering") which provides engineering consultancy and project management as well as operations and maintenance services, locally and internationally.
Source: LTA
SMRT Corp. Ltd. 29 April 2014
Page | 12
Group Structure and Business MRT SMRT is the pioneer and dominant Mass Rapid Transit operator in Singapore for the last 27 years. SMRT is licensed to operate the North-South East-West Line (NSEWL) and Circle Line (CCL). The NSEWL consists of 53 stations while the CCL consists of 30 stations. Within the NSEWL network, the North-South Line has 25 stations, while the East-West Line has 31 stations. There are three interchange stations within the NSEWL network for transfers between the North-South Line and East-West Line. Five stations within SMRT's network are interchange stations between CCL and NSEWL. The total route length of SMRT's train network is 128.6km. SMRT's train network is connected to its LRT system on the North-South Line; and is connected to SBS Transit's train network at 7 stations. Fare revenue from MRT operations contributed 54% of revenue in FY13 with ridership at 690.9 million. LRT SMRT operates the Bukit Panjang LRT (BPLRT). There are 14 stations on the BPLRT and its track is 7.8km in length. The BPLRT acts as a feeder-service in the Bukit Panjang area and transfers commuters to the NSEWL through the Choa Chu Kang station. Fare revenue from LRT operations contributed 1% of revenue in FY13 with ridership at 19.4 million. Buses SMRT provides scheduled public bus services connecting the Western and North-Western areas to the rest of Singapore. SMRT operated a fleet of 1,140 buses and 97 bus services as of end FY13. SMRT also offers a chartered bus service known as Bus-Plus, which provides direct connections between residential areas and the Central Business District (CBD) during the morning and evening peak hours on weekdays. Revenue from Bus operations contributed 20% of revenue in FY13 with ridership at 335.1 million. Taxi SMRT operates a fleet of about 3,450 taxis and has about 13% market share of taxis in Singapore as of December 2013. Revenue is earned through the rental of taxis, provision of taxi services and sales of diesel to taxi hirers. Capital expenditure of the taxi business is affected by Certificate of Entitlement (COE) premiums. The cost of renewing their taxi fleet goes up when the COE premium is high. Rental SMRT leases out commercial space and kiosks at various MRT stations and bus interchanges. Commercial space includes shop space and event space. SMRT provides shopping and dining choices, with a good mix of products and services, ranging from convenience stores, food and beverage outlets, banks, beauty and medical services, supermarkets as well as fashion boutiques. The Rental business has the highest operating margin of 76% among all the businesses for FY13. SMRT has about 36,800 sqm of lettable space as of end December 2013. Advertising SMRT leases advertising space at MRT and LRT stations as well as in trains, and on buses and taxis. Advertising within trains include train panels, window stickers and train hangers. Advertising within MRT stations include print panels on the walls, stickers on platform screen doors, pillars, floors, fare gates and along escalators and digital panels on walls. The Advertising business for SMRT had the second highest operating margin at 59% for FY13. Engineering The Engineering business provides consultancy, project management services, leasing of fibre optic cables and repair & maintenance services. SMRT Engineering has contracts both in Singapore and internationally. Locally, SMRT Engineering has contracts to install fare collection gates and leasing of fibre optic cables. Outside of Singapore, SMRT Engineering is providing technical consultancy in Mauritius, China (Dalian) and India (Mumbai); and operates the Personal Rapid Transit (PRT) system in United Arab Emirates (Masdar City). SMRT Engineering has also developed its own proprietary route map information system and fare gates, which are suitable for use at theme parks and by other transport operators. In the pipeline for SMRT Sports Hub Retail Mall (SHRM) SMRT Alpha Pte Ltd was incorporated in October 2012. It is 70:30 JV between subsidiaries of SMRT and NTUC Fairprice respectively. It won the bid to lease and operate SHRM for 12 years. The retail mall covers more than 41,000 sqm of retail space. To give a sense of scale to the size of SHRM, SMRT's current lettable floor space is about 36,800 sqm. The floor space of SHRM is larger than the lettable floor space in SMRT's network of MRT stations and bus interchanges.
SMRT Corp. Ltd. 29 April 2014
Page | 13
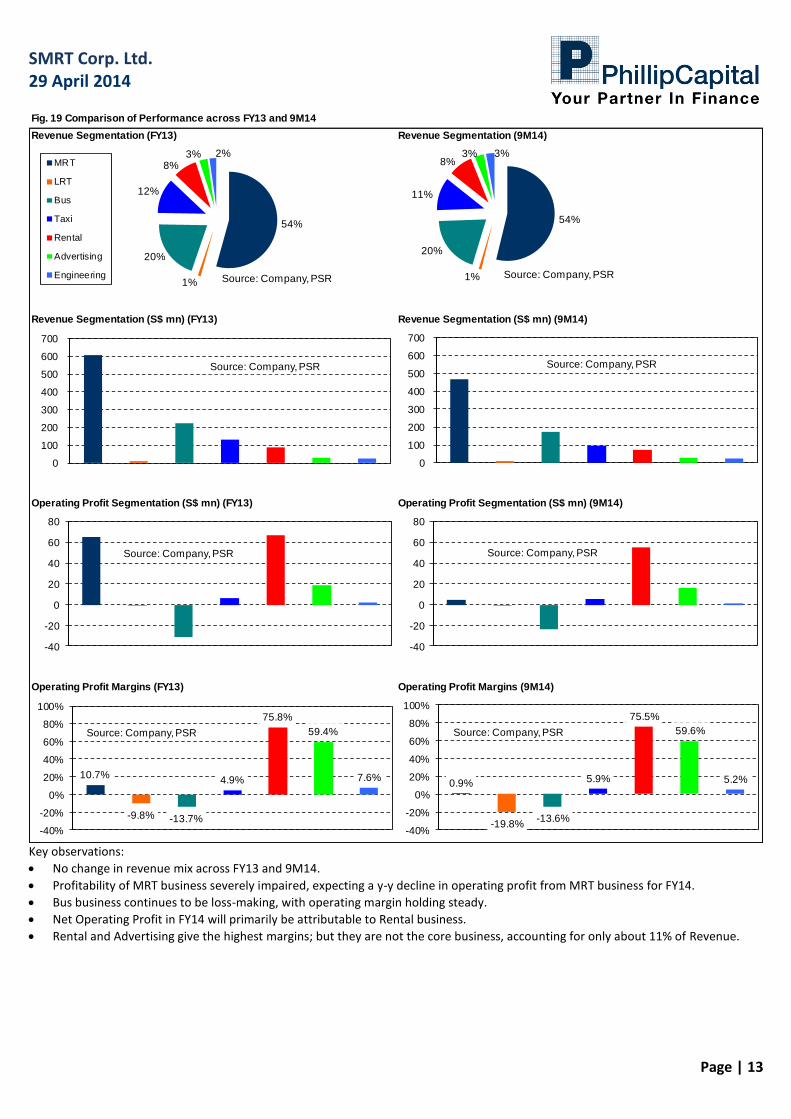
Fig. 19 Comparison of Performance across FY13 and 9M14
Revenue Segmentation (FY13) Revenue Segmentation (9M14)
Revenue Segmentation (S$ mn) (FY13) Revenue Segmentation (S$ mn) (9M14)
Operating Profit Segmentation (S$ mn) (FY13) Operating Profit Segmentation (S$ mn) (9M14)
Operating Profit Margins (FY13) Operating Profit Margins (9M14)
54%
1%
20%
12%
8%3% 2%
Source: Company, PSR
MRT
LRT
Bus
Taxi
Rental
Advertising
Engineering
-40
-20
0
20
40
60
80
Source: Company, PSR
10.7%
-9.8% -13.7%
4.9%
75.8%
59.4%
7.6%
-40%
-20%
0%
20%
40%
60%
80%
100%
Source: Company, PSR
54%
1%
20%
11%
8%3% 3%
Source: Company, PSR
-40
-20
0
20
40
60
80
Source: Company, PSR
0.9%
-19.8%-13.6%
5.9%
75.5%
59.6%
5.2%
-40%
-20%
0%
20%
40%
60%
80%
100%
Source: Company, PSR
0
100
200
300
400
500
600
700
Source: Company, PSR
0
100
200
300
400
500
600
700
Source: Company, PSR
Key observations:
No change in revenue mix across FY13 and 9M14.
Profitability of MRT business severely impaired, expecting a y-y decline in operating profit from MRT business for FY14.
Bus business continues to be loss-making, with operating margin holding steady.
Net Operating Profit in FY14 will primarily be attributable to Rental business.
Rental and Advertising give the highest margins; but they are not the core business, accounting for only about 11% of Revenue.

SMRT Corp. Ltd. 29 April 2014
Page | 14
Management Quality
There are 19 Senior Managers (CEO, CFO, VP, Executive VP, SVP) in charge of running the various aspects of SMRT. A review of the past Annual Reports from recent years reveals that there is a high turnover of Senior Managers in SMRT. Among the current team of Senior Mangers, about two-thirds of them have less than 3 years' experience within SMRT.
We have interacted with CEO SMRT and CFO SMRT. Despite their relative inexperience in the industry (compared to their nearest industry competitor), we believe that they have an adequate understanding of the industry landscape and the challenges that SMRT faces.
Fig 18. Length of service profile, SMRT Senior Management
Source: Company, PSR
< 1 year
1 - under 3 years
3 - under 5 years (Nil)
5 - under 10 years
10 - under 15 years
>= 15 years
Regulatory Framework Trains, North-South East-West Line (NSEWL)
SMRT Trains holds the licence to operate the NSEWL for a period of 30 years from April 1998.
SMRT Trains may request LTA to extend the licence for another 30 years.
SMRT Trains had purchased the operating assets for the NSEWL from LTA in April 1998 for about $1.2 billion.
The operating assets include trains, permanent way vehicles, power supply equipment and cabling, supervisory control system, escalators and lifts, platform screen doors, environmental control system, electrical services and fire protection system, signalling system, communication system, automatic fare collection system and depot workshop equipment.
The infrastructure (tunnels, tracks, viaducts and station structures) of the NSWEL however, remains the property of LTA and is leased to SMRT Trains.
SMRT is responsible for the maintenance, repair, replacement, renewal or refurbishment of all operating assets and infrastructure of the train system.
SMRT may apply to LTA for asset replacement grants for eligible operating assets, and may request LTA to fund major replacement or renewal works to the infrastructure.
Upon expiration or cancellation of the licence, SMRT Trains is to surrender all parts of the NSEWL owned by LTA. Trains, Circle Line (CCL)
SMRT Trains holds the license to operate the CCL for a period of 10 years from May 2009.
Licence may be extended a further 30 years, at LTA's discretion.
SMRT Trains is required to purchase the operating assets of the CCL System from LTA at book values on 4 May 2019.
Infrastructure (tunnels, tracks and station structures) of the CCL system remains the property of LTA and is leased to SMRT Trains. Light Rail Transit (LRT), Bukit Panjang Light Rail Transit (BPLRT)
SMRT Light Rail is licensed to operate the BPLRT until 31 March 2028.
May request LTA to extend the licence for another 30 years, subject to LTA approval.
LTA owns all the operating assets and infrastructure of the BPLRT system.
SMRT Light Rail is required to purchase the operating assets of the LRT System from LTA at book values by 25 October 2015. Buses
SMRT Buses is licensed to operate bus service for 10-years until September 2016.
Required to comply with Quality of Service (QoS) standards.
Quality Incentive Framework undergoing trials.
SMRT Corp. Ltd. 29 April 2014
Page | 15
Market structure and industry analysis For market structure and industry analysis, refer to our Singapore Land Transport Sector report. (The link to our Singapore Land Transport Sector report is provided on the first page of this report.) Porter's Five Forces Analysis for Public Transport Operators (PTOs) For Porter's Five Forces Analysis for PTOs, refer to our Singapore Land Transport Sector report. (The link to our Singapore Land Transport Sector report is provided on the first page of this report.) SWOT Analysis for SMRT Strengths
Dominant market share of combined MRT and LRT ridership (78%); Rail ridership is gaining market share of public transport ridership.
Control over the majority of MRT stations, with the ability to benefit from the good margins derived from the leasing out of commercial space.
Weaknesses
New management team grappling with persistent operational issues.
Labour-intensive business that is sensitive to rising wage costs.
Inability to set train and bus fares in Singapore, as fares are controlled by the Regulator, thus putting a ceiling on the revenue.
Will face higher wage costs as it beefs up its technical workforce. Opportunities
Population growth leading to opening of new MRT stations and bus routes in new residential and commercial areas.
Government targeting eight in ten homes to be within a 10-minute walk of a train station by 2030. (Ref. Land Transport Master Plan 2013)
Changing Land Transport landscape whereby MRT and LRT are capturing ridership market share from Buses.
Partnership opportunities in neighbouring developing countries embarking on MRT/LRT development. Threats
Loss of licence to operate any of its services.
Delayed revamp to Bus model or Rail model by Government, resulting in continued loss-making core Rail and Bus business.
Higher costs incurred to meet minimum service standards.
Heavy fines imposed by Regulator when there is service lapse in Rail business. (up to 10% of revenue)

SMRT Corp. Ltd. 29 April 2014
Page | 16
Important Information
This publication is prepared by Phillip Securities Research Pte Ltd., 250 North Bridge Road, #06-00, Raffles City Tower, Singapore 179101 (Registration Number: 198803136N), which is regulated by the Monetary Authority of Singapore (“Phillip Securities Research”). By receiving or reading this publication, you agree to be bound by the terms and limitations set out below. This publication has been provided to you for personal use only and shall not be reproduced, distributed or published by you in whole or in part, for any purpose. If you have received this document by mistake, please delete or destroy it, and notify the sender immediately. Phillip Securities Research shall not be liable for any direct or consequential loss arising from any use of material contained in this publication. The information contained in this publication has been obtained from public sources, which Phillip Securities Research has no reason to believe are unreliable and any analysis, forecasts, projections, expectations and opinions (collectively, the “Research”) contained in this publication are based on such information and are expressions of belief of the individual author or the indicated source (as applicable) only. Phillip Securities Research has not verified this information and no representation or warranty, express or implied, is made that such information or Research is accurate, complete, appropriate or verified or should be relied upon as such. Any such information or Research contained in this publication is subject to change, and Phillip Securities Research shall not have any responsibility to maintain or update the information or Research made available or to supply any corrections, updates or releases in connection therewith. In no event will Phillip Securities Research or persons associated with or connected to Phillip Securities Research, including but not limited its officers, directors, employees or persons involved in the preparation or issuance of this report, (i) be liable in any manner whatsoever for any consequences (including but not limited to any special, direct, indirect, incidental or consequential losses, loss of profits and damages) of any reliance or usage of this publication or (ii) accept any legal responsibility from any person who receives this publication, even if it has been advised of the possibility of such damages. You must make the final investment decision and accept all responsibility for your investment decision, including, but not limited to your reliance on the information, data and/or other materials presented in this publication. Any opinions, forecasts, assumptions, estimates, valuations and prices contained in this material are as of the date indicated and are subject to change at any time without prior notice. Past performance of any product referred to in this publication is not indicative of future results. This report does not constitute, and should not be used as a substitute for, tax, legal or investment advice. This publication should not be relied upon exclusively or as authoritative, without further being subject to the recipient’s own independent verification and exercise of judgment. The fact that this publication has been made available constitutes neither a recommendation to enter into a particular transaction, nor a representation that any product described in this material is suitable or appropriate for the recipient. Recipients should be aware that many of the products, which may be described in this publication involve significant risks and may not be suitable for all investors, and that any decision to enter into transactions involving such products should not be made, unless all such risks are understood and an independent determination has been made that such transactions would be appropriate. Any discussion of the risks contained herein with respect to any product should not be considered to be a disclosure of all risks or a complete discussion of such risks. Nothing in this report shall be construed to be an offer or solicitation for the purchase or sale of any product. Any decision to purchase any product mentioned in this research should take into account existing public information, including any registered prospectus in respect of such product.
Phillip Securities Research, or persons associated with or connected to Phillip Securities Research, including but not limited to its officers, directors, employees or persons involved in the preparation or issuance of this report, may provide an array of financial services to a large number of corporations in Singapore and worldwide, including but not limited to commercial / investment banking activities (including sponsorship, financial advisory or underwriting activities), brokerage or securities trading activities. Phillip Securities Research, or persons associated with or connected to Phillip Securities Research, including but not limited to its officers, directors, employees or persons involved in the preparation or issuance of this report, may have participated in or invested in transactions with the issuer(s) of the securities mentioned in this publication, and may have performed services for or solicited business from such issuers. Additionally, Phillip Securities Research, or persons associated with or connected to Phillip Securities Research, including but not limited to its officers, directors, employees or persons involved in the preparation or issuance of this report, may have provided advice or investment services to such companies and investments or related investments, as may be mentioned in this publication.
Phillip Securities Research or persons associated with or connected to Phillip Securities Research, including but not limited to its officers, directors, employees or persons involved in the preparation or issuance of this report may, from time to time maintain a long or short position in securities referred to herein, or in related futures or options, purchase or sell, make a market in, or engage in any other transaction involving such securities, and earn brokerage or other compensation in respect of the foregoing. Investments will be denominated in various currencies including US dollars and Euro and thus will be subject to any fluctuation in exchange rates between US dollars and Euro or foreign currencies and the currency of your own jurisdiction. Such fluctuations may have an adverse effect on the value, price or income return of the investment. To the extent permitted by law, Phillip Securities Research, or persons associated with or connected to Phillip Securities Research, including but not limited to its officers, directors, employees or persons involved in the preparation or issuance of this report, may at any time engage in any of the above activities as set out above or otherwise hold a interest, whether material or not, in respect of companies and investments or related investments, which may be mentioned in this publication. Accordingly, information may be available to Phillip Securities Research, or persons associated with or connected to Phillip Securities Research, including but not limited to its officers, directors, employees or persons involved in the preparation or issuance of this report, which is not reflected in this material, and Phillip Securities Research, or persons associated with or connected to Phillip Securities Research, including but not limited to its officers, directors, employees or persons involved in the preparation or issuance of this report, may, to the extent permitted by law, have acted upon or used the information prior to or immediately following its publication. Phillip Securities Research, or persons associated with or connected to Phillip Securities Research, including but not limited its officers, directors, employees or persons involved in the preparation or issuance of this report, may have issued other material that is inconsistent with, or reach different conclusions from, the contents of this material. The information, tools and material presented herein are not directed, intended for distribution to or use by, any person or entity in any jurisdiction or country where such distribution, publication, availability or use would be contrary to the applicable law or regulation or which would subject Phillip Securities Research to any registration or licensing or other requirement, or penalty for contravention of such requirements within such jurisdiction.
Section 27 of the Financial Advisers Act (Cap. 110) of Singapore and the MAS Notice on Recommendations on Investment Products (FAA-N01) do not apply in respect of this publication.
SMRT Corp. Ltd. 29 April 2014
Page | 17
This material is intended for general circulation only and does not take into account the specific investment objectives, financial situation or particular needs of any particular person. The products mentioned in this material may not be suitable for all investors and a person receiving or reading this material should seek advice from a professional and financial adviser regarding the legal, business, financial, tax and other aspects including the suitability of such products, taking into account the specific investment objectives, financial situation or particular needs of that person, before making a commitment to invest in any of such products. Please contact Phillip Securities Research at [65 65311240] in respect of any matters arising from, or in connection with, this document. This report is only for the purpose of distribution in Singapore.
Contact Information (Singapore Research Team) Management Chan Wai Chee (CEO, Research - Special Opportunities)
+65 6531 1231 Research Operations Officer Jermaine Tock +65 6531 1240
Joshua Tan (Head, Research - Equities & Asset Allocation)
+65 6531 1249
Macro | Asset Allocation | Equities Commodities | Offshore & Marine US Equities Joshua Tan +65 6531 1249 Nicholas Ong +65 6531 5440 Wong Yong Kai +65 6531 1685 Telecoms Real Estate Real Estate Colin Tan +65 6531 1221 Caroline Tay +65 6531 1792 Lucas Tan +65 6531 1229 Market Analyst | Equities Finance Transport Kenneth Koh +65 6531 1791 Benjamin Ong +65 6531 1535 Richard Leow, CFTe +65 6531 1735
Contact Information (Regional Member Companies) SINGAPORE
Phillip Securities Pte Ltd Raffles City Tower
250, North Bridge Road #06-00 Singapore 179101 Tel +65 6533 6001 Fax +65 6535 6631
Website: www.poems.com.sg
MALAYSIA Phillip Capital Management Sdn Bhd
B-3-6 Block B Level 3 Megan Avenue II, No. 12, Jalan Yap Kwan Seng, 50450
Kuala Lumpur Tel +603 2162 8841 Fax +603 2166 5099
Website: www.poems.com.my
HONG KONG Phillip Securities (HK) Ltd
11/F United Centre 95 Queensway Hong Kong
Tel +852 2277 6600 Fax +852 2868 5307
Websites: www.phillip.com.hk
JAPAN
Phillip Securities Japan, Ltd. 4-2 Nihonbashi Kabuto-cho Chuo-ku,
Tokyo 103-0026 Tel +81-3 3666 2101 Fax +81-3 3666 6090
Website:www.phillip.co.jp
INDONESIA PT Phillip Securities Indonesia
ANZ Tower Level 23B, Jl Jend Sudirman Kav 33A Jakarta 10220 – Indonesia
Tel +62-21 5790 0800 Fax +62-21 5790 0809
Website: www.phillip.co.id
CHINA Phillip Financial Advisory (Shanghai) Co Ltd
No 550 Yan An East Road, Ocean Tower Unit 2318,
Postal code 200001 Tel +86-21 5169 9200 Fax +86-21 6351 2940
Website: www.phillip.com.cn
THAILAND Phillip Securities (Thailand) Public Co. Ltd
15th Floor, Vorawat Building, 849 Silom Road, Silom, Bangrak,
Bangkok 10500 Thailand Tel +66-2 6351700 / 22680999
Fax +66-2 22680921 Website www.phillip.co.th
FRANCE King & Shaxson Capital Limited
3rd Floor, 35 Rue de la Bienfaisance 75008 Paris France
Tel +33-1 45633100 Fax +33-1 45636017
Website: www.kingandshaxson.com
UNITED KINGDOM King & Shaxson Capital Limited
6th Floor, Candlewick House, 120 Cannon Street, London, EC4N 6AS
Tel +44-20 7426 5950 Fax +44-20 7626 1757
Website: www.kingandshaxson.com
UNITED STATES Phillip Futures Inc
141 W Jackson Blvd Ste 3050 The Chicago Board of Trade Building
Chicago, IL 60604 USA Tel +1-312 356 9000 Fax +1-312 356 9005
AUSTRALIA PhillipCapital
Level 12, 15 William Street, Melbourne, Victoria 3000, Australia
Tel +61-03 9629 8288 Fax +61-03 9629 8882
Website: www.phillipcapital.com.au
SRI LANKA Asha Phillip Securities Limited
No 10, Prince Alfred Tower, Alfred House Gardens, Colombo 3, Sri Lanka
Tel: (94) 11 2429 100 Fax: (94) 11 2429 199 Website: www.ashaphillip.net/home.htm
INDIA
PhillipCapital (India) Private Limited No. 1, C‐Block, 2nd Floor, Modern Center , Jacob
Circle, K. K. Marg, Mahalaxmi Mumbai 400011 Tel: (9122) 2300 2999 Fax: (9122) 6667 9955
Website: www.phillipcapital.in