Closed coal mine shaft as a source of carbon dioxide emissions … · Closed coal mine shaft as a...
12
ORIGINAL ARTICLE Closed coal mine shaft as a source of carbon dioxide emissions Pawel Wrona 1 • Zenon Ro ´ _ zan ´ski 1 • Grzegorz Pach 1 • Tomasz Suponik 1 • Marcin Popczyk 1 Received: 29 April 2016 / Accepted: 2 August 2016 / Published online: 8 August 2016 Ó The Author(s) 2016. This article is published with open access at Springerlink.com Abstract The closure of coal mines does not terminate their impact on the environment. Gas emissions into the atmosphere are the one of the problems. The closed ‘‘Gliwice II’’ shaft has been selected for a series of mea- surements to assess greenhouse gas emissions from the closed mine; however, only CO 2 emission has been detected. The article compromises obtained knowledge about the rate of emissions and the influence of meteoro- logical parameters on this phenomenon—baric tendency, difference in dry-bulb temperature between flowing gas and the atmosphere (buoyancy effect) and wind speed. In the course of the conducted research, it was detected that the highest amount of carbon dioxide emission was V CO 2 = 0.023 m 3 /s (which is 82.8 m 3 /h) when baric ten- dency of pressure drop was 0.57 hPa/h, and the difference between dry-bulb temperatures gas and atmosphere was ?4.4 °C (the highest difference in the obtained results). The rate of CO 2 emissions varied from 12.7 to 162.3 kg CO 2 =h. Carbon dioxide was detected up to 43 m from the shaft. The results can be considered as a general conclusion about gas behavior when it flows from the underground sites to the surface in natural conditions and about gas concentrations near a point of emission, espe- cially in the case of former mines. However, it may also be useful for other applications, e.g., the leakages from installations of underground coal gasification, or gas drainage. Keywords Carbon dioxide emissions Coal mine closure Gas hazard Underground coal gasification (UCG) Gas leakage Introduction The main repercussions of coal mine closure are: land subsidence, rising underground water levels and its further contamination (Suponik and Blanko 2014) and gas migration into the atmosphere (Sulkowski et al. 2008). Carbon dioxide is the most common of all gases in a coal mine. It is also considered as greenhouse gas. CO 2 is the primary anthropogenic greenhouse gas, accounting for 77 % of the human contribution to the greenhouse effect in a recent decade (26–30 % of all CO 2 emissions) (Son- golzadeh et al. 2014). However, apart from environmental issues, gas emis- sions (including CO 2 ) from closed mines can also create a local public safety hazard (Creedy 1993; Prokop 2001). Considering abandoned mines and mines which are cur- rently operational, methane emissions are expected to appear, too (Cheng et al. 2011; Ostrowski et al. 2015; Yiwen et al. 2016). The literature studies indicate that gas can be detected mainly above faults and closed shafts (Annunziatellis et al. 2008; Wrona 2010). The term ‘‘closed’’ refers to a shaft which is temporarily or partly closed, but it can be left ‘‘open’’ for special purposes, e.g., water pumping, which is a common situation in The Upper Silesia Coal Basin (USCB) in Poland. There are 31 such shafts used for this purpose. An ‘‘open’’ shaft has been selected for the examinations (‘‘Gliwice II’’ shaft). The second problem is sudden collapse of filling mate- rial in an abandoned or closed shaft. Such a situation can be & Pawel Wrona [email protected] 1 Silesian University of Technology, ul. Akademicka 2A, 44-100 Gliwice, Poland 123 Environ Earth Sci (2016) 75:1139 DOI 10.1007/s12665-016-5977-7
-
Upload
nguyendiep -
Category
Documents
-
view
217 -
download
0
Transcript of Closed coal mine shaft as a source of carbon dioxide emissions … · Closed coal mine shaft as a...

ORIGINAL ARTICLE
Closed coal mine shaft as a source of carbon dioxide emissions
Paweł Wrona1• Zenon Ro _zanski1 • Grzegorz Pach1
• Tomasz Suponik1•
Marcin Popczyk1
Received: 29 April 2016 / Accepted: 2 August 2016 / Published online: 8 August 2016
� The Author(s) 2016. This article is published with open access at Springerlink.com
Abstract The closure of coal mines does not terminate
their impact on the environment. Gas emissions into the
atmosphere are the one of the problems. The closed
‘‘Gliwice II’’ shaft has been selected for a series of mea-
surements to assess greenhouse gas emissions from the
closed mine; however, only CO2 emission has been
detected. The article compromises obtained knowledge
about the rate of emissions and the influence of meteoro-
logical parameters on this phenomenon—baric tendency,
difference in dry-bulb temperature between flowing gas
and the atmosphere (buoyancy effect) and wind speed. In
the course of the conducted research, it was detected that
the highest amount of carbon dioxide emission was
VCO2= 0.023 m3/s (which is 82.8 m3/h) when baric ten-
dency of pressure drop was 0.57 hPa/h, and the difference
between dry-bulb temperatures gas and atmosphere was
?4.4 �C (the highest difference in the obtained results).
The rate of CO2 emissions varied from 12.7 to
162.3 kgCO2=h. Carbon dioxide was detected up to 43 m
from the shaft. The results can be considered as a general
conclusion about gas behavior when it flows from the
underground sites to the surface in natural conditions and
about gas concentrations near a point of emission, espe-
cially in the case of former mines. However, it may also be
useful for other applications, e.g., the leakages from
installations of underground coal gasification, or gas
drainage.
Keywords Carbon dioxide emissions � Coal mine closure �Gas hazard � Underground coal gasification (UCG) � Gas
leakage
Introduction
The main repercussions of coal mine closure are: land
subsidence, rising underground water levels and its further
contamination (Suponik and Blanko 2014) and gas
migration into the atmosphere (Sułkowski et al. 2008).
Carbon dioxide is the most common of all gases in a coal
mine. It is also considered as greenhouse gas. CO2 is the
primary anthropogenic greenhouse gas, accounting for
77 % of the human contribution to the greenhouse effect in
a recent decade (26–30 % of all CO2 emissions) (Son-
golzadeh et al. 2014).
However, apart from environmental issues, gas emis-
sions (including CO2) from closed mines can also create a
local public safety hazard (Creedy 1993; Prokop 2001).
Considering abandoned mines and mines which are cur-
rently operational, methane emissions are expected to
appear, too (Cheng et al. 2011; Ostrowski et al. 2015;
Yiwen et al. 2016).
The literature studies indicate that gas can be detected
mainly above faults and closed shafts (Annunziatellis et al.
2008; Wrona 2010). The term ‘‘closed’’ refers to a shaft
which is temporarily or partly closed, but it can be left
‘‘open’’ for special purposes, e.g., water pumping, which is
a common situation in The Upper Silesia Coal Basin
(USCB) in Poland. There are 31 such shafts used for this
purpose. An ‘‘open’’ shaft has been selected for the
examinations (‘‘Gliwice II’’ shaft).
The second problem is sudden collapse of filling mate-
rial in an abandoned or closed shaft. Such a situation can be
& Paweł Wrona
1 Silesian University of Technology, ul. Akademicka 2A,
44-100 Gliwice, Poland
123
Environ Earth Sci (2016) 75:1139
DOI 10.1007/s12665-016-5977-7

observed even long time after the closure of a shaft, (e.g.,
after 70 years) (e.g., Wrona 2010). This process, which is
caused by underground water eluviations of filling mate-
rial, can lead to unexpected gas emissions or significant gas
hazard at the surface. Similar problems were detected in
the UK, Germany, France, China, South Africa, the Czech
Republic, Poland etc. (Thieleman et al. 2000; Prokop 2001;
Creedy et al. 2003; Hall et al. 2006; Sułkowski et al. 2008;
Lagny et al. 2013; Mhlongo and Amponsah-Dacosta 2015).
The problems of gas leakage from underground sites are
not only the problem of abandoned coal mines. It is also
possible in other operations, e.g., as a result of some break
down or emergency situation during gas drainage, during
underground coal gasification (UCG) (e.g., Jones and
Thune 1982; Lewicki et al. 2007) or during carbon capture
and storage (CCS) (e.g., Bateson et al. 2008; Karacan et al.
2011; Labus and Bujok 2011; Moni and Rasse 2013;
Paulley et al. 2013). Leakage of CO2 through plugged and
abandoned wellbores is one of the major concerns for long-
term safety and effectiveness of geologic CO2 sequestra-
tion (Pawar et al. 2009).
Potential UCG or CCS sites include geologic formations
with cap rocks of low permeability to trap CO2 and prevent
migration back into the atmosphere. However, leakage
through this caprock via wells or faults and fractures is
possible (Esposito and Benson 2011). It can lead to termi-
nation of the processes and/or to gas hazard at the surface.
This indicates that the obtained results have an inter-
national context and the problem is not limited locally to
Poland and not only to underground mining.
The assessment of possible rate of emissions and
determination of influencing factors were the base for
starting up the research into this matter.
Preliminary surveys at selected shaft showed that there
were significant carbon dioxide emissions into the atmo-
sphere. Low concentrations of oxygen have been detected,
too. The results obtained during preliminary surveys (Fe-
bruary–September 2014) are attached in Table 1.
Apart from other factors, which can be considered as
‘‘mining and geology factors’’ (e.g., gas bearing capacity,
geological structure, level of underground water, presence
of faults etc.), the process of gas emissions strongly
depends on atmospheric pressure changes (Sulkowski and
Wrona 2006), and the emissions are noted mainly during
pressure drops. Examinations conducted by Sulkowski and
Wrona (2006), Wrona (2015) pointed out that the process
(gas flux rate) depends more on a baric tendency assigned
as TB (TB is a change of pressure in a unit of time com-
puted for three previous hours and in this article is assigned
a positive value; however, it is referred to here as a pres-
sure drop) rather than on a momentary pressure value. The
difference in temperature between the gas and the atmo-
sphere, expressed in this article as Dtd = td(gas) - td(atm),
leads to the buoyancy effect and is another important
factor.
The issues mentioned have been taken into the consid-
eration in response to air protection and public health
concerns in the surrounding area. This is especially the
case at former-mining sites or above the sites where gas is
being produced (UCG), transported (gas drainage) or
located (CCS).
The site
The abandoned Gliwice II shaft (Fig. 1) (50�16038.800N18�41001.200E/50.277435. 18.683663) [the depth 553.2 m,
(-316.5 m below the sea level)] is located at a revitalized
(post-coal mining and very urban environment) area of a
closed ‘‘Gliwice’’ coal mine.
However, the local ‘‘Sosnica–Makoszowy’’ coal mine,
which is currently operational, requires the ‘‘Gliwice II’’
shaft for water pumping purposes. ‘‘Gliwice II’’ was a main
shaft of the former ‘‘Gliwice’’ coal mine, and it was closed
in 2000.
The abandoned ‘‘Gliwice II’’ shaft is located within the
new (modern) industrial area. The site is between the
buildings belonging to The Management College in Gli-
wice (east side) and Future Processing Company (FPark
and a kindergarten, west side). The close location of these
buildings focuses, on one hand, more attention on safety
aspects and, on the other hand, a lack of sprawl in the north
and south directions, which produces a sort of unique wind
tunnel structure (a kind of trench) for wind direction
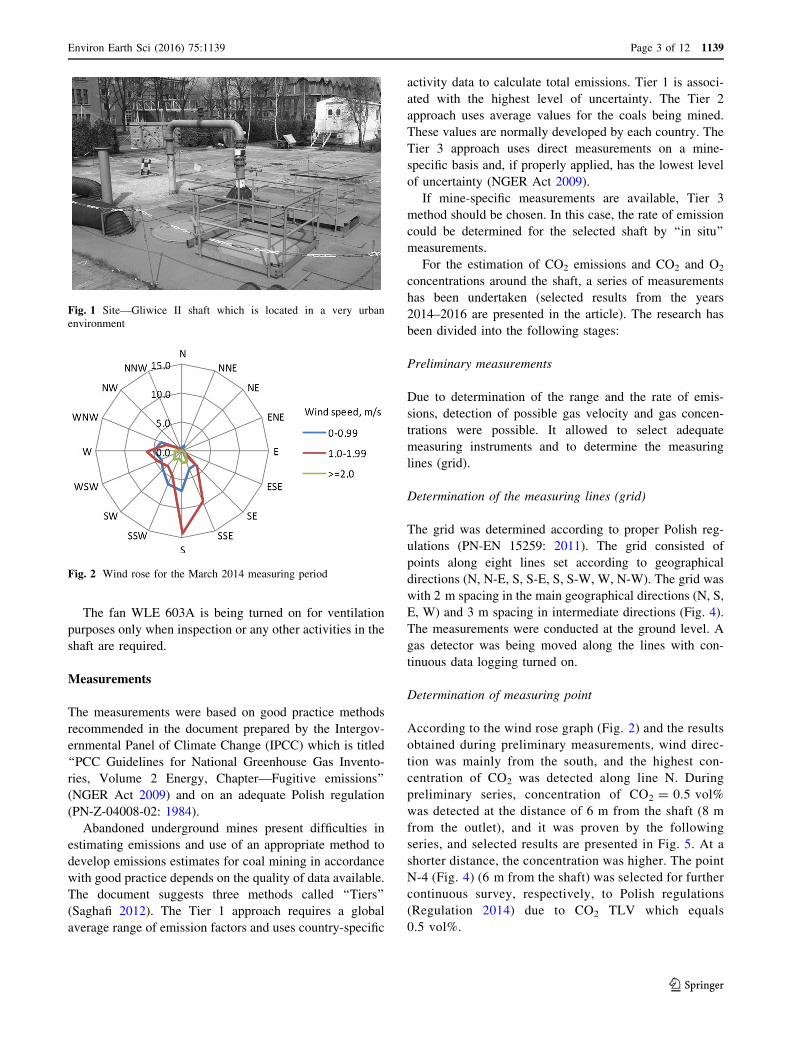
(mainly from the south). The example of a wind rose for
the March measuring period is presented in Fig. 2. It is
quite clear that the southern direction of the wind was
dominant.
The layout of the shaft which includes a water pumping
system is presented in Fig. 3.
Three coal seams with an access to goafs area cross the
shaft at three levels: ?154.0, -55.9, -152.2 m (according
to the sea level).
Table 1 Results of gas
concentrations obtained during
preliminary measurements
Gas concentration Velocity of gas w (m/s)
O2 (vol%) CO2 (ppm) CO (ppm) CH4 (ppm)
Range 11.2–20.7 940–29,520 0.0 0.0 0.52–1.5
1139 Page 2 of 12 Environ Earth Sci (2016) 75:1139
123
The fan WLE 603A is being turned on for ventilation
purposes only when inspection or any other activities in the
shaft are required.
Measurements
The measurements were based on good practice methods
recommended in the document prepared by the Intergov-
ernmental Panel of Climate Change (IPCC) which is titled
‘‘PCC Guidelines for National Greenhouse Gas Invento-
ries, Volume 2 Energy, Chapter—Fugitive emissions’’
(NGER Act 2009) and on an adequate Polish regulation
(PN-Z-04008-02: 1984).
Abandoned underground mines present difficulties in
estimating emissions and use of an appropriate method to
develop emissions estimates for coal mining in accordance
with good practice depends on the quality of data available.
The document suggests three methods called ‘‘Tiers’’
(Saghafi 2012). The Tier 1 approach requires a global
average range of emission factors and uses country-specific
activity data to calculate total emissions. Tier 1 is associ-
ated with the highest level of uncertainty. The Tier 2
approach uses average values for the coals being mined.
These values are normally developed by each country. The
Tier 3 approach uses direct measurements on a mine-
specific basis and, if properly applied, has the lowest level
of uncertainty (NGER Act 2009).
If mine-specific measurements are available, Tier 3
method should be chosen. In this case, the rate of emission
could be determined for the selected shaft by ‘‘in situ’’
measurements.
For the estimation of CO2 emissions and CO2 and O2
concentrations around the shaft, a series of measurements
has been undertaken (selected results from the years
2014–2016 are presented in the article). The research has
been divided into the following stages:
Preliminary measurements
Due to determination of the range and the rate of emis-
sions, detection of possible gas velocity and gas concen-
trations were possible. It allowed to select adequate
measuring instruments and to determine the measuring
lines (grid).
Determination of the measuring lines (grid)
The grid was determined according to proper Polish reg-
ulations (PN-EN 15259: 2011). The grid consisted of
points along eight lines set according to geographical
directions (N, N-E, S, S-E, S, S-W, W, N-W). The grid was
with 2 m spacing in the main geographical directions (N, S,
E, W) and 3 m spacing in intermediate directions (Fig. 4).
The measurements were conducted at the ground level. A
gas detector was being moved along the lines with con-
tinuous data logging turned on.
Determination of measuring point
According to the wind rose graph (Fig. 2) and the results
obtained during preliminary measurements, wind direc-
tion was mainly from the south, and the highest con-
centration of CO2 was detected along line N. During
preliminary series, concentration of CO2 = 0.5 vol%
was detected at the distance of 6 m from the shaft (8 m
from the outlet), and it was proven by the following
series, and selected results are presented in Fig. 5. At a
shorter distance, the concentration was higher. The point
N-4 (Fig. 4) (6 m from the shaft) was selected for further
continuous survey, respectively, to Polish regulations
(Regulation 2014) due to CO2 TLV which equals
0.5 vol%.
Fig. 1 Site—Gliwice II shaft which is located in a very urban
environment
Fig. 2 Wind rose for the March 2014 measuring period
Environ Earth Sci (2016) 75:1139 Page 3 of 12 1139
123

Measurements of meteorological parameters and gas
parameters
Atmospheric pressure has been measured and recorded
constantly for the baric tendency set. Other parameters for
the gases and air (dry-bulb temperature, wet-bulb temper-
ature, velocity) were measured during the tests using
Assmann’s psychrometer and vane anemometer. In addi-
tion, other meteorological data were measured in the
immediate vicinity of the shaft with the application of
‘‘Atmosphere Parameters Recorder’’ RPA-1 and multi-
functional device ‘‘Kestrel 4500’’. Presented below is a
brief specification of the instrument:
RPA-1 specification:
Atmospheric pressure: 800–1300 ± 0.3 hPa
Temperature range: 0 to ?50 ± 0.5 �CRelative humidity range: 5–95 ± 2 %
Measuring interval: Dt = 1–240 s
Kestrel 4500 specification:
Wind speed range: 0.4…40 m/s,
Fig. 3 Layout of the shaft
includes a water pumping
system
1139 Page 4 of 12 Environ Earth Sci (2016) 75:1139
123

Wind direction range: 0…360� (measurement uncer-
tainty ±5�).
Estimation of total gas flux rate and CO2 flux rate
The cover of the shaft includes an outlet of a known cross-
sectional area (A = 0.1564 m2) which allows to perform
the anemometer measurements of gas velocity. The rate of
gas flux is computed on the basis of multiplication of cross-
sectional area and gas velocity (Eq. 1). By knowing the
concentration of CO2 in the mixture, it is possible to cal-
culate the rate of CO2 flux (Eq. 2).
The estimation of gas flux rate was based on the fol-
lowing formulas (1, 2):
_V ¼ w � A ð1Þ
where _V total volume flow (gas flux rate), m3/s; w average
gas velocity, m/s; A cross-sectional area of the outlet, m2.
_VCO2¼ rCO2
� _V ð2Þ
where _VCO2, rate of CO2 emission, m3
CO2=s; rCO2
, CO2
concentration in total volume flow.
According to IPCC guidelines (NGER Act 2009), the
fundamental equation for estimating emissions from
abandoned underground coal mines is shown as Eq. (3)
CO2 emissions ¼ _VCO2� CO2rec
VCO2 total ¼ _VCO2� VCO2rec
ð3Þ
where VCO2 total total CO2 emission rate, m3CO2
=s; VCO2rec
CO2 emissions recovered, m3CO2
=s.
In the case of Gliwice II shaft, there is no gas recovery;
therefore, Eq. (3) can be transferred in Eq. (4)
CO2 emissions ¼ _VCO2
VCO2 total ¼ _VCO2
ð4Þ
Uncertainty assessment
The Tier 3 methodology has lower associated uncertainty
than Tiers 1 and 2 because the emissions inventory is based
either on direct measurements or on mine-specific infor-
mation including active emission rates and mine closure
dates (NGER Act 2009).
Fig. 4 Measuring lines (grid)
Fig. 5 Comparison of CO2
concentration along S–N and
W-E lines
Environ Earth Sci (2016) 75:1139 Page 5 of 12 1139
123

According to (Mutmansky and Wang 2000; NGER Act
2009), spot measurements of gas concentration in ventila-
tion air are probably accurate to ±20 %, depending on the
equipment used. Ventilation airflows are usually fairly
accurately known (±2 %). When combining the inaccu-
racies in emissions concentration measurements with the
imprecision due to measurement and calculation of
instantaneous measurements, the overall emissions for an
individual mine may be underrepresented by as much as
10 % or overrepresented by as much as 30 %.
The outlook of applied instruments for the measurements
of CO2 and O2 concentrations at the outlet of the shaft
and at the points of the grid
The measurements were taken by the following devices:
MultiRae IR
Plus
CO2 range 0–50000 ppm (non-dispersive
infrared sensor) with resolution 10 ppm,
O2 range 0–30 vol% with resolution
0.1 vol% (electrochemical sensor)
Crowcon
Custodian
CH4 range 0–100 % LEL
(electrochemical sensor), CO range
0–500 ppm (electrochemical sensor).
Results and discussion
The results are collected in the following subchapters. They
comprise measurements of gas concentrations along N line,
at N-4 point, the influence of wind speed on gas concen-
trations at this point, determination of momentary CO2
emission rate and a relation between gas flux rate and baric
tendency.
CO2 and O2 concentrations: the lines
CO2 and O2 concentrations have been measured continu-
ously along the lines presented in Fig. 4. During measuring
series, it was found that main wind direction (from the
south according to the wind rose in Fig. 2) gives main line
N for CO2 emissions.
Comparison of CO2 and O2 concentrations along main
lines is presented in Figs. 5 and 6.
Change of CO2 concentration along N line on different
days is presented in Fig. 7.
The highest concentration of CO2 was noticed at the
outlet, and then it decreased down to 43 m (series 8) from
the shaft where it reached the background value. The
change of CO2 concentration along the N line is described
by the lines in the Fig. 6. Except two cases (series 7 and
series 8), it can be noticed that the distance 6 m from the
shaft indicates the point where CO2 concentration equals
0.5 vol% or less.
Figure 8 shows change of oxygen concentration along N
line for different days. Similarly to CO2 results, except the
same lines (series 7 and series 8), 6 m from the shaft is the
point where oxygen concentration equals 20.0 % or more.
N-4 point
Considering N line as main path for air pollution spread
(according to wind rose and achieved results) and dis-
cussing the change of concentration of CO2 along this line
due to TLV regulations (Regulation 2014), point N-4 was
selected for further continuous measurements (it is
explained in p.2.2). The results are presented in Fig. 9.
The devices were set at the point N-4 and data logging
was turned on at 8:24. On that day, pressure started to fall
in the same time. The measurements lasted until 18:18. The
pressure changed from 998.8 to 992.2 hPa, and CO2 con-
centration started to increase significantly about 14:06.
Several peaks of CO2 concentration can be observed in
Fig. 9. The highest recorded value of CO2 concentration
was 1210 ppm at 18:05.
It was noticed that CO2 detection at N-4 point was not
detected at the beginning of the pressure drop, but at 14:06.
It is also important that when wind speed exceeded
0.5 m/s, CO2 concentration was getting low, up to
600 ppm. Peaks of CO2 concentration were when wind
speed was lower than 0.5 m/s.
However, the change of CO2 concentration should be
compared with wind speed at the measuring point. The
results of this comparison are presented in Fig. 10.
Carbon dioxide detection at N-4 point started at 14:06.
Looking in the Figs. 10 and 11 (where the diagram is
zoomed out to be clearer), the relation between values of
wind speed and values of carbon dioxide concentration can
be observed.
Figure 11 presents significant momentary peaks of carbon
dioxide concentration which equal from 730 to 1290 ppm.
Every peak is related to wind speed decrease below 0.5 m/s.
Gas flux rate: the influence of baric tendency
and buoyancy
During the measurements, CO2 emission rate varied
between 0.0018 m3CO2
=s (6.48 m3CO2
=h) and 0.023 m3CO2
=s
(which is 82.8 m3CO2
=h). Assuming CO2 density to be of
1.96 kg/m3, it can be stated that CO2 emission varied from
12.7 to 162.3 kgCO2=h.
According to present state of the art, apart from ‘‘mining
and geological’’ factors, gas emissions from underground
1139 Page 6 of 12 Environ Earth Sci (2016) 75:1139
123

sites are forced by meteorological factors, mainly baric
tendency of pressure drop and buoyancy effect (Hikle
1994; Sulkowski and Wrona 2006; Wrona 2015).
Figure 12 shows the results of conducted research into
the influence of baric tendency on carbon dioxide emis-
sions from the shaft. It can be observed that rising baric
tendency makes carbon dioxide emissions more intense,
except values of TB = 0.6 and 0.67 hPa/h. To explain the
obtained results, the effect of buoyancy was checked. The
findings gave a possibility to determine the principal for-
mulas describing relation between TB VCO2, Vgas, and CO2
concentration. They are included in Fig. 12.
The results were based on the measurements of dry-bulb
temperature of the gas and the atmosphere. The difference
between them expressed as Dtd can accelerate or slow
down the process of gas emissions.
Fig. 6 Comparison of O2
concentration along S–N and
W-E lines
Fig. 7 Change of CO2
concentration along N line on
different series
Fig. 8 Change of O2
concentration along N line on
different series
Environ Earth Sci (2016) 75:1139 Page 7 of 12 1139
123

The results are presented in Fig. 13.
Figure 13 shows additional aspect of gas emissions from
underground sites—the influence of Dtd. It results in the
buoyancy effect. The relation between Dtd and VCO2is
included in Fig. 13; however, relatively small value of R2
gives an information that further research into this matter is
required.
Analyzing Figs. 12 and 13, it was found that only on
2 days (when TB = 0.53 hPa/h and TB = 0.57 hPa/h), Dtdwas positive, and it was 1.0 and 4.4 �C (the two points in
the right part of Fig. 13). It means that on these days, gas
was warmer than the atmosphere, and it led to the accel-
eration of the process. It explains the highest rate of carbon
dioxide emissions noticed in the Fig. 11 when
TB = 0.57 hPa/h. In the other cases, Dtd was negative. It
leads to conclusion that the buoyancy effect can accelerate
the process, and it should also be considered as an
important factor for gas emissions through the shaft.
During the conducted research, it was detected that the
highest rate of carbon dioxide emissions VCO2= 0.023
m3CO2
=s (82.8 m3CO2
=h) was when baric tendency TB =
0.57 hPa/h, and Dtd was the highest and equaled ?4.4 �C.
Discussion
Maximal CO2 emissions rate from the shaft was
162.3 kgCO2=h. Assuming 24 h and 365 days for CO2
outflow, it can be computed that CO2 emissions could be
up to 1421 Mg CO2/year.
Fig. 9 Example of change of
CO2 concentration and pressure
at N-4 point
Fig. 10 Change of CO2
concentration and wind speed at
N-4 point
1139 Page 8 of 12 Environ Earth Sci (2016) 75:1139
123

The result could be compared with other anthropogenic
or natural releases, e.g., landfill, mines in operation, road
transport or combustion processes.
Considering gas emissions from burning coal waste dumps,
it was measured that CO2 emissions from 1 m2 of a dump with
intense fire were 8375 kg CO2/year (Ro_zanski et al. 2015).
Fig. 11 Selected times—
change of CO2 concentration
and wind speed at N-4 point
Fig. 12 Change of CO2
emissions (VCO2), gas flux (Vgas)
and CO2 concentration in the
gas according to different baric
tendency (TB) for pressure drop
Fig. 13 Influence of difference
in dry-bulb temperature
between gas and the atmosphere
on CO2 emissions
Environ Earth Sci (2016) 75:1139 Page 9 of 12 1139
123

Carbon dioxide emissions by a shaft of an operational
mine are 39770 Mg CO2/year (Zgadzaj 1997). Therefore,
the obtained rate of emissions is about 3.57 %, (comparing
to operational mine); however, as it was mentioned in the
introduction, there are 31 sites of this type in Poland, so
total emissions should be larger, and currently, it is the
scope of research.
Total CO2 emissions generated as a result of heating a
typical house (based on annual consumption of
20,000 kWh) are for: oil—6.26 Mg/year, natural gas—
4.23 Mg/year, wood heating (oven dry)—0.1 Mg/year
(Report of Forestry Commission, England).
Consequently, 14,210 houses should be wood heated
during a year to obtain the same emission rate as from an
abandoned shaft (1421 Mg of CO2 for year).
Considering the significant rate of CO2 emissions from a
closed shaft and related air pollutions and gas hazard at the
surface, this process should be monitored, reported and
reduced. Sealing is the simplest one, and it gives positive
effects. However, dump bailing of cement may not provide
complete effective seals, which was proved by e.g., White
(White et al. 1992).
Therefore, there are other methods of controlling the
emissions, e.g., special outlet chimney above a shaft
allowing the gases to flow to the atmosphere at a higher
level above the ground.
Considering reduction of CO2 emissions, there are sev-
eral known methods such as: absorption, physical and
chemical solvents, physical and chemical adsorption,
cryogenic distillation, membrane separation, novel CO2
capture technologies (Songolzadeh et al. 2014). In addition,
CO2 separation can be related to recycling carbon dioxide
into concrete (Shao et al. 2010) or amine-functionalized
multi-walled carbon nanotube (Khalili et al. 2013).
Selection of a proper method (considering technical and
economical aspects) to the processes of gas emissions from
closed mining shafts requires further research.
Conclusions
‘‘Gliwice II shaft’’ was selected to determine greenhouse
gas emissions rate; however, only CO2 emissions were
detected. Nevertheless, the literature studies indicate that
during gas emissions from a closed shaft, gas concentra-
tions in the mixture can vary. It depends on the geological
factors of a particular site.
Over the 3 years of measurements, the rate of CO2
emissions varied from 12.7 to 162.3 kgCO2=h. Maximal
detected concentration of CO2 in gas mixture was
3.24 vol%, and minimal concentration of O2 was then
5.4 vol%.
The rate of emissions depends on baric tendency (TB)
and the difference between dry-bulb temperature of a gas
and of the atmosphere (Dtd), which represents the buoy-
ancy effect. The highest rate of CO2 emission was
VCO2= 0.023 m3
CO2=s (which was 82.8 m3
CO2=h) when
baric tendency of pressure drop was TB = 0.57 hPa/h, and
the difference between dry-bulb temperatures gas–atmo-
sphere was the highest (of all the series) and equaled
?4.4 �C.
Considering CO2 concentration around the source of
emissions (the shaft), the wind direction and wind speed
are important. Carbon dioxide was detected in the vicinity
of the closed coal mine shaft at the distance of up to 43 m
(at the ground level). It was in the northern direction (ac-
cording to the wind rose).
Continuous measurements conducted at the point (N-4)
located at the northern line (N) indicated that momentary
peaks of CO2 concentration are mostly at the same time as
the decrease in wind speed.
Considering the Polish regulation due to TLV level for
CO2 = 0.5 vol% at a work stand, it can be stated that a
special safe zone should be created around the shaft. In this
case, concentration of CO2 = 0.5 vol% was detected at the
distance of 8 m from the outlet or closer.
The periods of pressure drop with a high value of TB
can contribute to an increase in greenhouse gas emissions
from the shaft and local gas hazard near the shaft (or any
other source of gas emissions from underground sites e.g.,
gas drainage, UCG processes) especially when Dtd (gas
atmosphere) is positive.
Considering obtained results and related air pollutions
and gas hazard at the surface, this process should be
monitored, reported and reduced; however, selection of a
proper method requires further research.
Acknowledgments This research was carried out partly as a part of
the Polish national eco-project: ‘‘Eko-sta _z’’ no. (Ekosta _z/19/2014),
titled: ‘‘Klasyfikacja zlikwidowanych szybow kopaln wegla kamien-
nego pod katem emisji gazow cieplarnianych’’ (English: Classifica-
tion of closed coal mine shafts due to greenhouse gas emissions) and
partly during the project: HUGE2—‘‘Hydrogen Oriented Under-
ground Coal Gasification for Europe—Environmental and Safety
Aspects,’’ Research Fund for Coal and Steel RFCR-CT-2011-00002.
Our appreciation to Michał Lisecki, David Hudson and to CollTra
Translation Office for proofreading the English text.
Open Access This article is distributed under the terms of the Creative
Commons Attribution 4.0 International License (http://creativecommons.
org/licenses/by/4.0/), which permits unrestricted use, distribution, and
reproduction in any medium, provided you give appropriate credit to the
original author(s) and the source, provide a link to the Creative Com-
mons license, and indicate if changes were made.
1139 Page 10 of 12 Environ Earth Sci (2016) 75:1139
123

References
Annunziatellis A, Beaubien SE, Bigi S, Ciotoli G, Coltella M,
Lombardi S (2008) Gas migration along fault systems and
through the vadose zone in the Latera caldera (central Italy):
implications for CO2 geological storage. Int J Greenh Gas
Control 2(3/2008):353–372. doi:10.1016/j.ijggc.2008.02.003
Bateson L, Vellico M, Beaubien SE, Pearce JM, Annunziatellis A,
Ciotoli G, Coren F, Lombardi S, Marsh S (2008) The application
of remote-sensing techniques to monitor CO2-storage sites for
surface leakage: method development and testing at Latera
(Italy) where naturally produced CO2 is leaking to the
atmosphere. Int J Greenh Gas Control 2(3/2008):388–400.
doi:10.1016/j.ijggc.2007.12.005
Cheng Y-P, Wang L, Zhang X-L (2011) Environmental impact of
coal mine methane emissions and responding strategies in China.
Int J Greenh Gas Control 5(1/2011):157–166. doi:10.1016/j.
ijggc.2010.07.007
Creedy DP (1993) Methane emissions from coal related sources in
Britain: development of a methodology. Chemosphere 26(1–4/
1993):419–439. doi:10.1016/0045-6535(93)90435-8
Creedy DP, Armstrong W, Sage P, Hu Y, Sun X, Jin L, Zhang W
(2003) Reducing the environmental impact of abandoned coal
mines in China. In: 3rd international methane and nitrous oxide
conference, 17-21.XI.2003, Beijing, China
Esposito A, Benson SM (2011) Remediation of possible leakage from
geologic CO2 storage reservoirs into groundwater aquifers.
Energy Proc 4:3216–3223. doi:10.1016/j.egypro.2011.02.238
Hall J, Younger P, Glendinning S (2006) Is minewater a source of
hazardous gas? IAEG Paper Number 349,1-6, The Geological
Society of London, Great Britain
Hikle ME (1994) Environmental conditions affecting concentrations
of He, CO2, O2 and N2 in soil gases. Appl Geochem 9(1):53–63.
doi:10.1016/0883-2927(94)90052-3
Jones V, Thune H (1982) Surface detection of retort gases from an
underground coal gasification reactor in steeply dipping beds
near Rawlins, Wyoming. In: 57th annual fall technical confer-
ence and exhibition of the society of petroleum engineers of
AIME, New Orleans, LA, Sept. 26–29.1982. doi:10.2118/11050-
MS
Karacan CO, Ruiz FA, Cote M, Phipps S (2011) Coal mine methane:
a review of capture and utilization practices with benefits to
mining safety and to greenhouse gas reduction. Int J Coal Geol
86(2–3):121–156. doi:10.1016/j.coal.2011.02.009
Khalili S, Ghoreyshi AA, Jahanshahi M, Pirzadeh K (2013)
Enhancement of carbon dioxide capture by Amine-functional-
ized multi-walled carbon nanotube. Clean Soil Air Water
41(10):939–948. doi:10.1002/clen.201200339
Labus K, Bujok Peter (2011) CO2 mineral sequestration mechanisms
and capacity of saline aquifers of the Upper Silesian Coal Basin
(Central Europe)—modeling and experimental verification.
Energy 36(8):4974–4982. doi:10.1016/j.energy.2011.05.042
Lagny C, Lafortune S, Charmoille A, Pokryszka Z, Degrelle F,
Kimmel M (2013) Understanding CO2 gas production above a
partly flooded, former coal mining area. Proc Earth Planet Sci
12:7. doi:10.1016/j.proeps.2013.03.095
Lewicki JL, Birkholzer J, Tsang C-F (2007) Natural and industrial
analogues for leakage of CO2 from storage reservoirs: identifi-
cation of features, events, and processes and lessons learned.
Environ Geol 52:457–467. doi:10.1007/s00254-006-0479-7
Mhlongo SE, Amponsah-Dacosta F (2015) A review of problems and
solutions of abandoned mines in South Africa. Int J Min Reclam
Environ 5:1–16. doi:10.1080/17480930.2015.1044046
Moni AC, Rasse DP (2013) Simulated CO2 leakage experiment in
terrestrial environment: monitoring and detecting the effect on a
cover crop using 13C analysis. Energy Proc 37:3479–3485.
doi:10.1016/j.egypro.2013.06.238
Mutmansky JM, Wang Y (2000) Analysis of potential errors in
determination of coal mine annual methane emissions. Miner
Resour Eng 9:465–474. doi:10.1142/S095060980000038X
National Greenhouse and Energy Reporting (NGER), Act 2007, 2009,
National greenhouse and energy reporting (measurement) deter-
mination 2008. In: Prepared by the Office of legislative drafting
and publishing. Attorney-General’s Department, Canberra.
http://www.ipcc-nggip.iges.or.jp/public/2006gl/vol2.html
Ostrowski P, Pronobis M, Remiorz L (2015) Mine emissions
reduction installations. Appl Therm Eng 84:390–398. doi:10.
1016/j.applthermaleng.2015.03.061
Paulley A, Metcalfe R, Egan M, Maul PR, Limer L, Grimstad A-A
(2013) Hypothetical impact scenarios for CO2 leakage from
storage sites. Energy Proc 37:3495–3502. doi:10.1016/j.egypro.
2013.06.240
Pawar R, Theresa J, Watson L, Gablea CW (2009) Numerical
simulation of CO2 leakage through abandoned wells: model for
an abandoned site with observed gas migration in Alberta,
Canada. Energy Proc 1:3625–3632. doi:10.1016/j.egypro.2009.
02.158
PN-EN 15259 (2011) Jakosc powietrza. Pomiary ze zrodeł stacjo-
narnych, Wymagania dotyczace odcinkow pomiarowych, miejsc
pomiaru, celu i planu pomiaru oraz sprawozdania z pomiaru
(Eng: Air quality protection, The measurements from stationary
sources. Requirements due to measuring sections, locations, aim
and schedule of measurements, reporting), Warszawa, Poland
PN-Z-04008-02 (1984) Ochrona czystosci powietrza. Pobieranie
probek. Wytyczne ogolne pobierania probek powietrza atmos-
ferycznego (imisja), (Eng: Air quality protection, Sampling. The
principles of air sampling (gas concentration)), Warszawa,
Poland
Prokop P (2001) Gas leak effects on environment of Ostrava basin. In:
Research & Development Center EMAG (eds) Proceedings of
the 7th international mine ventilation congress. Krakow
(Poland). ISBN: 83 91310914
Regulation (2014) Rozporzadzenie Ministra Pracy i Polityki
Społecznej z dnia 6 czerwca 2014 r. w sprawie najwy _zszych
dopuszczalnych ste _zen i nate _zen czynnikow szkodliwych dla
zdrowia w srodowisku pracy, Dz.U. 2014 poz. 817, (Eng: The
Regulation of Minister of Labour and Social Policy due to TLV
levels and intensity of harmful agents at work place)
Report of Forestry Commission, A Woodfuel Strategy for England.
http://www.stovesonline.co.uk/stove-chimney-documentation/
fce-woodfuel-strategy.pdf
Ro _zanski Z, Wrona P, Suponik T, Pach G, Popczyk M, Jendrus R
(2015) Former coal mining sites—selected examples of their
influence on the Upper Silesia atmosphere. In: Proceedings of
the scientific contributions from the international conference
‘‘Environmental changes in landscape as consequence of min-
ing’’. 25–26.02.2015, Jablunkov, Czech Republic, pp 77–82.
ISBN: 978-80-248-3673
Saghafi A (2012) A Tier 3 method to estimate fugitive gas emissions
from surface coal mining. Int J Coal Geol 100:14–25. doi:10.
1016/j.coal.2012.05.008
Shao Y, Monkman S, Boyd AJ (2010) Recycling carbon dioxide into
concrete: a feasibility study. In: NRMCA, Concrete Sustainabil-
ity Conference, Dubai, UAE, 1–10
Songolzadeh M, Soleimani M, Ravanchi MT, Songolzadeh R (2014)
Carbon dioxide separation from flue gases: a technological
review emphasizing reduction in greenhouse Gas emissions. Sci
World J 2014:1–35. doi:10.1155/2014/828131
Sułkowski J, Wrona P (2006) Mathematical model of gas out flow
from abandoned coal mine through untight shaft under the
Environ Earth Sci (2016) 75:1139 Page 11 of 12 1139
123

influence of atmospheric pressure changes. Arch Min Sci
51:97–107
Sułkowski J, Drenda J, Ro _zanski Z, Wrona P (2008) Noticed in
mining areas, environmental hazard connected with outflow of
gases from abandoned mines and with spontaneous ignition of
coal waste dumps. Gospodarka Surowcami Mineralnymi 24(3/
1):319–334
Suponik T, Blanko M (2014) Removal of heavy metals from
groundwater affected by acid mine drainage. Physicochem Probl
Miner Process 50(1):359–372
Thieleman T, Lucke A, Schleser GH, Littke R (2000) Methane
exchange between coal-bearing basins and the atmosphere: the
Ruhr Basin and the Lower Rhine Embayment, Germany. Org
Geochem 31(12):1387–1408. doi:10.1016/S0146-
6380(00)00104-2
White WS, Calvert DG, Barker JM (1992) A laboratory study of
cement and rasin plugs placed with thru-tubing dump bailers. In:
SPE annual technical conference and exhibition, Washington,
DC, October 4–7, USA
Wrona P (2010) The method of estimation of gas hazard near
abandoned coal mine shaft. Wiad Gor 5(2010):287–293
Wrona P (2015) Propozycja nowej metody klasyfikacji zagro _zenia
gazowego na terenach pogorniczych kopaln wegla kamiennego
(English: Proposition of a new method for classification of post-
mining areas due to gas hazard). Wiad Gor 11:584–593
Yiwen J, Yue S, Zhanyou S, Jienan P, Jilin W, Quanlin H, Qingguang
L, Zhifeng Y, Jie L (2016) A new approach to estimate fugitive
methane emissions from coal mining in China. Sci Total Environ
543:514–523. doi:10.1016/j.scitotenv.2015.11.024
Zgadzaj J (1997) Problemy zanieczyszczenia srodowiska gazami
emitowanymi przez szyby wydechowe kopaln wegla kamien-
nego cz2 (English: The problems of environment pollution by
the shafts of coal mines, part 2). Mech Autom Gor 4(321):33–39
1139 Page 12 of 12 Environ Earth Sci (2016) 75:1139
123