Close Ended 270905 Final - IDFC Mutual Funds · Nine close-ended schemes were also launched during...
108
Annual Report 2004-2005 Standard Chartered Mutual Fund CONTENTS Page Board of Directors 2 Trustee Report 3-14 Close Ended Schemes (Matured) 15-48 Grindlays Fixed Savings Scheme - Annual Plan 3, Grindlays Fixed Savings Scheme - Annual Plan 4, Grindlays Fixed Savings Scheme - Annual Plan 6, Grindlays Fixed Maturity Plan - Quarterly Plan, Grindlays Fixed Maturity Plan - 3rd Plan Auditors' Report 15-19 Balance Sheet 20-21 Revenue Account 22-23 Schedules to the Financial Statements 24-48 Close Ended Schemes (Live) 49-105 Grindlays Fixed Maturity Plan - Annual, Grindlays Fixed Maturity Plan - Annual Plan 2, Grindlays Fixed Maturity Plan - 4th Plan, Grindlays Fixed Maturity Plan - 5th Plan, Grindlays Fixed Maturity Plan - 6th Plan, Grindlays Fixed Maturity Plan - 7th Plan, Grindlays Fixed Maturity Plan - 9th Plan, Grindlays Fixed Maturity Plan - 10th Plan Auditors' Report 49-56 Balance Sheet 57-58 Revenue Account 59-62 Schedules to the Financial Statements 63-105 Risk Factors 106
-
Upload
nguyenmien -
Category
Documents
-
view
216 -
download
1
Transcript of Close Ended 270905 Final - IDFC Mutual Funds · Nine close-ended schemes were also launched during...

Annual Report 2004-2005Standard Chartered Mutual Fund
CONTENTS
Page
Board of Directors 2
Trustee Report 3-14
Close Ended Schemes (Matured) 15-48
Grindlays Fixed Savings Scheme - Annual Plan 3,Grindlays Fixed Savings Scheme - Annual Plan 4,Grindlays Fixed Savings Scheme - Annual Plan 6,Grindlays Fixed Maturity Plan - Quarterly Plan,Grindlays Fixed Maturity Plan - 3rd Plan
Auditors' Report 15-19
Balance Sheet 20-21
Revenue Account 22-23
Schedules to the Financial Statements 24-48
Close Ended Schemes (Live) 49-105
Grindlays Fixed Maturity Plan - Annual,Grindlays Fixed Maturity Plan - Annual Plan 2,Grindlays Fixed Maturity Plan - 4th Plan,Grindlays Fixed Maturity Plan - 5th Plan,Grindlays Fixed Maturity Plan - 6th Plan,Grindlays Fixed Maturity Plan - 7th Plan,Grindlays Fixed Maturity Plan - 9th Plan,Grindlays Fixed Maturity Plan - 10th Plan
Auditors' Report 49-56
Balance Sheet 57-58
Revenue Account 59-62
Schedules to the Financial Statements 63-105
Risk Factors 106

Annual Report 2004-2005Standard Chartered Mutual Fund
BOARD OF DIRECTORS
2
BOARD OF DIRECTORS
Standard Chartered Trustee Company Private Limited
Mr. Sanjeev Agrawal (Chairman)
Mr. Dattatraya M. Sukthankar
Mr. Jamsheed G. Kanga
Mr. Sukant Kelkar
Standard Chartered Asset Management Company Private Limited
Mr. Paul Jebson (Chairman)
Dr. A.C. Shah
Mr. Atul C. Choksey
Mr. Pradip Madhavji
Mrs. Bakul Patel
Mr. Naval Bir Kumar (Managing Director)
Annual Report 2004-2005Standard Chartered Mutual Fund
TRUSTEE REPORT
3
TRUSTEE REPORT
Report of the Board of Directors of the Standard Chartered Trustee Company Private Limited to the Unit-holders of
Standard Chartered Mutual Fund.
Dear Unit-holder,
The Directors of Standard Chartered Trustee Company Private Limited hereby present the Fifth Annual Report of
Standard Chartered Mutual Fund for the year ended March 31, 2005.
STANDARD CHARTERED MUTUAL FUND
Standard Chartered Mutual Fund (“SCMF” or “the Fund”) (erstwhile the ANZ Grindlays Mutual Fund) has been
constituted as a Trust vide a Trust Deed dated December 29, 1999 in accordance with the provisions of the Indian
Trust Act, 1882 (2 of 1882). The Mutual Fund was registered with the Securities & Exchange Board of India (SEBI) on
March 13, 2000.
SCMF has been sponsored by Standard Chartered Bank, with Standard Chartered Trustee Company Private Limited
(formerly known as the ANZ Grindlays Trustee Company Private Limited) (“the Trustee”) as Trustee and Standard
Chartered Asset Management Company Private Limited (formerly known as the ANZ Grindlays Asset Management
Company Private Limited) (“the AMC”) as the Investment Manager for all the Schemes of SCMF.
SCMF comprised of Fourteen Debt Funds, Six open-ended and Eight closed-ended schemes as on March 31, 2005.
The open-ended schemes were:
1) Grindlays Super Saver Income Fund (“GSSIF”) with Investment Plan, Short-Term Plan and Medium Term Plan
2) Grindlays Cash Fund (“GCF”),
3) Grindlays Government Securities Fund (“GGSF”) with Investment Plan, Short Term Plan and Provident Fund
Plan
4) Grindlays Dynamic Bond Fund (“GDBF”),
5) Grindlays Floating Rate Fund (“GFRF”) with Short Term and Long Term Plan and
6) Standard Chartered All Seasons Bond Fund (“SCASBF”).
The Close ended schemes were:
1) Grindlays Fixed Maturity Plan - Annual Plan (GFMP-A)th2) Grindlays Fixed Maturity 4 Plan (GFMP-4)
3) Grindlays Fixed Maturity Plan - Annual Plan 2 (GFMP-A2)th4) Grindlays Fixed Maturity 6 Plan (GFMP-6)th5) Grindlays Fixed Maturity 5 Plan (GFMP-5)th6) Grindlays Fixed Maturity 7 Plan (GFMP-7)th7) Grindlays Fixed Maturity 9 Plan (GFMP-9)
th8) Grindlays Fixed Maturity 10 Plan (GFMP-10)
The total Funds under Management (FuM) under the fourteen Schemes as on March 31, 2005 aggregated to
Rs. 7023.52 Crores.
Year 2004-2005 was the fifth year of operation of SCMF. Upto March 31, 2005 SCMF has launched only debt funds, with
the objective of meeting the diverse risk-return requirements of debt fund investors.
During the year under review, Grindlays Floating Rate Fund - Long Term Plan and Standard Chartered All Seasons
Bond Fund were launched. Nine close-ended schemes were also launched during the year.
The AMC is in the process of continuously building resources and as at March 31, 2005 had a fully operational AMC
office in Mumbai and sales offices in 18 cities.

Standard Chartered Mutual Fund
TRUSTEE REPORT
4 Annual Report 2004-2005
THE SPONSOR
Standard Chartered Bank (“SCB”) is a member of the Standard Chartered Group, which is a multinational banking and
financial services group with a unique emerging markets network. Standard Chartered is the world's leading emerging
markets bank and has offices in many countries in the Asia Pacific Region, South Asia, the Middle East, Africa, United
Kingdom. Through the years SCB has grown its operations and is now a truly international bank offering a wide array of
financial products and services. As an organisation, SCB is committed to delivering consistently superior performance
and to building shareholder value. With more than 150 years in the emerging markets the Bank has unmatched
knowledge and understanding of its customers in its markets.
SCB operates in India through various branches which are spread in various cities and offer a complete range of
banking and financial products. It is the largest foreign bank in India.
STANDARD CHARTERED TRUSTEE COMPANY PRIVATE LIMITED
The Trustee is a company incorporated under the Companies Act, 1956 and is the Trustee to the Fund vide Trust Deed
dated December 29, 1999 as amended from time to time. The Trustee is 100% owned by Standard Chartered Bank.
The Trustee is the exclusive owner of the Trust Fund and holds the same in trust for the benefit of the unitholders. The
Trustee seeks to ensure that the Fund and the Schemes floated thereunder are managed by the AMC in accordance
with the Trust Deed, the SEBI (Mutual Funds) Regulations, 1996 as amended from time to time, the Investment
Management Agreement, the Stock Exchanges and other regulatory agencies.
The Directors of Standard Chartered Trustee Company Private Limited are:
Mr. Sanjeev Agrawal: He is a Chartered Accountant and the Chief Financial Officer - India & South Asia Region of
Standard Chartered Bank with responsibilities for Service Delivery & Technology, Finance, Legal & Compliance
and Strategic Sourcing & Property Management. He had successfully managed the integration process of Standard
Chartered Bank and Standard Chartered Grindlays Bank. His efforts were recognized by the Indian Management
Association (IMA) and he was awarded the CFO of the year award in the “Mergers & Acquisitions” category for the
year 2002. Prior to this assignment he was associated with Tata Steel, Bombay and with Price Waterhouse-New
Delhi.
Mr. Dattatraya M. Sukthankar: In his career spanning over 34 years till 1990 as an IAS Officer, had held very important
portfolios in the Govt. of Maharashtra including that of Secretary - Education Department, Secretary - Industries Dept,
Metropolitan Commissioner, Municipal Commissioner - Greater Bombay, and finally as Chief Secretary to the Govt. of
Maharashtra. He was also the Secretary, Ministry of Urban Development, Govt. of India for two years.
Mr. Jamsheed G. Kanga: In his career as an I A S officer, had held various important positions including that of
Managing Director - Maharashtra State Agro Industries Development Corporation and Maharashtra State Tourism
Development Corporation, Joint Secretary - Finance Department, Maharashtra State, Joint Secretary (Projects &
Finance) - Department of Atomic Energy, Secretary to Government of Maharashtra, Municipal Commissioner -
Bombay Municipal Corporation, Chairman and Managing Director - Export Credit Guarantee Corporation of India in the
rank of Secretary to Government of India. After retirement, he had been the Vice-Chairman and Managing Director of
Tata Housing Development Co. Ltd. and now is a Senior Corporate Advisor to Tata Housing Development Co. Ltd. from
April 1997. He is also a Consultant to Forbes Gokak Limited.
Mr. Sukant Kelkar: He was initially associated with Bank of India. He has ben associated with Bombay Dyeing & Mfg.
Co. Ltd. since 1972. He was the Executive Director (Finance) in Bombay Dyeing & Mfg. Co. Ltd. for a period of 7 years
and still continues to be a Non - Executive Director, Member of Audit Committee and Investors Greivance Committee of
the Board of Bombay Dyeing & Mfg. Co. Ltd.

Standard Chartered Mutual Fund
TRUSTEE REPORT
5 Annual Report 2004-2005
STANDARD CHARTERED ASSET MANAGEMENT COMPANY PRIVATE LIMITED
As at March 31, 2005 equity share capital of the AMC was held 75% by Standard Chartered Bank and 25% by the Atul
C. Choksey Group of Companies. The AMC formerly known as ANZ Grindlays Asset Management Company Private
Limited was sponsored by the ANZ Banking Group, the holding of ANZ was acquired by Standard Chartered Bank and
subsequently on March 13, 2001 the name of the AMC was changed to Standard Chartered Asset Management
Company Private Limited. The AMC is the Investment Manager for all the Schemes under SCMF.
The Directors of Standard Chartered Asset Management Company Private Limited as at March 31, 2005
were:
Mr. Paul Jebson: He is the Head - Funds Management, Global Markets with Standard Chartered Bank. He has been
associated with Standard Chartered Bank since June 1977 with responsibilities of institutional and commercial bank
sales and marketing and treasury functions. He was the Group Head of Institutional and Commercial Bank Sales and
Marketing from 1999 to 2001 and the Global Head of Treasury Bank relationships from 1998 to 1999.
Dr. A. C. Shah: He completed his M.A. & Ph.D (Economics) from the University of Bombay. He retired as the Chairman
and Managing Director of Bank of Baroda after a meritorious service of over 30 years during which he held many
responsible positions in the bank. He was advisor to UTI for setting up UTI Bank.
Mr. Atul C. Choksey: He is a Chemical Engineer from Illinois Institute of Technology, Chicago, USA. He had also
completed courses in management disciplines like Finance, Personnel, Micro and Macro Economics, etc. during his
stay abroad. He is the Chairman of Apcotex Lattices Limited, Apcotex Financial Services Limited and Apcotex Infoway
Private Limited as well as other group companies. He was the Managing Director of Asian Paints (India) Limited from
1984 to 1997.
Mr. Pradip Madhavji: He was the Chairman of Thomas Cook (India) Limited for 8 years and was responsible for
enhancing its position externally, through further strengthening the company's relationships with business
partners, trade bodies and associates. He was with Thomas Cook since 1977 and has held senior positions as
Managing Director, Deputy Chairman & Managing Director & Executive Chairman. Prior to this he was with Dena
Bank for over 18 years where at the time of leaving he was in charge of the entire foreign exchange function of the
Bank.
Mrs. Bakul Patel: She is a Chartered Secretary from the Chartered Institute of Companies Secretary, U.K. She is a
Member of Zonal Advisory Board, Western Zone, Life Insurance Corporation of India and Western Regional Advisory
Committee, Industrial Development Bank of India. She was the Chairperson of Maharashtra State Financial
Corporation from 1992 to 1995 and was the Sheriff of Mumbai from 1992 - 1993. She was a member on the Indian
Advisory Board, Standard Chartered Grindlays Bank.
Mr. Naval Bir Kumar: He is a rank holder in Mathematics from Bombay University and completed his MBA from the
Indian Institute of Management, Calcutta. He is the Managing Director of Standard Chartered Asset Management
Company Private Limited. Prior to this he was Director & Head - Originations of Global Capital Markets for ANZ
Investment Bank. In this role he handled debt and equity capital market transactions for a number of leading Indian
corporates and was successful in improving the Bank's position in the domestic capital markets from 193 to number 6.
He is also on the Board of the Association of Mutual Funds of India (“AMFI”).
Industry Review and Future Outlook
The mutual fund industry grew rapidly in 2004-2005 from Rs 1,39,616 crores as on March 31, 2004 to Rs 1,49,600
crores as on March 31, 2005. Money continued to shift from pure debt funds to equity and hybrid funds. Equity oriented

6
TRUSTEE REPORT
Standard Chartered Mutual Fund Annual Report 2004-2005
and hybrid funds registered the highest growth in AUM over the previous year as indicated below
The upward direction in interest rates that started in April 2004 continued into April 05. Since then interest rates have
moved into a groove and has been range bound. While the huge growth momentum in the economy and record high
nominal oil prices are keeping interest rates high, huge foreign capital flows and low to stable non-fuel commodity
inflation are preventing interest rates from rising further. In this scenario, we see range bound movement in interest
rates.
The underlying risks to interest rates spiking further are
1. High Global oil prices translating to local inflation
2. Sustenance of the US interest rate cycle.
CATEGORY WISE AUM & GROWTH OVER PREVIOUS YEAR
0
10,000
20,000
30,000
40,000
50,000
60,000
70,000
Gro
wth
Mo
ne
y
Ma
rke
t
Ba
lan
ce
d
Inco
me
Gilt
52.22%
29.65%
19.29%
-23.86%
-24.06%
Mar-05 Mar-04
% Share Mar-04% Share Mar-05
Growth - 26%
Money Market -36%
Balanced -3%
Income -32%
Gilt - 3% Gilt - 4%
Growth - 18%
Money Market -30%Balanced -
3%
Income -45%

Standard Chartered Mutual Fund 7
TRUSTEE REPORT
Annual Report 2004-2005
DETAILS OF CLOSE ENDED SCHEME AS ON MARCH 31, 2005
Name ofScheme
Grindlays Fixed Maturity Plan - Annual Plan(GFMP-A)
Grindlays Fixed Maturity Plan - Annual Plan 2 (GFMP-A2)
Grindlays Fixed
rdMaturity 3 Plan (GFMP - 3)
Grindlays Fixed thMaturity 4 Plan
(GFMP - 4)
Grindlays Fixed thMaturity 5 Plan
(GFMP - 5)
Grindlays Fixed thMaturity 6 Plan
(GFMP - 6)
Grindlays Fixed thMaturity 7 Plan
(GFMP - 7)
Grindlays Fixed
thMaturity 9 Plan (GFMP - 9)
Grindlays Fixed thMaturity 10 Plan
(GFMP - 10)
InvestmentObjective
To achieve growth of capital by investing in a portfolio of fixed income securities normally in line with the m a t u r i t y p r o f i l e o f respective Plan(s)
To achieve growth of capital by investing in a portfolio of fixed income securities normally in line with the duration of the respective Plan(s).
To achieve growth of capital by investing in a portfolio of fixed income securities normally in line with the duration of the respective Scheme.
To achieve growth of capital by investing in a portfolio of fixed income securities normally in line with the duration of the Scheme.
To achieve growth of capital by investing in a portfolio of fixed income securities normally in line with the duration of the Scheme
To achieve growth of capital by investing in a portfolio of fixed income securities normally in line with the duration of the Scheme.
To achieve growth of capital by investing in a portfolio of fixed income securities normally in line with the duration of the Scheme
To achieve growth of capital by investing in a portfolio of fixed income securities normally in line with the duration of the Scheme.
To achieve growth of capital by investing in a portfolio of fixed income securities normally in line with the duration of the Scheme.
Investment Strategy
To invest in debt and money market instruments having duration in line with the maturity profile of the plans of the scheme.
To invest in debt and money market instruments having a duration in line with the maturity profile of the plans of the scheme.
To invest in debt and money market instruments having a duration in line with the maturity profile of the plans of the scheme
To invest in debt and money market instruments having a duration in line with the maturity profile of the plans of the scheme.
To invest in debt and money market instruments having a duration in line with the maturity profile of the plans of the scheme
To invest in debt and money market instruments having a duration in line with the maturity profile of the plans of the scheme.
To invest in debt and money market instruments having a duration in line with the maturity profile of the plans of the scheme.
To invest in debt and money market instruments having a duration in line with the maturity profile of the plans of the scheme.
To invest in debt and money market instruments having a duration in line with the maturity profile of the plans of the scheme.
Launch & Allotment dates
March 10, 2004&
March 31, 2004
August 16, 2004&
August 27, 2004
November 24, 2004
&November 27,
2004
March 9, 2005&
March 31, 2005
December 24, 2004
&December 30,
2004
November 18, 2004
&December 16,
2004
January 24, 2005&
February 10, 2005
February 7, 2005&
February 28, 2005
February 25, 2005
&February 28,
2005
FUM &NAV (Rs.)
301.40 Crs.&
10.5380
145.18 Crs.&
10.3553
Matured onFebruary 25,
2005
211.98 Crs.&
10.0000
147.84 Crs.
&10.1874
292.14 Crs.&
10.2672
225.27 Crs. &10.1066 - Plan A,
10.1114 - Plan B
32.64 Crs.&
9.9819
298.26 Crs.&
10.0469

Standard Chartered Mutual Fund 8
TRUSTEE REPORT
Annual Report 2004-2005
OPEN ENDED SCHEMES :
GRINDLAYS SUPER SAVER INCOME FUND - INVESTMENT, SHORT TERM & MEDIUM TERM PLANS
(“GSSIF-IP, ST & MT”)
The primary investment objective of the Scheme is to seek to generate stable returns with low risk strategy by creating a
portfolio that is invested in good quality fixed income and money market securities.
To achieve the above objective the underlying investment strategy is to endeavour to allocate the assets of the scheme
between various fixed income securities with the objective of achieving consistent returns.
The Scheme has three Plans viz. an Investment Plan, Short Term Plan & a Medium Term Plan. The objective of the
Investment Plan of the Scheme is to provide stable returns and generally it will have a medium term maturity profile. It
will provide stable returns over a relatively longer period of investment. The Plan attempts to maximise returns by
moving the duration of the portfolio in line with interest rate changes. In a rising interest rate environment the duration of
the fund will be reduced to protect returns and in a declining interest rate scenario the duration will be increased to
improve returns.
The Short term Plan is designed for investors seeking stable returns over shorter periods and it will generally have a
much shorter average maturity of assets thereby providing consistent returns even over shorter periods of investment.
The Medium Term Plan is designed for investors seeking a long term investment option and it will generally have a
medium term maturity profile. It will provide stable returns over a relatively longer tenor period of investment.
The Funds Under Management (“FuM”) of the Investment Plan as of March 31, 2005 is Rs.234.53 crores (March 31,
2004 is Rs. 1635.77 crores). Plan A of the Investment Plan of the scheme has delivered a CAGR of -1.09% for last one
year and 9.83% from its inception date (i.e. the date of allotment ) of July 14, 2000 (NAV of Rs. 10.00) to March 31, 2005.
The NAV of the growth option in Plan A in the Investment Plan as of March 31, 2005 is Rs. 15.5626 (March 31, 2004 is
Rs. 15.7339 for Plan A).
The FuM of the Short Term Plan as of March 31, 2005 is Rs. 78.34 crores (March 31 2004 is Rs. 897.77 crores). Plan A of
the Short Term Plan of the Scheme has delivered a CAGR of 3.71% for last one year and 6.77% from its inception (i.e.
date of allotment) date of December 14, 2000 (NAV of Rs. 10.00) to March 31, 2005. The NAV of the growth option in
Plan A in the short term Plan as of March 31, 2005 is Rs. 13.2500(March 31, 2004 is Rs. 12.7766 for Plan A).
The FuM of the Medium Term Plan as of March 31, 2005 is Rs. 22.23 crores. Plan A of the Medium Term Plan of the
scheme has delivered a CAGR of 1.59% from its inception i.e date of allotment July 8, 2003 (NAV of Rs. 10.00) to March
31, 2005. The NAV of the growth option in Plan A as of March 31, 2005 is Rs.10.6197.
A Super Institutional Plan (Plan C) & MF Plan (Plan D) were introduced in GSSIF-IP, ST & MT with effect from April 2,
2004. Both growth and dividend options are available in the said plans. However the following plans were wound up as
they were interalia unable to meet the criteria of the SEBI circular on minimum number of investors.
Date of Winding up and name of the Plans of the schemes which were wound up :
August 12, 2004 - Plan C & D of GSSIF-IP, Plan D of GSSIF-ST, Plan D of GSSIF-MT
December 31, 2 004 - Plan B of GSSIF-IP, Plan C of GSSIF-ST, Plan B & C of GSSIF-MT
March 31, 2005 - Plan B of GSSIF-ST
GRINDLAYS CASH FUND (“GCF”)
An open-ended income scheme with an objective to generate optimal returns with high liquidity by investing in high
quality money market and debt instruments was launched on July 2, 2001.

Standard Chartered Mutual Fund 9
TRUSTEE REPORT
Annual Report 2004-2005
To achieve the above objective the underlying investment strategy is to invest in short dated securities, to minimise
interest rate risks and ensure liquidity at all times.
The FuM of the Cash Fund as of March 31, 2005 was Rs. 2367.72crores (March 31, 2004 was Rs. 2290.55 crores). Plan
A of the Scheme has delivered a CAGR of 4.51% for the last one year and 5.73% from its inception date of July 2, 2001
(NAV of Rs. 10.00) to March 31, 2005. The NAV of the growth option in Plan A, B & C as of March 31, 2005 was
Rs. 12.3240, Rs. 12.3811 & Rs. 10.4877 respectively (March 31, 2004 was Rs. 11.7922 for Plan A & Rs. 11.8247 for
Plan B).
A Super Institutional Plan (Plan C) & MF Plan (Plan D) were introduced in GCF with effect from April 2, 2004. Both
growth and dividend options are available in the said plans. Plan D has been wound with effect from August 12, 2004.
GRINDLAYS GOVERNMENT SECURITIES FUND - INVESTMENT PLAN, SHORT TERM PLAN & PROVIDENT
FUND PLAN (“GGSF-IP, ST & PF”)
An open-ended dedicated gilt scheme with an objective to seek optimal returns with high liquidity by investing in
Government Securities was launched on February 21, 2002 and the units were allotted on March 9, 2002. A new
provident fund plan comprising sub plans A & B was introduced in February 2004.
To achieve the above objective the fund will endeavour to manage interest rate risk effectively by managing the duration
of the portfolio which implies that it will attempt to reduce its duration when interest rates are rising and lengthen the
duration when interest rates are falling and hence the portfolio of the scheme may move from treasury bills or money at
call and short notice to short, medium and long dated securities.
The Scheme has three Plans viz. an Investment Plan, Short Term Plan and a Provident Fund Plan. The Investment Plan
of the Scheme is designed for investors seeking a long term investment option and it will generally have a medium term
maturity profile. It will provide stable returns over a relatively longer tenor period of investment. The Investment Plan
would invest in Central Government Securities of all maturities. Depending on market conditions a part of the assets
would be invested in Treasury Bills and in call /repo and notice money markets from time to time. Pending deployment of
funds, investments may also be made in Fixed Deposits of Scheduled Commercial Banks. The average maturity of the
Plan would be monitored to suit different market conditions from time to time.
The Short Term Plan of the scheme is designed for investors seeking stable returns over shorter periods and it will
generally have a much shorter average maturity of assets thereby providing consistent returns even over a shorter
period of investment. The Short Term Plan would predominantly invest in Central Government Securities of short and
medium term maturities. It would also invest in Treasury Bills and in Call/repo and notice money markets. Depending on
market conditions it could invest a small portion of its funds in long term Central Government Securities. Pending
deployment of funds, investments may also be made in Fixed Deposits of Scheduled Commercial Banks. The average
maturity of the portfolio would be monitored and maintained in such way so as to ensure lower volatility than the
Investment Plan.
The Provident Fund Plan of the scheme is designed for investors seeking a long term investment option and it will
generally have a medium term maturity profile. It will provide stable returns over a relatively longer Period of investment.
The FuM of the Investment Plan as of March 31, 2005 was Rs. 12.10 crores (March 31, 2004 was Rs. 66.20 crores).
Plan A of the Investment Plan of the scheme has delivered a CAGR of 1.55% for the last one year and 7.21% from
inception date of March 9, 2002. The NAV of the growth option Plan A & B in the Investment Plan as of March 31, 2005
was Rs. 12.3782 (March 31, 2004 was Rs. 12.5731 for Plan A).
The FuM of the Short Term Plan as of March 31, 2005 was Rs. 1.25 crores (March 31, 2004 was Rs. 1.69 crores). Plan A
of the Short Term Plan of the scheme has delivered CAGR of -0.04 % for the last one year and 5.07% from inception
date of March 9, 2005. The NAV of the growth option in the Short Term Plan as of March 31, 2005 was Rs. 11.6363
(March 31, 2004 was Rs.11.6407).

Standard Chartered Mutual Fund 10
TRUSTEE REPORT
Annual Report 2004-2005
The FuM of the Provident Fund Plan as of March 31 2005 was Rs. 44.75 crores. Plan A (March 31, 2004 was Rs 30.76
crores) of the Provident Fund plan of the scheme has delivered an CAGR of -0.98% for the last one year and 0.62% from
inception date of March 29, 2004 (NAV of Rs. 10.00) to March 31, 2005. The NAV of the growth option Plan A & B as of
March 31, 2005 was Rs.9.9375 and Rs 9.9830 respectively (March 31, 2004 was 10.0360 & 10.0366 respectively.)
Plan B Super institutional plan of GGSF-IP was wound up on December 31, 2004 , as it was unable to meet the criteria
of the SEBI circular on minimum number of investors.
GRINDLAYS DYNAMIC BOND FUND (“GDBF”)
An open-ended income scheme with an objective to generate optimal returns with high liquidity by active management
of the portfolio, by investing in high quality money market and debt instruments. It was launched on June 25, 2002.
To achieve the above objective the fund will attempt to maximise returns to the investors by designing a portfolio which
will dynamically track interest rate movements in the short term by reducing duration in a rising interest rate
environment while increasing duration in a falling interest rate environment.
The FuM of GDBF as of March 31, 2005 was Rs. 111.92 crores (March 31, 2004 was Rs. 790.91 crores). Plan A of the
scheme has delivered a CAGR of 0.73% for the last one year and 7.37 % from inception date of June 25, 2002. The NAV
of the growth option Plan A & B as of March 31, 2005 was Rs. 12.1736 and 12.2651 respectively (March 31, 2004 was
Rs. 12.0859 in Plan A).
A Super Institutional Plan (Plan C) & MF Plan (Plan D) were introduced in GDBF with effect from April 2, 2004. Both
growth and dividend options are available in the said plans. Plan C & D has been wound with effect from December 31,
2004, Plan B has been wound up with effect from March 31, 2005, as it was unable to meet the criteria of the SEBI
circular on minimum number of investors.
GRINDLAYS FLOATING RATE FUND - Short Term & Long Term Plans (“GFRF- ST & LT ”)
An open-ended income scheme with an objective to generate stable returns with a low risk strategy by creating a
portfolio that is substantially invested in good quality floating rate debt or money market instruments, fixed rate debt or
money market instruments swapped for floating returns and fixed rate debt and money market instruments. It was
launched on February 18, 2003. A new Long Term Plan has been introduced in the scheme on July 19, 2004. The
existing GFRF has therefore been renamed GFRF-Short Term Plan.
To achieve the above objective the fund will endeavour to increase exposure to fixed rate debt securities in bullish
conditions and increase exposure to floating rate debt instruments in bearish conditions there by providing an effective
hedge against adverse movements.
The FuM of the GFRF-ST as of March 31, 2005, was Rs. 1348.83 crores (March 31, 2004 was Rs. 727.20 crores). Plan
A of GFRF-ST delivered a CAGR of 4.67% for the last one year and 4.91% from inception date of February 18, 2003.
The NAV of the growth option Plan A , B & Plan C in GFRF-ST as of March 31, 2005 was Rs. 11.0663, 10.9261 and
10.4903 respectively (March 31, 2004 was Rs. 10.5724 , 10.4237 Plan A & B).
The FuM of the GFRF-LT as of March 31, 2005, was Rs. 986.33. Plan A of GFRF-LT has delivered an absolute return of
3.32% since inception date of August 9, 2004. The NAV of the growth option Plan A& B of GFRF-LT as of March 31,
2005 was Rs 10.3321 and 10.3388 respectively.
A Super Institutional Plan (Plan C) & MF Plan (Plan D) were introduced in GFRF-ST with effect from April 2, 2004. Both
growth and dividend options are available in the said plans. Plan D was wound up with effect from August 12, 2004.

Standard Chartered Mutual Fund 11
TRUSTEE REPORT
Annual Report 2004-2005
STANDARD CHARTERED ALL SEASONS BOND FUND (“SCASBF”)
An open ended Fund of Funds scheme with an objective to generate optimal return with high liquidity by active
management of portfolio, by investing predominantly in debt oriented Mutual Fund scheme and money Market
instrument, was launched on August 9, 2004.
To achieve the objective the underlying strategy is to invest in debt oriented mutual fund schemes of various average
maturities in the domestic and overseas market (as may be permitted by SEBI from time to time) 85% - 100% and
Money market instruments and fixed deposits of scheduled commercial banks (including call & repo). (0% - 15%)
The FuM of the SCASBF as of March 31 2005, was Rs. 160.81 crores. Plan A of SCASBF has delivered absolute return
of 2.39 % since inception date of September 13, 2004 i.e. date of allotment . The NAV of the growth option Plan A & B in
SCASBF as of March 31, 2005 was Rs. 10.2391and 10.2586 respectively. Plan B (Institutional Plan) of the Scheme has
been wound up with effect from March 31, 2005 as it was unable to meet the criteria of the SEBI circular on minimum
number of investors.
INVESTOR SERVICES
The Fund continues to stress on reaching out more number of investors and a wider number of cities.For the cities
where the AMC has a office, the AMC continues to strengthen the quality of resources.
The Fund now has a presence in over 65 cities through a combination of CAMS Transaction points and self-owned
offices. All the AMC's offices in 19 cities (September 2005) are fully functional Service centres. The Phone Transact
facility of the Fund was extended to over 200 cities and allows investors to redeem, switch and request for account
statements by accessing just one Call Free number 1-600-226622.
DISTRIBUTION OF INCOME
The distribution of Dividend will be made out of Net Surplus under this subject to availability of distributable profits, as
computed in accordance with SEBI Regulations. The AMC reserves the right to change the periodicity.
Name of thr Scheme / Plan Dividend Option
GSSIF - IP Quarterly, Half Yearly & Annual
GSSIF - MT Bi Monthly
GSSIF - ST Monthly
GCF Daily & Weekly with compulsory re investment &
Periodic (in Plan B only), Monthly (in Plan C only)
GDBF Quarterly & Annual
GGSF - IP Quarterly, Half Yearly & Annual
GGSF - ST Monthly & Quarterly
GGSF - PF Quarterly & Annual
GFRF - ST Daily & Weekly with compulsory reinvestment & Monthly
GFRF - LT Weekly (with reinvest facility in Plan B only),
Monthly, Quarterly, Annual
SCASBF Quarterly, Half Yearly, Annual

Standard Chartered Mutual Fund 12
TRUSTEE REPORT
Annual Report 2004-2005
The dividend history of Plan A of various schemes is as under:GSSIF-IP
Date of declaration Frequency Non-Corporates Corporates
07-Jun-04 Quarterly 0.2501-Sep-04 Half Yearly 0.5000 0.413506-Sep-04 Quarterly 0.2000 0.186601-Mar-05 Half Yearly 0.2500 0.233207-Mar-05 Quarterly 0.0150 0.0141
GSSIF-ST
Date of declaration Frequency Non-Corporates Corporates
29-Apr-04 Monthly 0.050031-May-04 Monthly 0.050001-Jul-04 Monthly 0.040029-Jul-04 Monthly 0.0275 0.025731-Aug-04 Monthly 0.0225 0.021029-Sep-04 Monthly 0.0225 0.021028-Oct-04 Monthly 0.0047 0.005030-Nov-04 Monthly 0.0047 0.004431-Dec-04 Monthly 0.0250 0.023431-Jan-05 Monthly 0.0325 0.030428-Feb-05 Monthly 0.0325 0.030430-Mar-05 Monthly 0.0600 0.0561
GSSIF-MT
Date of declaration Frequency Non-Corporates Corporates
03-May-04 Bi - Monthly 0.080001-Jul-04 Bi - Monthly 0.007501-Sep-04 Bi - Monthly 0.0275 0.025601-Mar-05 Bi - Monthly 0.0275 0.0256
GDBF
Date of declaration Frequency Non-Corporates Corporates
01-Mar-05 Annual 0.0025 0.233207-Jun-04 Quarterly 0.250006-Sep-04 Quarterly 0.0500 0.046607-Mar-05 Quarterly 0.0150 0.0141
GFRF-LT
Date of declaration Frequency Non-Corporates Corporates
06-Dec-04 Quarterly 0.1383 0.129401-Mar-05 Annual 0.2000 0.018707-Mar-05 Quarterly 0.1000 0.093531-Mar-05 Monthly 0.0375 0.0035
GGSF-IP
Date of declaration Frequency Non-Corporates Corporates
07-Jun-04 Quarterly 0.250006-Sep-04 Quarterly 0.0466 0.050001-Mar-05 Annual 0.0225 0.0210

Standard Chartered Mutual Fund 13
TRUSTEE REPORT
Annual Report 2004-2005
GGSF-ST
Date of declaration Frequency Non-Corporates Corporates
29-Apr-04 Monthly 0.010031-Mar-05 Monthly 0.0025 0.002307-Jun-04 Quarterly 0.02507-Mar-05 Quarterly 0.0025 0.0023
GGSF-PF
Date of declaration Frequency Non-Corporates Corporates
07-Jun-04 Quarterly 0.001506-Sep-04 Quarterly 0.0075 0.0007
SCASBF
Date of declaration Frequency Non-Corporates Corporates
06-Dec-04 Quarterly 0.0069 0.006501-Mar-05 Half Yly 0.0450 0.042101-Mar-05 Annual 0.0450 0.042130-Mar-05 Quarterly 0.1500 0.1403
GFRF-ST
Date of declaration Frequency Non-Corporates Corporates
(Highest dividend declared) Daily 0.0133 0.1333(Lowest dividend declared) Daily 0.0009 0.0008
GCF-Daily Dividend Reinvestment Plan
In view of the amendments introduced by the Finance Act, 2003, dividends declared by mutual funds have become tax
free in the hands of investors with effect from April 1, 2003. Consequently we have recommenced the declaration of
daily dividend in Grindlays Cash Fund with effect from April 3, 2003.
Weekly/Daily Dividend in Plan A
Date of declaration Frequency Non - Corporate Corporate
(Highest dividend declared) Weekly 0.0116 0.0108(Lowest dividend declared) Weekly 0.0063 0.0063(Highest dividend declared) Daily 0.0065 0.0061(Lowest dividend declared) Daily 0.0009 0.00089
The schemes of the mutual fund under their respective dividend options have declared dividend as follows. Looking at
market conditions and due to inadequate distributable surplus no dividend was declared in following schemes:
Scheme Name Particulars
GGSF - ST Dividend was not declared in the monthly dividend option for the months of May to
February 2005. And Quarterly dividend options for the months of September 2004 &
December 2004.
GGSF - IP Dividend was not declared under the quarterly dividend in quarter June 2004 (Plan B),
quarterly dividend option in quarter December 2004 for (Plan A & B), quarterly dividend
option (in Plan B) for the Quarter September 30, 2004, Quarterly dividend option (Plan A)
in quarter end March 2005 & Half Yearly option (Plan A) for the year end March 2005.

Standard Chartered Mutual Fund 14
TRUSTEE REPORT
Annual Report 2004-2005
GGSF - PF Dividend was not declared under the quarterly dividend option in quarter December
2004, March 2005 (Plan A), and under Annual dividend option for the year March 2005
(Plan A)
SCASBF Dividend was not declared under the quarterly dividend option for the quarter December
2004 (Plan B)
GSSIF - IP Dividend was not declared under the quarterly dividend option for the quarter December
2004 (Plan A & B) and under the Annual Dividend option for the Year March 2005 (Plan A).
GDBF Dividend was not declared under the quarterly dividend option for the December 2004
(Plan A, B & C)
GSSIF - MT Dividend was not declared under the Bi-Monthly dividend Option for the bi-month
November 2004 (Plan A, B & C).
GSSIF - ST Dividend was not declared under the Monthly Dividend option for the month December
(Plan C).
STATUTORY DETAILS
The price and redemption value of units, and income from them, can go up as well as down with fluctuations in the
market value of its underlying investments.
On written request, present and prospective unitholder/investors can obtain copy of the trust deed, the annual report of
the scheme and the asset management company and the text of the relevant scheme.
ACKNOWLEDGEMENT
The trustees wish to place on record their gratitude to the unitholders for their continued support and to the Securities
and Exchange Board of India, the Reserve Bank of India, the Registrars, Bankers, the Custodians and Sponsor
(present and erstwhile) of SCMF for support provided by them during the year.
For Standard Chartered Trustee Company Private Limited
(The Trustee of Standard Chartered Mutual Fund)
Director
Place: Mumbai
Date: September 6, 2005

Grindlays Fixed Savings Scheme - Annual Plan 3
Standard Chartered Mutual Fund 15
AUDITORS’ REPORT
To the Board of Trustees of
Standard Chartered Mutual Fund
We have audited the attached Balance Sheet of Standard Chartered Mutual Fund - Grindlays Fixed Saving Scheme - Annual Plan - 3 ('the Scheme') as at 5 April 2004 and the related Revenue Account for the period ended on that date annexed thereto.
These financial statements are the responsibility of the Trustees of Standard Chartered Mutual Fund and the management of Standard Chartered Asset Management Company Private Limited. Our responsibility is to express an opinion on these financial statements based on our audit.
We conducted our audit in accordance with auditing standards generally accepted in India. Those standards require that we plan and perform the audit to obtain reasonable assurance about whether the financial statements are free of material misstatement. An audit includes examining, on a test basis, evidence supporting the amounts and disclosures in the financial statements. An audit also includes assessing the accounting principles used and significant estimates made by management, as well as evaluating the overall financial statement presentation. We believe that our audit provides a reasonable basis for our opinion.
We report thereon as follows:
+ We have obtained all the information and explanations, which, to the best of our knowledge and belief, were necessary for the purpose of the audit; and
+ The Balance Sheet and the related Revenue Account dealt with by this report are in agreement with the books of account of the Scheme.
In our opinion and to the best of our information and according to the explanations given to us:
+ The Balance Sheet as at 5 April 2004 and the related Revenue Account for the period ended on that date, together with the notes thereon, have been prepared in accordance with the accounting policies and standards specified in the Ninth Schedule of the Securities and Exchange Board of India (Mutual Funds) Regulations, 1996 and amendments thereto, as applicable;
+ The Balance Sheet as at 5 April 2004 and the related Revenue Account for the period ended on that date together with the notes thereon give the information required by the Securities and Exchange Board of India (Mutual Funds) Regulations, 1996 and amendments thereto, as applicable, and give a true and fair view:
- In so far as it relates to the Balance Sheet, of the state of affairs of the Scheme as at 5 April 2004; and
- In so far as it relates to the Revenue Account, of the surplus for the period ended on that date.
+ In our opinion and to the best of our information and according to the explanations given to us, the methods used to value non-traded / thinly traded securities in good faith are fair and reasonable.
For BSR & Co.(formerly Bharat S Raut & Co.)
Chartered Accountants
Akeel MasterPartner
Membership No.: 046768MumbaiDate: September 15, 2005
Annual Report 2004-2005

Grindlays Fixed Savings Scheme - Annual Plan 4
Standard Chartered Mutual Fund 16
AUDITORS’ REPORT
To the Board of Trustees of
Standard Chartered Mutual Fund
We have audited the attached Balance Sheet of Standard Chartered Mutual Fund - Grindlays Fixed Saving Scheme - Annual Plan - 4 ('the Scheme') as at 27 July 2004 and the related Revenue Account for the period ended on that date annexed thereto.
These financial statements are the responsibility of the Trustees of Standard Chartered Mutual Fund and the management of Standard Chartered Asset Management Company Private Limited. Our responsibility is to express an opinion on these financial statements based on our audit.
We conducted our audit in accordance with auditing standards generally accepted in India. Those standards require that we plan and perform the audit to obtain reasonable assurance about whether the financial statements are free of material misstatement. An audit includes examining, on a test basis, evidence supporting the amounts and disclosures in the financial statements. An audit also includes assessing the accounting principles used and significant estimates made by management, as well as evaluating the overall financial statement presentation. We believe that our audit provides a reasonable basis for our opinion.
We report thereon as follows:
+ We have obtained all the information and explanations, which, to the best of our knowledge and belief, were necessary for the purpose of the audit; and
+ The Balance Sheet and the related Revenue Account dealt with by this report are in agreement with the books of account of the Scheme.
In our opinion and to the best of our information and according to the explanations given to us:
+ The Balance Sheet as at 27 July 2004 and the related Revenue Account for the period ended on that date, together with the notes thereon, have been prepared in accordance with the accounting policies and standards specified in the Ninth Schedule of the Securities and Exchange Board of India (Mutual Funds) Regulations, 1996 and amendments thereto, as applicable;
+ The Balance Sheet as at 27 July 2004 and the related Revenue Account for the period ended on that date together with the notes thereon give the information required by the Securities and Exchange Board of India (Mutual Funds) Regulations, 1996 and amendments thereto, as applicable, and give a true and fair view:
- In so far as it relates to the Balance Sheet, of the state of affairs of the Scheme as at 27 July 2004; and
- In so far as it relates to the Revenue Account, of the surplus for the period ended on that date.
+ In our opinion and to the best of our information and according to the explanations given to us, the methods used to value non-traded/thinly traded securities in good faith are fair and reasonable.
For BSR & Co.(formerly Bharat S Raut & Co.)
Chartered Accountants
Akeel MasterPartner
Membership No.: 046768MumbaiDate: September 15, 2005
Annual Report 2004-2005

Grindlays Fixed Savings Scheme - Annual Plan 6
Standard Chartered Mutual Fund 17
AUDITORS’ REPORT
To the Board of Trustees of
Standard Chartered Mutual Fund
We have audited the attached Balance Sheet of Standard Chartered Mutual Fund - Grindlays Fixed Saving Scheme - Annual Plan - 6 ('the Scheme') as at 4 November 2004 and the related Revenue Account for the period ended on that date annexed thereto.
These financial statements are the responsibility of the Trustees of Standard Chartered Mutual Fund and the management of Standard Chartered Asset Management Company Private Limited. Our responsibility is to express an opinion on these financial statements based on our audit.
We conducted our audit in accordance with auditing standards generally accepted in India. Those standards require that we plan and perform the audit to obtain reasonable assurance about whether the financial statements are free of material misstatement. An audit includes examining, on a test basis, evidence supporting the amounts and disclosures in the financial statements. An audit also includes assessing the accounting principles used and significant estimates made by management, as well as evaluating the overall financial statement presentation. We believe that our audit provides a reasonable basis for our opinion.
We report thereon as follows:
+ We have obtained all the information and explanations, which, to the best of our knowledge and belief, were necessary for the purpose of the audit; and
+ The Balance Sheet and the related Revenue Account dealt with by this report are in agreement with the books of account of the Scheme.
In our opinion and to the best of our information and according to the explanations given to us:
+ The Balance Sheet as at 4 November 2004 and the related Revenue Account for the period ended on that date, together with the notes thereon, have been prepared in accordance with the accounting policies and standards specified in the Ninth Schedule of the Securities and Exchange Board of India (Mutual Funds) Regulations, 1996 and amendments thereto, as applicable;
+ The Balance Sheet as at 4 November 2004 and the related Revenue Account for the period ended on that date together with the notes thereon give the information required by the Securities and Exchange Board of India (Mutual Funds) Regulations, 1996 and amendments thereto, as applicable, and give a true and fair view:
- In so far as it relates to the Balance Sheet, of the state of affairs of the Scheme as at 4 November 2004; and
- In so far as it relates to the Revenue Account, of the surplus for the period ended on that date.
For BSR & Co.(formerly Bharat S Raut & Co.)
Chartered Accountants
Akeel MasterPartner
Membership No.: 046768MumbaiDate: September 15, 2005
Annual Report 2004-2005

Grindlays Fixed Maturity Plan - Quarterly Plan
Standard Chartered Mutual Fund 18
AUDITORS’ REPORT
To the Board of Trustees of
Standard Chartered Mutual Fund
We have audited the attached Balance Sheet of Standard Chartered Mutual Fund - Grindlays Fixed Maturity Plan - Quarterly ('the Scheme') as at 8 July 2004 and the related Revenue Account for the period ended on that date annexed thereto.
These financial statements are the responsibility of the Trustees of Standard Chartered Mutual Fund and the management of Standard Chartered Asset Management Company Private Limited. Our responsibility is to express an opinion on these financial statements based on our audit.
We conducted our audit in accordance with auditing standards generally accepted in India. Those standards require that we plan and perform the audit to obtain reasonable assurance about whether the financial statements are free of material misstatement. An audit includes examining, on a test basis, evidence supporting the amounts and disclosures in the financial statements. An audit also includes assessing the accounting principles used and significant estimates made by management, as well as evaluating the overall financial statement presentation. We believe that our audit provides a reasonable basis for our opinion.
We report thereon as follows:
+ We have obtained all the information and explanations, which, to the best of our knowledge and belief, were necessary for the purpose of the audit; and
+ The Balance Sheet and the related Revenue Account dealt with by this report are in agreement with the books of account of the Scheme.
In our opinion and to the best of our information and according to the explanations given to us:
+ The Balance Sheet as at 8 July 2004 and the related Revenue Account for the period ended on that date, together with the notes thereon, have been prepared in accordance with the accounting policies and standards specified in the Ninth Schedule of the Securities and Exchange Board of India (Mutual Funds) Regulations, 1996 and amendments thereto, as applicable;
+ The Balance Sheet as at 8 July 2004 and the related Revenue Account for the period ended on that date together with the notes thereon give the information required by the Securities and Exchange Board of India (Mutual Funds) Regulations, 1996 and amendments thereto, as applicable, and give a true and fair view:
- In so far as it relates to the Balance Sheet, of the state of affairs of the Scheme as at 8 July 2004; and
- In so far as it relates to the Revenue Account, of the surplus for the period ended on that date.
+ In our opinion and to the best of our information and according to the explanations given to us, the methods used to value non-traded/thinly traded securities in good faith are fair and reasonable.
For BSR & Co.(formerly Bharat S Raut & Co.)
Chartered Accountants
Akeel MasterPartner
Membership No.: 046768MumbaiDate: September 15, 2005
Annual Report 2004-2005

Grindlays Fixed Maturity Plan - 3rd Plan
Standard Chartered Mutual Fund 19
AUDITORS’ REPORT
To the Board of Trustees of
Standard Chartered Mutual Fund
We have audited the attached Balance Sheet of Standard Chartered Mutual Fund - Grindlays Fixed Maturity Plan - 3rd Plan ('the Scheme') as at 25 February 2005 and the related Revenue Account for the period ended on that date annexed thereto.
These financial statements are the responsibility of the Trustees of Standard Chartered Mutual Fund and the management of Standard Chartered Asset Management Company Private Limited. Our responsibility is to express an opinion on these financial statements based on our audit.
We conducted our audit in accordance with auditing standards generally accepted in India. Those standards require that we plan and perform the audit to obtain reasonable assurance about whether the financial statements are free of material misstatement. An audit includes examining, on a test basis, evidence supporting the amounts and disclosures in the financial statements. An audit also includes assessing the accounting principles used and significant estimates made by management, as well as evaluating the overall financial statement presentation. We believe that our audit provides a reasonable basis for our opinion.
We report thereon as follows:
+ We have obtained all the information and explanations, which, to the best of our knowledge and belief, were necessary for the purpose of the audit; and
+ The Balance Sheet and the related Revenue Account dealt with by this report are in agreement with the books of account of the Scheme.
In our opinion and to the best of our information and according to the explanations given to us:
+ The Balance Sheet as at 25 February 2005 and the related Revenue Account for the period ended on that date, together with the notes thereon, have been prepared in accordance with the accounting policies and standards specified in the Ninth Schedule of the Securities and Exchange Board of India (Mutual Funds) Regulations, 1996 and amendments thereto, as applicable;
+ The Balance Sheet as at 25 February 2005 and the related Revenue Account for the period ended on that date together with the notes thereon give the information required by the Securities and Exchange Board of India (Mutual Funds) Regulations, 1996 and amendments thereto, as applicable, and give a true and fair view:
- In so far as it relates to the Balance Sheet, of the state of affairs of the Scheme as at 25 February 2005; and
- In so far as it relates to the Revenue Account, of the surplus for the period ended on that date.
For BSR & Co.(formerly Bharat S Raut & Co.)
Chartered Accountants
Akeel MasterPartner
Membership No.: 046768MumbaiDate: September 15, 2005
Annual Report 2004-2005

20
CLOSE ENDED SCHEMES (MATURED)
Balance Sheet as at March 31, 2005(Currency: Indian Rupee)
Schedules GFSS-A3 GFSS-A4 GFSS-A6 GFMP-Q GFMP-3Apr. 01, 2004 to Apr. 01, 2004 to Apr. 01, 2004 to Apr. 01, 2004 to Nov. 27, 2004 to
Apr. 05, 2004 Jul. 27, 2004 Nov. 04, 2004 Jul. 08, 2004 Feb. 25, 2005
LIABILITIESUnit capital 3 460,000,000 120,000,000 88,505,779 860,678,572 3,694,092,510
460,000,000 120,000,000 88,505,779 860,678,572 -Reserves and surplus 4 31,169,338 6,586,211 4,216,969 3,906,009 51,776,014
30,871,224 4,518,852 1,730,333 862,725 -Current liabilitiesand provisions 5 1,733,503 275,605 476,842 8,906,537 1,350,530
1,709,551 204,615 213,300 5,901 -
492,902,841 126,861,816 93,199,590 873,491,118 3,747,219,054492,580,775 124,723,467 90,449,412 861,547,198 -
ASSETSInvestments 6 490,734,461 126,839,996 91,631,700 868,584,063 3,745,832,756
480,541,874 124,659,005 90,229,567 431,194,844 -Deposits - - - - -
- - - 425,000,000 -Current assets 7 2,168,380 21,820 1,567,890 4,907,055 1,386,298
12,038,901 64,462 219,845 5,352,354 -
492,902,841 126,861,816 93,199,590 873,491,118 3,747,219,054492,580,775 124,723,467 90,449,412 861,547,198 -
Net Asset Valueper unitGrowth Option 10.6778 10.5489 - 10.1421 10.1401
10.6711 10.3766 - 10.0100 -Dividend Option 10.6778 - 10.4765 10.0011 10.0000
10.6711 - 10.1955 10.0100 -
Annual Report 2004-2005Standard Chartered Mutual Fund
March 31, 2005March 31, 2004

21
Balance Sheet as at March 31, 2005 (Contd.)(Currency: Indian Rupee)
Schedules GFSS-A3 GFSS-A4 GFSS-A6 GFMP-Q GFMP-3Apr. 01, 2004 to Apr. 01, 2004 to Apr. 01, 2004 to Apr. 01, 2004 to Nov. 27, 2004 to
Apr. 05, 2004 Jul. 27, 2004 Nov. 04, 2004 Jul. 08, 2004 Feb. 25, 2005
Significant accounting policies 2Notes to Accounts 9
The schedules referred to above form an integral part of the Balance Sheet.As per our report attached of even date
For BSR & Co. For Standard Chartered Asset Management For Standard Chartered Trustee(formerly Bharat S Raut & Co) Company Private Limited Company Private LimitedChartered Accountants
Sd/- Sd/-Akeel Master Paul Jebson Sd/-Partner Chairman Chairman / DirectorMembership No.: 046768
Sd/-Naval Bir Kumar Sd/-Managing Director Director
Sd/-Rajiv Anand
Mumbai Head-InvestmentsSeptember 15, 2005
Annual Report 2004-2005Standard Chartered Mutual Fund
CLOSE ENDED SCHEMES (MATURED)
March 31, 2005March 31, 2004

22
Revenue Account for the period / year ended March 31, 2005(Currency: Indian Rupee)
Schedules GFSS-A3 GFSS-A4 GFSS-A6 GFMP-Q GFMP-3Apr. 01, 2004 to Apr. 01, 2004 to Apr. 01, 2004 to Apr. 01, 2004 to Nov. 27, 2004 to
Apr. 05, 2004 Jul. 27, 2004 Nov. 04, 2004 Jul. 08, 2004 Feb. 25, 2005
INCOME AND GAINSInterest 8 129,480 2,040,995 2,798,017 12,092,762 53,152,604
32,137,901 4,756,080 1,943,633 878,526 -Provision fordepreciation in valueof investmentswritten back - - - 9,900 -
- - - - -129,480 2,040,995 2,798,017 12,102,662 53,152,604
32,137,901 4,756,080 1,943,633 878,526 -
EXPENSESAND LOSSESLoss oninter-schemetransfer/sale ofinvestments - - - 148,752 -
- - - - -Management fees 6,405 64,146 287,462 280,669 961,656
1,501,883 155,967 162,315 5,464 -Registrar and TransferAgent's feesand expenses - - - 54,216 256,308
80,136 - - - -Custodian fees - - - 9,990 1,873
78,477 - - - -Commission to agents - - - 218,326 -
361,432 - - - -Audit fees - - - - 27,550
25,000 - - - -Service tax - 4,849 23,919 24,641 98,089
124,274 25,585 14,985 437 -Other operatingexpenses 17,547 44,644 - - 31,114
340 15,676 36,000 - -Provision fordepreciation in valueof investments - - - - -
- - - 9,900 -
23,952 113,639 311,381 736,594 1,376,5902,171,542 197,228 213,300 15,801 -
Annual Report 2004-2005Standard Chartered Mutual Fund
CLOSE ENDED SCHEMES (MATURED)
March 31, 2005March 31, 2004

23
Revenue Account for the period / year ended March 31, 2005 (Contd.)(Currency: Indian Rupee)
Schedules GFSS-A3 GFSS-A4 GFSS-A6 GFMP-Q GFMP-3Apr. 01, 2004 to Apr. 01, 2004 to Apr. 01, 2004 to Apr. 01, 2004 to Nov. 27, 2004 to
Apr. 05, 2004 Jul. 27, 2004 Nov. 04, 2004 Jul. 08, 2004 Feb. 25, 2005
Surplus for the period 105,528 1,927,356 2,486,636 11,366,068 51,776,01429,966,359 4,518,852 1,730,333 862,725 -
Distributable Surplus 105,528 1,927,356 2,486,636 11,366,068 51,776,01429,966,359 4,518,852 1,730,333 862,725 -
Income Distributed(including distributiontax) - - - (8,322,784) -
- - - - -Retained Surplus,beginning of period 30,329,351 4,518,852 1,730,333 862,725 -
362,992 - - - -Retained Surplus,end of the period 30,434,879 6,446,208 4,216,969 3,906,009 51,776,014
30,329,351 4,518,852 1,730,333 862,725 -Significantaccounting policies 2Notes to Accounts 9
The schedules referred to above form an integral part of the Revenue Account.As per our report attached of even date
For BSR & Co. For Standard Chartered Asset Management For Standard Chartered Trustee(formerly Bharat S Raut & Co) Company Private Limited Company Private LimitedChartered Accountants
Sd/- Sd/-Akeel Master Paul Jebson Sd/-Partner Chairman Chairman / DirectorMembership No.: 046768
Sd/-Naval Bir Kumar Sd/-Managing Director Director
Sd/-Rajiv Anand
Mumbai Head-InvestmentsSeptember 15, 2005
Annual Report 2004-2005Standard Chartered Mutual Fund
CLOSE ENDED SCHEMES (MATURED)
March 31, 2005March 31, 2004

24
1. Background
Standard Chartered Mutual Fund ('the Fund') is sponsored by Standard Chartered Bank, U.K. ('SCB') and is constituted as a Trust under the Indian Trust Act, 1882 with Standard Chartered Trustee Company Private Limited ('the Trustee') as trustee. In accordance with the Securities and Exchange Board of India (SEBI) (Mutual Funds) Regulations, 1996 ('the Regulations') The Trustees have entrusted the investment management function to Standard Chartered Asset Management Company Private Limited ('the AMC').
The schemes mentioned below are close ended schemes and their investment objective is to seek to achieve growth of capital by investing in a portfolio of fixed income securities normally maturing in line with the time profile of the schemes:
Grindlays Fixed Savings Scheme-Annual 3 (GFSS-A3)
Grindlays Fixed Savings Scheme-Annual 4 (GFSS-A4)
Grindlays Fixed Savings Scheme-Annual 6 (GFSS-A6)
Grindlays Fixed Maturity-Quarterly (GFMP-Q)
rdGrindlays Fixed Maturity 3 Plan (GFMP-3)
The following table depicts the start date, allotment date and the maturity date:
Scheme Name IPO Launch Date Allotment Date Maturity Date *GFSS-A3 March 13, 2003 March 27, 2003 April 05, 2004GFSS-A4 July 17, 2003 July 23, 2003 July 27, 2004GFSS-A6 October 23, 2003 October 31, 2003 November 04, 2004GFMP-Q March 10, 2004 March 31, 2004 July 08, 2004GFMP-3 November 24, 2004 November 27, 2004 February 25, 2005
* In case the maturity date falls on a holiday, the date will be the next working day.
All the above mentioned schemes offer a choice of two Investment options viz, Growth and Dividend.
2. Significant accounting policies
2.1 Basis of preparation of financial statements
The financial statements are prepared and presented under the historical cost convention, as modified for investments which are 'marked-to-market', on the accrual basis of accounting and in accordance with the accounting policies and standards specified in the Ninth Schedule of the Regulations and amendments thereto, and the accounting standards and guidance notes issued by the Institute of Chartered Accountants of India.
2.2 Use of estimates
The preparation of financial statements in conformity with Generally Accepted Accounting Principles ('GAAP') requires management to make estimates and assumptions that affect the reported amounts of assets and liabilities and the disclosure of contingent liabilities as at the date of financial statements. The estimates and the assumptions used in accompanying financial statements are based upon managements evaluation of relevant facts and circumstances as at the date of financials. Actual results could differ from those estimates and assumptions used in preparing financial statements. Any revision to accounting estimates is recognized prospectively in the current and future periods.
Annual Report 2004-2005Standard Chartered Mutual Fund
CLOSE ENDED SCHEMES (MATURED)
Schedules to the financial statementsfor the period / year ended March 31, 2005
(Currency: Indian Rupee)
25
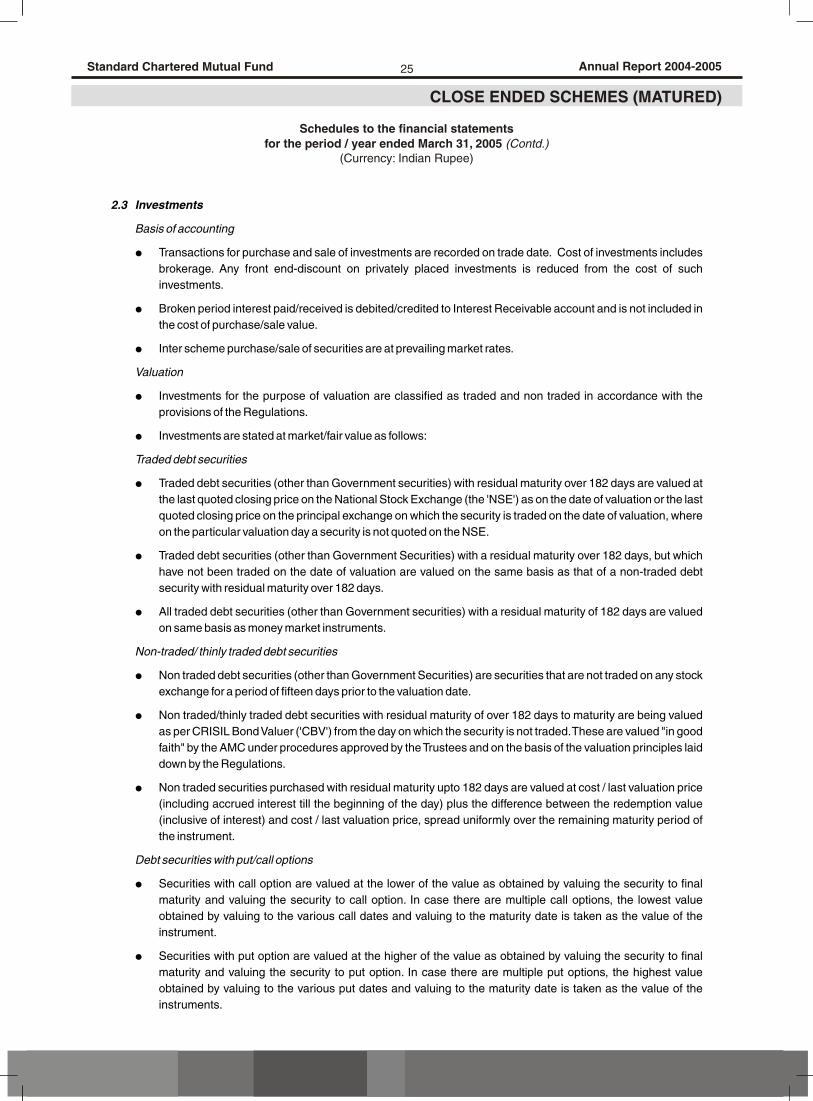
2.3 Investments
Basis of accounting
! Transactions for purchase and sale of investments are recorded on trade date. Cost of investments includes brokerage. Any front end-discount on privately placed investments is reduced from the cost of such investments.
! Broken period interest paid/received is debited/credited to Interest Receivable account and is not included in the cost of purchase/sale value.
! Inter scheme purchase/sale of securities are at prevailing market rates.
Valuation
! Investments for the purpose of valuation are classified as traded and non traded in accordance with the provisions of the Regulations.
! Investments are stated at market/fair value as follows:
Traded debt securities
! Traded debt securities (other than Government securities) with residual maturity over 182 days are valued at the last quoted closing price on the National Stock Exchange (the 'NSE') as on the date of valuation or the last quoted closing price on the principal exchange on which the security is traded on the date of valuation, where on the particular valuation day a security is not quoted on the NSE.
! Traded debt securities (other than Government Securities) with a residual maturity over 182 days, but which have not been traded on the date of valuation are valued on the same basis as that of a non-traded debt security with residual maturity over 182 days.
! All traded debt securities (other than Government securities) with a residual maturity of 182 days are valued on same basis as money market instruments.
Non-traded/ thinly traded debt securities
! Non traded debt securities (other than Government Securities) are securities that are not traded on any stock exchange for a period of fifteen days prior to the valuation date.
! Non traded/thinly traded debt securities with residual maturity of over 182 days to maturity are being valued as per CRISIL Bond Valuer ('CBV') from the day on which the security is not traded. These are valued "in good faith" by the AMC under procedures approved by the Trustees and on the basis of the valuation principles laid down by the Regulations.
! Non traded securities purchased with residual maturity upto 182 days are valued at cost / last valuation price (including accrued interest till the beginning of the day) plus the difference between the redemption value (inclusive of interest) and cost / last valuation price, spread uniformly over the remaining maturity period of the instrument.
Debt securities with put/call options
! Securities with call option are valued at the lower of the value as obtained by valuing the security to final maturity and valuing the security to call option. In case there are multiple call options, the lowest value obtained by valuing to the various call dates and valuing to the maturity date is taken as the value of the instrument.
! Securities with put option are valued at the higher of the value as obtained by valuing the security to final maturity and valuing the security to put option. In case there are multiple put options, the highest value obtained by valuing to the various put dates and valuing to the maturity date is taken as the value of the instruments.
Annual Report 2004-2005Standard Chartered Mutual Fund
CLOSE ENDED SCHEMES (MATURED)
Schedules to the financial statementsfor the period / year ended March 31, 2005 (Contd.)
(Currency: Indian Rupee)

26
! The securities with both Put and Call option on the same day would be deemed to mature on the Put/Call day and would be valued at the prevailing market price.
Money Market Instruments
! Money market instruments, other than government securities were valued at cost plus accrued interest upto October 24, 2004. Effective October 25, 2004 traded money market securities are valued at the yield they were traded as on the valuation date. In case these securities are not traded, they are valued at the last traded price plus accretion of difference between the redemption value and the last traded price. However, the effect of this change in the accounting policy on the financial statements is not ascertainable.
Repos
! Instruments bought on 'repo' basis are valued at the resale price after deduction of applicable interest upto date of resale.
Collateralized Borrowings and Lending Obligation (CBLO)
! CBLOs are valued at cost/last valuation price (including accrued interest till the beginning of the day) plus the difference between the redemption value (inclusive of interest) and cost / last valuation price, spread uniformly over the remaining maturity period of the instrument.
Mutual Fund Units
! Mutual Fund Units are valued at Net Asset Value ('NAV') prevailing as at end of the valuation day.
In accordance with the Guidance Note on Accounting for Investments in the Financial Statements of Mutual funds issued by the Institute of Chartered Accountants of India, pursuant to the Eleventh Schedule of the Regulations, the net unrealized gain or loss in the value of investments is determined separately for each category of investments. The loss on investments sold or transferred during the period or year is charged to the revenue account instead of being first adjusted against the provision for depreciation, if already created in the previous year, as recommended by the Guidance note. The unrealised loss / gain is reversed on the first day of the immediately succeeding financial year. However, this departure from the Guidance note does not have any net impact on the Scheme's net assets and the financial statements of the Scheme.
2.4 Revenue recognition
Interest income is accrued on a daily basis.
Profit or loss on sale of investments represents sale proceeds less weighted average cost and is recognised on a trade date basis.
In accordance with the Guidance note on accounting for investments in the financial statements of Mutual Funds issued by the Institute of Chartered Accountants of India, appreciation/depreciation in value of securities is computed category wise, wherein the cost is compared with the market/fair value and the resultant appreciation is credited to Unrealized Appreciation Reserve and any depreciation is charged to the Revenue account.
2.5 Computation of Net Asset Value (NAV)
The NAV of the units of each of the various schemes is computed separately for units issued under the various options of the relevant plans, although the corresponding scheme's investments and other net assets are managed as a single portfolio. For computing the NAV for various plans/options, daily income earned, including realised and unrealised gains or losses in the value of investments and expenses incurred by the corresponding scheme are allocated to the plans/sub-plans/options in proportion to the net assets of each plans/sub-plan/options.
2.6 Dividend distribution
Dividend distributed on units is recognised on the date of declaration of dividend.
Annual Report 2004-2005Standard Chartered Mutual Fund
CLOSE ENDED SCHEMES (MATURED)
Schedules to the financial statementsfor the period / year ended March 31, 2005 (Contd.)
(Currency: Indian Rupee)
27
2.7 Unit premium reserve
When units are issued or redeemed, the net premium or discount to the face value is transferred to the unit premium reserve, after an appropriate portion of the issue proceeds and redemption payout is credited or debited respectively to the equalisation reserve. The unit premium reserve is available for dividend distribution except to the extent it is represented by unrealised net appreciation in investments.
2.8 Load charges
Load collected is retained under a separate account in the Scheme and is used to meet the selling and distribution expenses of the Scheme.
2.9 Initial issue expenses
Initial issue expenses are borne by the AMC.
Annual Report 2004-2005Standard Chartered Mutual Fund
CLOSE ENDED SCHEMES (MATURED)
Schedules to the financial statementsfor the period / year ended March 31, 2005 (Contd.)
(Currency: Indian Rupee)

28 Annual Report 2004-2005Standard Chartered Mutual Fund
CLOSE ENDED SCHEMES (MATURED)
GFSS-A3 GFSS-A4 GFSS-A6
Apr. 01, 2004 to Apr. 01, 2004 to Apr. 01, 2004 toApr. 05, 2004 Jul. 27, 2004 Nov. 04, 2004
(Units) Amount (Rs.) (Units) Amount (Rs.) (Units) Amount (Rs.)
Units of Rs. 10 each fully paid
Growth Option - Plan A
Units issued, initial offer - - - - - -6,000,000.000 60,000,000 12,000,000.000 120,000,000 - -
Units outstanding,beginning of the year 6,000,000.000 60,000,000 12,000,000.000 120,000,000 - -
- - - - - -Units issued duringthe year - - - - - -
- - - - - -Units repurchasedduring the year - - - - - -
- - - - - -Units outstanding,end of the year 6,000,000.000 60,000,000 12,000,000.000 120,000,000 - -
6,000,000.000 60,000,000 12,000,000.000 120,000,000 - -
Dividend Option - Plan A
Units issued, initial offer - - - - - -40,000,000.000 400,000,000 - - - -
Units outstanding,beginning of the year 40,000,000.000 400,000,000 - - 8,850,577.911 88,505,779
- - - - 8,850,577.911 88,505,779
Units issued duringthe year - - - - - -
- - - - - -Units repurchasedduring the year - - - - - -
- - - - - -Units outstanding,end of the year 40,000,000.000 400,000,000 - - 8,850,577.911 88,505,779
40,000,000.000 400,000,000 - - 8,850,577.911 88,505,779
Total
Units issued, initial offer - - - - - -46,000,000.000 460,000,000 12,000,000.000 120,000,000 - -
Units outstanding,beginning of the year 46,000,000.000 460,000,000 12,000,000.000 120,000,000 8,850,577.911 88,505,779
- - - - 8,850,577.911 88,505,779Units issued duringthe year - - - - - -
- - - - - -Units repurchasedduring the year - - - - - -
- - - - - -Units outstanding,end of the year 46,000,000.000 460,000,000 12,000,000.000 120,000,000 8,850,577.911 88,505,779
46,000,000.000 460,000,000 12,000,000.000 120,000,000 8,850,577.911 88,505,779
3 Unit Capital
March 31, 2005March 31, 2004
Schedules to the financial statementsfor the period / year ended March 31, 2005 (Contd.)
(Currency: Indian Rupee)

29 Annual Report 2004-2005Standard Chartered Mutual Fund
CLOSE ENDED SCHEMES (MATURED)
GFMP-Q GFMP-3
April 01, 2004 to November 27, 2004 toJuly 08, 2004 February 25, 2005
(Units) Amount (Rs.) (Units) Amount (Rs.)
Units of Rs. 10 each fully paid
Growth Option - Plan A
Units issued, initial offer - - 90,265,083.557 902,650,83627,047,560.249 270,475,602 - -
Units outstanding,beginning of the year 27,047,560.249 270,475,602 - -
- - - -Units issuedduring the year - - - -
- - - -Units repurchasedduring the year - - - -
- - - -Units outstanding,end of the year 27,047,560.249 270,475,602 90,265,083.557 902,650,836
27,047,560.249 270,475,602 - -
Dividend Option - Plan A
Units issued, initial offer - - 279,144,167.352 2,791,441,67459,020,297.017 590,202,970 - -
Units outstanding,beginning of the year 59,020,297.017 590,202,970 - -
- - - -
Units issuedduring the year - - - -
- - - -
Units repurchasedduring the year - - - -
- - - -
Units outstanding,end of the year 59,020,297.017 590,202,970 279,144,167.352 2,791,441,674
59,020,297.017 590,202,970 - -
Total
Units issued, initial offer - - 369,409,250.909 3,694,092,51086,067,857.266 860,678,572 - -
Units outstanding,beginning of the year 86,067,857.266 860,678,572 - -
- - - -Units issuedduring the year - - - -
- - - -Units repurchasedduring the year - - - -
- - - -Units outstanding,end of the year 86,067,857.266 860,678,572 369,409,250.909 3,694,092,510
86,067,857.266 860,678,572 - -
3 Unit Capital
March 31, 2005March 31, 2004
Schedules to the financial statementsfor the period / year ended March 31, 2005 (Contd.)
(Currency: Indian Rupee)

30 Annual Report 2004-2005Standard Chartered Mutual Fund
CLOSE ENDED SCHEMES (MATURED)
GFSS-A3 GFSS-A4 GFSS-A6
Apr. 01, 2004 to Apr. 01, 2004 to Apr. 01, 2004 toApr. 05, 2004 Jul. 27, 2004 Nov. 04, 2004
4 Reserves and surplusUnrealised Appreciation ReserveOpening Balance 541,873 - -
- - -Less : Reversed duringthe period / year (541,873) - -
- - -Additions during theperiod / year 734,459 140,003 -
541,873 - -
Closing Balance 734,459 140,003 -541,873 - -
Retained Surplus asat the end of the year 30,434,879 6,446,208 4,216,969
30,329,351 4,518,852 1,730,333
31,169,338 6,586,211 4,216,96930,871,224 4,518,852 1,730,333
The Reserves and surplusof the options are as follows:-
Growth Option - Plan A 4,062,436 6,586,211 -4,026,681 4,518,852 -
Growth Option - Plan B - - -- - -
Dividend Option - Plan A 27,106,902 - 4,216,96926,844,543 - 1,730,333
Dividend Option - Plan B - - -- - -
31,169,338 6,586,211 4,216,96930,871,224 4,518,852 1,730,333
March 31, 2005March 31, 2004
Schedules to the financial statementsfor the period / year ended March 31, 2005 (Contd.)
(Currency: Indian Rupee)

31 Annual Report 2004-2005Standard Chartered Mutual Fund
CLOSE ENDED SCHEMES (MATURED)
GFMP-Q GFMP-3
Apr. 01, 2004 to Nov. 27, 2004 toJul. 08, 2004 Feb. 25, 2005
4 Reserves and surplusUnrealised Appreciation ReserveOpening Balance - -
- -Less : Reversed duringthe period / year - -
- -Additions duringthe period / year - -
- -
Closing Balance -- -
Retained Surplus asat the end of the year 3,906,009 51,776,014
862,725 -
3,906,009 51,776,014862,725 -
The Reserves and surplusof the options are as follows:-
Growth Option - Plan A 3,843,225 12,653,949271,119 -
Growth Option - Plan B - -- -
Dividend Option - Plan A 62,784 39,122,065591,606 -
Dividend Option - Plan B - -- -
3,906,009 51,776,014862,725 -
March 31, 2005March 31, 2004
Schedules to the financial statementsfor the period / year ended March 31, 2005 (Contd.)
(Currency: Indian Rupee)

32 Annual Report 2004-2005Standard Chartered Mutual Fund
CLOSE ENDED SCHEMES (MATURED)
GFSS-A3 GFSS-A4 GFSS-A6Apr. 01, 2004 to Apr. 01, 2004 to Apr. 01, 2004 to
Apr. 05, 2004 Jul. 27, 2004 Nov. 04, 2004
5 Current liabilities and provisionsManagement feespayable (net of tax) 985,831 180,176 337,765
1,214,344 159,810 166,931
Service Tax payable 109,694 15,112 31,996- - -
Brokerage payable - - -361,432 - -
Provision for Dividend Payable - - -- - -
Tax deducted at source payable 44,198 5,510 10,32450,926 8,189 10,369
Other liabilities 593,780 74,807 96,75782,849 36,616 36,000
1,733,503 275,605 476,8421,709,551 204,615 213,300
6 Investments
(net of appreciation / depreciation)
(also refer Note 16) Cost * Market / Cost * Market / Cost * Market /Fair Value Fair Value Fair Value
Privately placed debentures/bonds - - - - - -- - - - - -
Debentures & bonds listed /awaiting listing on recognisedstock exchange - - - - - -
170,000,000 170,027,180 - - - -Certificate of deposit - - - - - -
- - 124,659,005 124,659,005 90,229,567 90,229,567
Securitised Debt - - - - - -- - - - - -
Reverse repos - - - - 91,631,700 91,631,700- - - - - -
Mutual Fund Units 490,000,002 490,734,461 126,699,993 126,839,996 - -310,000,002 310,514,694 - - - -
Collateralised Borrowingand Lending (CBLO) - - - - - -
- - - - - -
490,000,002 490,734,461 126,699,993 126,839,996 91,631,700 91,631,700480,000,002 480,541,874 124,659,005 124,659,005 90,229,567 90,229,567
7 Current assetsBalances with banks incurrent account 2,168,380 21,820 1,553,455
286,736 64,462 219,845
Interest accrued - - 14,43511,752,165 - -
Other assets - - -- - -
2,168,380 21,820 1,567,89012,038,901 64,462 219,845
* Cost includes interest accreted in respect of money market instruments till valuation date. Investments of the Scheme are registered in the name of the Scheme except for government securities, treasury bills, reverse repos and deposits which are registered in the name of the Fund for the benefit of Scheme's unitholders.
March 31, 2005March 31, 2004
Schedules to the financial statementsfor the period / year ended March 31, 2005 (Contd.)
(Currency: Indian Rupee)

33 Annual Report 2004-2005Standard Chartered Mutual Fund
CLOSE ENDED SCHEMES (MATURED)
GFMP-Q GFMP-3Apr. 01, 2004 to Nov. 27, 2004 to
Jul. 08, 2004 Feb. 25, 2004
5 Current liabilities and provisionsManagement feespayable (net of tax) 264,754 906,260
5,598 -
Service Tax payable - 98,089- -
Brokerage payable 218,326 -- -
Provision for Dividend Payable 8,322,784 -- -
Tax deducted at source payable 18,547 32,649303 -
Other liabilities 82,126 313,532- -
8,906,537 1,350,5305,901 -
6 Investments
(net of appreciation / depreciation)
(also refer Note 16) Cost * Market / Cost * Market /Fair Value Fair Value
Privately placed debentures/bonds - - - -- - - -
Debentures & bonds listed /awaiting listing on recognisedstock exchange - - - -
100,177,000 100,167,100 - -
Certificate of deposit 100,000,000 100,000,000 - -331,027,744 331,027,744 - -
Securitised Debt - - - -- - - -
Reverse repos 768,584,063 768,584,063 1,745,832,756 1,745,832,756- - - -
Mutual Fund Units - - - -- - - -
Collateralised Borrowingand Lending (CBLO) - - 2,000,000,000 2,000,000,000
- - - -
868,584,063 868,584,063 3,745,832,756 3,745,832,756431,204,744 431,194,844 - -
7 Current assetsBalances with banks incurrent account 4,840,640 1,167,118
1,025,682 -
Interest accrued 66,415 219,1804,326,672 -
Other assets - -- -
4,907,055 1,386,2985,352,354 -
* Cost includes interest accreted in respect of money market instruments till valuation date. Investments of the Scheme are registered in the name of the Scheme except for government securities, treasury bills, reverse repos and deposits which are registered in the name of the Fund for the benefit of Scheme's unitholders.
March 31, 2005March 31, 2004
Schedules to the financial statementsfor the period / year ended March 31, 2005 (Contd.)
(Currency: Indian Rupee)
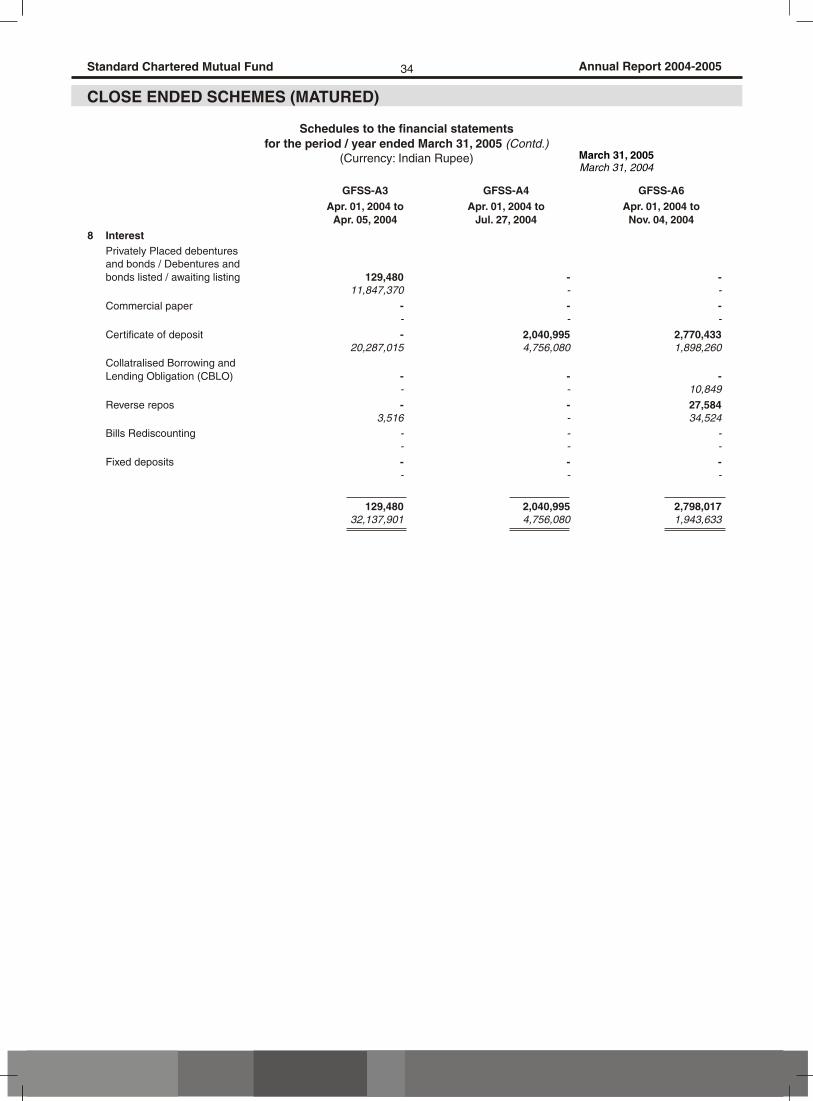
34 Annual Report 2004-2005Standard Chartered Mutual Fund
CLOSE ENDED SCHEMES (MATURED)
GFSS-A3 GFSS-A4 GFSS-A6Apr. 01, 2004 to Apr. 01, 2004 to Apr. 01, 2004 to
Apr. 05, 2004 Jul. 27, 2004 Nov. 04, 2004
8 InterestPrivately Placed debenturesand bonds / Debentures andbonds listed / awaiting listing 129,480 - -
11,847,370 - -
Commercial paper - - -- - -
Certificate of deposit - 2,040,995 2,770,43320,287,015 4,756,080 1,898,260
Collatralised Borrowing andLending Obligation (CBLO) - - -
- - 10,849
Reverse repos - - 27,5843,516 - 34,524
Bills Rediscounting - - -- - -
Fixed deposits - - -- - -
129,480 2,040,995 2,798,01732,137,901 4,756,080 1,943,633
March 31, 2005March 31, 2004
Schedules to the financial statementsfor the period / year ended March 31, 2005 (Contd.)
(Currency: Indian Rupee)

35 Annual Report 2004-2005Standard Chartered Mutual Fund
CLOSE ENDED SCHEMES (MATURED)
GFMP-Q GFMP-3Apr. 01, 2004 to Nov. 27, 2004 to
Jul. 08, 2004 Feb. 25, 20048 Interest
Privately Placed debenturesand bonds / Debentures andbonds listed / awaiting listing 1,596,828 -
109,315 -
Commercial paper - 222,668- -
Certificate of deposit 4,273,147 42,858,000286,410 -
Collatralised Borrowing andLending Obligation (CBLO) - 625,748
3,287 -
Reverse repos - 416,188- -
Bills Rediscounting - 9,030,000- -
Fixed deposits 6,222,787 -479,514 -
12,092,762 53,152,604878,526 -
March 31, 2005March 31, 2004
Schedules to the financial statementsfor the period / year ended March 31, 2005 (Contd.)
(Currency: Indian Rupee)

36
9. NOTES TO ACCOUNTS
9.1 Investment management fees
The schemes have paid or provided for investment management fees in accordance with the agreement with the AMC as amended from time to time and the offer document. In terms of the offer document, the AMC is entitled to receive such fee at an annual rate upto 1.25% of the Scheme's average daily net assets on the first Rs 100 crores and @ 1% on the excess amount over Rs 100 crores. For the current year, the Scheme has accrued management fees at an average annual rate of average daily net asset values for the following schemes:
Scheme Name For the year ended March 31, 2005 For the year ended March 31, 2004
GFSS-A3 0.10% 0.32%
GFSS-A4 0.16% 0.15%
GFSS-A6 0.53% 0.27%
GFMP-Q 0.12% 0.25%
GFMP-3 0.26% NA
9.2 Trustee fees
In accordance with the trust deed as amended from time to time, Grindlays Super Saver Income Fund Investment Plan has accrued trustee fee of Rs 362,500 (Previous Year: Rs 175,586) to Standard Chartered Trustee Company Private Limited, the trustee. These fees are borne by Grindlays Super Saver Income Fund Investment Plan only as decided by the Board of Trustees.
9.3 Custodian fees
Deutsche Bank AG, India provides custodian services to the schemes for which it charges custodian fees as per the terms of the custodian agreement.
9.4 Income tax
No accounting for income tax has been made as the schemes qualify as a recognised Mutual Fund under section 10 (23D) of the Income Tax Act, 1961 and the Direct Tax Laws (Amendment) Act, 1988.
9.5 Aggregate value of purchases and sales
The aggregate value of purchases and sales for the current period (from April 01, 2004 till date of maturity) and previous period / year (upto March 31, 2004) as a percentage of the Scheme's average daily net assets is as follows:
Scheme Name Current Period / Year Previous Period / Year
Purchases Percentage Purchases Percentage GFSS-A3 180,000,000 2,675.12 498,649,397 106.64 GFSS-A4 126,700,000 311.93 119,902,925 141.47 GFSS-A6 182,184,950 333.17 347,777,024 928.89 GFMP-Q 768,584,063 326.56 474,678,609 20,110.15 GFMP-3 6,713,027,345 1,844.58 NA NA
Annual Report 2004-2005Standard Chartered Mutual Fund
CLOSE ENDED SCHEMES (MATURED)
Schedules to the financial statementsfor the period / year ended March 31, 2005 (Contd.)
(Currency: Indian Rupee)

37
Scheme Name Current Period / Year Previous Period / Year
Sales Percentage Sales Percentage GFSS-A3 181,881,644 2,703.08 328,116,320 70.16 GFSS-A4 126,700,000 311.93 Nil Nil GFSS-A6 183,566,398 335.69 259,480,241 693.05 GFMP-Q 340,732,427 144.83 40,000,000 1,694.63 GFMP-3 6,710,858,795 1,843.98 NA NA
9.6 Appreciation/depreciation on investments
The aggregate appreciation and depreciation in the value of investments is as follows:
Scheme / Category Of Current Period / Year Previous Period / Year Investment
Appreciation Depreciation Appreciation DepreciationGFSS-A3Debentures and bondslisted/awaiting listing onrecognised stock exchange - - 27,180 -Mutual Fund Units 734,459 - 514,695 -
GFSS-A4 140,003 - - -
GFSS-A6 - - - -
GFMP-Q - - - (9,900)
GFMP-3 - - - -
9.7 Non-traded investments
As at the date of maturity (current period) and March 31, 2004 (Previous Period / Year) the aggregate fair value of non-traded/thinly traded investments (as defined by the Regulations) is as follows:
Scheme Name Current Period / Year Previous Period / Year
GFSS-A3 490,734,461 480,541,875GFSS-A4 126,839,996 124,659,005GFSS-A6 Nil 90,229,567GFMP-Q 100,000,000 431,194,844GFMP-3 Nil NA
9.8 Income and expenditure
The total income (net of loss on sale of investments and net change in unrealised depreciation in value of investments) and expenditure and these amounts as a percentage of the Scheme's average daily net assets:
Scheme Name Income
Current Period / Year * Previous Period / Year **
Amount Percentage Amount PercentageGFSS-A3 129,479 1.92 32,137,902 6.87GFSS-A4 2,040,995 5.02 4,756,080 5.61GFSS-A6 2,798,017 5.12 1,943,633 5.19GFMP-Q 11,944,010 5.08 868,626 36.80GFMP-3 53,152,603 14.61 NA NA
Annual Report 2004-2005Standard Chartered Mutual Fund
CLOSE ENDED SCHEMES (MATURED)
Schedules to the financial statementsfor the period / year ended March 31, 2005 (Contd.)
(Currency: Indian Rupee)

38
Scheme Name Expenditure
Current Period / Year* Previous Period / Year **
Amount Percentage Amount PercentageGFSS-A3 23,952 0.36 2,171,542 0.47GFSS-A4 113,639 0.28 237,228 0.28GFSS-A6 311,381 0.57 213,300 0.57GFMP-Q 587,842 0.25 5,901 0.25GFMP-3 1,376,590 0.37 NA NA
*Annualised from the date of allotment as the plan commenced during the year. Income represents income from the date when minimum subscription achieved and expenses represents expenses from the date of allotment.
** Annualised from the date of allotment as the plan commenced in the previous year.
9.9 Disclosure under regulation 25 (8) of SEBI Regulations: Nil
9.10 Details of investment in companies that hold more than 5% of NAV of any scheme of Standard Chartered Mutual Fund: Refer Annexure A
9.11 Applicability of loads
Scheme Name Stipulated Repurchase Period Load applicable (% of NAV)
GFSS-A3 Nil NilGFSS-A4 After 90 days from date of allotment 1.00GFSS-A6 After 180 days from date of allotment 0.75
After 270 days from date of allotment 0.50GFMP-Q Nil NilGFMP-3 Nil Nil
9.12 Details of large holdings
Details of unit holdings over 25% of the net assets as on March 31, 2005 is Nil (Previous Year: Nil)
9.13 Portfolio holding (market / fair value) as at March 31, 2005:
Refer Annexure B
All investments, except for mutual fund units, are held in safe custody with Deutsche Bank AG, India /Reserve Bank of India.
9.14 Unpaid redemption and unclaimed dividend
As at March 31, 2005 unpaid redemption and unclaimed dividend aggregate Rs Nil. These details are based on confirmations as received from the Scheme's Registrars that maintain information of unclaimed redemption/dividends on behalf of the Scheme.
9.15 Historical per unit statistics:
Refer Annexure C
Annual Report 2004-2005Standard Chartered Mutual Fund
CLOSE ENDED SCHEMES (MATURED)
Schedules to the financial statementsfor the period / year ended March 31, 2005 (Contd.)
(Currency: Indian Rupee)

39
9.16 Prior period/year comparatives
The prior period / year figures have been reclassified/restated wherever necessary to confirm with the current year's presentation. Prior period / year figures have been shown in italics. There are no comparatives for the prior period / year for GFMP-3 as the units of the scheme were allotted during the course of the current year.
For Standard Chartered Asset Management For Standard Chartered TrusteeCompany Private Limited Company Private Limited
Sd/-Paul Jebson Sd/-Chairman Chairman / Director
Sd/-Naval Bir Kumar Sd/-Managing Director Director
Sd/-Rajiv AnandHead-Investments
MumbaiSeptember 15, 2005
Annual Report 2004-2005Standard Chartered Mutual Fund
CLOSE ENDED SCHEMES (MATURED)
Schedules to the financial statementsfor the period / year ended March 31, 2005 (Contd.)
(Currency: Indian Rupee)

Annexure Aas at March 31, 2005
Details of investment in companies / subsidiaries that hold more than 5% of NAV of any scheme of Standard Chartered Mutual Fund.
Company Schemes Investing Aggregate for Outstanding as at Outstanding as at invested in by Scheme the period under March 31, 2005. March 31, 2004. the company Name Regulation 25 (11) At Market / At Market /
At Cost (Rs.) Fair Value (Rs.) Fair Value (Rs.)
Industrial Development GFRF-ST GSSIF-IP* 4,669,180,800 53,527,700 1,064,667,600 Bank of India GCF GSSIF-ST** 8,279,903,278 - 735,225,800
GDBF GCF*** 15,099,681,647 1,539,315,415 2,409,817,550 GSSIF-IP GDBF**** 3,329,763,050 - 261,074,600
@GSSIF-ST GFRF-ST 6,277,492,359 1,000,363,963 699,947,500 @@ GSSIF-MT 1,763,123,279 10,973,890 379,644,250
@@@GFMP-A 725,164,750 258,570,250 400,063,200 @@@@ GFMP-A2 364,470,250 200,734,287 -
GFMP-6^ 444,432,200 439,718,200 - GFMP-5^^ 205,403,910 205,418,000 - GFMP-7^^^ 296,879,830 296,664,210 - GFMP-9^^^^ 53,859,410 53,527,700 - GFRF-LT# 2,578,031,250 617,373,500 - GFMP-4## 369,039,900 368,702,600 -
Tata Iron & Steel GCF GCF 23,306,875 - - Company Limited GSSIF-ST GSSIF-ST 276,645,950 - -
Hindalco Industries GCF GSSIF-IP 681,578,050 - - Limited GSSIF-IP GSSIF-ST 366,867,300 - 15,537,050
GFMP-A GCF 15,250,200 - - GFMP-A2GFMP-3
HDFC Bank Limited GSSIF-ST GCF 3,169,517,425 - - GFRF-LT GFRF-ST 1,240,555,772 - -
GFRF-LT 272,388,188 157,649,955 - GFMP-4 314,888,802 315,713,711 -
Housing Development Finance Corporation GSSIF-MT GSSIF-IP 4,862,734,033 49,521,050 963,893,150Limited GSSIF-ST 3,567,442,620 - -
GCF 16,033,844,530 900,277,900 738,483,161 GDBF 4,815,504,550 - -
GFRF-ST 9,712,256,300 950,381,550 292,313,476 GSSIF-MT 1,807,998,650 - 54,552,300 GFRF-LT 4,959,082,073 1,250,540,350 - GFMP-6 100,099,500 100,406,600 - GFMP-7 156,408,300 155,947,500 -
GFMP-5 105,876,700 105,093,700 -
Indo Gulf Corporation GSSIF-MT GSSIF-IP 250,000,000 - 273,960,500India Limited GDBF 264,420,250 - -
ICICI Bank Limited GCF GSSIF-IP 4,241,115,619 - 292,885,127 GSSIF-ST 7,059,290,209 - 450,769,200
GCF 23,470,481,902 2,804,042,890 933,062,054 GSSIF-MT 2,015,734,576 28,850,501 168,288,300
GDBF 2,738,769,035 96,378,865 98,612,931 GFRF-ST 8,689,932,850 1,714,726,182 749,152,802
GFSS-A3### 289,564,590 - - GFSS-A4#### 119,902,925 - 124,659,005
GFSS-A6+ 88,613,481 - 90,229,567 GFMP-Q++ 197,082,200 - 197,261,370
GFMP-A 323,301,550 309,053,650 - GFMP-A2 159,451,500 154,124,500 - GFMP-6 106,103,600 106,473,600 - GFMP-5 157,909,650 156,663,000 -
GFMP-3+++ 2,957,142,000 - -
40Standard Chartered Mutual Fund Annual Report 2004-2005
CLOSE ENDED SCHEMES (MATURED)

Annexure Aas at March 31, 2005
Details of investment in companies / subsidiaries that hold more than 5% of NAV of any scheme of Standard Chartered Mutual Fund. (Contd.)Company Schemes Investing Aggregate for Outstanding as at Outstanding as at
invested in by Scheme the period under March 31, 2005. March 31, 2004.
the company Name Regulation 25 (11) At Market / At Market /
At Cost (Rs.) Fair Value (Rs.) Fair Value (Rs.)
41Standard Chartered Mutual Fund Annual Report 2004-2005
CLOSE ENDED SCHEMES (MATURED)
GFMP-7 75,541,130 75,090,450 - GFMP-9 50,000,000 49,434,000 -
GFMP-10~ 1,479,121,500 1,733,843,894 - GFMP-4 96,040,900 - - GFRF-LT 2,091,663,230 1,384,885,765 -
Larsen & Toubro Limited GFRF-ST GCF 2,515,609,355 - 50,000,000 GDBF 50,000,000 - -
GFRF-ST 651,187,335 - 150,000,000 GSSIF-IP 250,000,000 - - GSSIF-ST 997,551,853 - -
Infrastructure DevelopmentFinance Corporation GDBF GSSIF-IP 1,361,393,650 - 215,810,800 Limited ASBF GSSIF-ST 1,913,733,286 - -
GCF 3,753,184,250 - - GFRF-ST 4,056,701,050 - 290,483,478
GDBF 639,568,050 - - GFRF-LT 2,648,228,050 1,202,828,400 - GFMP-6 102,991,900 103,899,300 - GFMP-10 246,112,250 247,271,099 -
ITC Limited GCF GSSIF-IP 200,000,000 - - GFRF-STGSSIF-ST
Bajaj Auto Finance Limited GCF GCF 147,320,050 49,290,992 - GFRF-ST 147,313,400 49,290,992 -
GDBF 49,807,700 - -
Raymond Limited GSSIF-ST GFRF-ST 750,000,000 - - GDBF GFRF-LT 350,000,000 - -
GCF 350,000,000 - -
Tata Sons GCF GFMP-A 101,433,100 100,624,000 - GFMP-3 GFMP-A2 50,716,550 50,312,000 -
GFMP-5 199,408,600 200,679,400 -
Tata Power GCF GSSIF-IP - 41,589,108 -
UTI Bank Limited GSSIF-ST GFRF-ST 2,154,451,400 237,710,600 - GDBF 312,461,400 113,300,373 -
GFMP-Q 98,615,800 - 98,694,897 GFMP-A 195,391,200 - -
GFMP-A2 97,716,250 - - GFMP-4 377,156,000 311,576,015 -
GCF 6,679,313,926 1,991,618,092 507,861,216 GSSIF-ST 1,022,367,772 18,883,398 83,097,891 GFRF-LT 385,740,700 - -
GSSIF-MT 28,253,100 28,325,088 - GSSIF-IP 47,192,500 47,208,497 -
* Grindlays Super Saver Income Fund - Investment Plan; ** Grindlays Super Saver Income Fund - Short Term Plan; *** Grindlays Cash Fund; **** Grindlays Dynamic Bond Fund; @ Grindlays Floating Rate Fund - Short Term; @@ Grindlays Super Saver Income Fund - Medium Term Plan; @@@ Grindlays Fixed Maturity Plan - Annual; @@@@ Grindlays Fixed Maturity Plan - Annual 2; ̂ Grindlays Fixed Maturity Plan - 6th Plan; ̂ ^ Grindlays Fixed Maturity Plan - 5th Plan; ̂ ^^ Grindlays Fixed Maturity Plan - 7th Plan; ̂ ^^^ Grindlays Fixed Maturity Plan - 9th Plan; # Grindlays Floating Rate Fund - Long Term; ## Grindlays Fixed Maturity Plan - 4th Plan; ### Grindlays Fixed Saving Scheme Series - Annual Plan 3; #### Grindlays Fixed Saving Scheme Series - Annual Plan 4; + Grindlays Fixed Saving Scheme Series - Annual Plan 6; ++ Grindlays Fixed Maturity Plan - Quarterly; +++ Grindlays Fixed Maturity Plan - 3th Plan; ~ Grindlays Fixed Maturity Plan - 10th Plan

42 Annual Report 2004-2005Standard Chartered Mutual Fund
Annexure BPortfolio holding (market / fair value) as at March 31, 2005
GFMP-A3 GFMP-A4 GFMP-A6
Amount (Rs) % Amount (Rs) % Amount (Rs) %
Privately placed debentures and bondsNon Banking Financial Companies (NBFC)GE Capital Services Limited - - - - - -
90,014,940 52.94 - - - -
Citi Finance Consumer Limited - - - - - -- - - - - -
Rabo India - - - - - -80,012,240 47.06 - - - -
- -
Total - - - - - -170,027,180 100.00 - - - -
Collateralised Borrowing and Lending ObligationCBLO MT DT 26/02/05 - - - - - -
- - - - - -
CBLO MT DT 26/02/05 - - - - - -- - - - - -
CBLO MT DT 26/02/05 - - - - - -- -
Total - - - - - -- - - - - -
Certificate Of DepositsBanks and Financial InstitutionsICICI Bank Limited - - - - - -
- - 124,659,005 100.00 90,229,567 100.00
Kotak Mahindra Bank - - - - - -- - - - - -
UTI Bank - - - - - -- - - - - -
Total - - - - - -- - 124,659,005 100.00 90,229,567 100.00
Mutual Fund Units
Investment in GCF 490,734,461 100.00 126,699,993 100.00 - -310,514,695 100.00 - - -
Total 490,734,461 100.00 126,699,993 100.00 - -310,514,695 100.00 - - - -
Reverse Repos4.41% GOI 2009 - - - - 91,631,700 100.00
- - - - - -
- - - - 91,631,700 100.00- - - - - -
TOTAL INVESTMENTS 490,734,461 126,699,993 91,631,700480,541,875 124,659,005 90,229,567
March 31, 2005March 31, 2004
CLOSE ENDED SCHEMES (MATURED)

43 Annual Report 2004-2005Standard Chartered Mutual Fund
Annexure BPortfolio holding (market / fair value) as at March 31, 2005 (Contd.)
GFMP-Q GFMP-3
Amount (Rs) % Amount (Rs) %
Privately placed debentures and bondsNon Banking Financial Companies (NBFC)GE Capital Services Limited - - - -
- - - -
Citi Finance Consumer Limited - - - -100,167,100 100.00 - -
Rabo India - - - -- - - -- - - -
Total - - - -100,167,100 100.00 - -
Collateralised Borrowing and Lending Obligation
CBLO MT DT 26/02/05 - - 250,000,000 12.50- - - -
CBLO MT DT 26/02/05 - - 1,250,000,000 62.50- - - -
CBLO MT DT 26/02/05 - - 500,000,000 25.00
Total - - 2,000,000,000 100.00- - - -
Certificate Of Deposits
Banks and Financial Institutions
ICICI Bank Limited - - - -197,261,370 59.59 - -
Kotak Mahindra Bank - - - -35,071,477 10.59 - -
UTI Bank 100,000,000 100.00 - -98,694,897 29.81 - -
Total 100,000,000 100.00 - -331,027,744 100.00 - -
Mutual Fund Units
Investment in GCF - - - -- - - -
Total - - - -- - - -
Reverse Repos4.41% GOI 2009 768,584,063 100.00 1,745,832,756 100.00
- - - -
768,584,063 100.00 1,745,832,756 100.00- - - -
TOTAL INVESTMENTS 868,584,063 3,745,832,756431,194,844 -
March 31, 2005March 31, 2004
CLOSE ENDED SCHEMES (MATURED)

44 Annual Report 2004-2005Standard Chartered Mutual Fund
Grindlays Fixed Savings Scheme - Annual Plan 3
Apr. 01, 2004 to Apr. 01, 2003 toApr. 05, 2004 Mar. 31, 2004
A NAVGrowth Option 10.6778 10.6711Dividend Option 10.6778 10.6711
B Gross Incomei Income other than profit on sale of investment 0.0028 0.6987ii Income from profit on inter scheme
Sales / transfer of investment - -iii Income from profit on sale of investment to third party - -iv Transfer to revenue account from past year’s reserve - -
C Aggregate of expenses, write off, amortisation and charges 0.0005 0.0472
D Net Income 0.0023 0.6515
E Unrealised Appreciation in value of investments 0.0160 0.0118
F (a) NAV Highest * Lowest* Highest LowestGrowth Option 10.6778 10.6778 10.6711 10.0115Dividend Option 10.6778 10.6778 10.6711 10.0115
(b) Repurchase Price Highest * Lowest* Highest LowestGrowth Option 10.6778 10.6778 10.6711 10.0115Dividend Option 10.6778 10.6778 10.6711 10.0115
(c) Resale Price Highest * Lowest* Highest LowestGrowth Option 10.6778 10.6778 10.6711 10.0115Dividend Option 10.6778 10.6778 10.6711 10.0115
G Ratio of Expenses to Average Net Assetsby percentage (Annualised) 0.36% 0.47%
H Ratio of Gross Income to Average Net Assetsby percentage (Annualised) 1.92% 6.87%
Note
* For the period from April 01, 2004 to April 05, 2004.
Annexure CHistorical per unit statistics for the period / year ended April 05, 2004
(Currency: Indian Rupee)
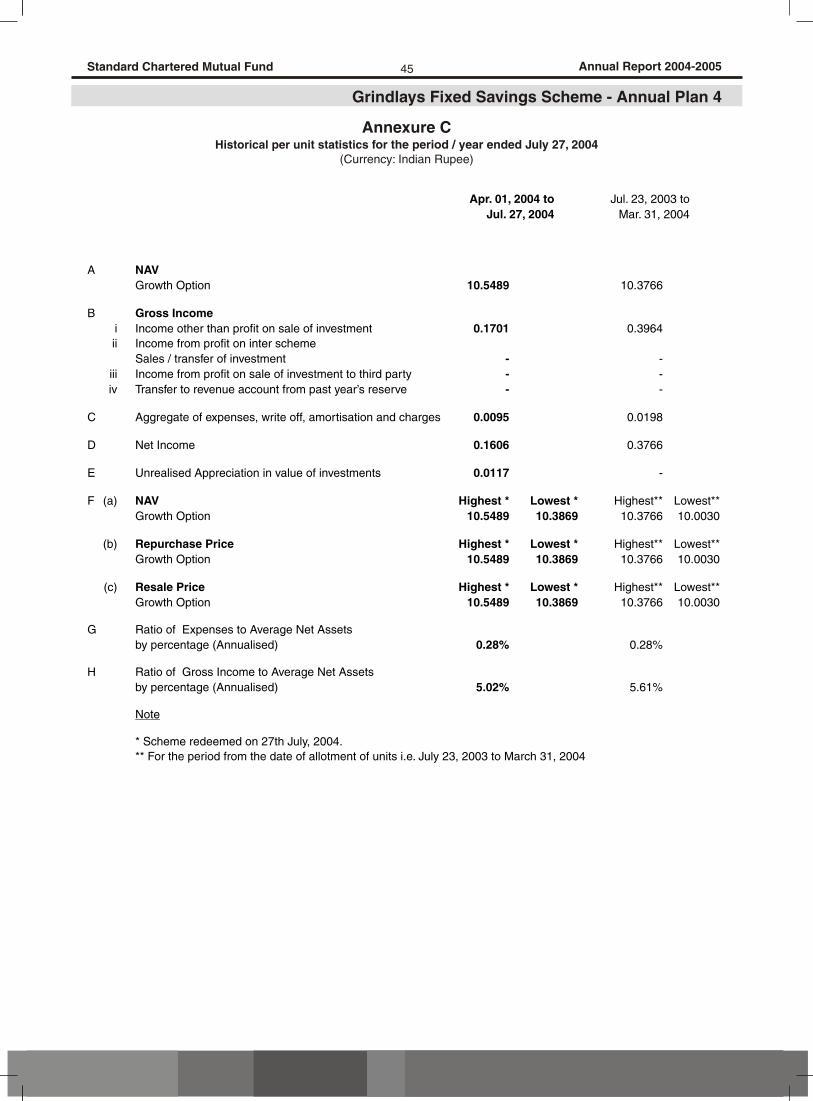
45 Annual Report 2004-2005Standard Chartered Mutual Fund
Grindlays Fixed Savings Scheme - Annual Plan 4
Apr. 01, 2004 to Jul. 23, 2003 toJul. 27, 2004 Mar. 31, 2004
A NAVGrowth Option 10.5489 10.3766
B Gross Incomei Income other than profit on sale of investment 0.1701 0.3964ii Income from profit on inter scheme
Sales / transfer of investment - -iii Income from profit on sale of investment to third party - -iv Transfer to revenue account from past year’s reserve - -
C Aggregate of expenses, write off, amortisation and charges 0.0095 0.0198
D Net Income 0.1606 0.3766
E Unrealised Appreciation in value of investments 0.0117 -
F (a) NAV Highest * Lowest * Highest** Lowest**Growth Option 10.5489 10.3869 10.3766 10.0030
(b) Repurchase Price Highest * Lowest * Highest** Lowest**Growth Option 10.5489 10.3869 10.3766 10.0030
(c) Resale Price Highest * Lowest * Highest** Lowest**Growth Option 10.5489 10.3869 10.3766 10.0030
G Ratio of Expenses to Average Net Assetsby percentage (Annualised) 0.28% 0.28%
H Ratio of Gross Income to Average Net Assetsby percentage (Annualised) 5.02% 5.61%
Note
* Scheme redeemed on 27th July, 2004.** For the period from the date of allotment of units i.e. July 23, 2003 to March 31, 2004
Annexure CHistorical per unit statistics for the period / year ended July 27, 2004
(Currency: Indian Rupee)

46 Annual Report 2004-2005Standard Chartered Mutual Fund
Grindlays Fixed Savings Scheme - Annual Plan 6
Apr. 01, 2004 to Oct. 31, 2003 toNov. 04, 2004 Mar. 31, 2004
A NAVDividend Option 10.4765 10.1955
B Gross Incomei Income other than profit on sale of investment 0.3161 0.2196ii Income from profit on inter scheme
Sales / transfer of investment -iii Income from profit on sale of investment to third party -iv Transfer to revenue account from past year’s reserve -
C Aggregate of expenses, write off, amortisation and charges 0.0352 0.0241
D Net Income 0.2809 0.1955
E Unrealised Appreciation in value of investments -
F (a) NAV Highest ** Lowest** Highest * Lowest*Dividend Option 10.4765 10.2045 10.1955 10.0011
(b) Repurchase Price Highest ** Lowest** Highest * Lowest*Dividend Option 10.4765 10.2045 10.1955 10.0011
(c) Resale Price Highest ** Lowest** Highest * Lowest*Dividend Option 10.4765 10.2045 10.1955 10.0011
G Ratio of Expenses to Average Net Assetsby percentage (Annualised) 0.57% 0.57%
H Ratio of Gross Income to Average Net Assetsby percentage (Annualised) 5.12% 5.19%
Note
** For the period from the date of allotment of units i.e. April 1, 2004 to November 4, 2004* For the period from the date of allotment of units i.e. October 31, 2003 to March 31, 2004.
Annexure CHistorical per unit statistics for the period / year ended November 04, 2004
(Currency: Indian Rupee)

47 Annual Report 2004-2005Standard Chartered Mutual Fund
Grindlays Fixed Maturity Plan - Quarterly Plan
Apr. 01, 2004 to Mar. 31, 2004 toJul. 08, 2004 Mar. 31, 2004
A NAVGrowth Option 10.1421 10.0100Dividend Option 10.0011 10.0100
B Gross Incomei Income other than profit on sale of investment 0.1405 0.0101ii Income from profit on inter scheme
Sales / transfer of investment (0.0016) -iii Income from profit on sale of investment to third party - -iv Transfer to revenue account from past year’s reserve - -
C Aggregate of expenses, write off, amortisation and charges 0.0068 0.0001
D Net Income 0.1337 0.0100
E Unrealised Appreciation in value of investments - -
F (a) NAV Highest ** Lowest ** Highest * Lowest*Growth Option 10.1421 10.0011 10.0100 10.0100Dividend Option 10.1421 10.0011 10.0100 10.0100
(b) Repurchase Price Highest ** Lowest ** Highest * Lowest*Growth Option 10.1421 10.0011 10.0100 10.0100Dividend Option 10.1421 10.0011 10.0100 10.0100
(c) Resale Price Highest ** Lowest ** Highest * Lowest*Growth Option 10.1421 10.0011 10.0100 10.0100Dividend Option 10.1421 10.0011 10.0100 10.0100
G Ratio of Expenses to Average Net Assetsby percentage (Annualised) 0.25% 0.25%
H Ratio of Gross Income to Average Net Assetsby percentage (Annualised) 5.08% 36.80%
Note
* For the period from the date of allotment of units i.e. March 31, 2004** For the period from April 01, 2004 to July 08, 2004
Annexure CHistorical per unit statistics for the period / year ended July 08, 2004
(Currency: Indian Rupee)

48 Annual Report 2004-2005Standard Chartered Mutual Fund
Grindlays Fixed Maturity Plan - 3rd Plan
Nov. 27, 2004 toFeb. 25, 2005
A NAVGrowth Option 10.1401Dividend Option 10.0000
B Gross Incomei Income other than profit on sale of investment 0.1439ii Income from profit on inter scheme Sales / transfer of investment -iii Income from profit on sale of investment to third party -iv Transfer to revenue account from past year’s reserve -
C Aggregate of expenses, write off, amortisation and charges 0.0037
D Net Income 0.1402
E Unrealised Appreciation in value of investments -
F (a) NAV Highest * Lowest*Growth Option 10.1401 10.0105Dividend Option 10.1374 10.0105
(b) Repurchase Price Highest * Lowest*Growth Option 10.1401 10.0105Dividend Option 10.1374 10.0105
(c) Resale Price Highest * Lowest*Growth Option 10.1401 10.0105Dividend Option 10.1374 10.0105
G Ratio of Expenses to Average Net Assetsby percentage (Annualised) 0.15%
H Ratio of Gross Income to Average Net Assetsby percentage (Annualised) 5.73%
Note
* For the period from the date of allotment of units i.e. November 27, 2004 to February 25, 2005
There are no comparatives for the prior period as the units of Grindlays Fixed Maturity Plan - 3rd Plan were allotted onNovember 27, 2004
Annexure CHistorical per unit statistics for the period / year ended February 25, 2005
(Currency: Indian Rupee)

Grindlays Fixed Maturity Plan - Annual
Standard Chartered Mutual Fund 49
AUDITORS’ REPORT
To the Board of Trustees of
Standard Chartered Mutual Fund
We have audited the attached Balance Sheet of Standard Chartered Mutual Fund - Grindlays Fixed Maturity Plan - Annual ('the Scheme') as at 31 March 2005 and the related Revenue Account for the year ended on that date annexed thereto.
These financial statements are the responsibility of the Trustees of Standard Chartered Mutual Fund and the management of Standard Chartered Asset Management Company Private Limited. Our responsibility is to express an opinion on these financial statements based on our audit.
We conducted our audit in accordance with auditing standards generally accepted in India. Those standards require that we plan and perform the audit to obtain reasonable assurance about whether the financial statements are free of material misstatement. An audit includes examining, on a test check basis, evidence supporting the amounts and disclosures in the financial statements. An audit also includes assessing the accounting principles used and significant estimates made by management, as well as evaluating the overall financial statement presentation. We believe that our audit provides a reasonable basis for our opinion.
We report thereon as follows:
+ We have obtained all the information and explanations, which, to the best of our knowledge and belief, were necessary for the purpose of the audit; and
+ The Balance Sheet and the related Revenue Account dealt with by this report are in agreement with the books of account of the Scheme.
In our opinion and to the best of our information and according to the explanations given to us:
+ The Balance Sheet as at 31 March 2005 and the related Revenue Account for the year ended on that date, together with the notes thereon, have been prepared in accordance with the accounting policies and standards specified in the Ninth Schedule of the Securities and Exchange Board of India (Mutual Funds) Regulations, 1996 and amendments thereto, as applicable;
+ The Balance Sheet as at 31 March 2005 and the related Revenue Account for the year ended on that date together with the notes thereon give the information required by the Securities and Exchange Board of India (Mutual Funds) Regulations, 1996 and amendments thereto, as applicable, and give a true and fair view:
- In so far as it relates to the Balance Sheet, of the state of affairs of the Scheme as at 31 March 2005; and
- In so far as it relates to the Revenue Account, of the surplus for the year ended on that date.
+ The methods used to value non-traded/thinly traded securities in good faith are fair and reasonable.
For BSR & Co.(formerly Bharat S Raut & Co.)
Chartered Accountants
Akeel MasterPartner
Membership No.: 046768MumbaiDate: September 15, 2005
Annual Report 2004-2005

Grindlays Fixed Maturity Plan - Annual Plan 2
Standard Chartered Mutual Fund 50
AUDITORS’ REPORT
To the Board of Trustees of
Standard Chartered Mutual Fund
We have audited the attached Balance Sheet of Standard Chartered Mutual Fund - Grindlays Fixed Maturity Plan - Annual 2 ('the Scheme') as at 31 March 2005 and the related Revenue Account for the period ended on that date annexed thereto.
These financial statements are the responsibility of the Trustees of Standard Chartered Mutual Fund and the management of Standard Chartered Asset Management Company Private Limited. Our responsibility is to express an opinion on these financial statements based on our audit.
We conducted our audit in accordance with auditing standards generally accepted in India. Those standards require that we plan and perform the audit to obtain reasonable assurance about whether the financial statements are free of material misstatement. An audit includes examining, on a test basis, evidence supporting the amounts and disclosures in the financial statements. An audit also includes assessing the accounting principles used and significant estimates made by management, as well as evaluating the overall financial statement presentation. We believe that our audit provides a reasonable basis for our opinion.
We report thereon as follows:
+ We have obtained all the information and explanations, which, to the best of our knowledge and belief, were necessary for the purpose of the audit; and
+ The Balance Sheet and the related Revenue Account dealt with by this report are in agreement with the books of account of the Scheme.
In our opinion and to the best of our information and according to the explanations given to us:
+ The Balance Sheet as at 31 March 2005 and the related Revenue Account for the period ended on that date, together with the notes thereon, have been prepared in accordance with the accounting policies and standards specified in the Ninth Schedule of the Securities and Exchange Board of India (Mutual Funds) Regulations, 1996 and amendments thereto, as applicable;
+ The Balance Sheet as at 31 March 2005 and the related Revenue Account for the period ended on that date together with the notes thereon give the information required by the Securities and Exchange Board of India (Mutual Funds) Regulations, 1996 and amendments thereto, as applicable, and give a true and fair view:
- In so far as it relates to the Balance Sheet, of the state of affairs of the Scheme as at 31 March 2005; and
- In so far as it relates to the Revenue Account, of the surplus for the period ended on that date.
+ In our opinion and to the best of our information and according to the explanations given to us, the methods used to value non-traded/thinly traded securities in good faith are fair and reasonable.
For BSR & Co.(formerly Bharat S Raut & Co.)
Chartered Accountants
Akeel MasterPartner
Membership No.: 046768MumbaiDate: September 15, 2005
Annual Report 2004-2005

Grindlays Fixed Maturity Plan - 4th Plan
Standard Chartered Mutual Fund 51
AUDITORS’ REPORT
To the Board of Trustees of
Standard Chartered Mutual Fund
We have audited the attached Balance Sheet of Standard Chartered Mutual Fund - Grindlays Fixed Maturity Plan - 4th Plan ('the Scheme') as at 31 March 2005 and the related Revenue Account for the period ended on that date annexed thereto.
These financial statements are the responsibility of the Trustees of Standard Chartered Mutual Fund and the management of Standard Chartered Asset Management Company Private Limited. Our responsibility is to express an opinion on these financial statements based on our audit.
We conducted our audit in accordance with auditing standards generally accepted in India. Those standards require that we plan and perform the audit to obtain reasonable assurance about whether the financial statements are free of material misstatement. An audit includes examining, on a test basis, evidence supporting the amounts and disclosures in the financial statements. An audit also includes assessing the accounting principles used and significant estimates made by management, as well as evaluating the overall financial statement presentation. We believe that our audit provides a reasonable basis for our opinion.
We report thereon as follows:
+ We have obtained all the information and explanations, which, to the best of our knowledge and belief, were necessary for the purpose of the audit; and
+ The Balance Sheet and the related Revenue Account dealt with by this report are in agreement with the books of account of the Scheme.
In our opinion and to the best of our information and according to the explanations given to us:
+ The Balance Sheet as at 31 March 2005 and the related Revenue Account for the period ended on that date, together with the notes thereon, have been prepared in accordance with the accounting policies and standards specified in the Ninth Schedule of the Securities and Exchange Board of India (Mutual Funds) Regulations, 1996 and amendments thereto, as applicable;
+ The Balance Sheet as at 31 March 2005 and the related Revenue Account for the period ended on that date together with the notes thereon give the information required by the Securities and Exchange Board of India (Mutual Funds) Regulations, 1996 and amendments thereto, as applicable, and give a true and fair view:
- In so far as it relates to the Balance Sheet, of the state of affairs of the Scheme as at 31 March 2005; and
- In so far as it relates to the Revenue Account, of the surplus for the period ended on that date.
+ In our opinion and to the best of our information and according to the explanations given to us, the methods used to value non-traded/thinly traded securities in good faith are fair and reasonable.
For BSR & Co.(formerly Bharat S Raut & Co.)
Chartered Accountants
Akeel MasterPartner
Membership No.: 046768MumbaiDate: September 15, 2005
Annual Report 2004-2005

Grindlays Fixed Maturity Plan - 5th Plan
Standard Chartered Mutual Fund 52
AUDITORS’ REPORT
To the Board of Trustees of
Standard Chartered Mutual Fund
We have audited the attached Balance Sheet of Standard Chartered Mutual Fund - Grindlays Fixed Maturity Plan - 5th Plan ('the Scheme') as at 31 March 2005 and the related Revenue Account for the period ended on that date annexed thereto.
These financial statements are the responsibility of the Trustees of Standard Chartered Mutual Fund and the management of Standard Chartered Asset Management Company Private Limited. Our responsibility is to express an opinion on these financial statements based on our audit.
We conducted our audit in accordance with auditing standards generally accepted in India. Those standards require that we plan and perform the audit to obtain reasonable assurance about whether the financial statements are free of material misstatement. An audit includes examining, on a test basis, evidence supporting the amounts and disclosures in the financial statements. An audit also includes assessing the accounting principles used and significant estimates made by management, as well as evaluating the overall financial statement presentation. We believe that our audit provides a reasonable basis for our opinion.
We report thereon as follows:
+ We have obtained all the information and explanations, which, to the best of our knowledge and belief, were necessary for the purpose of the audit; and
+ The Balance Sheet and the related Revenue Account dealt with by this report are in agreement with the books of account of the Scheme.
In our opinion and to the best of our information and according to the explanations given to us:
+ The Balance Sheet as at 31 March 2005 and the related Revenue Account for the period ended on that date, together with the notes thereon, have been prepared in accordance with the accounting policies and standards specified in the Ninth Schedule of the Securities and Exchange Board of India (Mutual Funds) Regulations, 1996 and amendments thereto, as applicable;
+ The Balance Sheet as at 31 March 2005 and the related Revenue Account for the period ended on that date together with the notes thereon give the information required by the Securities and Exchange Board of India (Mutual Funds) Regulations, 1996 and amendments thereto, as applicable, and give a true and fair view:
- In so far as it relates to the Balance Sheet, of the state of affairs of the Scheme as at 31 March 2005; and
- In so far as it relates to the Revenue Account, of the surplus for the period ended on that date.
+ In our opinion and to the best of our information and according to the explanations given to us, the methods used to value non-traded/thinly traded securities in good faith are fair and reasonable.
For BSR & Co.(formerly Bharat S Raut & Co.)
Chartered Accountants
Akeel MasterPartner
Membership No.: 046768MumbaiDate: September 15, 2005
Annual Report 2004-2005

Grindlays Fixed Maturity Plan - 6th Plan
Standard Chartered Mutual Fund 53
AUDITORS’ REPORT
To the Board of Trustees of
Standard Chartered Mutual Fund
We have audited the attached Balance Sheet of Standard Chartered Mutual Fund - Grindlays Fixed Maturity Plan - 6th Plan ('the Scheme') as at 31 March 2005 and the related Revenue Account for the period ended on that date annexed thereto.
These financial statements are the responsibility of the Trustees of Standard Chartered Mutual Fund and the management of Standard Chartered Asset Management Company Private Limited. Our responsibility is to express an opinion on these financial statements based on our audit.
We conducted our audit in accordance with auditing standards generally accepted in India. Those standards require that we plan and perform the audit to obtain reasonable assurance about whether the financial statements are free of material misstatement. An audit includes examining, on a test basis, evidence supporting the amounts and disclosures in the financial statements. An audit also includes assessing the accounting principles used and significant estimates made by management, as well as evaluating the overall financial statement presentation. We believe that our audit provides a reasonable basis for our opinion.
We report thereon as follows:
+ We have obtained all the information and explanations, which, to the best of our knowledge and belief, were necessary for the purpose of the audit; and
+ The Balance Sheet and the related Revenue Account dealt with by this report are in agreement with the books of account of the Scheme.
In our opinion and to the best of our information and according to the explanations given to us:
+ The Balance Sheet as at 31 March 2005 and the related Revenue Account for the period ended on that date, together with the notes thereon, have been prepared in accordance with the accounting policies and standards specified in the Ninth Schedule of the Securities and Exchange Board of India (Mutual Funds) Regulations, 1996 and amendments thereto, as applicable;
+ The Balance Sheet as at 31 March 2005 and the related Revenue Account for the period ended on that date together with the notes thereon give the information required by the Securities and Exchange Board of India (Mutual Funds) Regulations, 1996 and amendments thereto, as applicable, and give a true and fair view:
- In so far as it relates to the Balance Sheet, of the state of affairs of the Scheme as at 31 March 2005; and
- In so far as it relates to the Revenue Account, of the surplus for the period ended on that date.
+ In our opinion and to the best of our information and according to the explanations given to us, the methods used to value non-traded/thinly traded securities in good faith are fair and reasonable.
For BSR & Co.(formerly Bharat S Raut & Co.)
Chartered Accountants
Akeel MasterPartner
Membership No.: 046768MumbaiDate: September 15, 2005
Annual Report 2004-2005

Grindlays Fixed Maturity Plan - 7th Plan
Standard Chartered Mutual Fund 54
AUDITORS’ REPORT
To the Board of Trustees of
Standard Chartered Mutual Fund
We have audited the attached Balance Sheet of Standard Chartered Mutual Fund - Grindlays Fixed Maturity Plan - 7th Plan ('the Scheme') as at 31 March 2005 and the related Revenue Account for the period ended on that date annexed thereto.
These financial statements are the responsibility of the Trustees of Standard Chartered Mutual Fund and the management of Standard Chartered Asset Management Company Private Limited. Our responsibility is to express an opinion on these financial statements based on our audit.
We conducted our audit in accordance with auditing standards generally accepted in India. Those standards require that we plan and perform the audit to obtain reasonable assurance about whether the financial statements are free of material misstatement. An audit includes examining, on a test basis, evidence supporting the amounts and disclosures in the financial statements. An audit also includes assessing the accounting principles used and significant estimates made by management, as well as evaluating the overall financial statement presentation. We believe that our audit provides a reasonable basis for our opinion.
We report thereon as follows:
+ We have obtained all the information and explanations, which, to the best of our knowledge and belief, were necessary for the purpose of the audit; and
+ The Balance Sheet and the related Revenue Account dealt with by this report are in agreement with the books of account of the Scheme.
In our opinion and to the best of our information and according to the explanations given to us:
+ The Balance Sheet as at 31 March 2005 and the related Revenue Account for the period ended on that date, together with the notes thereon, have been prepared in accordance with the accounting policies and standards specified in the Ninth Schedule of the Securities and Exchange Board of India (Mutual Funds) Regulations, 1996 and amendments thereto, as applicable;
+ The Balance Sheet as at 31 March 2005 and the related Revenue Account for the period ended on that date together with the notes thereon give the information required by the Securities and Exchange Board of India (Mutual Funds) Regulations, 1996 and amendments thereto, as applicable, and give a true and fair view:
- In so far as it relates to the Balance Sheet, of the state of affairs of the Scheme as at 31 March 2005; and
- In so far as it relates to the Revenue Account, of the surplus for the period ended on that date.
+ In our opinion and to the best of our information and according to the explanations given to us, the methods used to value non-traded/thinly traded securities in good faith are fair and reasonable.
For BSR & Co.(formerly Bharat S Raut & Co.)
Chartered Accountants
Akeel MasterPartner
Membership No.: 046768MumbaiDate: September 15, 2005
Annual Report 2004-2005

Grindlays Fixed Maturity Plan - 9th Plan
Standard Chartered Mutual Fund 55
AUDITORS’ REPORT
To the Board of Trustees of
Standard Chartered Mutual Fund
We have audited the attached Balance Sheet of Standard Chartered Mutual Fund - Grindlays Fixed Maturity Plan - 9th Plan ('the Scheme') as at 31 March 2005 and the related Revenue Account for the period ended on that date annexed thereto.
These financial statements are the responsibility of the Trustees of Standard Chartered Mutual Fund and the management of Standard Chartered Asset Management Company Private Limited. Our responsibility is to express an opinion on these financial statements based on our audit.
We conducted our audit in accordance with auditing standards generally accepted in India. Those standards require that we plan and perform the audit to obtain reasonable assurance about whether the financial statements are free of material misstatement. An audit includes examining, on a test basis, evidence supporting the amounts and disclosures in the financial statements. An audit also includes assessing the accounting principles used and significant estimates made by management, as well as evaluating the overall financial statement presentation. We believe that our audit provides a reasonable basis for our opinion.
We report thereon as follows:
+ We have obtained all the information and explanations, which, to the best of our knowledge and belief, were necessary for the purpose of the audit; and
+ The Balance Sheet and the related Revenue Account dealt with by this report are in agreement with the books of account of the Scheme.
In our opinion and to the best of our information and according to the explanations given to us:
+ The Balance Sheet as at 31 March 2005 and the related Revenue Account for the period ended on that date, together with the notes thereon, have been prepared in accordance with the accounting policies and standards specified in the Ninth Schedule of the Securities and Exchange Board of India (Mutual Funds) Regulations, 1996 and amendments thereto, as applicable;
+ The Balance Sheet as at 31 March 2005 and the related Revenue Account for the period ended on that date together with the notes thereon give the information required by the Securities and Exchange Board of India (Mutual Funds) Regulations, 1996 and amendments thereto, as applicable, and give a true and fair view:
- In so far as it relates to the Balance Sheet, of the state of affairs of the Scheme as at 31 March 2005; and
- In so far as it relates to the Revenue Account, of the deficit for the period ended on that date.
+ In our opinion and to the best of our information and according to the explanations given to us, the methods used to value non-traded/thinly traded securities in good faith are fair and reasonable.
For BSR & Co.(formerly Bharat S Raut & Co.)
Chartered Accountants
Akeel MasterPartner
Membership No.: 046768MumbaiDate: September 15, 2005
Annual Report 2004-2005
Grindlays Fixed Maturity Plan - 10th Plan
Standard Chartered Mutual Fund 56
AUDITORS’ REPORT
To the Board of Trustees of
Standard Chartered Mutual Fund
We have audited the attached Balance Sheet of Standard Chartered Mutual Fund - Grindlays Fixed Maturity Plan - 10th Plan ('the Scheme') as at 31 March 2005 and the related Revenue Account for the period ended on that date annexed thereto.
These financial statements are the responsibility of the Trustees of Standard Chartered Mutual Fund and the management of Standard Chartered Asset Management Company Private Limited. Our responsibility is to express an opinion on these financial statements based on our audit.
We conducted our audit in accordance with auditing standards generally accepted in India. Those standards require that we plan and perform the audit to obtain reasonable assurance about whether the financial statements are free of material misstatement. An audit includes examining, on a test basis, evidence supporting the amounts and disclosures in the financial statements. An audit also includes assessing the accounting principles used and significant estimates made by management, as well as evaluating the overall financial statement presentation. We believe that our audit provides a reasonable basis for our opinion.
We report thereon as follows:
+ We have obtained all the information and explanations, which, to the best of our knowledge and belief, were necessary for the purpose of the audit; and
+ The Balance Sheet and the related Revenue Account dealt with by this report are in agreement with the books of account of the Scheme.
In our opinion and to the best of our information and according to the explanations given to us:
+ The Balance Sheet as at 31 March 2005 and the related Revenue Account for the period ended on that date, together with the notes thereon, have been prepared in accordance with the accounting policies and standards specified in the Ninth Schedule of the Securities and Exchange Board of India (Mutual Funds) Regulations, 1996 and amendments thereto, as applicable;
+ The Balance Sheet as at 31 March 2005 and the related Revenue Account for the period ended on that date together with the notes thereon give the information required by the Securities and Exchange Board of India (Mutual Funds) Regulations, 1996 and amendments thereto, as applicable, and give a true and fair view:
- In so far as it relates to the Balance Sheet, of the state of affairs of the Scheme as at 31 March 2005; and
- In so far as it relates to the Revenue Account, of the surplus for the period ended on that date.
+ In our opinion and to the best of our information and according to the explanations given to us, the methods used to value non-traded/thinly traded securities in good faith are fair and reasonable.
For BSR & Co.(formerly Bharat S Raut & Co.)
Chartered Accountants
Akeel MasterPartner
Membership No.: 046768MumbaiDate: September 15, 2005
Annual Report 2004-2005

57
CLOSE ENDED SCHEMES (LIVE)
Balance Sheet as at March 31, 2005(Currency: Indian Rupee)
For BSR & Co. For Standard Chartered Asset Management For Standard Chartered Trustee(formerly Bharat S Raut & Co) Company Private Limited Company Private LimitedChartered Accountants
Sd/- Sd/-Akeel Master Paul Jebson Sd/-Partner Chairman Chairman / DirectorMembership No.: 046768
Sd/-Naval Bir Kumar Sd/-Managing Director Director
Sd/-Rajiv Anand
Mumbai Head-InvestmentsSeptember 15, 2005
Schedules GFMP - A GFMP - A2 GFMP - 4 GFMP - 5
Apr. 01, 2004 to Sep. 27, 2004 to Mar. 31, 2005 to Dec. 20, 2004 toMar. 31, 2005 Mar. 31, 2005 Mar. 31, 2005 Mar. 31, 2005
LIABILITIES
Unit capital 3 2,860,164,314 1,400,408,008 2,116,436,092 1,451,185,6892,860,164,314 - - -
Reserves and surplus 4 153,804,873 49,760,766 3,418,371 27,193,1263,300,944 - - -
Current liabilities and provisions 5 8,261,776 2,697,025 21,027 1,117,89318,243 - - -
3,022,230,963 1,452,865,799 2,119,875,490 1,479,496,7082,863,483,501 - - -
ASSETSInvestments 6 2,934,886,316 1,394,907,068 2,076,245,012 1,424,173,157
1,433,330,343 - - -
Deposits 7 - - - -1,420,000,000 - - -
Current assets 8 87,344,647 57,958,731 43,630,478 55,323,55110,153,158 - - -
3,022,230,963 1,452,865,799 2,119,875,490 1,479,496,7082,863,483,501 - - -
Net Asset Value per unitGrowth Option - Plan A 10.5380 10.3553 10.0162 10.1874
10.0115 - - -Growth Option - Plan B - - 10.0162 -
- - - -Dividend Option - Plan A 10.5380 10.3553 10.0162 10.1874
10.0115 - - -
Dividend Option - Plan B - - - -- - - -
Significant accounting policies 2Notes to Accounts 10
The schedules referred to above form an integral part of the Balance Sheet.As per our report attached of even date
Annual Report 2004-2005Standard Chartered Mutual Fund
March 31, 2005March 31, 2004

58
CLOSE ENDED SCHEMES (LIVE)
Balance Sheet as at March 31, 2005 (Contd.)(Currency: Indian Rupee)
For BSR & Co. For Standard Chartered Asset Management For Standard Chartered Trustee(formerly Bharat S Raut & Co) Company Private Limited Company Private LimitedChartered Accountants
Sd/- Sd/-Akeel Master Paul Jebson Sd/-Partner Chairman Chairman / DirectorMembership No.: 046768
Sd/-Naval Bir Kumar Sd/-Managing Director Director
Sd/-Rajiv Anand
Mumbai Head-InvestmentsSeptember 15, 2005
Schedules GFMP - 6 GFMP - 7 GFMP - 9 GFMP - 10
Dec. 16, 2004 to Jan. 24, 2005 to Feb. 07, 2005 to Feb. 25, 2005 toMar. 31, 2005 Mar. 31, 2005 Mar. 31, 2005 Mar. 31, 2005
LIABILITIES
Unit capital 3 2,842,737,781 2,228,190,943 326,962,296 2,968,727,501- - - -
Reserves and surplus 4 75,592,293 24,531,007 (590,897) 13,918,312- - - -
Current liabilities and provisions 5 7,751,091 832,814 157,344 236,387- - - -
2,926,081,165 2,253,554,764 326,528,743 2,982,882,200- - - -
ASSETSInvestments 6 2,807,946,674 2,191,107,760 320,755,348 2,981,113,626
- - - -
Deposits 7 - - - -- - - -
Current assets 8 118,134,491 62,447,004 5,773,395 1,768,574- - - -
2,926,081,165 2,253,554,764 326,528,743 2,982,882,200- - - -
Net Asset Value per unitGrowth Option - Plan A 10.2672 10.1066 9.9819 10.0469
- - - -
Growth Option - Plan B - 10.1114 - -- - - -
Dividend Option - Plan A 10.2672 10.1066 9.9819 10.0469- - - -
Dividend Option - Plan B - 10.1114 - -- - - -
Significant accounting policies 2Notes to Accounts 10
The schedules referred to above form an integral part of the Balance Sheet.As per our report attached of even date
Annual Report 2004-2005Standard Chartered Mutual Fund
March 31, 2005March 31, 2004

59
Revenue Account for the period / year ended March 31, 2005(Currency: Indian Rupee)
Schedules GFMP - A GFMP - A2 GFMP - 4 GFMP - 5
Apr. 01, 2004 to Sep. 27, 2004 to Mar. 31, 2005 to Dec. 20, 2004 toMar. 31, 2005 Mar. 31, 2005 Mar. 31, 2005 Mar. 31, 2005
INCOME AND GAINS
Interest 9 187,192,413 70,977,106 3,124,192 44,919,1602,762,543 - - -
Profit on sale / redemption of investments(other than inter-scheme transfer/saleof investments) 3,927,025 - - -
- - - -Profit on inter-scheme transfer/saleof investments 4,880,450 1,658,250 - -
- - - -
195,999,888 72,635,356 3,124,192 44,919,1602,762,543 - - -
EXPENSES AND LOSSESLoss on sale of investments (other thaninter-scheme transfer/sale of investments) - - 73 -
- - - -Loss on inter-scheme transfer/saleof investments 1,196,869 301,300 - -
- - - -
Management fees 7,342,994 833,776 - 927,66516,892 - - -
Registrar and Transfer Agent'sfees and expenses 409,857 163,867 - 67,037
- - - -
Custodian fees 34,363 33,181 - 49,645- - - -
Commission to agents - 372,278 - 124,171- - - -
Audit fees 27,550 28,023 - 28,536- - - -
Service tax 722,269 85,046 - 94,6551,350 - - -
Other operating expenses 41,045 5,891 21,027 -- - - -
Provision for depreciation in valueof investments 40,269,950 21,993,150 - 16,687,828
- - - -
50,044,897 23,816,512 21,100 17,979,53718,242 - - -
Surplus for the period / year 145,954,991 48,818,844 3,103,092 26,939,6232,744,301 - - -
Annual Report 2004-2005Standard Chartered Mutual Fund
CLOSE ENDED SCHEMES (LIVE)
March 31, 2005March 31, 2004

60
Revenue Account for the period / year ended March 31, 2005 (Contd.)(Currency: Indian Rupee)
For BSR & Co. For Standard Chartered Asset Management For Standard Chartered Trustee(formerly Bharat S Raut & Co) Company Private Limited Company Private LimitedChartered Accountants
Sd/- Sd/-Akeel Master Paul Jebson Sd/-Partner Chairman Chairman / DirectorMembership No.: 046768
Sd/-Naval Bir Kumar Sd/-Managing Director Director
Sd/-Rajiv Anand
Mumbai Head-InvestmentsSeptember 15, 2005
Schedules GFMP - A GFMP - A2 GFMP - 4 GFMP - 5
Apr. 01, 2004 to Sep. 27, 2004 to Mar. 31, 2005 to Dec. 20, 2004 toMar. 31, 2005 Mar. 31, 2005 Mar. 31, 2005 Mar. 31, 2005
Distributable Surplus 145,954,991 48,818,844 3,103,092 26,939,6232,744,301 - - -
Income Distributed (including distribution tax) - - - -- - - -
Retained Surplus / (Deficit),beginning of period / year 2,744,301 - - -
- - - -
Retained Surplus / (Deficit),end of the period / year 148,699,292 48,818,844 3,103,092 26,939,623
2,744,301 - - -
Significant accounting policies 2Notes to Accounts 10
The schedules referred to above form an integral part of the Revenue Account.As per our report attached of even date
Annual Report 2004-2005Standard Chartered Mutual Fund
CLOSE ENDED SCHEMES (LIVE)
March 31, 2005March 31, 2004

61
Revenue Account for the period / year ended March 31, 2005 (Contd.)(Currency: Indian Rupee)
Schedules GFMP - 6 GFMP - 7 GFMP - 9 GFMP - 10
Dec. 16, 2004 to Jan. 24, 2005 to Feb. 07, 2005 to Feb. 25, 2005 toMar. 31, 2005 Mar. 31, 2005 Mar. 31, 2005 Mar. 31, 2005
INCOME AND GAINSInterest 9 79,674,938 33,670,123 2,172,181 14,154,699
- - - -Profit on sale / redemption of investments(other than inter-scheme transfer/saleof investments) 385,800 - - -
- - - -Profit on inter-scheme transfer/saleof investments - - - -
- - - -
80,060,738 33,670,123 2,172,181 14,154,699- - - -
EXPENSES AND LOSSESLoss on sale of investments (other thaninter-scheme transfer/sale of investments) - - 380,300 -
- - - -Loss on inter-scheme transfer/saleof investments - - - -
- - - -
Management fees 4,080,635 672,566 53,298 117,967- - - -
Registrar and Transfer Agent'sfees and expenses 177,172 34,812 4,133 -
- - - -
Custodian fees 937 - - 42,317- - - -
Commission to agents 3,138,515 410,416 77,955 -- - - -
Audit fees 56,390 43,477 6,300 57,571- - - -
Service tax 416,225 22,895 373 12,033- - - -
Other operating expenses 10,839 59,062 15,285 6,499- - - -
Provision for depreciation in valueof investments - 7,927,673 2,242,580 -
- - - -
7,880,713 9,170,901 2,780,224 236,387- - - -
Surplus for the period / year 72,180,025 24,499,222 (608,043) 13,918,312- - - -
Annual Report 2004-2005Standard Chartered Mutual Fund
CLOSE ENDED SCHEMES (LIVE)
March 31, 2005March 31, 2004

62 Annual Report 2004-2005Standard Chartered Mutual Fund
CLOSE ENDED SCHEMES (LIVE)
Revenue Account for the period / year ended March 31, 2005 (Contd.)(Currency: Indian Rupee)
For BSR & Co. For Standard Chartered Asset Management For Standard Chartered Trustee(formerly Bharat S Raut & Co) Company Private Limited Company Private LimitedChartered Accountants
Sd/- Sd/-Akeel Master Paul Jebson Sd/-Partner Chairman Chairman / DirectorMembership No.: 046768
Sd/-Naval Bir Kumar Sd/-Managing Director Director
Sd/-Rajiv Anand
Mumbai Head-InvestmentsSeptember 15, 2005
Schedules GFMP - 6 GFMP - 7 GFMP - 9 GFMP - 10
Dec. 16, 2004 to Jan. 24, 2005 to Feb. 07, 2005 to Feb. 25, 2005 toMar. 31, 2005 Mar. 31, 2005 Mar. 31, 2005 Mar. 31, 2005
Distributable Surplus 72,180,025 24,499,222 (608,043) 13,918,312- - - -
Income Distributed (including distribution tax) - - - -- - - -
Retained Surplus / (Deficit),beginning of period / year - - - -
- - - -
Retained Surplus / (Deficit),end of the period / year 72,180,025 24,499,222 (608,043) 13,918,312
- - - -
Significant accounting policies 2Notes to Accounts 10
The schedules referred to above form an integral part of the Revenue Account.As per our report attached of even date
March 31, 2005March 31, 2004

63
1. Background
Standard Chartered Mutual Fund ('the Fund') is sponsored by Standard Chartered Bank, U.K. ('SCB') and is constituted as a Trust under the Indian Trust Act, 1882 with Standard Chartered Trustee Company Private Limited ('the Trustee') as trustee. In accordance with the Securities and Exchange Board of India (SEBI) (Mutual Funds) Regulations, 1996 ('the Regulations') The Trustees have entrusted the investment management function to Standard Chartered Asset Management Company Private Limited ('the AMC').
The schemes mentioned below are close ended schemes and their investment objective is to seek to achieve growth of capital by investing in a portfolio of fixed income securities normally maturing in line with the time profile of the schemes:
Grindlays Fixed Maturity Plan - Annual (GFMP - A)
Grindlays Fixed Maturity Plan - Annual Plan 2 (GFMP - A2)
thGrindlays Fixed Maturity - 4 Annual (GFMP - 4)
thGrindlays Fixed Maturity - 5 Annual (GFMP - 5)
thGrindlays Fixed Maturity - 6 Annual (GFMP - 6)
thGrindlays Fixed Maturity - 7 Annual (GFMP - 7)
thGrindlays Fixed Maturity - 9 Annual (GFMP - 9)
thGrindlays Fixed Maturity - 10 Annual (GFMP - 10)
The following table depicts the start date, allotment date and the maturity date:
Scheme Name IPO Launch Date Allotment Date Maturity Date *
GFMP - A March 10, 2004 March 31, 2004 April 11, 2005GFMP - A2 August 16, 2004 August 27, 2004 September 02, 2005GFMP - 4 March 09, 2005 March 31, 2005 April 12, 2006GFMP - 5 December 24, 2004 December 30, 2004 May 17, 2006GFMP - 6 November 18, 2004 December 16, 2004 July 16, 2007GFMP - 7 January 24, 2005 February 10, 2005 June 14, 2006GFMP - 9 February 07, 2005 February 28, 2005 April 07, 2010GFMP - 10 February 25, 2005 March 03, 2005 June 01, 2005
* In case the maturity date falls on a holiday, the date will be the next working day.
All the above mentioned schemes offer a choice of two Investment options viz, Growth and Dividend. In addition GFMP - 4 and GFMP - 7 have sub - plans - Plan A (Regular Plan) and Plan B (Institutional Plan).
2. Significant accounting policies
2.1 Basis of preparation of financial statements
The financial statements are prepared and presented under the historical cost convention, as modified for investments which are 'marked-to-market', on the accrual basis of accounting and in accordance with the accounting policies and standards specified in the Ninth Schedule of the Regulations and amendments thereto, and the accounting standards issued by the Institute of Chartered Accountants of India.
2.2 Use of estimates
The preparation of financial statements in conformity with Generally Accepted Accounting Principles ('GAAP') requires management to make estimates and assumptions that affect the reported amounts of assets and
Annual Report 2004-2005Standard Chartered Mutual Fund
CLOSE ENDED SCHEMES (LIVE)
Schedules to the financial statementsfor the period / year ended March 31, 2005
(Currency: Indian Rupee)

64
liabilities and the disclosure of contingent liabilities as at the date of financial statements. The estimates and the assumptions used in accompanying financial statements are based upon managements evaluation of relevant facts and circumstances as at the date of financials. Actual results could differ from those estimates and assumptions used in preparing financial statements. Any revision to accounting estimates is recognized prospectively in the current and future periods.
2.3 Investments
Basis of accounting
! Transactions for purchase and sale of investments are recorded on trade date. Cost of investments includes brokerage. Any front end-discount on privately placed investments is reduced from the cost of such investments.
! Broken period interest paid/received is debited/credited to Interest Receivable account and is not included in the cost of purchase/sale value.
! Inter scheme purchase/sale of securities are recorded at prevailing market rates.
Valuation
! Investments for the purpose of valuation are classified as traded and non traded in accordance with the provisions of the Regulations.
! Investments are stated at market/fair value as follows:
Traded debt securities
! Traded debt securities (other than Government securities) with residual maturity over 182 days are valued at the last quoted closing price on the National Stock Exchange (the 'NSE') as on the date of valuation or the last quoted closing price on the principal exchange on which the security is traded on the date of valuation, where on the particular valuation day a security is not quoted on the NSE.
! Traded debt securities (other than Government Securities) with a residual maturity over 182 days, but which have not been traded on the date of valuation are valued on the same basis as that of a non-traded debt security with residual maturity over 182 days.
! All traded debt securities (other than Government securities) with a residual maturity upto 182 days are valued on same basis as money market instruments.
Non-traded/ thinly traded debt securities
! Non traded debt securities (other than Government Securities) are securities that are not traded on any stock exchange for a period of fifteen days prior to the valuation date.
! Non traded/thinly traded debt securities with residual maturity of over 182 days to maturity are being valued as per CRISIL Bond Valuer ('CBV') from the day on which the security is not traded. These are valued "in good faith" by the AMC as per procedures approved by the Trustees and on the basis of the valuation principles laid down by the Regulations.
! Non traded securities purchased with residual maturity upto 182 days are valued at cost / last valuation price (including accrued interest till the beginning of the day) plus the difference between the redemption value (inclusive of interest) and cost / last valuation price, spread uniformly over the remaining maturity period of the instrument.
Debt securities with put/call options
! Securities with call option are valued at the lower of the value as obtained by valuing the security to final maturity and valuing the security to call option. In case there are multiple call options, the lowest value obtained by valuing to the various call dates and valuing to the maturity date is taken as the value of the instrument.
Annual Report 2004-2005Standard Chartered Mutual Fund
CLOSE ENDED SCHEMES (LIVE)
Schedules to the financial statementsfor the period / year ended March 31, 2005 (Contd.)
(Currency: Indian Rupee)

65
! Securities with put option are valued at the higher of the value as obtained by valuing the security to final maturity and valuing the security to put option. In case there are multiple put options, the highest value obtained by valuing to the various put dates and valuing to the maturity date is taken as the value of the instruments.
! The securities with both Put and Call option on the same day would be deemed to mature on the Put/Call day and would be valued accordingly.
Money Market Instruments
! Money market instruments, (other than government securities) were valued at cost plus accrued interest upto October 24, 2004. Effective October 25, 2004 traded money market securities are valued at the yield they were traded as on the valuation date. In case these securities are not traded, they are valued at the last traded price plus accretion of difference between the redemption value and the last traded price. However, the effect of this change in the accounting policy on the financial statements is not ascertainable.
Repos
! Instruments bought on 'repo' basis are valued at the resale price after deduction of applicable interest upto date of resale.
Collateralized Borrowings and Lending Obligation (CBLO)
! CBLOs are valued at cost/last valuation price (including accrued interest till the beginning of the day) plus the difference between the redemption value (inclusive of interest) and cost / last valuation price, spread uniformly over the remaining maturity period of the instrument.
Mutual Fund Units
! Mutual Fund Units are valued at Net Asset Value ('NAV') prevailing as at end of the valuation day.
In accordance with the Guidance Note on Accounting for Investments in the Financial Statements of Mutual funds issued by the Institute of Chartered Accountants of India, pursuant to the Eleventh Schedule of the Regulations, the net unrealized gain or loss in the value of investments is determined separately for each category of investments. The loss on investments sold or transferred during the period or year is charged to the revenue account instead of being first adjusted against the provision for depreciation, if already created in the previous year, as recommended by the Guidance note. The unrealised loss / gain is reversed on the first day of the immediately succeeding financial year. However, this departure from the Guidance note does not have any net impact on the Scheme's net assets and the financial statements of the Scheme.
2.4 Revenue recognition
Interest income is accrued on a daily basis.
Profit or loss on sale of investments represents sale proceeds less weighted average cost and is recognised on a trade date basis.
In accordance with the Guidance note on accounting for investments in the financial statements of Mutual Funds issued by the Institute of Chartered Accountants of India, appreciation/depreciation in value of securities is computed category wise, wherein the cost is compared with the market/fair value and the resultant appreciation is credited to Unrealized Appreciation Reserve and any depreciation is charged to the Revenue account.
2.5 Computation of Net Asset Value (NAV)
The NAV of the units of each of the various schemes is computed separately for units issued under the various options of the relevant plans, although the corresponding scheme's investments and other net assets are managed as a single portfolio. For computing the NAV for various plans/options, daily income earned, including realised and unrealised gains or losses in the value of investments and expenses incurred by the corresponding scheme are allocated to the plans/options in proportion to the net assets of each plans/options.
Annual Report 2004-2005Standard Chartered Mutual Fund
CLOSE ENDED SCHEMES (LIVE)
Schedules to the financial statementsfor the period / year ended March 31, 2005 (Contd.)
(Currency: Indian Rupee)

66
2.6 Dividend distribution
Dividend distributed on units is recognised on the date of declaration of dividend.
2.7 Unit premium reserve
When units are issued or redeemed, the net premium or discount to the face value is transferred to the unit premium reserve, after an appropriate portion of the issue proceeds and redemption payout is credited or debited respectively to the equalisation reserve. The unit premium reserve is available for dividend distribution except to the extent it is represented by unrealised net appreciation in investments.
2.8 Load charges
Load collected is retained under a separate account in the Scheme and is used to meet the selling and distribution expenses of the Scheme.
2.9 Initial issue expenses
Initial issue expenses are borne by the AMC.
Annual Report 2004-2005Standard Chartered Mutual Fund
CLOSE ENDED SCHEMES (LIVE)
Schedules to the financial statementsfor the period / year ended March 31, 2005 (Contd.)
(Currency: Indian Rupee)

67 Annual Report 2004-2005Standard Chartered Mutual Fund
CLOSE ENDED SCHEMES (LIVE)
GFMP - A GFMP - A2 GFMP - 4
Apr. 01, 2004 to Sep. 27, 2004 to Mar. 31, 2005 toMar. 31, 2005 Mar. 31, 2005 Mar. 31, 2005
(Units) Amount (Rs.) (Units) Amount (Rs.) (Units) Amount (Rs.)3 Unit capital
Units of Rs. 10 each fully paid
Growth Option - Plan A
Units issued, initial offer - - 139,692,140.140 1,396,921,401 31,513,981.508 315,139,815240,162,431.439 2,401,624,314 - - - -
Units outstanding,beginning of the period / year 240,162,431.439 2,401,624,314 - - - -
- - - - - -Units issued duringthe period / year - - - - - -
- - - - - -Units repurchasedduring the period / year - - (155,839.282) (1,558,393) - -
- - - - - -Units outstanding,end of the period / year 240,162,431.439 2,401,624,314 139,536,300.858 1,395,363,008 31,513,981.508 315,139,815
240,162,431.439 2,401,624,314 - - - -
Growth Option - Plan B
Units issued, initial offer - - - - 178,815,827.732 1,788,158,277- - - - - -
Units outstanding,beginning of the period / year - - - - - -
- - - - - -Units issued duringthe period / year - - - - - -
- - - - - -Units repurchasedduring the period / year - - - - - -
- - - - - -Units outstanding,end of the period / year - - - - 178,815,827.732 1,788,158,277
- - - - - -
Dividend Option - Plan A
Units issued, initial offer - - 504,500.000 5,045,000 1,313,800.000 13,138,00045,854,000.000 458,540,000 - - - -
Units outstanding,beginning of the period / year 45,854,000.000 458,540,000 - - - -
- - - - - -
Units issuedduring the period / year - - - - - -
- - - - - -
Units repurchasedduring the period / year - - - - - -
- - - - - -
Units outstanding,end of the period / year 45,854,000.000 458,540,000 504,500.000 5,045,000 1,313,800.000 13,138,000
45,854,000.000 458,540,000 - - - -
March 31, 2005March 31, 2004
Schedules to the financial statementsfor the period / year ended March 31, 2005 (Contd.)
(Currency: Indian Rupee)

68 Annual Report 2004-2005Standard Chartered Mutual Fund
CLOSE ENDED SCHEMES (LIVE)
GFMP - A GFMP - A2 GFMP - 4
Apr. 01, 2004 to Sep. 27, 2004 to Mar. 31, 2005 toMar. 31, 2005 Mar. 31, 2005 Mar. 31, 2005
(Units) Amount (Rs.) (Units) Amount (Rs.) (Units) Amount (Rs.)Dividend Option - Plan B
Units issued, initial offer - - - - - -- - - - - -
Units issued,beginning of the period / year - - - - - -
- - - - - -Units issuedduring the period / year - - - - - -
- - - - - -Units redeemedduring the period / year - - - - - -
- - - - - -Units outstanding,end of the period / year - - - - - -
- - - - - -
Total
Units issued, initial offer - - 140,196,640.140 1,401,966,401 211,643,609.240 2,116,436,092286,016,431.439 2,860,164,314 - - - -
Units outstanding,beginning of the period / year 286,016,431.439 2,860,164,314 - - - -
- - - - - -Units issuedduring the period / year - - - - - -
- - - - - -Units repurchasedduring the period / year - - (155,839.282) (1,558,393) - -
- - - - - -Units outstanding,end of the period / year 286,016,431.439 2,860,164,314 140,040,800.858 1,400,408,008 211,643,609.240 2,116,436,092
286,016,431.439 2,860,164,314 - - - -
March 31, 2005March 31, 2004
Schedules to the financial statementsfor the period / year ended March 31, 2005 (Contd.)
(Currency: Indian Rupee)

69 Annual Report 2004-2005Standard Chartered Mutual Fund
CLOSE ENDED SCHEMES (LIVE)
GFMP - 5 GFMP - 6 GFMP - 7
(Units) Amount (Rs.) (Units) Amount (Rs.) (Units) Amount (Rs.)
Dec. 20, 2004 to Dec. 16, 2004 to Jan. 24, 2005 to|Mar. 31, 2005 Mar. 31, 2005 Mar. 31, 2005
3 Unit capitalUnits of Rs. 10 each fully paid
Growth Option - Plan A
Units issued, initial offer 142,927,791.188 1,429,277,912 273,182,685.296 2,731,826,853 57,162,201.876 571,622,019- - - - - -
Units outstanding,beginning of the period / year - - - - - -
- - - - - -Units issued duringthe period / year - - - - - -
- - - - - -Units repurchasedduring the period / year - - (237,166.400) (2,371,664) - -
- - - - - -Units outstanding,end of the period / year 142,927,791.188 1,429,277,912 272,945,518.896 2,729,455,189 57,162,201.876 571,622,019
- - - - - -
Growth Option - Plan B
Units issued, initial offer - - - - 161,235,070.460 1,612,350,705- - - - - -
Units outstanding,beginning of the period / year - - - - - -
- - - - - -Units issuedduring the period / year - - - - - -
- - - - - -Units repurchasedduring the period / year - - - - - -
- - - - - -
Units outstanding,end of the period / year - - - - 161,235,070.460 1,612,350,705
- - - - - -
Dividend Option - Plan A
Units issued, initial offer 2,190,777.690 21,907,777 11,358,259.212 113,582,592 3,156,821.852 31,568,219- - - - - -
Units outstanding,beginning of the period / year - - - - - -
- - - - - -
Units issuedduring the period / year - - - - - -
- - - - - -
Units repurchasedduring the period / year - - (30,000.000) (300,000) - -
- - - - - -
Units outstanding,end of the period / year 2,190,777.690 21,907,777 11,328,259.212 113,282,592 3,156,821.852 31,568,219
- - - - - -
March 31, 2005March 31, 2004
Schedules to the financial statementsfor the period / year ended March 31, 2005 (Contd.)
(Currency: Indian Rupee)

70 Annual Report 2004-2005Standard Chartered Mutual Fund
CLOSE ENDED SCHEMES (LIVE)
GFMP - 5 GFMP - 6 GFMP - 7
Dec. 20, 2004 to Dec. 16, 2004 to Jan. 24, 2005 toMar. 31, 2005 Mar. 31, 2005 Mar. 31, 2005
(Units) Amount (Rs.) (Units) Amount (Rs.) (Units) Amount (Rs.)Dividend Option - Plan B
Units issued, initial offer - - - - 1,265,000.000 12,650,000- - - - - -
Units issued,beginning of the period / year - - - - - -
- - - - - -
Units issuedduring the period / year - - - - - -
- - - - - -
Units redeemedduring the period / year - - - - - -
- - - - - -
Units outstanding,end of the period / year - - - - 1,265,000.000 12,650,000
- - - - - -
Total
Units issued, initial offer 145,118,568.878 1,451,185,689 284,540,944.508 2,845,409,445 222,819,094.188 2,228,190,943- - - - - -
Units outstanding,beginning of the period / year - - - - - -
- - - - - -Units issuedduring the period / year - - - - - -
- - - - - -Units repurchasedduring the period / year - - (267,166.400) (2,671,664) - -
- - - - - -Units outstanding,end of the period / year 145,118,568.878 1,451,185,689 284,273,778.108 2,842,737,781 222,819,094.188 2,228,190,943
- - - - - -
March 31, 2005March 31, 2004
Schedules to the financial statementsfor the period / year ended March 31, 2005 (Contd.)
(Currency: Indian Rupee)

71 Annual Report 2004-2005Standard Chartered Mutual Fund
CLOSE ENDED SCHEMES (LIVE)
GFMP - 9 GFMP - 10
(Units) Amount (Rs.) (Units) Amount (Rs.)
Feb. 07, 2005 to Feb. 25, 2005 toMar. 31, 2005 Mar. 31, 2005
3 Unit capitalUnits of Rs. 10 each fully paid
Growth Option - Plan A
Units issued, initial offer 24,911,429.234 249,114,292 64,241,962.605 642,419,626- - - -
Units outstanding,beginning of the period / year - - - -
- - - -Units issued duringthe period / year - - - -
- - - -Units repurchasedduring the period / year - - - -
- - - -Units outstanding,end of the period / year 24,911,429.234 249,114,292 64,241,962.605 642,419,626
- - - -
Growth Option - Plan B
Units issued, initial offer - - - -- - - -
Units outstanding,beginning of the period / year - - - -
- - - -Units issuedduring the period / year - - - -
- - - -Units repurchasedduring the period / year - - - -
- - - -Units outstanding,end of the period / year - - - -
- - - -
Dividend Option - Plan A
Units issued, initial offer 7,784,800.353 77,848,004 232,630,787.481 2,326,307,875- - - -
Units outstanding,beginning of the period / year - - - -
- - - -Units issuedduring the period / year - - - -
- - - -Units repurchasedduring the period / year - - - -
- - - -Units outstanding,end of the period / year 7,784,800.353 77,848,004 232,630,787.481 2,326,307,875
- - - -
March 31, 2005March 31, 2004
Schedules to the financial statementsfor the period / year ended March 31, 2005 (Contd.)
(Currency: Indian Rupee)

72 Annual Report 2004-2005Standard Chartered Mutual Fund
CLOSE ENDED SCHEMES (LIVE)
GFMP - 9 GFMP - 10
(Units) Amount (Rs.) (Units) Amount (Rs.)
Feb. 07, 2005 to Feb. 25, 2005 toMar. 31, 2005 Mar. 31, 2005
Dividend Option - Plan B
Units issued, initial offer - - - -- - - -
Units issued,beginning of the period / year - - - -
- - - -Units issuedduring the period / year - - - -
- - - -Units redeemedduring the period / year - - - -
- - - -Units outstanding,end of the period / year - - - -
- - - -
Total
Units issued, initial offer 32,696,229.587 326,962,296 296,872,750.086 2,968,727,501- - - -
Units outstanding,beginning of the period / year - - - -
- - - -Units issuedduring the period / year - - - -
- - - -Units repurchasedduring the period / year - - - -
- - - -Units outstanding,end of the period / year 32,696,229.587 326,962,296 296,872,750.086 2,968,727,501
- - - -
March 31, 2005March 31, 2004
Schedules to the financial statementsfor the period / year ended March 31, 2005 (Contd.)
(Currency: Indian Rupee)

73 Annual Report 2004-2005Standard Chartered Mutual Fund
CLOSE ENDED SCHEMES (LIVE)
GFMP - A GFMP - A2 GFMP - 4
Apr. 01, 2004 to Sep. 27, 2004 to Mar. 31, 2005 toMar. 31, 2005 Mar. 31, 2005 Mar. 31, 2005
4 Reserves and surplus
Unit Premium Reserve
Opening Balance - - -Additions during the period / year - (55,370) -Closing Balance - (55,370) -
Unrealised Appreciation Reserve
Opening Balance 556,643 - -- - -
Less : Reversedduring the period / year (556,643) - -
- - -
Additions during the period / year 5,105,581 997,292 315,279556,643 - -
Closing Balance 5,105,581 997,292 315,279556,643 - -
Retained Surplus as atthe end of the period / year 148,699,292 48,818,844 3,103,092
2,744,301 - -
153,804,873 49,760,766 3,418,3713,300,944 - -
The Reserves and surplusof the options are as follows:-
Growth Option - Plan A 129,136,485 49,581,500 509,0002,771,738 - -
Growth Option - Plan B - - 2,888,151- - -
Dividend Option - Plan A 24,668,388 179,266 21,220529,206 - -
Dividend Option - Plan B - - -- - -
153,804,873 49,760,766 3,418,3713,300,944 - -
March 31, 2005March 31, 2004
Schedules to the financial statementsfor the period / year ended March 31, 2005 (Contd.)
(Currency: Indian Rupee)

74 Annual Report 2004-2005Standard Chartered Mutual Fund
CLOSE ENDED SCHEMES (LIVE)
March 31, 2005March 31, 2004
GFMP - 5 GFMP - 6 GFMP - 7
4 Reserves and surplus
Unit Premium Reserve
Opening Balance - - -Additions during the period / year - (71,387) -Closing Balance - (71,387) -
Unrealised Appreciation ReserveOpening Balance - - -
- - -Less : Reversedduring the period / year - - -
- - -
Additions during the period / year 253,503 3,483,655 31,785- - -
Closing Balance 253,503 3,483,655 31,785- - -
Retained Surplus as atthe end of the period / year 26,939,623 72,180,025 24,499,222
- - -
27,193,126 75,592,293 24,531,007- - -
The Reserves and surplusof the options are as follows:-
Growth Option - Plan A 26,782,606 72,565,034 6,095,380- - -
Growth Option - Plan B - - 17,958,113- - -
Dividend Option - Plan A 410,520` 3,027,259 336,620- - -
Dividend Option - Plan B - - 140,894- - -
27,193,126 75,592,293 24,531,007- - -
Dec. 20, 2004 to Dec. 16, 2004 to Jan. 24, 2005 toMar. 31, 2005 Mar. 31, 2005 Mar. 31, 2005
Schedules to the financial statementsfor the period / year ended March 31, 2005 (Contd.)
(Currency: Indian Rupee)

75 Annual Report 2004-2005Standard Chartered Mutual Fund
CLOSE ENDED SCHEMES (LIVE)
March 31, 2005March 31, 2004
GFMP - 9 GFMP - 10
4 Reserves and surplus
Unit Premium Reserve
Opening Balance - -Additions during the period / year - -Closing Balance - -
Unrealised Appreciation Reserve
Opening Balance - -- -
Less : Reversedduring the period / year - -
- -
Additions during the period / year 17,146 -- -
Closing Balance 17,146 -- -
Retained Surplus as atthe end of the period / year (608,043) 13,918,312
- -
(590,897) 13,918,312- -
The Reserves and surplusof the options are as follows:-Growth Option - Plan A (450,207) 3,011,862
- -
Growth Option - Plan B - -- -
Dividend Option - Plan A (140,690) 10,906,450- -
Dividend Option - Plan B - -- -
(590,897) 13,918,312- -
Feb. 07, 2005 to Feb. 25, 2005 toMar. 31, 2005 Mar. 31, 2005
Schedules to the financial statementsfor the period / year ended March 31, 2005 (Contd.)
(Currency: Indian Rupee)

76 Annual Report 2004-2005Standard Chartered Mutual Fund
CLOSE ENDED SCHEMES (LIVE)
March 31, 2005March 31, 2004
GFMP - A GFMP - A2 GFMP - 4
Apr. 01, 2004 to Sep. 27, 2004 to Mar. 31, 2005 toMar. 31, 2005 Mar. 31, 2005 Mar. 31, 2005
5 Current liabilities and provisionsManagement feespayable (net of tax) 7,109,325 785,744 -
17,308 - -
Service Tax payable 541,199 85,046 -- - -
Comission payable - - -- - -
Unit Redemption Money Payable - - -- - -
Exit load payable - - -- - -
Tax deducted at source payable 120,902 15,223 -935 - -
Other liabilities 490,350 1,811,012 21,027- - -
8,261,776 2,697,025 21,02718,243 - -
6 Investments
(net of appreciation / depreciation)
(also refer Note 16) Cost * Market / Cost * Market / Cost * Market /Fair Value Fair Value Fair Value
Privately placed debentures/bonds - - - - - -- - - - - -
Debentures & bonds listed /awaiting listing onrecognised stock exchange 1,463,185,100 1,422,915,150 1,196,862,550 1,174,869,400 1,567,558,292 1,567,873,571
807,773,700 808,251,050 - - - -
Government securities - - - - - -- - - - - -
Commercial paper - - 155,421,892 155,421,892 - -- - - - - -
Certificate of deposit 551,808,242 551,808,242 - - 500,549,153 500,549,153- - - - - -
Securitised Debt - - - - - -- - - - - -
Reverse repos 2,444,465 2,444,465 977,787 977,787 7,822,288 7,822,288- - - - - -
Mutual Fund Units 716,599,988 718,250,409 14,499,997 14,654,039 - -625,000,000 625,079,293 - - - -
Treasury Bills 236,012,890 239,468,050 48,140,700 48,983,950 - -- - - - - -
Collateralised Borrowingand Lending (CBLO) - - - - - -
- - - - - -
2,970,050,685 2,934,886,316 1,415,902,926 1,394,907,068 2,075,929,733 2,076,245,0121,432,773,700 1,433,330,343 - - - -
* Cost includes interest accreted in respect of money market instruments till valuation date. Investments of the Scheme are registered in the name of the Scheme except for government securities, treasury bills, reverse repos and deposits which are registered in the name of the Fund for the benefit of Scheme's unitholders.
Schedules to the financial statementsfor the period / year ended March 31, 2005 (Contd.)
(Currency: Indian Rupee)

77 Annual Report 2004-2005Standard Chartered Mutual Fund
CLOSE ENDED SCHEMES (LIVE)
GFMP - 5 GFMP - 6 GFMP - 7
Dec. 20, 2004 to Dec. 16, 2004 to Jan. 24, 2005 toMar. 31, 2005 Mar. 31, 2005 Mar. 31, 2005
5 Current liabilities and provisionsManagement feespayable (net of tax) 874,206 3,845,560 633,823
- - -
Service Tax payable 94,655 416,225 68,602- - -
Comission payable - - -- - -
Unit Redemption Money Payable - 2,688,202 -- - -
Exit load payable - 54,849 -- - -
Tax deducted at source payable 54,951 128,862 41,017- - -
Other liabilities 94,081 617,393 89,372- - -
1,117,893 7,751,091 832,814- - -
6 Investments
(net of appreciation / depreciation)
(also refer Note 16) Cost * Market / Cost * Market / Cost * Market /Fair Value Fair Value Fair Value
Privately placed debentures/bonds - - - - - -- - - - - -
Debentures & bonds listed /awaiting listing onrecognised stock exchange 1,411,407,489 1,394,719,662 2,775,685,166 2,778,948,732 2,175,003,648 2,167,075,975
- - - - - -
Government securities - - - - - -- - - - - -
Commercial paper - - - - - -- - - - - -
Certificate of deposit - - - - - -- - - - - -
Securitised Debt - - - - - -- - - - - -
Reverse repos - - 9,777,860 9,777,860 - -- - - - - -
Mutual Fund Units 29,199,992 29,453,495 18,999,993 19,220,082 24,000,000 24,031,785- - - - - -
Treasury Bills - - - - - -- - - - - -
Collateralised Borrowingand Lending (CBLO) - - - - - -
- - - - - -
1,440,607,481 1,424,173,157 2,804,463,019 2,807,946,674 2,199,003,648 2,191,107,760- - - - - -
* Cost includes interest accreted in respect of money market instruments till valuation date. Investments of the Scheme are registered in the name of the Scheme except for government securities, treasury bills, reverse repos and deposits which are registered in the name of the Fund for the benefit of Scheme's unitholders.
March 31, 2005March 31, 2004
Schedules to the financial statementsfor the period / year ended March 31, 2005 (Contd.)
(Currency: Indian Rupee)

78 Annual Report 2004-2005Standard Chartered Mutual Fund
CLOSE ENDED SCHEMES (LIVE)
March 31, 2005March 31, 2004
GFMP - 9 GFMP - 10
Feb. 07, 2005 to Feb. 25, 2005 toMar. 31, 2005 Mar. 31, 2005
5 Current liabilities and provisionsManagement feespayable (net of tax) 50,229 111,171
- -
Service Tax payable 5,437 12,033- -
Comission payable 77,955 -- -
Unit Redemption Money Payable - -- -
Exit load payable - -- -
Tax deducted at source payable 3,399 9,806- -
Other liabilities 20,324 103,377- -
157,344 236,387- -
6 Investments(net of appreciation / depreciation)(also refer Note 16) Cost * Market / Cost * Market /
Fair Value Fair Value
Privately placed debentures/bonds - - - -- - - -
Debentures & bonds listed /awaiting listing onrecognised stock exchange 263,880,210 261,637,630 - -
- - - -
Government securities - - - -- - - -
Commercial paper - - 1,044,241,700 1,044,241,700- - - -
Certificate of deposit - - 1,931,982,996 1,931,982,996- - - -
Securitised Debt - - - -- - - -
Reverse repos 1,955,572 1,955,572 4,888,930 4,888,930- - - -
Mutual Fund Units 9,700,000 9,712,846 - -- - - -
Treasury Bills 47,445,000 47,449,300 - -- - - -
Collateralised Borrowingand Lending (CBLO) - - - -
- - - -
322,980,782 320,755,348 2,981,113,626 2,981,113,626- - - -
* Cost includes interest accreted in respect of money market instruments till valuation date. Investments of the Scheme are registered in the name of the Scheme except for government securities, treasury bills, reverse repos and deposits which are registered in the name of the Fund for the benefit of Scheme's unitholders.
Schedules to the financial statementsfor the period / year ended March 31, 2005 (Contd.)
(Currency: Indian Rupee)
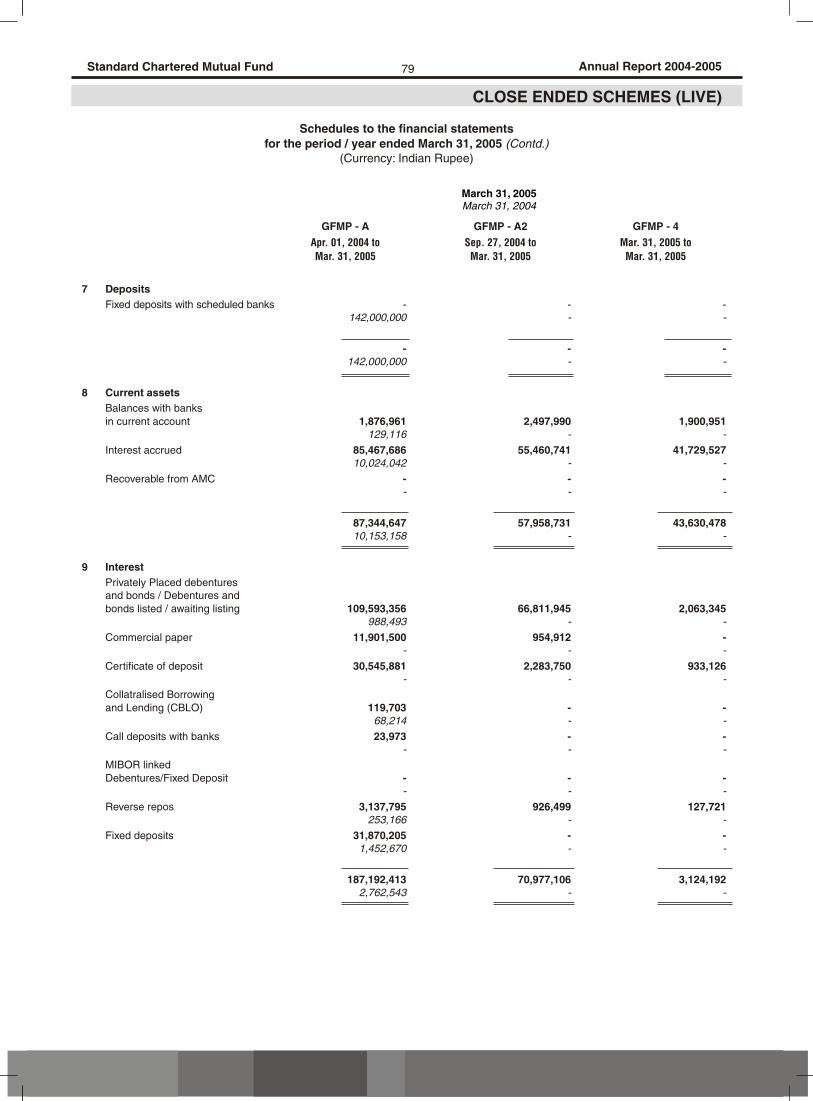
79 Annual Report 2004-2005Standard Chartered Mutual Fund
CLOSE ENDED SCHEMES (LIVE)
March 31, 2005March 31, 2004
GFMP - A GFMP - A2 GFMP - 4
Apr. 01, 2004 to Sep. 27, 2004 to Mar. 31, 2005 toMar. 31, 2005 Mar. 31, 2005 Mar. 31, 2005
7 DepositsFixed deposits with scheduled banks - - -
142,000,000 - -
- - -142,000,000 - -
8 Current assetsBalances with banksin current account 1,876,961 2,497,990 1,900,951
129,116 - -
Interest accrued 85,467,686 55,460,741 41,729,52710,024,042 - -
Recoverable from AMC - - -- - -
87,344,647 57,958,731 43,630,47810,153,158 - -
9 InterestPrivately Placed debenturesand bonds / Debentures andbonds listed / awaiting listing 109,593,356 66,811,945 2,063,345
988,493 - -
Commercial paper 11,901,500 954,912 -- - -
Certificate of deposit 30,545,881 2,283,750 933,126- - -
Collatralised Borrowingand Lending (CBLO) 119,703 - -
68,214 - -
Call deposits with banks 23,973 - -- - -
MIBOR linkedDebentures/Fixed Deposit - - -
- - -
Reverse repos 3,137,795 926,499 127,721253,166 - -
Fixed deposits 31,870,205 - -1,452,670 - -
187,192,413 70,977,106 3,124,1922,762,543 - -
Schedules to the financial statementsfor the period / year ended March 31, 2005 (Contd.)
(Currency: Indian Rupee)

80 Annual Report 2004-2005Standard Chartered Mutual Fund
CLOSE ENDED SCHEMES (LIVE)
March 31, 2005March 31, 2004
GFMP - 5 GFMP - 6 GFMP - 7
Dec. 20, 2004 to Dec. 16, 2004 to Jan. 24, 2005 toMar. 31, 2005 Mar. 31, 2005 Mar. 31, 2005
7 DepositsFixed deposits with scheduled banks - - -
- - -
- - -- - -
8 Current assetsBalances with banksin current account 1,733,269 25,057,404 4,985,838
- - -
Interest accrued 53,590,282 93,077,087 57,461,166- - -
Recoverable from AMC - - -- - -
55,323,551 118,134,491 62,447,004- - -
9 InterestPrivately Placed debenturesand bonds / Debentures andbonds listed / awaiting listing 24,388,973 57,073,055 22,556,701
- - -
Commercial paper - - -- - -
Certificate of deposit - - -- - -
Collatralised Borrowingand Lending (CBLO) - 82,257 -
- - -
Call deposits with banks - - -- - -
MIBOR linkedDebentures/Fixed Deposit 20,388,195 22,006,418 10,696,064
- - -
Reverse repos 141,992 513,208 417,358- - -
Fixed deposits - - -- - -
44,919,160 79,674,938 33,670,123- - -
Schedules to the financial statementsfor the period / year ended March 31, 2005 (Contd.)
(Currency: Indian Rupee)

81 Annual Report 2004-2005Standard Chartered Mutual Fund
CLOSE ENDED SCHEMES (LIVE)
March 31, 2005March 31, 2004
GFMP - 9 GFMP - 10
Feb. 07, 2005 to Feb. 25, 2005 toMar. 31, 2005 Mar. 31, 2005
7 DepositsFixed deposits with scheduled banks - -
- -
- -- -
8 Current assetsBalances with banksin current account 1,681,479 1,768,407
- -
Interest accrued 4,091,916 167- -
Recoverable from AMC - -- -
5,773,395 1,768,574- -
9 InterestPrivately Placed debenturesand bonds / Debentures andbonds listed / awaiting listing 1,978,096 -
- -
Commercial paper - 4,945,069- -
Certificate of deposit 39,276 9,194,096- -
Collatralised Borrowingand Lending (CBLO) - -
- -
Call deposits with banks - -- -
MIBOR linkedDebentures/Fixed Deposit - -
- -
Reverse repos 154,809 15,534- -
Fixed deposits - -- -
2,172,181 14,154,699- -
Schedules to the financial statementsfor the period / year ended March 31, 2005 (Contd.)
(Currency: Indian Rupee)

82
10. NOTES TO ACCOUNTS
10.1 Investment management fees
The Scheme has paid or provided for investment management fees in accordance with the agreement with the AMC as amended from time to time and the offer document. In terms of the offer document, the AMC is entitled to receive such fee at an annual rate upto 1.25% of the Scheme's average daily net assets on the first Rs 100 crores and @ 1% on the excess amount over Rs 100 crores. For the current year, the schemes have accrued management fees at an average annual rate of average daily net asset values for the following schemes:
Scheme Name For the year ended March 31, 2005 For the year ended March 31, 2004
GFMP - A 0.25% 0.30%GFMP - A2 0.10% NAGFMP - 4 Nil NAGFMP - 5 0.25% NAGFMP - 6 0.49% NAGFMP - 7 NA
Plan A 0.25% NAPlan B 0.21% NA
GFMP - 9 0.19% NAGFMP - 10 0.05% NA
10.2 Trustee fees
In accordance with the trust deed as amended from time to time, Grindlays Super Saver Income Fund Investment Plan has accrued trustee fee of Rs 362,500 (Previous Year: Rs 175,586) to Standard Chartered Trustee Company Private Limited, the trustee. These fees are borne by Grindlays Super Saver Income Fund Investment Plan only as decided by the Board of Trustees.
10.3 Custodian fees
Deutsche Bank AG, India provides custodian services to the schemes for which it charges custodian fees as per the terms of the custodian agreement.
10.4 Income tax
No accounting for income tax has been made as the schemes qualify as a recognised Mutual Fund under section 10 (23D) of the Income Tax Act, 1961 and the Direct Tax Laws (Amendment) Act, 1988.
10.5 Aggregate value of purchases and sales
The aggregate value of purchases and sales during the year as a percentage of the Scheme's average daily net assets is as follows:
Scheme Name March 31, 2005 March 31, 2005
Purchases Percentage Sales Percentage
GFMP - A 23,706,555,522 806.16 22,218,746,443 755.564,070,514,425 66,375.25 2,630,569,638 42,895.01
GFMP - A2 7,216,432,368 845.48 5,753,368,021 674.06GFMP - 4 2,825,552,656 48,650.48 711,017,514 12,242.33GFMP - 5 2,553,117,498 691.08 1,083,450,699 293.27GFMP - 6 7,434,809,388 885.88 4,560,514,226 543.40GFMP - 7 5,100,870,208 1,659.26 285,793,8069 929.66GFMP - 9 1,318,644,234 4,608.59 993,363,416 3,471.75GFMP - 10 3,063,549,565 1,295.16 96,590,471 40.83
Annual Report 2004-2005Standard Chartered Mutual Fund
CLOSE ENDED SCHEMES (LIVE)
Schedules to the financial statementsfor the period / year ended March 31, 2005 (Contd.)
(Currency: Indian Rupee)

83
10.6 Appreciation/depreciation on investments
The aggregate appreciation and depreciation in the value of investments is as follows:
Scheme / CategoryOf Investment As at March 31, 2005 As at March 31, 2004
Appreciation Depreciation Appreciation DepreciationGFMP - ADebentures and bonds listed/awaitinglisting on recognised stock exchange - (40,269,950) 527,750 (50,400)Treasury Bills 3,455,160 - - -Mutual Fund Units 1,650,421 - - -
79,293 -
GFMP - A2Debentures and bonds listed/awaitinglisting on recognised stock exchange - (21,993,150) NA NATreasury Bills 843,250 - NA NAMutual Fund Units 154,042 - NA NA
GFMP - 4Debentures and bonds listed/awaitinglisting on recognised stock exchange 92,660 (602,290) NA NA
GFMP 5Debentures and bonds listed/awaitinglisting on recognised stock exchange 3,020,301 (19,708,129) NA NAMutual Fund Units 253,503 - NA NA
GFMP - 6Debentures and bonds listed/awaitinglisting on recognised stock exchange 16,071,508 (12,807,942) NA NAMutual Fund Units 220,158 -
GFMP - 7Debentures and bonds listed/awaitinglisting on recognised stock exchange 2,624,734 (10,552,406) NA NAMutual Fund Units 31,785 - NA NA
GFMP - 9Debentures and bonds listed/awaitinglisting on recognised stock exchange - (2,242,580) NA NATreasury Bills 4,300 - NA NAMutual Fund Units 12,846 - NA NA
GFMP - 10 - - NA NA
Annual Report 2004-2005Standard Chartered Mutual Fund
CLOSE ENDED SCHEMES (LIVE)
Schedules to the financial statementsfor the period / year ended March 31, 2005 (Contd.)
(Currency: Indian Rupee)

84
10.7 Non-traded investments
As at March 31, 2005 the aggregate fair value of non-traded/thinly traded investments (as defined by the Regulations) is as follows:
Scheme Name March 31, 2005 March 31, 2004
GFMP - A 2,692,873,801 1,433,330,343GFMP - A2 1,344,945,331 NAGFMP - 4 2,068,422,724 NAGFMP - 5 1,424,173,157 NAGFMP - 6 2,798,168,814 NAGFMP - 7 2,191,107,760 NAGFMP - 9 271,350,476 NAGFMP - 10 2,976,224,696 NA
10.8 Income and expenditure
The total income (net of loss on sale of investments and net change in unrealised depreciation in value of investments) and expenditure and these amounts as a percentage of the Scheme's average daily net assets:
Scheme Name Income ExpenditureMarch 31, 2005 March 31, 2005
Amount Percentage * Amount Percentage *GFMP - A 154,533,069 5.25 8,578,078 0.29
2,762,544 45.05 18,243 0.30GFMP - A2 50,340,906 5.90 1,522,062 0.18GFMP - 4 3,124,119 53.79 21,027 0.36GFMP - 5 28,231,332 7.64 1,291,709 0.32GFMP - 6 80,060,738 9.54 7,880,713 0.94GFMP - 7 25,742,450 1.43 - -
Plan A - - 548,748 0.66Plan B - - 694,479 0.31
GFMP - 9 (450,699) (1.58) 157,344 0.55GFMP - 10 14,154,699 5.98 236,387 0.10
*Annualised from the date of allotment as the plan commenced during the period / year. Income represents income from the date when minimum subscription achieved and expenses represents expenses from the date of allotment.
10.9 Disclosure under regulation 25 (8) of SEBI Regulations
a) Commission and charges incurred on security transactions with sponsor or any of its associates as defined in the regulation 25(8):
Standard Chartered Bank, India branches is an associate of Standard Chartered Bank UK, the sponsor of the trust.
Scheme Name Commission Paid / Payable to Standard Chartered Bank, Indiabranches
March 31, 2005 March 31, 2004
Amount (Rs.) Amount (Rs.)
GFMP - A 32,625 Nil
Annual Report 2004-2005Standard Chartered Mutual Fund
CLOSE ENDED SCHEMES (LIVE)
Schedules to the financial statementsfor the period / year ended March 31, 2005 (Contd.)
(Currency: Indian Rupee)

85
10.10 Details of investment in companies that hold more than 5% of NAV of any scheme of Standard Chartered Mutual Fund:
Refer Annexure A
10.11 Applicability of loads
Scheme Name Stipulated Repurchase Period Load applicable(% of NAV)
GFMP - A2 From date of allotment to December 31, 2004 1.00From January 01, 2005 to March 31, 2005 0.75From April 01, 2005 to June 30, 2005 0.50
GFMP - 4 From date of allotment to June 30, 2005 1.00From July 01, 2005 to September 30, 2005 0.75From October 01, 2005 to December 31, 2005 0.50
GFMP - 5 From date of allotment to June 30, 2005 2.00From July 1, 2005 to September 30, 2005 1.50From October 1, 2005 to December 31, 2005 1.00
GFMP - 6 From date of allotment to December 31, 2005 2.00From January 01, 2006 to December 31, 2006 1.50From January 01, 2007 to March 31, 2007 1.00
GFMP - 7 From date of allotment to June 30, 2005 2.00From July 01, 2006 to December 31, 2005 1.50From January 01, 2006 to March 31, 2006 1.00
GFMP - 9 From date of allotment to March 31, 2007 5.00From April 01, 2007 to March 31, 2008 4.00From April 01, 2008 to March 31, 2009 3.00From April 01, 2009 to March 31, 2010 2.00
GFMP - 10 From date of allotment to April 16, 2005 2.00
10.12 Details of large holdings
Details of unit holdings over 25% of the net assets as on March 31, 2005 is Nil (Previous Year: Nil)
10.13 Portfolio holding (market / fair value) as at March 31, 2005:
Refer Annexure B
All investments, except for mutual fund units, are held in safe custody with Deutsche Bank AG, India /Reserve Bank of India.
10.14 Unpaid redemption and unclaimed dividend
As at March 31, 2005 unpaid redemption and unclaimed dividend aggregate Rs Nil. These details are based on confirmations as received from the Scheme's Registrars that maintain information of unclaimed redemption/dividends on behalf of the Scheme.
10.15 Historical per unit statistics:
Refer Annexure C
Annual Report 2004-2005Standard Chartered Mutual Fund
CLOSE ENDED SCHEMES (LIVE)
Schedules to the financial statementsfor the period / year ended March 31, 2005 (Contd.)
(Currency: Indian Rupee)

86
10.16 Prior period/year comparatives
The prior period/year figures have been reclassified/restated wherever necessary to confirm with the current year's presentation. Prior period figures have been shown in italics. There are no comparatives for the prior period as the units of the schemes were allotted during the course of the year, except in case of GFMP-A which was allotted during the previous period.
For Standard Chartered Asset Management For Standard Chartered TrusteeCompany Private Limited Company Private Limited
Sd/-Paul Jebson Sd/-Chairman Chairman / Director
Sd/-Naval Bir Kumar Sd/-Managing Director Director
Sd/-Rajiv AnandHead-Investments
MumbaiSeptember 15, 2005
Annual Report 2004-2005Standard Chartered Mutual Fund
CLOSE ENDED SCHEMES (LIVE)
Schedules to the financial statementsfor the period / year ended March 31, 2005 (Contd.)
(Currency: Indian Rupee)

Annexure Aas at March 31, 2005
Details of investment in companies / subsidiaries that hold more than 5% of NAV of any scheme of Standard Chartered Mutual Fund.
Company Schemes Investing Aggregate for Outstanding as at Outstanding as at invested in by Scheme the period under March 31, 2005. March 31, 2004. the company Name Regulation 25 (11) At Market / At Market /
At Cost (Rs.) Fair Value (Rs.) Fair Value (Rs.)
Industrial Development GFRF-ST GSSIF-IP* 4,669,180,800 53,527,700 1,064,667,600 Bank of India GCF GSSIF-ST** 8,279,903,278 - 735,225,800
GDBF GCF*** 15,099,681,647 1,539,315,415 2,409,817,550 GSSIF-IP GDBF**** 3,329,763,050 - 261,074,600
@GSSIF-ST GFRF-ST 6,277,492,359 1,000,363,963 699,947,500 @@ GSSIF-MT 1,763,123,279 10,973,890 379,644,250
@@@GFMP-A 725,164,750 258,570,250 400,063,200 @@@@ GFMP-A2 364,470,250 200,734,287 -
GFMP-6^ 444,432,200 439,718,200 - GFMP-5^^ 205,403,910 205,418,000 - GFMP-7^^^ 296,879,830 296,664,210 - GFMP-9^^^^ 53,859,410 53,527,700 - GFRF-LT# 2,578,031,250 617,373,500 - GFMP-4## 369,039,900 368,702,600 -
Tata Iron & Steel GCF GCF 23,306,875 - - Company Limited GSSIF-ST GSSIF-ST 276,645,950 - -
Hindalco Industries GCF GSSIF-IP 681,578,050 - - Limited GSSIF-IP GSSIF-ST 366,867,300 - 15,537,050
GFMP-A GCF 15,250,200 - - GFMP-A2GFMP-3
HDFC Bank Limited GSSIF-ST GCF 3,169,517,425 - - GFRF-LT GFRF-ST 1,240,555,772 - -
GFRF-LT 272,388,188 157,649,955 - GFMP-4 314,888,802 315,713,711 -
Housing Development Finance Corporation GSSIF-MT GSSIF-IP 4,862,734,033 49,521,050 963,893,150Limited GSSIF-ST 3,567,442,620 - -
GCF 16,033,844,530 900,277,900 738,483,161 GDBF 4,815,504,550 - -
GFRF-ST 9,712,256,300 950,381,550 292,313,476 GSSIF-MT 1,807,998,650 - 54,552,300 GFRF-LT 4,959,082,073 1,250,540,350 - GFMP-6 100,099,500 100,406,600 - GFMP-7 156,408,300 155,947,500 -
GFMP-5 105,876,700 105,093,700 -
Indo Gulf Corporation GSSIF-MT GSSIF-IP 250,000,000 - 273,960,500India Limited GDBF 264,420,250 - -
ICICI Bank Limited GCF GSSIF-IP 4,241,115,619 - 292,885,127 GSSIF-ST 7,059,290,209 - 450,769,200
GCF 23,470,481,902 2,804,042,890 933,062,054 GSSIF-MT 2,015,734,576 28,850,501 168,288,300
GDBF 2,738,769,035 96,378,865 98,612,931 GFRF-ST 8,689,932,850 1,714,726,182 749,152,802
GFSS-A3### 289,564,590 - - GFSS-A4#### 119,902,925 - 124,659,005
GFSS-A6+ 88,613,481 - 90,229,567 GFMP-Q++ 197,082,200 - 197,261,370
GFMP-A 323,301,550 309,053,650 - GFMP-A2 159,451,500 154,124,500 - GFMP-6 106,103,600 106,473,600 - GFMP-5 157,909,650 156,663,000 -
GFMP-3+++ 2,957,142,000 - -
87Standard Chartered Mutual Fund Annual Report 2004-2005
CLOSE ENDED SCHEMES (LIVE)

Annexure Aas at March 31, 2005
Details of investment in companies / subsidiaries that hold more than 5% of NAV of any scheme of Standard Chartered Mutual Fund. (Contd.)Company Schemes Investing Aggregate for Outstanding as at Outstanding as at
invested in by Scheme the period under March 31, 2005. March 31, 2004.
the company Name Regulation 25 (11) At Market / At Market /
At Cost (Rs.) Fair Value (Rs.) Fair Value (Rs.)
88Standard Chartered Mutual Fund Annual Report 2004-2005
CLOSE ENDED SCHEMES (LIVE)
GFMP-7 75,541,130 75,090,450 - GFMP-9 50,000,000 49,434,000 -
GFMP-10~ 1,479,121,500 1,733,843,894 - GFMP-4 96,040,900 - - GFRF-LT 2,091,663,230 1,384,885,765 -
Larsen & Toubro Limited GFRF-ST GCF 2,515,609,355 - 50,000,000 GDBF 50,000,000 - -
GFRF-ST 651,187,335 - 150,000,000 GSSIF-IP 250,000,000 - - GSSIF-ST 997,551,853 - -
Infrastructure DevelopmentFinance Corporation GDBF GSSIF-IP 1,361,393,650 - 215,810,800 Limited ASBF GSSIF-ST 1,913,733,286 - -
GCF 3,753,184,250 - - GFRF-ST 4,056,701,050 - 290,483,478
GDBF 639,568,050 - - GFRF-LT 2,648,228,050 1,202,828,400 - GFMP-6 102,991,900 103,899,300 - GFMP-10 246,112,250 247,271,099 -
ITC Limited GCF GSSIF-IP 200,000,000 - - GFRF-STGSSIF-ST
Bajaj Auto Finance Limited GCF GCF 147,320,050 49,290,992 - GFRF-ST 147,313,400 49,290,992 -
GDBF 49,807,700 - -
Raymond Limited GSSIF-ST GFRF-ST 750,000,000 - - GDBF GFRF-LT 350,000,000 - -
GCF 350,000,000 - -
Tata Sons GCF GFMP-A 101,433,100 100,624,000 - GFMP-3 GFMP-A2 50,716,550 50,312,000 -
GFMP-5 199,408,600 200,679,400 -
Tata Power GCF GSSIF-IP - 41,589,108 -
UTI Bank Limited GSSIF-ST GFRF-ST 2,154,451,400 237,710,600 - GDBF 312,461,400 113,300,373 -
GFMP-Q 98,615,800 - 98,694,897 GFMP-A 195,391,200 - -
GFMP-A2 97,716,250 - - GFMP-4 377,156,000 311,576,015 -
GCF 6,679,313,926 1,991,618,092 507,861,216 GSSIF-ST 1,022,367,772 18,883,398 83,097,891 GFRF-LT 385,740,700 - -
GSSIF-MT 28,253,100 28,325,088 - GSSIF-IP 47,192,500 47,208,497 -
* Grindlays Super Saver Income Fund - Investment Plan; ** Grindlays Super Saver Income Fund - Short Term Plan; *** Grindlays Cash Fund; **** Grindlays Dynamic Bond Fund; @ Grindlays Floating Rate Fund - Short Term; @@ Grindlays Super Saver Income Fund - Medium Term Plan; @@@ Grindlays Fixed Maturity Plan - Annual; @@@@ Grindlays Fixed Maturity Plan - Annual 2; ̂ Grindlays Fixed Maturity Plan - 6th Plan; ̂ ^ Grindlays Fixed Maturity Plan - 5th Plan; ̂ ^^ Grindlays Fixed Maturity Plan - 7th Plan; ̂ ^^^ Grindlays Fixed Maturity Plan - 9th Plan; # Grindlays Floating Rate Fund - Long Term; ## Grindlays Fixed Maturity Plan - 4th Plan; ### Grindlays Fixed Saving Scheme Series - Annual Plan 3; #### Grindlays Fixed Saving Scheme Series - Annual Plan 4; + Grindlays Fixed Saving Scheme Series - Annual Plan 6; ++ Grindlays Fixed Maturity Plan - Quarterly; +++ Grindlays Fixed Maturity Plan - 3th Plan; ~ Grindlays Fixed Maturity Plan - 10th Plan

89 Annual Report 2004-2005Standard Chartered Mutual Fund
GFMP - A GFMP - A2 GFMP - 4
Amount (Rs) % Amount (Rs) % Amount (Rs) %
Privately placed debentures and bondsNon Banking Financial Companies (NBFC)GE Capital Services Limited 299,810,300 42.26 - - - -
300,479,100 100.00 - - - -
Mahindra & Mahindra Finance - - 152,560,650 42.73 - -- - - - - -
Tata Sons 100,624,000 14.18 50,312,000 14.09 - -- - - - - -
Banks and Financial InstitutionsABN AMRO Bank - - - - - -
- - - - - -
Citibank - - - - - -- - - - - -
ICICI Bank Limited 309,053,650 43.56 154,124,500 43.18 - -- - - - - -
Total 709,487,950 100.00 356,997,150 100.00 - -300,479,100 100.00 - - - -
Securitised PaperOthers
Indian Retail ABS Trust - - - - - -- - - - - -
Mobile Trust - - - - - -- - - - - -
HDFC Bank ABS Trust Ser 6 - - - - 315,713,711 100.00- - - - - -
Loan Securitisation Trust - - - - - -- - - - - -
NTPC Securatised Loan - - - - - -- - - - - -
Total - - - - 315,713,711 100.00- - - - - -
Debentures And Bonds Listed/AwaitingListing On Recognised Stock Exchange
Non Banking Financial Companies (NBFC)
Industrial Development Bank Of India 258,570,250 36.24 103,428,100 12.65 368,702,600 29.45400,063,200 78.79 - - - -
Indian Railway Financial Corporation Limited 50,824,350 7.12 206,609,850 25.26 410,103,000 32.7554,615,550 10.76 - - - -
IDFC Limited - - - - - -- - - - - -
Ultra Tech Cemco - - - - - -- - - - - -
Power Finance Corporation Limited - - - - - -- - - - - -
Power Grid Corporation Limited - - - - 154,524,450 12.34- - - - - -
March 31, 2005March 31, 2004
CLOSE ENDED SCHEMES (LIVE)
Annexure BPortfolio holding (market / fair value) as at March 31, 2005

90 Annual Report 2004-2005Standard Chartered Mutual Fund
GFMP - A GFMP - A2 GFMP - 4
Amount (Rs) % Amount (Rs) % Amount (Rs) %
Banks and Financial Institutions
Bank Of India - - - - - -- - - - - -
Citi Finance Consumer Limited 201,006,800 28.17 201,948,200 24.69 49,938,350 3.99- - - - - -
Citicorp Finance 100,940,600 14.15 202,258,200 24.73 - -- - - - - -
HDFC Bank - - - - - -- - - - - -
EXIM Bank - - - - - -- - - - - -
Union Bank Of India - - - - 63,470,110 5.07- - - - - -
State Bank Of India - - - - 52,682,800 4.21- - - - - -
Housing & Finance
HDFC Limited - - - - - -- - - - - -
LIC Housing Finance - - - - - -- - - - - -
DiversifiedReliance Industries Limited 51,428,800 7.21 - - 152,738,550 12.20
- - - - - -
Petroleum
Indian Oil Corporation 50,656,400 7.10 - - - -53,093,200 10.46 - - - -
Indian Petrochemicals - - - - - -- - - - - -
Power & Gas
Nuclear Power Corporation - - 103,627,900 12.67 - -- - - - - -
National Thermal Power Corporation Limited - - - - - -- - - - - -
Total 713,427,200 100.00 817,872,250 100.00 1,252,159,860 100.00507,771,950 100.00 - - - -
Treasury Bills364 DTB (Maturity Date: April 15, 2005) 189,626,650 79.19 - - - -
- - - - - -364 DTB (Maturity Date: April 23, 2004) 49,841,400 20.81 - - - -
- - - - - -
364 DTB (Maturity Date: August 20, 2005) - - 48,983,950 100.00 - -- - - - - -
91 DTB ((Maturity Date: March 17, 2006) - - - - - -- - - - - -
Total 239,468,050 100.00 48,983,950 100.00 - -- - - - - -
March 31, 2005March 31, 2004
CLOSE ENDED SCHEMES (LIVE)
Annexure BPortfolio holding (market / fair value) as at March 31, 2005 (Contd.)

91 Annual Report 2004-2005Standard Chartered Mutual Fund
March 31, 2005March 31, 2004
CLOSE ENDED SCHEMES (LIVE)
GFMP - A GFMP - A2 GFMP - 4
Amount (Rs) % Amount (Rs) % Amount (Rs) %
Commercial PaperNon Banking Financial Companies (NBFC)ICICI Securities Limited - - - - - -
- - - - - -
IDFC Limited - - - - - -- - - - - -
GE Capital Services Limited - - 58,115,704 37.39 - -- -
Power Finance Corporation Limited - - - - - -- - - - - -
Banks and Financial InstitutionsIDBI Bank - - 97,306,187 62.61 - -
- - - - - -
Total - - 155,421,892 100.00 - -- - - - - -
Certificate Of DepositsBanks and Financial InstitutionsICICI Bank Limited - - - - - -
- - - - - -
Jammu & Kashmir Bank - - - - 188,973,138 37.75- - - - - -
Kotak Mahindra Bank 551,808,242 100.00 - - - -- - - - - -
UTI Bank - - - - 311,576,015 62.25- - - - - -
Total 551,808,242 100 - - 500,549,153 100.00- - - - - -
Mutual Fund UnitsInvestment in GGSF-IP - - - - - -
- - - - - -
Investment in GDBF - - - - - -- - - - - -
Investment in GCF 703,288,531 97.92 - - - -625,079,293 100.00 - - - -
Investment in GFRF-ST 14,861,879 2.07 14,654,039 100.00 - -- - - - - -
Investment in GSSIF-IP - - - - - -- - - - - -
Investment in GGSF-ST - - - - - -- - - - - -
Total 718,250,410 99.99 14,654,039 100.00 - -625,079,293 100.00 - - - -
Reverse Repos364 Day T - Bill (Maturity Date - 02/09/05) 2,444,465 100.00 977,787 100.00 7,822,288 100.00
- - - - - -
2,444,465 100.00 977,787 100.00 7,822,288 100.00- - - - - -
TOTAL INVESTMENTS 2,934,886,317 1,394,907,068 2,076,245,0121,433,330,343 - -
Annexure BPortfolio holding (market / fair value) as at March 31, 2005 (Contd.)

92 Annual Report 2004-2005Standard Chartered Mutual Fund
GFMP - 5 GFMP - 6 GFMP - 7
Amount (Rs) % Amount (Rs) % Amount (Rs) %
Privately placed debentures and bondsNon Banking Financial Companies (NBFC)GE Capital Services Limited - - 252,647,300 70.35 250,842,500 56.25
- - - - - -
Mahindra & Mahindra Finance - - - - - -- - - - - -
Tata Sons 200,679,400 39.42 - - - -- - - - - -
Banks and Financial InstitutionsABN AMRO Bank - - - - 109,208,800 24.49
- - - - - -
Citibank 151,710,160 29.80 - - 10,836,440 2.43- - - - - -
ICICI Bank Limited 156,663,000 30.78 106,473,600 29.65 75,090,450 16.84- - - - - -
Total 509,052,560 100.00 359,120,900 100.00 445,978,190 100.00- - - - - -
Securitised PaperOthersIndian Retail ABS Trust 139,723,864 43.72 322,497,060 46.40 159,684,416 38.14
- - - - - -
Mobile Trust - - - - - -- - - - - -
HDFC Bank ABS Trust Ser 6 - - - - - -- - - - - -
Loan Securitisation Trust - - 372,535,272 53.60 - -- - - - - -
NTPC Securatised Loan 179,837,638 56.28 - - 258,966,198 61.86- - - - - -
Total 319,561,502 100.00 695,032,332 100.00 418,650,614 100.00- - - - - -
Debentures And Bonds Listed/AwaitingListing On Recognised Stock ExchangeNon Banking Financial Companies (NBFC)Industrial Development Bank Of India 205,418,000 36.29 439,718,200 25.49 296,664,210 22.78
- - - - - -
Indian Railway Financial Corporation Limited 205,855,250 36.36 256,636,850 14.88 309,100,750 23.73- - - - - -
IDFC Limited - - 103,899,300 6.02 - -- - - - - -
Ultra Tech Cemco - - 103,618,400 6.01 - -- - - - - -
Power Finance Corporation Limited - - - - - -- - - - - -
Power Grid Corporation Limited - - - - - -- - - - - -
March 31, 2005March 31, 2004
CLOSE ENDED SCHEMES (LIVE)
Annexure BPortfolio holding (market / fair value) as at March 31, 2005 (Contd.)

93 Annual Report 2004-2005Standard Chartered Mutual Fund
March 31, 2005March 31, 2004
CLOSE ENDED SCHEMES (LIVE)
GFMP - 5 GFMP - 6 GFMP - 7
Amount (Rs) % Amount (Rs) % Amount (Rs) %
Banks and Financial Institutions
Bank Of India - - 165,069,000 9.57 - -- - - - - -
Citi Finance Consumer Limited 49,738,650 8.79 402,882,500 23.36 297,418,850 22.84- - - - - -
Citicorp Finance - - - - - -- - - - - -
HDFC Bank 105,093,700 18.56 - - - -- - - - - -
EXIM Bank - - 49,762,750 2.89 51,918,500 3.99- - - - - -
Union Bank Of India - - - - 151,487,140 11.63- - - - - -
State Bank Of India - - - - - -- - - - - -
Housing & Finance
HDFC Limited - - 100,406,600 5.82 155,947,500 11.97- - - - - -
LIC Housing Finance - - 102,801,900 5.96 - -- - - - - -
DiversifiedReliance Industries Limited - - - - - -
- - - - - -
Petroleum
Indian Oil Corporation - - - - - -- - - - - -
Indian Petrochemicals - - - - - -- - - - - -
Power & Gas
Nuclear Power Corporation - - - - - -- - - - - -
National Thermal Power Corporation Limited - - - - 39,910,221 3.06- - - - - -
Total 566,105,600 100.00 1,724,795,500 100.00 1,302,447,171 100.00- - - - - -
Treasury Bills
364 DTB (Maturity Date: April 15, 2005) - - - - - -- - - - - -
364 DTB (Maturity Date: April 23, 2004) - - - - - -- - - - - -
364 DTB (Maturity Date: August 20, 2005) - - - - - -- - - - - -
91 DTB ((Maturity Date: March 17, 2006) - - - - - -- - - - - -
Total - - - - - -- - - - - -
Annexure BPortfolio holding (market / fair value) as at March 31, 2005 (Contd.)

94 Annual Report 2004-2005Standard Chartered Mutual Fund
March 31, 2005March 31, 2004
CLOSE ENDED SCHEMES (LIVE)
GFMP - 5 GFMP - 6 GFMP - 7
Amount (Rs) % Amount (Rs) % Amount (Rs) %
Commercial PaperNon Banking Financial Companies (NBFC)ICICI Securities Limited - - - - - -
- - - - - -
IDFC Limited - - - - - -- - - - - -
GE Capital Services Limited - - - - - -
Power Finance Corporation Limited - - - - - -- - - - - -
Banks and Financial InstitutionsIDBI Bank - - - - - -
- - - - - -
Total - - - - - -- - - - - -
Certificate Of DepositsBanks and Financial InstitutionsICICI Bank Limited - - - - - -
- - - - - -
Jammu & Kashmir Bank - - - - - -- - - - - -
Kotak Mahindra Bank - - - - - -- - - - - -
UTI Bank - - - - - -- - - - - -
Total - - - - - -- - - - - -
Mutual Fund UnitsInvestment in GGSF-IP - - - - - -
- - - - - -
Investment in GDBF - - - - - -- - - - - -
Investment in GCF 23,900,405 81.15 - - 24,031,785 100.00- - - - - -
Investment in GFRF-ST 5,553,091 18.85 19,220,151 100.00 - -- - - - - -
Investment in GSSIF-IP - - - - - -- - - - - -
Investment in GGSF-ST - - - - - -- - - - - -
Total 29,453,495 100 19,220,082 100.00 24,031,785 100.00- - - - - -
Reverse Repos364 Day T - Bill (Maturity Date - 02/09/05) - - 9,777,860 100.00 - -
- - - - - -
- 0.00 9,777,860 100.00 - 0.00- - - - - -
TOTAL INVESTMENTS 1,424,173,157 2,807,946,674 2,191,107,760- - -
Annexure BPortfolio holding (market / fair value) as at March 31, 2005 (Contd.)

95 Annual Report 2004-2005Standard Chartered Mutual Fund
GFMP - 9 GFMP - 10
Amount (Rs) % Amount (Rs) %
Privately placed debentures and bondsNon Banking Financial Companies (NBFC)GE Capital Services Limited - - - -
- - - -
Mahindra & Mahindra Finance - - - -- - - -
Tata Sons - - - -- - - -- - - -
Banks and Financial Institutions
ABN AMRO Bank - - - -- - - -
Citibank - - - -- - - -
ICICI Bank Limited 49,434,000 100.00 - -- - - -
Total 49,434,000 100.00 - -- - - -
Securitised Paper
OthersIndian Retail ABS Trust - - - -
- - - -Mobile Trust - - - -
- - - -HDFC Bank ABS Trust Ser 6 - - - -
- - - -
Loan Securitisation Trust - - - -- - - -
NTPC Securatised Loan - - - -- - - -
Total - - - -- - - -
Debentures And Bonds Listed/AwaitingListing On Recognised Stock Exchange
Non Banking Financial Companies (NBFC)
Industrial Development Bank Of India 53,527,700 25.22 - -- - - -
Indian Railway Financial Corporation Limited 49,755,450 23.45 - -- - - -
IDFC Limited - - - -- - - -
Ultra Tech Cemco - - - -- - - -
Power Finance Corporation Limited 9,950,830 4.69 - -- - - -
Power Grid Corporation Limited 49,805,950 23.47 - -- - - -
March 31, 2005March 31, 2004
CLOSE ENDED SCHEMES (LIVE)
Annexure BPortfolio holding (market / fair value) as at March 31, 2005 (Contd.)

96 Annual Report 2004-2005Standard Chartered Mutual Fund
CLOSE ENDED SCHEMES (LIVE)
GFMP - 9 GFMP - 10
Amount (Rs) % Amount (Rs) %
Banks and Financial Institutions
Bank Of India - - - -- - - -
Citi Finance Consumer Limited - - - -- - - -
Citicorp Finance - - - -- - - -
HDFC Bank - - - -- - - -
EXIM Bank - - - -- - - -
Union Bank Of India 49,163,700 23.17 - -- - - -
State Bank Of India - - - -- - - -
Housing & Finance
HDFC Limited - - - -- - - -
LIC Housing Finance - - - -- - - -
DiversifiedReliance Industries Limited - - - -
- - - -
Petroleum
Indian Oil Corporation - - - -- - - -
Indian Petrochemicals - - - -- - - -
Power & Gas
Nuclear Power Corporation - - - -- - - -
National Thermal Power Corporation Limited - - - -- - - -
Total 212,203,630 100.00 - -- - - -
Treasury Bills
364 DTB (Maturity Date: April 15, 2005) - - - -- - - -
364 DTB (Maturity Date: April 23, 2004) - - - -- - - -
364 DTB (Maturity Date: August 20, 2005) - - - -- - - -
91 DTB ((Maturity Date: March 17, 2006) 47,449,300 100.00 - -- - - -
Total 47,449,300 100.00 - -- - - -
March 31, 2005March 31, 2004
Annexure BPortfolio holding (market / fair value) as at March 31, 2005 (Contd.)

97 Annual Report 2004-2005Standard Chartered Mutual Fund
CLOSE ENDED SCHEMES (LIVE)
GFMP - 9 GFMP - 10
Amount (Rs) % Amount (Rs) %
Commercial PaperNon Banking Financial Companies (NBFC)ICICI Securities Limited - - 246,935,379 23.65
- - - -
IDFC Limited - - 247,271,099 23.68- - - -
GE Capital Services Limited - - - -
Power Finance Corporation Limited - - 550,035,221 52.67- - - -
Banks and Financial InstitutionsIDBI Bank - - - -
- - - -
Total - - 1,044,241,699 100.00- - - -
Certificate Of DepositsBanks and Financial InstitutionsICICI Bank Limited - - 1,733,843,894 89.74
- - - -
Jammu & Kashmir Bank - - 198,139,102 10.26- - - -
Kotak Mahindra Bank - - - -- - - -
UTI Bank - - - -- - - -
Total - - 1,931,982,996 100.00- - - -
Mutual Fund UnitsInvestment in GGSF-IP - - - -
- - - -
Investment in GDBF - - - -- - - -
Investment in GCF 9,712,846 100.00 - -- - - -
Investment in GFRF-ST - - - -- - - -
Investment in GSSIF-IP - - - -- - - -
Investment in GGSF-ST - - - -- - - -
Total 9,712,846 100.00 - -- - - -
Reverse Repos364 Day T - Bill (Maturity Date - 02/09/05) 1,955,572 100.00 4,888,930 100.00
- - - -
1,955,572 100.00 4,888,930 100.00- - - -
TOTAL INVESTMENTS 320,755,348 2,981,113,625- -
March 31, 2005March 31, 2004
Annexure BPortfolio holding (market / fair value) as at March 31, 2005 (Contd.)

98 Annual Report 2004-2005Standard Chartered Mutual Fund
Grindlays Fixed Maturity Plan - Annual
2005 2004
A NAVGrowth Option 10.5380 10.0115Dividend Option 10.5380 10.0115
B Gross Incomei Income other than profit on sale of investment 0.6545 0.0097ii Income from profit on inter scheme
Sales / transfer of investment 0.0129 -iii Income from profit on sale of investment to third party 0.0137 -iv Transfer to revenue account from past year’s reserve - -
C Aggregate of expenses, write off, amortisation and charges 0.1708 0.0001
D Net Income 0.5103 0.0096
E Unrealised Appreciation in value of investments 0.0179 0.0019
F (a) NAV Highest Lowest Highest * Lowest*Growth Option 10.5380 10.0228 10.0115 10.0115Dividend Option 10.5380 10.0228 10.0115 10.0115
(b) Repurchase Price Highest Lowest Highest * Lowest*Growth Option 10.5380 10.0228 10.0115 10.0115Dividend Option 10.5380 10.0228 10.0115 10.0115
(c) Resale Price Highest Lowest Highest * Lowest*Growth Option 10.5380 10.0228 10.0115 10.0115Dividend Option 10.5380 10.0228 10.0115 10.0115
G Ratio of Expenses to Average Net Assetsby percentage (Annualised) 0.29% 0.30%
H Ratio of Gross Income to Average Net Assetsby percentage (Annualised) 5.25% 45.05%
Note
* For the period from the date of allotment of units i.e. March 31, 2004
Annexure CHistorical per unit statistics for the period / year ended March 31, 2005
(Currency: Indian Rupee)

99 Annual Report 2004-2005Standard Chartered Mutual Fund
Grindlays Fixed Maturity Plan - Annual Plan 2
Aug. 27, 2004 toMar. 31, 2005
A NAVGrowth Option 10.3553Dividend Option 10.3553
B Gross Incomei Income other than profit on sale of investment 0.5068ii Income from profit on inter scheme Sales / transfer of investment 0.0097iii Income from profit on sale of investment to third party -iv Transfer to revenue account from past year’s reserve -
C Aggregate of expenses, write off, amortisation and charges 0.0109
D Net Income 0.5056
E Unrealised Appreciation in value of investments 0.0071
F (a) NAV Highest * Lowest*Growth Option 10.3553 10.0296Dividend Option 10.3553 10.0296
(b) Repurchase Price Highest * Lowest*Growth Option 10.3553 10.0296Dividend Option 10.3553 10.0296
(c) Resale Price Highest * Lowest*Growth Option 10.3553 10.0296Dividend Option 10.3553 10.0296
G Ratio of Expenses to Average Net Assetsby percentage (Annualised) 0.18%
H Ratio of Gross Income to Average Net Assetsby percentage (Annualised) 5.90%
Note
* For the period from the date of allotment of units i.e. August 27, 2004 to March 31, 2005
There are no comparatives for the prior period as the units of Grindlays Fixed Maturity Plan - Annual Plan 2 wereallotted on August 27, 2004
Annexure CHistorical per unit statistics for the period / year ended March 31, 2005
(Currency: Indian Rupee)

100 Annual Report 2004-2005Standard Chartered Mutual Fund
Grindlays Fixed Maturity Plan - 4th Plan
Mar. 31, 2005 toMar. 31, 2005
A NAVGrowth Option - Plan A 10.0162Growth Option - Plan B 10.0162Dividend Option - Plan A 10.0162
B Gross Incomei Income other than profit on sale of investment 0.0148ii Income from profit on inter scheme Sales / transfer of investment -iii Income from profit on sale of investment to third party -iv Transfer to revenue account from past year’s reserve -
C Aggregate of expenses, write off, amortisation and charges 0.0001
D Net Income 0.0147
E Unrealised Appreciation in value of investments 0.0043
F (a) NAV Highest * Lowest*Growth Option - Plan A 10.0162 10.0162Growth Option - Plan B 10.0162 10.0162Dividend Option - Plan A 10.0162 10.0162
(b) Repurchase Price Highest * Lowest*Growth Option - Plan A 10.0162 10.0162Growth Option - Plan B 10.0162 10.0162Dividend Option - Plan A 10.0162 10.0162
(c) Resale Price Highest * Lowest*Growth Option - Plan A 10.0162 10.0162Growth Option - Plan B 10.0162 10.0162Dividend Option - Plan A 10.0162 10.0162
G Ratio of Expenses to Average Net Assets by percentage (Annualised)Plan A 0.36%Plan B 0.08%
H Ratio of Gross Income to Average Net Assets by percentage (Annualised) 53.79%
Note
* For the period from the date of allotment of units i.e. March 31, 2005 to March 31, 2005
There are no comparatives for the prior period as the units of Grindlays Fixed Maturity Plan - 4th Plan were allotted onMarch 31, 2005
Annexure CHistorical per unit statistics for the period / year ended March 31, 2005
(Currency: Indian Rupee)

101 Annual Report 2004-2005Standard Chartered Mutual Fund
Grindlays Fixed Maturity Plan - 5th Plan
Dec. 20, 2004 toMar. 31, 2005
A NAVGrowth Option 10.1874Dividend Option 10.1874
B Gross Incomei Income other than profit on sale of investment 0.3095ii Income from profit on inter scheme Sales / transfer of investment -iii Income from profit on sale of investment to third party -iv Transfer to revenue account from past year’s reserve -
C Aggregate of expenses, write off, amortisation and charges 0.0089
D Net Income 0.3006
E Unrealised Appreciation in value of investments 0.0017
F (a) NAV Highest * Lowest*Growth Option 10.1874 10.0261Dividend Option 10.1874 10.0261
(b) Repurchase Price Highest * Lowest*Growth Option 10.1874 10.0261Dividend Option 10.1874 10.0261
(c) Resale Price Highest * Lowest*Growth Option 10.1874 10.0261Dividend Option 10.1874 10.0261
G Ratio of Expenses to Average Net Assets by percentage (Annualised) 0.35%
H Ratio of Gross Income to Average Net Assets by percentage (Annualised) 7.64%
Note
* For the period from the date of allotment of units i.e. December 30, 2004 to March 31, 2005
There are no comparatives for the prior period as the units of Grindlays Fixed Maturity Plan - 5th Plan were allotted onDecember 30, 2004
Annexure CHistorical per unit statistics for the period / year ended March 31, 2005
(Currency: Indian Rupee)

102 Annual Report 2004-2005Standard Chartered Mutual Fund
Grindlays Fixed Maturity Plan - 6th Plan
Dec. 16, 2004 toMar. 31, 2005
A NAVGrowth Option 10.2672Dividend Option 10.2672
B Gross Incomei Income other than profit on sale of investment 0.2803ii Income from profit on inter scheme Sales / transfer of investment -iii Income from profit on sale of investment to third party 0.0014iv Transfer to revenue account from past year’s reserve -
C Aggregate of expenses, write off, amortisation and charges 0.0277
D Net Income 0.2540
E Unrealised Appreciation in value of investments 0.0123
F (a) NAV Highest * Lowest*Growth Option 10.2672 10.0318Dividend Option 10.2672 10.0318
(b) Repurchase Price Highest * Lowest*Growth Option 10.2672 10.0318Dividend Option 10.2672 10.0318
(c) Resale Price Highest * Lowest*Growth Option 10.2672 10.0318Dividend Option 10.2672 10.0318
G Ratio of Expenses to Average Net Assets by percentage (Annualised) 0.94%
H Ratio of Gross Income to Average Net Assets by percentage (Annualised) 9.54%
Note
* For the period from the date of allotment of units i.e. December 16, 2004 to March 31, 2005
There are no comparatives for the prior period as the units of Grindlays Fixed Maturity Plan - Annual were allotted onDecember 16, 2004
Annexure CHistorical per unit statistics for the period / year ended March 31, 2005
(Currency: Indian Rupee)

103 Annual Report 2004-2005Standard Chartered Mutual Fund
Grindlays Fixed Maturity Plan - 7th Plan
Feb. 10, 2005 toMar. 31, 2005
A NAVGrowth Option Plan A 10.1066Dividend Option Plan A 10.1066Growth Option Plan B 10.1114Dividend Option Plan B 10.1114
B Gross Incomei Income other than profit on sale of investment 0.1511ii Income from profit on inter scheme Sales / transfer of investment -iii Income from profit on sale of investment to third party -iv Transfer to revenue account from past year’s reserve -
C Aggregate of expenses, write off, amortisation and charges 0.0056
D Net Income 0.1455
E Unrealised Appreciation in value of investments 0.0001
F (a) NAV Highest * Lowest*Growth Option Plan A 10.1066 10.0352Dividend Option Plan A 10.1066 10.0352Growth Option Plan A 10.1114 10.0358Dividend Option Plan A 10.1114 10.0358
(b) Repurchase Price Highest * Lowest*Growth Option Plan A 10.1066 10.0352Dividend Option Plan A 10.1066 10.0352Growth Option Plan B 10.1114 10.0358Dividend Option Plan B 10.1114 10.0358
(c) Resale Price Highest * Lowest*Growth Option Plan A 10.1066 10.0352Dividend Option Plan A 10.1066 10.0352Growth Option Plan B 10.1114 10.0358Dividend Option Plan B 10.1114 10.0358
G Ratio of Expenses to Average Net Assets by percentage (Annualised)Plan A 0.66%Plan B 0.31%
H Ratio of Gross Income to Average Net Assets by percentage (Annualised) 1.43%
Note
* For the period from the date of allotment of units i.e. February 10, 2005 to March 31, 2005
There are no comparatives for the prior period as the units of Grindlays Fixed Maturity - 7th Plan were allotted onFebruary 10, 2005
Annexure CHistorical per unit statistics for the period / year ended March 31, 2005
(Currency: Indian Rupee)

104 Annual Report 2004-2005Standard Chartered Mutual Fund
Grindlays Fixed Maturity Plan - 9th Plan
Feb. 28, 2005 toMar. 31, 2005
A NAVGrowth Option 9.9819Dividend Option 9.9819
B Gross Incomei Income other than profit on sale of investment 0.0664ii Income from profit on inter scheme Sales / transfer of investment -iii Income from profit on sale of investment to third party (0.0116)iv Transfer to revenue account from past year’s reserve -
C Aggregate of expenses, write off, amortisation and charges 0.0734
D Net Income (0.0186)
E Unrealised Appreciation in value of investments 0.0005
F (a) NAV Highest * Lowest*Growth Option 9.9881 9.9673Dividend Option 9.9881 9.9673
(b) Repurchase Price Highest * Lowest*Growth Option 9.9881 9.9673Dividend Option 9.9881 9.9673
(c) Resale Price Highest * Lowest*Growth Option 9.9881 9.9673Dividend Option 9.9881 9.9673
G Ratio of Expenses to Average Net Assets by percentage (Annualised) 0.55%
H Ratio of Gross Income to Average Net Assets by percentage (Annualised) -1.58%
Note
* For the period from the date of allotment of units i.e. February 28, 2005 to March 31, 2005
There are no comparatives for the prior period as the units of Grindlays Fixed Maturity Plan - 9th Plan were allotted on28th February, 2005
Annexure CHistorical per unit statistics for the period / year ended March 31, 2005
(Currency: Indian Rupee)

105 Annual Report 2004-2005Standard Chartered Mutual Fund
Grindlays Fixed Maturity Plan - 10th Plan
Feb. 25, 2005 toMar. 31, 2005
A NAVGrowth Option 10.0469Dividend Option 10.0469
B Gross Incomei Income other than profit on sale of investment 0.0477ii Income from profit on inter scheme Sales / transfer of investment -iii Income from profit on sale of investment to third party -iv Transfer to revenue account from past year’s reserve -
C Aggregate of expenses, write off, amortisation and charges 0.0008
D Net Income 0.0469
E Unrealised Appreciation in value of investments -
F (a) NAV Highest * Lowest*Growth Option 10.0469 9.9831Dividend Option 10.0469 9.9831
(b) Repurchase Price Highest * Lowest*Growth Option 10.0469 9.9831Dividend Option 10.0469 9.9831
(c) Resale Price Highest * Lowest*Growth Option 10.0469 9.9831Dividend Option 10.0469 9.9831
G Ratio of Expenses to Average Net Assets by percentage (Annualised) 0.10%
H Ratio of Gross Income to Average Net Assets by percentage (Annualised) 5.98%
Note
* For the period from the date of allotment of units i.e. February 25, 2005 to March 31, 2005
There are no comparatives for the prior period as the units of Grindlays Fixed Maturity Plan - 10th Plan were allotted onMarch 3, 2005
Annexure CHistorical per unit statistics for the period / year ended March 31, 2005
(Currency: Indian Rupee)

106 Annual Report 2004-2005Standard Chartered Mutual Fund
RISK FACTORS
Risk Factors: Mutual Funds and securities investments are subject to market risks, reinvestment risk, changes in political, economic environment and government policy and there is no assurance or guarantee that the objectives of the Scheme will be achieved. The NAV of the Scheme can go up or down depending on factors and forces affecting the Securities Market
. Past performance of the Sponsor/AMC/Mutual Fund is not necessarily indicative of the future performance of the Scheme/s. Grindlays Fixed Maturity Plan (GFMP) & Grindlays Fixed Savings Scheme (GFSS) are the names of the schemes and do not in any manner indicate the quality of the schemes, their future prospects or returns. The Sponsor or any of its associates is not responsible or liable for any loss resulting from the operation of the Scheme beyond the corpus of the Trust of Rs. 20,000/- Investors in the scheme are not being offered any guaranteed or assured rate of return.
Please read the offer document carefully before investing.
Statutory Details: Standard Chartered Mutual Fund has been set up as a trust by Standard Chartered Bank (liability restricted to corpus of Trust of Rs. 20,000) with Standard Chartered Trustee Company Private Limited (Company with limited liability) as the trustee and Standard Chartered Asset Management Company Private Limited (Company with limited liability) as the investment manager.
*Terms of Issue, Redemption & Load Structure:
GFSS and GFMP are close ended schemes. NAVs are calculated on weekly basis. GFSS Annual Plan 3, Annual Plan 4, Annual Plan 6, Grindlays Fixed Maturity Plan - Quarterly Plan (GFMP-Q) & Grindlays Fixed Maturity 3rd Plan (GFMP-3) got redeemed as on April 5, 2004, July 27, 2004, November 4, 2004, July 8, 2004 and February 25, 2005 respectively. The units under Grindlays Fixed Maturity Plan - Annual Plan (GFMP-A), Grindlays Fixed Maturity Plan - Annual Plan 2 (GFMP-A2), Grindlays Fixed Maturity 4th Plan (GFMP-4), Grindlays Fixed Maturity 5th Plan (GFMP-5), Grindlays Fixed Maturity 6th Plan (GFMP-6), Grindlays Fixed Maturity 7th Plan (GFMP-7), Grindlays Fixed Maturity 9th Plan (GFMP-9) & Grindlays Fixed Maturity 10th Plan (GFMP-10) will redeem on April 11, 2005, September 2, 2005 , April 12, 2006, May 17, 2006, June 16, 2007, June 14, 2006 , April 7, 2010 and June 1, 2005.
To give liquidity to investors, repurchase facility is made available: Load Structure: There is no Entry Load in of the Plan(s) / Schemes GFSS. Annual Plan 3 - Exit Load Nil. GFSS - Annual Plan 4 and Annual Plan 6: The applicable exit Load if for repurchases made after 90 days from the date of allotment - 1.00%, After 180 days from the date of allotment - 0.75 %, After 270 days from the date of allotment - 0.50 %. GFMP-Q - No exit load, GFMP - 3 units purchased from the date of allotment to January 11, 2005 - 2.00 %, and on maturity Nil. GFMP-A - 1% for repurchase made after 90 days from the date of allotment, 0.75% after 180 days from the date of allotment and 0.50% after 270 date from the date of allotment. GFMP-A2 is 1% for repurchases made upto December 31, 2004, 0.75% upto March 31, 2005 & 0.50% upto June 30, 2005, in GFMP-4 is 1% for repurchases made upto June 30, 2005, 0.75% upto September 30, 2005 and 0.50% upto December 30, 2005 and NIL on maturity, GFMP-6 is 2% for repurchases made upto March 31, 2005, June 30, 2005, September 30, 2005 and December 31, 2005 and 1.5% for repurchases made upto March 31, 2006, June 30, 2006, September 30, 2006 and December 31, 2006 and 1% upto March 31, 2007 and Nil on maturity, in GFMP-5 is 2% for repurchases made upto March 31, 2005 and June 30, 2005, 1.5% for repurchases made upto September 30, 2005 and December 31, 2005, 1% upto March 31, 2006 and Nil on maturity, in GFMP-7 is 2% for repurchases made upto March 31, 2005, June 30, 2005, 1.5% for repurchases made upto September 30, 2005 and December 31, 2005 , 1% for repurchases made upto March 31, 2006 and Nil on maturity and in GFMP-9 is 5% for repurchases made upto June 30, 2005, September 30, 2005, December 31, 2005, March 31, 2006, June 30, 2006, September 30, 2006, December 31, 2006 and March 31, 2007, 4% for repurchases made upto June 30, 2007, September 30, 2007, December 31, 2007 and March 31, 2008 , 3% for repurchases made upto June 30, 2008, September 30, 2008, December 31, 2008 and March 31, 2009, 2% for repurchases made upto June 30, 2009, September 30, 2009, December 31, 2009 and March 31, 2010 and Nil on maturity, in GFMP-10 is 2% for repurchases made upto April 16, 2005 and NIL on maturity.
Investment Objective: GFSS & GFMP: To seek growth of capital by investing in a portfolio of fixed income securities normally maturing in line with the time profile of the respective plan(s) / Schemes.
Asset Allocation: GFSS : Will normally invest upto 100% in corporate bonds / Government Securities / Money market instruments having a tenor in line with the duration of the plans. GFMP A and GFMP A2: Will normally invest upto 100% in debt and money market instruments in line with the duration of the plan/s. GFMP-4,GFMP-5, GFMP-6,GFMP-7 & GFMP-10 - Will normally invest upto 100% in debt and money market instruments in line with the duration of the schemes. GFMP- 9: Normally invest upto 65-10% in debt instruments and 0-35 % in money market instruments in line with the duration of the scheme. Investment in derivatives, foreign securities and stock lending upto 50%, upto 25%, and upto 25% of the net asstes of the scheme respectively.
This document is issued by Standard Chartered Mutual Fund (SCMF). It is for information purposes only. It does not constitute any offer, recommendation or solicitation to any transaction or adopt and hedging trading or investment strategy, nor does it constitute any prediction of likely future movements in rates or prices or any representation that any such future movement will not exceed those shown in any illustration.
You are advised to make your own independent judgment with respect to matter contained therein.
* As on March 31, 2005
including fluctuation in interest rates, trading volumes and reinvestment risk
All rates and figures appearing are for illustrative purposes.
CLOSE ENDED SCHEMES

This p
age
has b
een
inten
tiona
lly le
ft bla
nk

This p
age
has b
een
inten
tiona
lly le
ft bla
nk