Cloning and expression of proteins from Mycobacterium smegmatis
27
Cloning and expression of proteins from Mycobacterium smegmatis Erik Mattsson Degree project in biology, 2007 Examensarbete i biologi, 30 hp, 2007 Biology Education Centre and Department of Cell and Molecular Biology, Uppsala University Supervisor: Dr. Mikael Nilsson
Transcript of Cloning and expression of proteins from Mycobacterium smegmatis
Cloning and expression of proteins fromMycobacterium smegmatis
Erik Mattsson
Degree project in biology, 2007Examensarbete i biologi, 30 hp, 2007Biology Education Centre and Department of Cell and Molecular Biology, Uppsala UniversitySupervisor: Dr. Mikael Nilsson

Content 1 Summary 2 2 Abbreviation list 3 3 Introduction 3 3.1 Mycobacterium tuberculosis 3 3.2 Rational approach to pathogen inhibitor discovery 5 3.3 Mycobacterium proteins that are possible drug targets 5 3.4 Protein purification using affinity chromatography 5 3.5 Aims of the project 6 4 Results 7 4.1 Identification of Mycobacterium smegmatis homologues 7 4.2 Amplification of M. smegmatis genes and addition of His-tag 9 4.3 Construction and cloning of expression plasmids 12 4.4 Analysis and manipulation of expression plasmids 13 4.5 Protein production 16 5 Discussion 17 6 Materials and methods 17 6.1 Bacteria and plasmids 17 6.2 Cloning 18 6.3 Growth media 19 6.4 Agarose gels and extracting DNA from them 19 6.5 Polymerase chain reactions 19 6.6 Plasmid preparation 22 6.7 Sequencing 23 6.8 Bioinformatics 23 7 Acknowledgements 24 8 References 25

2
1 Summary Tuberculosis is a mayor health threat that causes death to 1.6 million people each year. In an attempt to battle the disease I have focused on the extra ordinary thick and tough cell wall. However, experience from the work at the Department of Cell and Molecular Biology tells that working with genes and proteins from Mycobacterium tuberculosis (M. tuberculosis) could be a troublesome task. To avoid this, an alternative approach is to work with the gene homologues from Mycobacterium smegmatis (M. smegmatis). In this report three open reading frames (ORFs) in M. smegmatis were identified as homologous to the M. tuberculosis genes; Rv3782, Rv3790 and Rv3791. These ORFs were identified in M. smegmatis as Msmeg6329, Msmeg6344 and Msmeg6347. In M. tuberculosis these proteins are believed to be important for the cell membrane construction and therefore vital for the bacterial survival. New multi drug resistant (MDR) strains are developing in former Soviet Union countries. The antibiotic treatment is not completed and this creates a breeding ground for MDR-TB to develop. These proteins offer a chance to develop new drugs against tuberculosis (TB). The development of new drugs is essential in the struggle to stop the ravage of tuberculosis. The cloning of Msmeg6347 resulted in a plasmid with a correct insert. The production of protein however was not successful. The progress of Msmeg6344 went to the stage of colony polymerase chain reaction (PCR) where the result showed no success in ligating the gene into the vector. The cloning of Msmeg6329 gene failed at an early stage due to faulty primer designing and therefore was terminated.

3
2 Abbreviation list Amp Ampicillin bp base pair DMSO Dimethyl sulfoxide EtBr Ethidium bromide GC Guanin, Cytosin GOI Gene(s) of interest IMAC Immobilized metal ion affinity chromatography LB Luria Broth LMW Low molecular weight marker Min Minutes MDR-TB Multidrug resistant tuberculosis NIAID National Institute of Allergy and Infectious Diseases OD600 Optical density at 600 nm ORF Open reading frame PCR Polymerase Chain Reaction RAPID Rational Approaches to Pathogen Inhibitor Discovery RT Room Temperature SDS-PAGE Sodium Dodecyl Sulphate Polyacrylamide Gel Electrophoresis TAE (buffer) Tris Acetate EDTA TB Tuberculosis Tet Tetracycline Tm Temperature of melting WHO World Health Organization

4
3 Introduction 3.1 Mycobacterium tuberculosis The bacterium Mycobacterium tuberculosis is a pathogenic organism that is responsible for causing the disease tuberculosis (TB). The disease is one of the most deadly on the planet and is spread to one third of the world population [19]. The respiratory system is most commonly affected but also vascular, lymphatic, nerve and bone tissue as well as joints might be affected. Common symptoms are sustained cough, sometimes with blood, chest pain, fever and chill [13]. The disease is continuously spread by speaking, spitting and sneezing [22]. According to the World Health Organization (WHO) M. tuberculosis infects a new individual every second [22]. According to the United States National Institute of Allergy and Infectious Diseases (NIAID) some two billion people are believed to be infected with M. tuberculosis [14]. An infected host with a fully functional immune system can carry latent TB for a very long time. Not only the developing countries are heavily affected by TB, but also countries of the former Soviet Union have a growing problem [16]. In 2005 the disease killed approximately 1.6 million people [22]. An outbreak may occur when the immune system for some reason is weakened, for example by old age, malnutrition or other infections like HIV. Tuberculosis is the leading cause of death of HIV positive patients [22]. As a single infectious organism, M. tuberculosis, kills more adult people world wide than AIDS, malaria and tropical diseases combined [15]. The lethal combination of TB and HIV creates a huge problem for developing countries, especially in Africa, where AIDS is widely spread. However, an enlarging threat from multi-drug resistant strains of TB (MDR-TB) increases the problem significantly. Treatment of a MDR-TB infection is 1000 times more expensive than ordinary treatments, and less effective [21]. The treatment also has strong side effects, and even when treated, only 50% of the patients survive. Abuse of antibiotics and interrupted treatment are creating a breeding ground for MDR-TB laying a devastating future ahead. Countries from the former Soviet Union like the Baltic states Estonia, Latvia and Lithuania are regarded as hotspots for larger outbreaks of MDR-TB [22]. Mycobacterium tuberculosis is a rod-shaped, gram-positive, facultative aerobic bacterium that has some exceptional chemical properties due to its cell wall composition. Also the genome has a significantly high guanine and cytosine (GC) content, about 65.6% compared to E. coli that has about 50.8% [8]. It has a very long generation time of 15-20 hours [20] which makes it unsuitable to work with in vitro. The ability to produce a layer of mycolic acids, arabinogalactan and peptidoglycan creates a very strong cell wall. The polysaccharide-rich envelope resembles a capsule, giving M. tuberculosis a very strong defence against antibiotics and the host’s immune system. It even gives the ability to stay dormant and survive within the macrophages phagosomes [4]. Mycolic acids are complex large fatty acids with 60 to 90 carbon atoms [2]. A large number of functional groups are in general associated with mycolic acids, such as cyclopropane rings, epoxy esters, keto and methoxy groups. The low permeability provided by the mycolic acids contribute to the resistance to therapeutic agents [2]. Mycolic acids also result in the acid fastness or acid resistance of mycobacteria. Biological materials with this property form acid-

5
stable complexes with certain arylmethane dyes. Mineral or methanol acids do not decolorize them [4]. 3.2 Rational approach to pathogen inhibitor discovery The Rational Approach to Pathogen Inhibitor Discovery (RAPID) is an interdisciplinary approach to design drugs against pathogens used at the Departments of Computational Chemistry, Medical Chemistry and Structural Biology at the Uppsala University. Many different fields are involved such as computer science, organic chemistry and biotechnology. The intent is to shorten the time it takes to develop new drugs and thereby save money, limit suffering and mortality. By solving the three dimensional structure of essential proteins, the time to design inhibitors can be shortened. A computer is used to evaluate the chemical structure of potential inhibitors before testing them in vitro. The classical drug designing strategy starts off with a number of chemicals that are tested against certain targets. As a substance is discovered to be effective it enters a stage where it is chemically altered and re-screened again to find a more effective composition. The chemical alteration and synthesis is expensive and time consuming. This stage is iterated until an effective chemical is found. The next stage is animal testing. This approach is more of a trial and error approach, which is very costly and time consuming. In the end a lot of substances are cancelled due to toxic side effects. This makes pharmaceutical research a very expensive business. 3.3 Mycobacterium proteins that are possible drug targets Proteins produced by the open reading frames (ORFs) Rv3782, Rv3790 and Rv3791 in the M. tuberculosis are believed to be suitable drug targets because of their cell wall related function [11] [14]. There is evidence that the Rv3782 encoded protein is a glycosyltransferase that is involved in the first stage of galactan synthesis. Galactan is an important part of M. tuberculosis cell wall structure [11]. The proteins from the genes Rv3790 and Rv3791 are involved in epimerization and forming of the D-arabinofuranose, an also important part of the exceptional cell wall structure [10]. The inhibition of these enzymes may result in a much weakened bacterium that the immune system can eliminate. However, experience from work at the Department of Cell and Molecular Biology shows that working with M. tuberculosis, both genetic material and purification of protein have been troublesome. An alternative might therefore be to work with the closely related homologue proteins of M. smegmatis. The M. smegmatis genes are referred to as the genes of interest (GOI). 3.4 Protein purification using affinity chromatography Immobilized metal ion affinity chromatography (IMAC) is an affinity protein purification system that can be based on a polyhistidine sequence added to the recombinant protein. Six histidine residues known as a His-tag are added by the primer or are part of the vector. It can be added at the N-terminal or C-terminal end of the protein. The histidine has the property to bind to nickel or cobalt that has been immobilized on a gel matrix [12]. The recombinant His-tagged protein can be added directly to the affinity gel from a lysate. High purity can be

6
gained without big losses of recombinant protein due to the strong bond between the His-tag and the affinity matrix. 3.5 Aims of the project The aim of this project was to identify M. smegmatis homologues of the M. tuberculosis genes Rv3782, Rv3790 and Rv3791. Identified ORFs were then to be isolated by PCR and cloned using E. coli and finally heterologous expressed and purified by affinity chromatography. Purified protein homologues will be used for further analysis with x-ray crystallography.

7
4 Results 4.1 Identification of Mycobacterium smegmatis homologues Since the goal was to use the M. smegmatis protein homologues as a model system for the M. tuberculosis, the homologues ORF’s of M. smegmatis had to be identified. To identify the M. smegmatis homologues to the M. tuberculosis genes Rv3782, Rv3790 and Rv3791, a comparative analysis using the GenMycDB [3] server was performed. The comparative analysis resulted in several hit candidates. The E-value was used to find the candidate with highest sequence identity. The E-value represents the statistical likelihood that the matches between the two sequences are due to chance, the lower E-value, the higher sequence similarity. The sequences with the lowest E-value were chosen. According to the E-value, the comparative analysis showed that homologues to M. tuberculosis genes Rv3782, Rv3790 and Rv3791 were identified as Msmeg6329, Msmeg6344 and Msmeg6347 respectively. Both the DNA and the protein sequences were retrieved for the identified M. smegmatis homologues. In order to verify the sequence identity of the retrieved gene sequences from the comparative analysis a paired alignment of the translated ORFs were undertaken using ClustalW [6] [7] [ 9]. From the visual inspection of the alignments one could see that the Rv3790 and Rv3791 had a close to perfect match with Msmeg6344 and Msmeg6347 considering both amino acid sequence and length of the translated protein. It was found that the homologous proteins only differed in length with one amino acid. The alignment did not contain any inserts or gaps, see Figure 2 and 3. However, the Msmeg6329 (Rv3782) had a lower degree of sequence identity to its homologue. Inside the inserted sequence a stretch of five serine residues was also visible in the alignment. The residues were located in the middle and are shown in Figure 1. The alignments are important to establish the similarity between the M. tuberculosis genes and the M. smegmatis genes and the proteins produced by these genes. By aligning the protein sequences from M. tuberculosis and its equivalent in M. smegmatis it could be seen that the retrieved sequences indeed were homologous, and should be suitable as model proteins for the M. tuberculosis. Other important information for further manipulation of the genes such as sizes, weights and GC% content was obtained by utilizing web-based sequence analysis tools [18] and is summarized in Table 1 [8]. The gathered information on the Msmeg-gene sequences is important while designing oligonucleotide primers for PCR, and analysis of generated amplicons. Protein identity shows how many amino acids that are similar between the proteins.

8
Figure 1: Sequence alignment of Rv3782 and Msmeg6329 using ClustalW. In the consensus line the stars “*”
represents an amino acid identical to that in the compared sequences, while a “:” represents amino acids with similar properties and the “.” represents a less similar amino acid. The E-value, which represents the statistical likelihood that the matches between the two sequences are due to chance, is 0. The similarity between amino acids is graded and given a score where a high value represents high extent of conservation. In this alignment the score was 1818 which is considered as a high score.
Figure 2: Sequence alignment of Rv3790 and Msmeg6344 using ClustalW. The E-value was 0 and the score
2832. See legend to Figure 1 for further explanations.

9
Figure 3: Sequence alignment of Rv3791 and Msmeg6347 using ClustalW. The E-value was 0 and the score is
1371. See legend to Figure 1 for further explanations. Table 1: Data retrieved from bioinformatics analysisa
Gene b
Length (base pares)
GC c (%)
Sequence identity d
Protein length e (amino acids)
Protein MW f (g/mol)
Msmeg6329 (Rv3782) 909 67 77 % (232) 302 (304) 34040.9 MSmeg6344 (Rv3790) 1383 56 84 % (383) 460 (461) 50575.7 MSmeg6347 (Rv3791) 762 68 85 % (215) 253 (254) 27038.2 a Bioinformatics data for M. smegmatis open reading frames (ORF), and its M. tuberculosis homologues. b M. smegmatis ORF identified as homologous to M. tuberculosis gene. M.tb. ORF is presented in parenthesis. c Percentage of GC-content in ORF. d Percentage of amino acid sequence identity calculated by ClustalW analysis of the two identified homologous
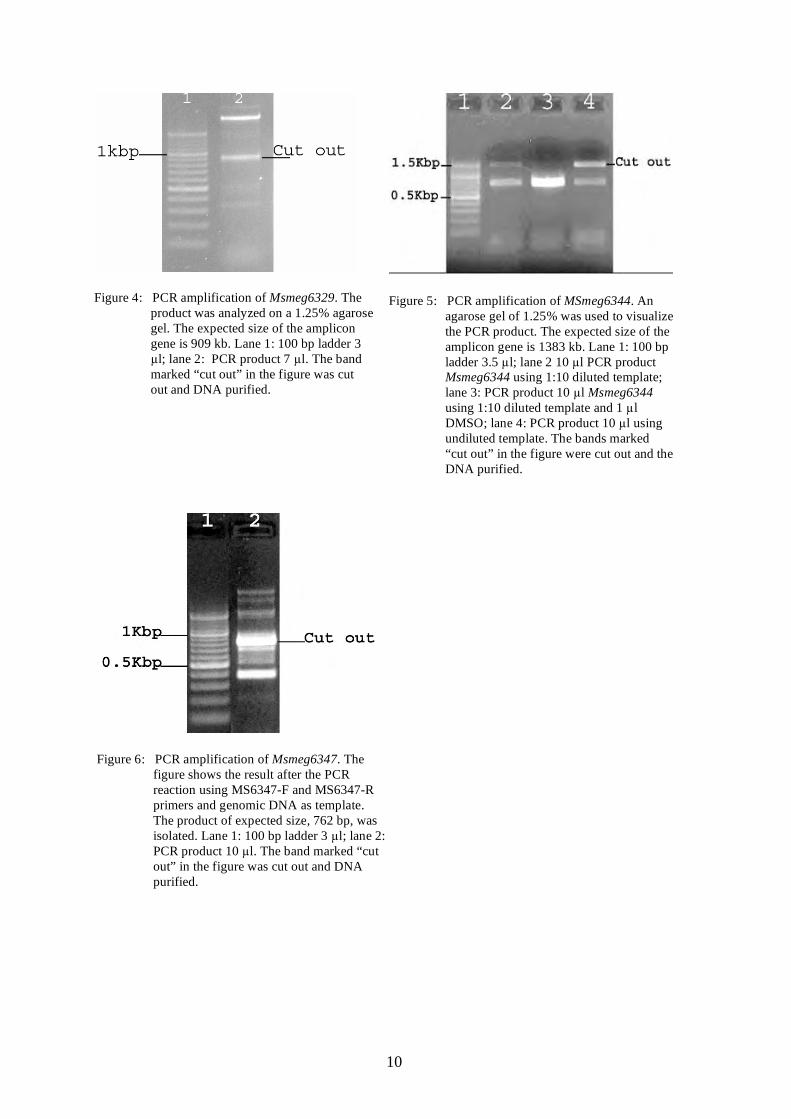
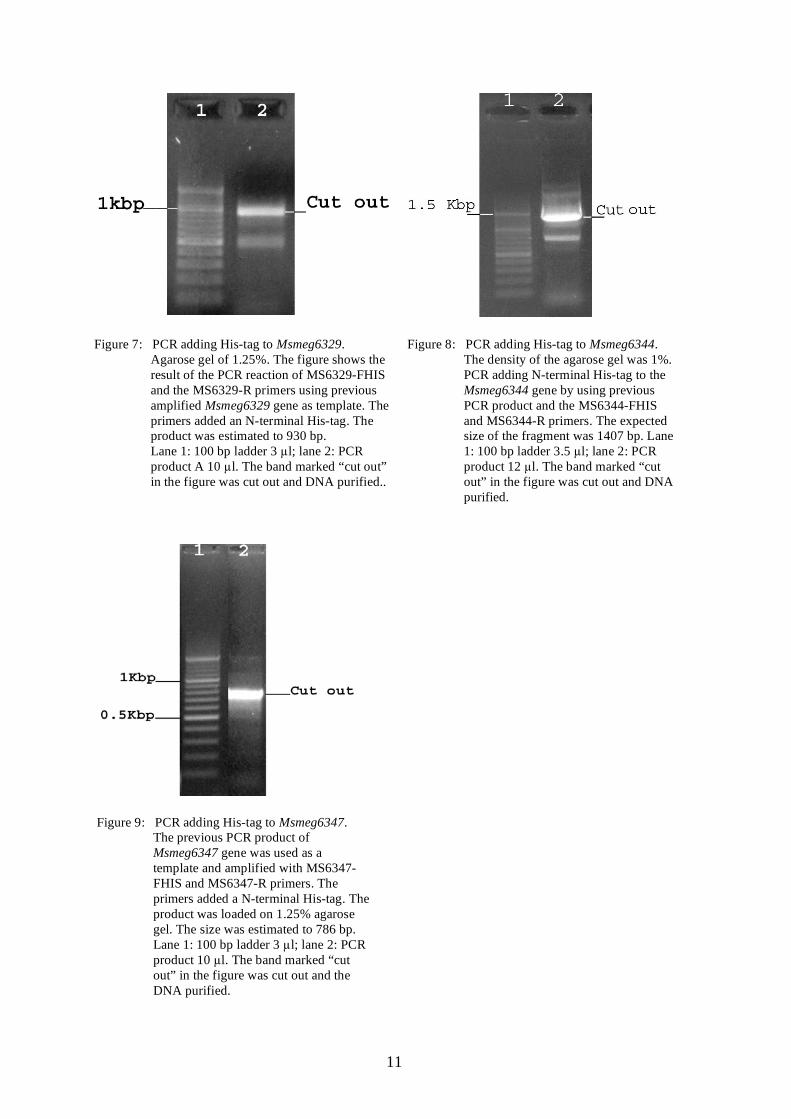
ORFs. Number in parenthesis represents the number of identical amino acids in the pared alignment analysis. e Number of amino acids in the ORF. Number in parenthesis represents the protein length for M.tb. homologue. f Calculated molecular weight based on amino acid sequence in ORF. 4.2 Amplification of M. smegmatis genes and addition of His-tag Polymerase chain reaction (PCR) was used to amplify Msmeg6329, Msmeg6344 and Msmeg6347 genes from genomic M. smegatis DNA also including an N-terminal His-tag. The His-tag was added in a separate PCR to lower the risk of unspecific primer binding due to the DNA-sequence coding for the 6 histidins. A mutation at the end of the genes was introduced by designing the primers to change a stop codon from TGA to TAA to increase its strength. Figures 4-6 show the primary amplifications and Figures 7-9 show the His-tag PCR results. Bands that are shown in the Figures, but not commented on, are to be regarded as artefacts or false products. The Figures also have a 100 kb ladder where 0.5, 1.0 or 1.5 kbp band is marked to simplify size estimation of the PCR products. Bands marked “cut out” in the Figures were cut out and the DNA purified.
10
Figure 4: PCR amplification of Msmeg6329. The
product was analyzed on a 1.25% agarose gel. The expected size of the amplicon gene is 909 kb. Lane 1: 100 bp ladder 3 µl; lane 2: PCR product 7 µl. The band marked “cut out” in the figure was cut out and DNA purified.
Figure 5: PCR amplification of MSmeg6344. An
agarose gel of 1.25% was used to visualize the PCR product. The expected size of the amplicon gene is 1383 kb. Lane 1: 100 bp ladder 3.5 µl; lane 2 10 µl PCR product Msmeg6344 using 1:10 diluted template; lane 3: PCR product 10 µl Msmeg6344 using 1:10 diluted template and 1 µl DMSO; lane 4: PCR product 10 µl using undiluted template. The bands marked “cut out” in the figure were cut out and the DNA purified.
Figure 6: PCR amplification of Msmeg6347. The
figure shows the result after the PCR reaction using MS6347-F and MS6347-R primers and genomic DNA as template. The product of expected size, 762 bp, was isolated. Lane 1: 100 bp ladder 3 µl; lane 2: PCR product 10 µl. The band marked “cut out” in the figure was cut out and DNA purified.
11
Figure 7: PCR adding His-tag to Msmeg6329.
Agarose gel of 1.25%. The figure shows the result of the PCR reaction of MS6329-FHIS and the MS6329-R primers using previous amplified Msmeg6329 gene as template. The primers added an N-terminal His-tag. The product was estimated to 930 bp.
Lane 1: 100 bp ladder 3 µl; lane 2: PCR product A 10 µl. The band marked “cut out” in the figure was cut out and DNA purified..
Figure 8: PCR adding His-tag to Msmeg6344.
The density of the agarose gel was 1%. PCR adding N-terminal His-tag to the Msmeg6344 gene by using previous PCR product and the MS6344-FHIS and MS6344-R primers. The expected size of the fragment was 1407 bp. Lane 1: 100 bp ladder 3.5 µl; lane 2: PCR product 12 µl. The band marked “cut out” in the figure was cut out and DNA purified.
Figure 9: PCR adding His-tag to Msmeg6347.
The previous PCR product of Msmeg6347 gene was used as a template and amplified with MS6347-FHIS and MS6347-R primers. The primers added a N-terminal His-tag. The product was loaded on 1.25% agarose gel. The size was estimated to 786 bp. Lane 1: 100 bp ladder 3 µl; lane 2: PCR product 10 µl. The band marked “cut out” in the figure was cut out and the DNA purified.

12
4.3 Construction and cloning of expression plasmids All the amplified and purified fragments with His-tag added, named His-Msmeg6329, His-Msmeg6344 and His-Msmeg6347, were elongated with an A at the 3’ end separately. The fragments were then ligated into the pEXP5/CT vector and transferred into E. coli top 10-F cells by heat shock. Transformed cells were spread onto LB-agar plates containing 100 µg ampicillin / ml. E. coli Top 10-F is a bacterium that is modified in the genes recA1 and endA1, which results in more stable plasmids, and it is therefore suitable for cloning plasmids to high concentrations that can easily be harvested. Bacterial colonies of E. coli Top 10-F cells, transformed with the pEXP5/CT vector carrying either Msmeg6329, Msmeg6344 or Msmeg6347 inserts were used as template in the colony PCRs. The usage of a vector primer and an insert primer will show if the insert has the correct orientation and therefore works as a screening process. Colony PCR reactions were used to verify each ORF respective insert and orientation. Figures 10 and 12 have brackets that mark PCR products that were regarded as genuine products and therefore coming from clones carrying vectors with a correct oriented insert in respect to the promotor. These clones were grown and used for plasmid harvesting. Figure 11 has no brackets which mean no correctly ligated plasmid was found.
Figure 10: Colony PCR of His-Msmeg6329 inserted in the pEXP5/CT vector. The reaction used MS6329-F and T7 Term universal primers. The PCR product was analyzed on a 1% agarose gel. Lane 1: ladder 3 µl; lane 2-7: 10 µl of PCR product using clones transformed with Msmeg6329 inserted in the vector. The brackets mark the colonies that were isolated and grown.

13
Figure 11: Colony PCR to establish correct His-Msmeg6344 gene insert
in the pEXP5/CT vector. The product formed is believed to be primer dimer artefacts from the Msmeg6344-FHIS and T7 Term universal primers. The PCR was analyzed on a 1% agarose gel. The expected size of the amplicon was around 1450 bp. Lane 1: 100 bp ladder 3.5 µl; lane 2-7: PCR product 10 µl.
Figure 12: Colony PCR using a cloned vector with His-Msmeg6347 insert
as template. The reaction used MS6347-F and T7 Term universal primers. The PCR product was analyzed on a 1% agarose gel. Lane 1: ladder 3 µl; lane 2-7: 10 µl of PCR product. The brackets mark the colonies that were isolated and grown.
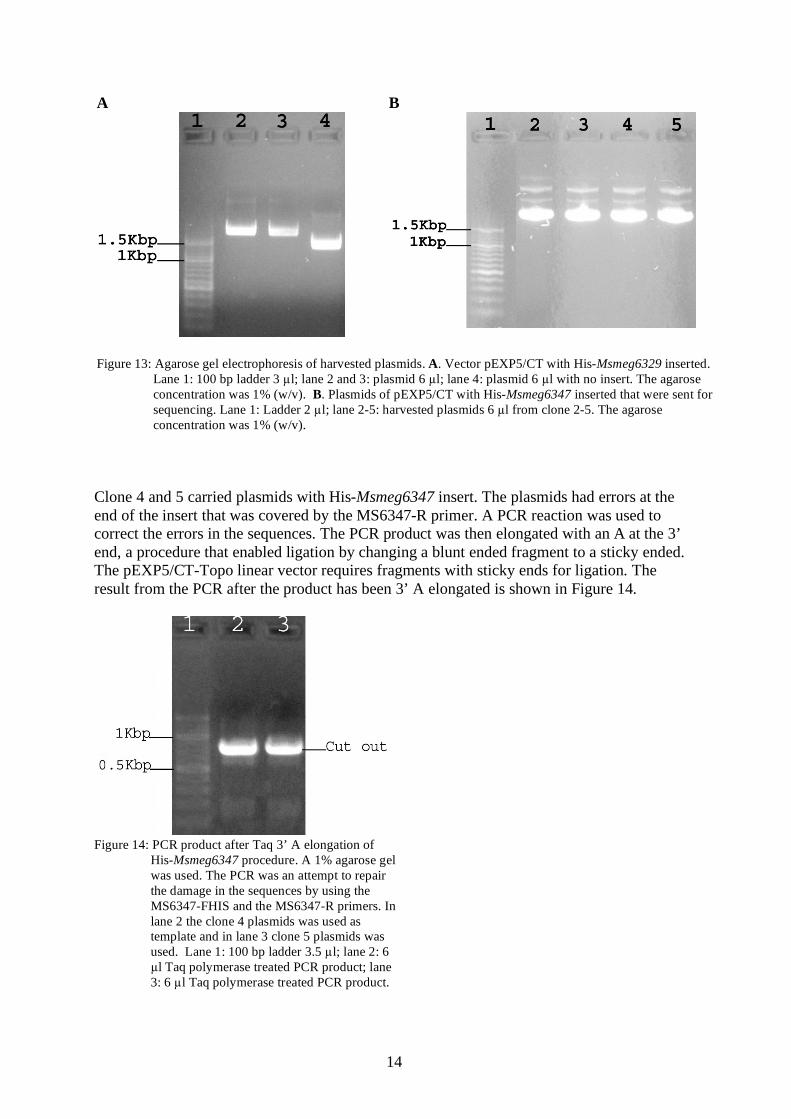
4.4 Analysis and manipulation of expression plasmids Colonies of E. coli Top 10-F cells that were positive were grown and the plasmids harvested. Figure 13A and B shows that the plasmid preparation was successful. The plasmid inserts were sequenced, and results aligned with the original sequence. The results showed that His-Msmeg6329 and the His-Msmeg6344 were not identical with the sequences retrieved from the database. The result of the His-Msmeg6347 showed that clone 5 and 6 only had small errors at the end of the sequence.
14
A
B
Figure 13: Agarose gel electrophoresis of harvested plasmids. A. Vector pEXP5/CT with His-Msmeg6329 inserted.
Lane 1: 100 bp ladder 3 µl; lane 2 and 3: plasmid 6 µl; lane 4: plasmid 6 µl with no insert. The agarose concentration was 1% (w/v). B. Plasmids of pEXP5/CT with His-Msmeg6347 inserted that were sent for sequencing. Lane 1: Ladder 2 µl; lane 2-5: harvested plasmids 6 µl from clone 2-5. The agarose concentration was 1% (w/v).
Clone 4 and 5 carried plasmids with His-Msmeg6347 insert. The plasmids had errors at the end of the insert that was covered by the MS6347-R primer. A PCR reaction was used to correct the errors in the sequences. The PCR product was then elongated with an A at the 3’ end, a procedure that enabled ligation by changing a blunt ended fragment to a sticky ended. The pEXP5/CT-Topo linear vector requires fragments with sticky ends for ligation. The result from the PCR after the product has been 3’ A elongated is shown in Figure 14.
Figure 14: PCR product after Taq 3’ A elongation of
His-Msmeg6347 procedure. A 1% agarose gel was used. The PCR was an attempt to repair the damage in the sequences by using the MS6347-FHIS and the MS6347-R primers. In lane 2 the clone 4 plasmids was used as template and in lane 3 clone 5 plasmids was used. Lane 1: 100 bp ladder 3.5 µl; lane 2: 6 µl Taq polymerase treated PCR product; lane 3: 6 µl Taq polymerase treated PCR product.

15
After the His-Msmeg6347 insert had been corrected it was ligated with pEXP5/CT and transformed into TOP 10-F cells. These colonies were screened using a colony PCR. The result is shown in Figure 15. The clone in lane 3 was cultivated and plasmids were harvested and sent for sequencing.
Figure 15: Screening of colonies performed. The colony
PCR of transformed Top 10-F cells was using the MS6347-FHIS and T7 term universal primers to establish the inserts orientation. A positive result was seen in lane 3. The gel has 1% density and was run at 100 V for 20 min. Lane 1: 100 bp ladder 3 µl; lane 2-6: PCR product 10µl mixed with 2 µl dye.
The result of the plasmid harvest is shown in Figure 16. The plasmids that were harvested were the new sequence corrected His-Msmeg6347 plasmids. These harvested plasmids were sent for sequencing to evaluate the sequence-restoring reaction. The new sequence was aligned with the original sequence and it showed that the insert now was correct and had the added N-terminal His-tag and mutated stop codon.
Figure 16: Evaluation of plasmid preparation kit
of sequence-corrected His-Msmeg6347 containing plasmids. The 1% agarose gel. Lane 1: 100 bp Ladder 3 µl; lane 2: plasmids 3µl.
16
4.5 Protein production In order to produce protein, the plasmids encoding the correct His-Msmegs6347 gene were used to transform E. coli BL21-AI cells. It resulted in colonies on an agar plate. However, they did not grow when transferred into a liquid medium.

17
5 Discussion The gene coding for the Msmeg6347 protein was correctly inserted in a pEXP5/CT vector. For unknown reasons the transformed BL21-AI did not grow after being transferred from an agar LB plate to liquid LB. The promotor for the inserted gene might have been leaking. If a toxic product was formed, that could explain the lack of growth. This was never investigated due to lack of time. There are other organisms or strains of E. coli that may be more suitable for production of protein then BL21-AI. The E.coli strain Rosetta-gami™ that can be purchased from Novagen could be an example. If the proteins were toxic to bacteria, yeast could be used for protein production. The Msmeg6344 gene was amplified but in the ligation step it did not insert correctly into the vector. Without a correct plasmid, no BL21-AI cells can be transformed and therefore the lack of protein production is obvious. The insert in the plasmid was never sequenced so it is impossible to tell if it was the correct gene that was amplified. This is unlikely due to the fact that it was later discovered that the primers contained errors. Another primer flaw was the Msmeg6329 primers that annealed at two sites within the gene. This became obvious when a purified product was used as template in a PCR reaction and the gel afterwards showed two bands. According to the size marker the top band corresponded to the Msmeg6329 gene but after sequencing the plasmid one could see that this was not the case. The appearance of two bands can be due to badly designed primers or an artefact due to the high GC content of the genome. The most reasonable explanation is probably a combination of both. Working with a high GC content gives not only PCR problems but also sequencing difficulties [17]. The result from the sequencing might show errors or deletions but this might not be true because high GC content in an area within a gene can cause artefacts. One way around this problem would be to use methods such as amino acid sequencing or liquid chromatography coupled with a mass spectrometer to establish that the correct product is produced.
18
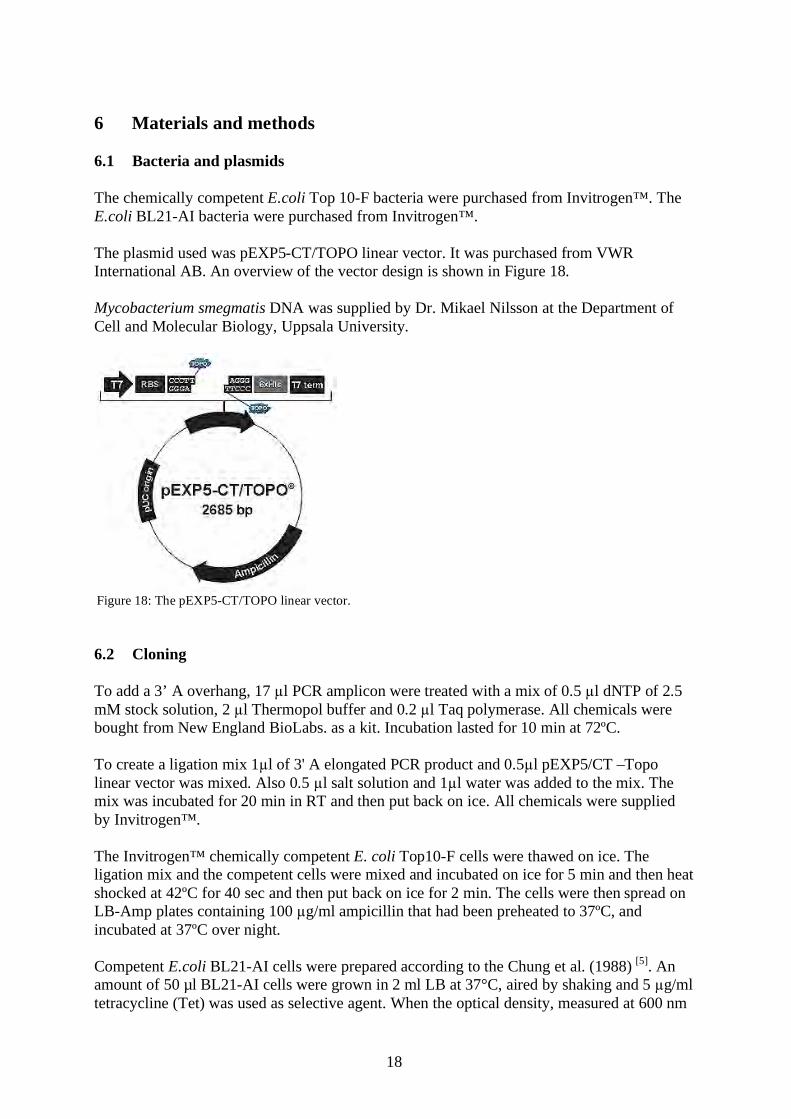
6 Materials and methods 6.1 Bacteria and plasmids The chemically competent E.coli Top 10-F bacteria were purchased from Invitrogen™. The E.coli BL21-AI bacteria were purchased from Invitrogen™. The plasmid used was pEXP5-CT/TOPO linear vector. It was purchased from VWR International AB. An overview of the vector design is shown in Figure 18. Mycobacterium smegmatis DNA was supplied by Dr. Mikael Nilsson at the Department of Cell and Molecular Biology, Uppsala University.
Figure 18: The pEXP5-CT/TOPO linear vector. 6.2 Cloning To add a 3’ A overhang, 17 µl PCR amplicon were treated with a mix of 0.5 µl dNTP of 2.5 mM stock solution, 2 µl Thermopol buffer and 0.2 µl Taq polymerase. All chemicals were bought from New England BioLabs. as a kit. Incubation lasted for 10 min at 72ºC. To create a ligation mix 1µl of 3' A elongated PCR product and 0.5µl pEXP5/CT –Topo linear vector was mixed. Also 0.5 µl salt solution and 1µl water was added to the mix. The mix was incubated for 20 min in RT and then put back on ice. All chemicals were supplied by Invitrogen™. The Invitrogen™ chemically competent E. coli Top10-F cells were thawed on ice. The ligation mix and the competent cells were mixed and incubated on ice for 5 min and then heat shocked at 42ºC for 40 sec and then put back on ice for 2 min. The cells were then spread on LB-Amp plates containing 100 µg/ml ampicillin that had been preheated to 37ºC, and incubated at 37ºC over night. Competent E.coli BL21-AI cells were prepared according to the Chung et al. (1988) [5]. An amount of 50 µl BL21-AI cells were grown in 2 ml LB at 37°C, aired by shaking and 5 µg/ml tetracycline (Tet) was used as selective agent. When the optical density, measured at 600 nm

19
(OD600), was in the range 0.4 to 0.7 the cells were harvested. The cells were centrifuged at 3000 g for 15 minutes at 4ºC. The supernatant was removed and the pellet resuspended in 2 ml TSE buffer. The composition of TSE buffer was 85 ml LB, 4.5 ml dimethyl sulfoxide, 10 g polyethylene glycol 4000, 10 mM MgCl2, 10 mM MgSO4, pH 6.1. The cells were incubated on ice for 20 minutes. 6.3 Growth media
Luria broth (LB) contained in one litre of liquid medium, 10 g tryptone, 5 g yeast extract and 10 g NaCl. LB agar plates also contained 12 g of agar per litre mixture. Ampicillin was added when needed to a final concentration of either 50 or 100 µg/ml. 6.4 Purification of DNA using agarose gel electrophoresis Agarose gels were prepared by dissolving agarose of BDH quality (VWR International AB) in 40 ml of 1 x TAE buffer. The concentration of agarose gel was varied between 1-1.25% (w/v). The gel was then melted by heating to boiling temperature using a microwave oven. After cooling the melted gel to approximately 50 ºC, 2.4 µl ethidium bromide (EtBr 5mg/ml) was added and the gel was cast into an electrophoresis cassette. Agarose gel electrophoresis was performed at 100 V for 20-30 min in 1 x TAE buffer. The TAE buffer contained 40 mM Tris, 20 mM acetic acid and 0.1 mM EDTA. The 6x loading dye contained 25 mg Brome phenol blue (0.25%), 25 mg xylene xyanol (0.25%), 4g sucrose (40%) and the volume was adjusted to 10 ml with H2O. The 100 kb ladder size marker was purchased from New England Biolabs. When isolation of bands was performed a QIAprep® Mini-M kit was utilized according to the manufactures manual. In some cases the cut out gel piece was frozen (-20°C) before purification. 6.5 Polymerase chain reactions The compositions of the PCR reactions are presented in Tables 2 to 7. In Table 2 the primary amplification of the genes is presented using the M. smegmatis genomic DNA as template. In Table 3 the reaction of adding His-tags is described. Table 4 shows the colony PCR reactions. In these reactions the template was added in form of bacteria by scraping with a pipette tip at the chosen colonies. Table 5 describe the sequencing restoring PCR. In Table 6 the primers are shown and in Table 7 the PCR programs are shown. The dNTP concentration was 2.5 mM (New England Biolabs) and pfu buffer supplied by the manufacturer was used accordingly provided manual (New England Biolabs). The pfu polymerase was purchased from New England Biolabs. The concentration of the primer solutions was 20 mM. All reactions were evaluated on agarose gels containing 0.3 µg EtBr/ml of gel.

20
Table 2: Gene amplification from genomic DNA. Msmeg6329 Msmeg6344 Msmeg6347 Genomic Msmeg DNA template 20 ng (1µl) 20 ng (1µl) 20 ng (1µl) dH2O 16 µl 16 µl 16 µl Pfu buffer (10x) 2.5 µl 2.5 µl 2.5 µl dNTP (2.5 mM) 2 µl 2 µl 2 µl Primer 1 (20 mM) 1.25 µl MS6329-F 1.5 µl MS6344-F 1.25 µl MS6347-F Primer 2 (20 mM) 1.25 µl MS6329-R 1.5 µl MS6344-R3 1.25 µl MS6347-R Pfu enzyme (10 U/µl) 1 µl 1 µl 1 µl PCR program a PCR-P1 PCR-P3 PCR-P1 Total volume 25 µl 25 µl 25 µl a The label PCR program is referring to PCR programs that are found in Table 7. Table 3: Addition of His-tag to amplified PCR product. Msmeg6329 Msmeg6344 Msmeg6347 PCR amplicon from previous reaction used as template a
Approx. 0.1 ng (1 µl) Approx. 0.1 ng (2 µl) Approx. 0.1 ng (1 µl)
dH2O 16 µl 15 µl 16 µl Pfu buffer (10x) 2.5 µl 2.5 µl 2.5 µl dNTP (2.5 mM) 2 µl 2 µl 2 µl Primer 1 (20 mM) 1.25 µl MS6329-HIS 1.5 µl MS6344-FHIS 1.25 MS6347-FHIS Primer 2 (20 mM) 1.25 µl MS6329-R 1.5 µl MS6344-R3 1.25 µl MS6347-R Pfu enzyme (10 U/µl) 1 µl 0.5 µl 1 µl PCR program b PCR-P2 PCR-P2 PCR-P4 Total volume 25 µl 25 µl 25 µl a In the Msmeg6329 reaction the template was diluted 1:100. b The label PCR program is referring to PCR programs that are found in Table 7. Table 4: Colony PCR Msmeg6329 Msmeg6344 Msmeg6347 Templatea Bacteria Bacteria Bacteria dH2O 16 µl 16 µl 16 µl Pfu buffer (10x) 2.5 µl 2.5 µl 2.5 µl dNTP (2.5 mM) 2 µl 2 µl 2 µl Primer 1 (20 mM) 1.25 µl MS6329-HIS 1.5 µl MS6344-FHIS 1.25 MS6347-FHIS Primer 2 (20 mM) 1.25 µl reverse T7 Term
universal 1.25 µl reverse T7 Term universal
1.25 µl reverse T7 Term universal
Pfu enzyme (10 U/µl) 1 µl 0.5 µl 1 µl PCR program b PCR-P2 PCR-P2 PCR-P4 Total volume 24 µl 23 µl 24 µl a The bacteria template was added by touching an E. coli Top 10-F colony using a sterile tip, then transferring the sample to the PCR reaction by pipetting up and down to mix the samples. b The label PCR program is referring to PCR programs that are found in Table 7.

21
Table 5: Sequencing correction PCR Msmeg6347 (clone 4) Msmeg6347 (clone 5) Plasmid template 25 ng (0.5 µl) 25 ng (0.5 µl) dH2O 16 µl 16 µl Pfu buffer (10x) 2.5 µl 2.5 µl dNTP (2.5 mM) 2 µl 2 µl Primer 1 (20 mM) 1.5 µl MS6347-FHIS 1.5 µl MS6347-FHIS Primer 2 (20 mM) 1.5 µl MS6347-R 1.5 µl MS6347-R Pfu enzyme (10 U/µl) 0.5 µl 0.5 µl PCR program a PCR-P3 PCR-P3 Total volume 25 µl 25 µl a The label PCR program is referring to PCR programs that are found in Table 7. Table 6: Primer sequences (5´to 3´) used for PCR or sequencing reactions Name Sequencea Tmb
MS6329-F ATGACGCACACTGAGGTCG 58 MS6329-R TTATCGCTGGAACCTTTCGGC 58 MS6329-FHIS ATGCATCACCATCACCATCACGGTACGCACACTGAGGTCGTC 58 MS6344-F ATGTCAACGACCGAGTTTCC 60 MS6344-R TTAGAGCAGTTGCAGGCGCCT 60 MS6344-FHIS ATGCATCACCATCACCATCACGGTTCAACGACCGAGTTTCCGAC 60 MS6347-F ATGTTCGACGCCGTAGGTAAC 62 MS6347-R TTAGATGGGGAGCTTGCGG 62 MS6347-FHIS ATGCATCACCATCACCATCACGGTTTCGACGCCGTAGGTAACC 62 MS6344-F2 ATGTCAACGACCGAGTTTCCGAC 70 MS6344-R2 CTAGAGCAGTTGCAGGCGCCTG 76 MS6344-R3 GCCTGTCAGAGCAGAGC 56 T7 forward TAATACGACTCACTATAGGG 56 T7 Term universal TATGCTAGTTATTGCTCAG 52
a The underlined regions denote the annealing part of the sequence of which the temperature of melting (Tm) was calculated. b Tm is a the temperature in degrees Celsius (°C) at which the primer was calculated to melt.

22
Table 7: PCR Programs. Name Number of cycles Temperature Time PCR-P1 1 94°C 2 min 2 94°C 2 min 60°C 1 min 72°C 2 min 94°C 2 min 60→55°C a 1 min
25
72°C 2 min 72°C 5 min
1 4°C ∞
PCR-P2 1 95°C 2min 2 95°C 2min 65°C 1min 72°C 2min 95°C 1min 65→56°C a 30sek
25
72°C 2min 72°C 5min
1 4°C ∞
PCR-P3 1 95°C 2min 2 95°C 1min 63°C 2min 72°C 1min 95°C 1min 63→50°C a 30sek
30
72°C 2min 72°C 5min
1 4°C ∞
PCR-P4 1 95°C 2min 95°C 2min 50°C 1min
29
72°C 2min 72°C 5min
1 4°C ∞
a The program is a touchdown program with a descending temperature starting from the higher value to end at the lower one. 6.6 Plasmid preparation Overnight cell cultures of E.coli TOP 10-F in 2 ml LB supplemented with 50 or 100 µg Amp/ml were used for plasmid preparation. Plasmids were purified using a QIAprep® Miniprep kit according to the manufacturer’s instructions. The DNA was eluted in 50 µl buffer supplied by the manufacture. Plasmid preparations were evaluated using agarose gel electrophoresis.
23
6.7 Sequencing Purified plasmids were sent to sequencing to the Uppsala Genome Center, Uppsala University. The samples sent consisted of 3 µl plasmid, 1.5 µl 1 mM T7 forward primer (Table 6) or 1.5 µl 1 mM µl T7-term universal primers (Table 6) and 1.5 µl H2O. The Uppsala Genome Center provided the sequencing results of the plasmids. Combinations of forward and reverse results to complete sequences were made of all inserts. These full sequences were aligned with the original sequence and compared. 6.8 Bioinformatics The gene sequences were retrieved from http://www.dbbm.fiocruz.br/GenoMycDB using Mycobacterium_tuberculosis_H37Rv as query and Mycobacterium_smagmatis_MC2 as hit. The retrieved sequences were then aligned using the ClustalW tool at http://www.ebi.ac.uk/clustalw/. The tools were used in their default settings. For retrieving the molecular weight the ExPASy tool protparam was used at http://www.expasy.ch/tools/protparam.html. Other information was found in TIGR CMD database. The database is located at http://cmr.tigr.org/tigr-scripts/CMR/shared/DnaMoleculeInformation.cgi

24
7 Acknowledgements I would like to thank Dr. Mikael “Nisse” Nilsson for supervising me in my research work and for giving me this opportunity. I also want to thank the rest of the Department of Cell and Molecular Biology for being so nice and friendly. I wish you all the best!
25
8 References [1] Barksdale, L. and Kim, K.-S. (1977) Mycobacterium. Bacteriological reviews, 4, 217-
372
[2] Brennan, P.J. and Nikaido, H. (1995) The envelope of mycobacteria. Rev. Biochem, 64, 29-63
[3] Catanho, M., Mascarenhas, D., Degrave, W. and de Miranda, A.B. (2006).
GenoMycDB: Database for Comparative Analysis of Mycobacterial Genes and Genomes. Genetics and Molecular Research, 5, 115-126.
[4] Cox, R.A. (2004) Quantitative relationships for specific growth rates and
macromolecular compositions of Mycobacterium tuberculosis, Streptomyces coelicolor A3(2) and Escherichia coli B/r: an integrative theoretical approach. Microbiology, 150, 1413-1426
[5] Chung, C.T. and Miller, R.H. (1988) A rapid and convenient method for the preparation and storage of bacterial competent cells. Nucleic Acids Res., 16, 3580
[6] European Bioinformatics Institute (The). URL: http://www.ebi.ac.uk/help/ClustalW_frame.html. Visited 27 September, 2006 [7] Higgins, D., Thompson, J., Gibson, T., Thompson, J.D., Higgins, D.G. and Gibson, T.J.
(1994) CLUSTAL W: improving the sensitivity of progressive multiple sequence alignment through sequence weighting, position-specific gap penalties and weight matrix choice. Nucleic Acids Research, 22, 4673-4680.
[8] Institute for Genomic Research (The). URL: http://cmr.tigr.org/tigr-
scripts/CMR/shared/DnaMoleculeInformation.cgi. Visited 27 September, 2006 [9] Lopez, R. and Lloyd, A. (1997) ClustalW WWW Service at the European
Bioinformatics Institute. URL: http://www.ebi.ac.uk/Tools/clustalw/ Visited 19 November 20, 2007.
[10] Mikušová, K., Huang, H., Yagi, T., Holsters, M., Vereecke, D., D'Haeze, W.,
Scherman, M.S., Brennan, P.J., McNeil, M.R., and Crick, D.C. (2005) Decaprenylphosphoryl Arabinofuranose, the Donor of the D-Arabinofuranosyl Residues of Mycobacterial Arabinan, Is Formed via a Two-Step Epimerization of Decaprenylphosphoryl Ribose. J. Bacteriol., 187, 8020–8025
[11] Mikušová, K., Beláňová, M., Korduláková, J., Honda, K., McNeil, M.R., Mahapatra, S., Crick, D.C. and Brennan, P.J. (2006) Identification of a Novel Galactosyl Transferase Involved in Biosynthesis of the Mycobacterial Cell Wall. J. Bacteriol., 188, 6592–6598

26
[12] Müller, K.M., Arndt, K.M., Bauer, K. and Plückthun, A. (1998) Tandem immobilized metal-ion affinity chromatography/immunoaffinity purification of His-tagged proteins--evaluation of two anti-His-tag monoclonal antibodies. Anal. Biochem., 259, 54-61
[13] National institute of Allergy and infectious diseases. URL: http://www3.niaid.nih.gov/topics/tuberculosis/Basics/symptoms.htm. Visited 27 September, 2006
[14] National institute of allergy and infectious diseases, National institute of health, U.S. department of health and human services. (2001) NIAID Global Health Research Plan for HIV/AIDS, Malaria, and Tuberculosis, May 2001. URL: www.niaid.nih.gov/publications/globalhealth/global.pdf. Visited 5 November, 2007.
[15] National Institute of Allergy and Infectious Diseases (NIAID). (1996) URL:
http://www3.niaid.nih.gov/news/newsreleases/1996/tbtip.htm. Visited 5 November, 2007.
[16] Rajendra, P. (2005) MDR TB: Current status. Indian Journal of Tuberculosis, 52, 121-131
[17] Sun, Y., Hegamyer, G. and Colburn, N. H. (1993) PCR-direct sequencing of a GC-rich region by inclusion of 10% DMSO: application to mouse c-jun. Biotechniques. 15, 372-374.
[18] Swiss Institute of Bioinformatics. The ExPASy (Expert Protein Analysis System). URL: http://www.expasy.org/cgi-bin/protparam. Visited 27 September, 2006
[19] Takayam,a K., Wang, C. and Besra, G.S. (2005) Pathway to Synthesis and Processing
of Mycolic Acids in Mycobacterium tuberculosis. Clin. Microbiol. Rev., 18, 81–101.
[20] Todar, K. (2005) Todar's Online Textbook of Bacteriology. University of Wisconsin Department of Bacteriology Madison, Wisconsin 53706 URL: http://textbookofbacteriology.net/tuberculosis.html. Visited 5 November 2007. [21] World Health Organization (WHO). New plan to contain drug-resistant TB. URL:
Http://www.who.int/mediacentre/news/releases/2007/pr32/en/index.html. Visited 22 June, 2007
[22] World Health Organization (WHO). Tuberculosis Fact sheet N°104 Global and
regional incidence. URL: http://www.who.int/mediacentre/factsheets/fs104/en/index.html. Visited 22 June, 2007.


![In Silico ADMETdownloads.hindawi.com/archive/2013/373516.pdfcompounds in M. smegmatis []andM. tuberculosis [ ]. e cell wall of Mycobacterium species is responsible for maintaining](https://static.fdocuments.us/doc/165x107/606580f27ef996353d0a5297/in-silico-compounds-in-m-smegmatis-andm-tuberculosis-e-cell-wall-of-mycobacterium.jpg)