
CLONAL DOMINANCE I. Restricted Nature of the IgM Antibody
17
CLONAL DOMINANCE I . Restricted Nature of the IgM Antibody Response to Group A Streptococcal Carbohydrate in Mice* BY DAVID E. BRILESt AND JOSEPH M . DAVIE (From the Departments of Pathology and Microbiology, Washington University School of Medicine, St . Louis, Missouri 63110) Immunization of experimental animals with streptococcal or pneumococcal vaccines often leads to the production of large amounts of homogeneous anti- bodies (1, 2) . While these immunoglobulins have proven useful in structural (3-5) and genetic studies (2-9), the immunologic mechanisms leading to their produc- tion remain unclear (2) . It is possible that large numbers of specific clones are stimulated initially, as with other antigens, but that immunologic (affinity) maturation (10,11) procedes to the extreme . In the case of the antibody response to hapten-coupled proteins, affinity maturation causes the bulk of the antibody produced late in the response to be made by a minority of the antihapten clones stimulated initially (12, 13) . A study by Kimball (14) suggested that affinity maturation may play a role in the production of restricted antibody to Type III pneumococcal carbohydrate . However, these results were unusual since individ- ual animals, upon intensive hyperimmunization over 9 mo, had several cycles of restricted responses, each antibody response of higher affinity than that in the previous cycle . We have re-examined the role of affinity maturation in the response to polysaccharides by measuring the avidity and specificity heterogeneity of early IgM antibodies in mice immunized with Group A streptococci . When A/J mice are hyperimmunized with this antigen they generally produce 10-30 mg/ml of anti-Group A carbohydrate (GAC)' antibody with markedly restricted heteroge- neity (7, 9, 15-18) . By examining the heterogeneity of antibody throughout a response to GAC, we hoped to gain insight into the mechanism leading to the extreme restriction seen late in the response . Our results indicate that IgM antibodies are restricted both early and late in the immune response to GAC and * This work was supported by U .S . Public Health Service grants AI-11635 and CA-16032 and by the following companies : Brown & Williamson Tobacco Corporation : Larus and Brother Company, Inc . ; Liggett & Myers, Incorporated ; Lorillard, a Division of Loews Threatres, Incorporated ; Philip Morris, Incorporated ; R . J. Reynolds Tobacco Company; United States Tobacco Company; and To- bacco Associates, Inc. $Supported by U.S . Public Health Service Postdoctoral Fellowship AI-00685 . `Abbreviations used in this paper : BSB, borate saline buffer ; Con A, concanavalin A; GAC Group A carbohydrate ; 2-ME, 2-mercaptoethanol ; 0-NAGlu, p-azophenyl-,B-N-acetylglucosa- minide ; PBS, phosphate-buffered saline ; PFC, plaque-forming cells . THE JOURNAL OF EXPERIMENTAL MEDICINE ' VOLUME 141, 1975 1291 on April 9, 2019 jem.rupress.org Downloaded from http://doi.org/10.1084/jem.141.6.1291 Published Online: 1 June, 1975 | Supp Info:
Transcript of CLONAL DOMINANCE I. Restricted Nature of the IgM Antibody

CLONAL DOMINANCE
I. Restricted Nature of the IgM Antibody Response to Group AStreptococcal Carbohydrate in Mice*
BY DAVID E. BRILESt AND JOSEPH M. DAVIE
(From the Departments of Pathology and Microbiology, Washington University School of Medicine,
St . Louis, Missouri 63110)
Immunization of experimental animals with streptococcal or pneumococcalvaccines often leads to the production of large amounts of homogeneous anti-bodies (1, 2) . While these immunoglobulins have proven useful in structural (3-5)and genetic studies (2-9), the immunologic mechanisms leading to their produc-tion remain unclear (2) . It is possible that large numbers of specific clones arestimulated initially, as with other antigens, but that immunologic (affinity)maturation (10,11) procedes to the extreme . In the case of the antibody responseto hapten-coupled proteins, affinity maturation causes the bulk of the antibodyproduced late in the response to be made by a minority of the antihapten clonesstimulated initially (12, 13) . A study by Kimball (14) suggested that affinitymaturation may play a role in the production of restricted antibody to Type IIIpneumococcal carbohydrate . However, these results were unusual since individ-ual animals, upon intensive hyperimmunization over 9 mo, had several cycles ofrestricted responses, each antibody response of higher affinity than that in theprevious cycle.We have re-examined the role of affinity maturation in the response to
polysaccharides by measuring the avidity and specificity heterogeneity of earlyIgM antibodies in mice immunized with Group A streptococci . When A/J miceare hyperimmunized with this antigen they generally produce 10-30 mg/ml ofanti-Group A carbohydrate (GAC)' antibody with markedly restricted heteroge-neity (7, 9, 15-18) . By examining the heterogeneity of antibody throughout aresponse to GAC, we hoped to gain insight into the mechanism leading to theextreme restriction seen late in the response . Our results indicate that IgMantibodies are restricted both early and late in the immune response to GAC and
* This work was supported by U.S . Public Health Service grants AI-11635 and CA-16032 and bythe following companies: Brown & Williamson Tobacco Corporation: Larus and Brother Company,Inc. ; Liggett & Myers, Incorporated ; Lorillard, a Division of Loews Threatres, Incorporated ; PhilipMorris, Incorporated ; R. J. Reynolds Tobacco Company; United States Tobacco Company; and To-bacco Associates, Inc.
$Supported by U.S . Public Health Service Postdoctoral Fellowship AI-00685 .`Abbreviations used in this paper: BSB, borate saline buffer ; Con A, concanavalin A; GAC
Group A carbohydrate ; 2-ME, 2-mercaptoethanol ; 0-NAGlu, p-azophenyl-,B-N-acetylglucosa-minide ; PBS, phosphate-buffered saline ; PFC, plaque-forming cells.
THE JOURNAL OF EXPERIMENTAL MEDICINE ' VOLUME 141, 1975
1291
on April 9, 2019jem.rupress.org Downloaded from http://doi.org/10.1084/jem.141.6.1291Published Online: 1 June, 1975 | Supp Info:
1292
RESTRICTED IgM ANTIBODY
suggest that clonal dominance in this system is not the result of affinity-drivencompetition for antigen .
Materials and MethodsMice . Female A/J, SWR/J, and BALB/cJ mice were obtained from Jackson Laboratories, Bar
Harbor, Maine. AKR mice were obtained from National Animal Laboratories, St . Louis, Mo . BSVSmice were bred in our colony from BSVS mice obtained from NIH, Bethesda, Md .
Immunization . Strain J174A Group A streptococci (a gift of Dr . R. C. Lancefield, The RockefellerUniversity, New York) was used to prepare Group A streptococcal vaccine (19) . The dose of vaccineinjected was expressed in terms of the gg ofrhamnose (20) contained in the cell wall of the bacterium(21) . The immunization schedule consisted of i.v . injections of vaccine containing 3, 10, 30, and 30 kgof rhamnose on days 0, 7, 14, and 49, respectively .
Primary immunization with sheep erythrocytes (SRBC) consisted ofa single i .v . injection of0.1 mlof 10% packed SRBC . Hyperimmune responses were obtained by boosting 2 wk later with an identicalinjection .
Radioimmunoassay of Anti-GAC Antibodies .
A modified Farr procedure was employed whichused 'H-labeled GAC (15) . GAC was isolated from whole lyophilized streptococci by extraction withformamidO (19) . The carbohydrate was deacetylated (22) and reacetylated with ['H ]acetic anhydride(23) . Antibody concentrations of test sera were determined by comparing the amount of ['H]GACbound by these sera as compared to standard sera whose antibody concentrations had beendetermined by quantitative precipitation (19) .
Preparation of Antigen- or Hapten-Coupled SRBC . SRBC were coated with GAC by amodification ofthe method of Pavlovskis and Slade (24) . GAC (50 mg) was reacted for 3 days at roomtemperature with 20 gl of palmitoyl chloride (Eastman Kodak Co ., Rochester, N. Y.) dissolved in 4 mldimethyl formamide and 0.6 ml of pyridine. The palmitoyl-GAC was precipitated and washed withacetone, and subsequently dissolved in 45 ml water. Optimal sensitization of SRBC was obtained byadding 133 ,u1 of the palmitoyl-GAC solution to 1.0 ml of packed SRBC in 8 ml of phosphate-bufferedsaline (PBS : 0.056 M Na,H PO,; 0.016 M KH,PO, ; 0.077 M NaCl ; pH 7.2). Cell were sensitized for 30min at 37 ° C, washed in PBS, and suspended in minimum essential medium (MEM, Grand IslandBiological Co ., Grand Island, N.Y .) . For avidity determinations, 1.0-ml portions of packed SRBCwere sensitized with 133, 66, 33, 13 and 7 j1 of palmitoyl-GAC solution as above to prepareGAC-SRBC preparations 1, 2, 3, 4 and 5, respectively .
p-Azophenyl-S-N-acetyl-glucosaminide (0-NAGlu)-coupled SRBC were prepared as follows : 18mmol p-diazonium-0-N-acetyl-glucosamine, prepared from p-nitrophenyl-,B-N-acetyl-glucosaminide(Mann Research, New York) (25) was added to 1.5 ml of 25% SRBC in borate saline buffer (BSB:0 .035M Na,B,O,, 0.08 M NaCl, pH 9.1) and stirred at room temperature for 30 min. The 0-NAGlu-SRBCwere washed and suspended in PBS.
Detection of Antibody-Secreting Cells .
Spleen cells were suspended in a final vol of 0.5 ml of0.56% agarose (Seakem, Rockland, Maine) in alpha-MEM (Flow Laboratories, Rockville, Md.) whichcontained 1 .5% sensitized SRBC . The suspension was poured on microscope slides which wereincubated sequentially for 1 h at 37°C and 1 h in the presence of 5% fresh frozen guinea pigcomplement in MEM . Indirect plaques were visualized either by adding 2% antimouse IgG sera to thecomplement solution or by incubating the slides for 1 h with 1% anti-IgG before incubation withcomplement . The antimouse IgG sera consisted of a mixture of goat anti-IgG, and anti-IgG, mousemyeloma proteins .
IgM plaques were blocked by adding an appropriate dilution of goat anti-ju antiserum to the cellsuspension in the agarose . Inhibition of plaques with concanavalin A (Con A, Grade III, SigmaChemical Co ., St . Louis, Mo.) (26) was performed by incubating the slides with variousconcentrations of Con A in MEM for 1 h at 37°C after an initial 1 h incubation at 37°C and before theincubation with complement and/or facilitating serum. Control slides, not exposed to Con A, wereincubated with MEM during this hour . Inhibition of IgM PFC with 2-mercaptoethanol (2-ME)(27, 28) was performed by incubating the slides with various concentrations of 2-ME in BSB for 1 hbefore exposure to complement . Control slides were incubated in BSB without 2-ME . The slides werethen washed several times in saline for 1 h before incubation with complement and/or facilitatingantiserum. Plaque diameters were measured, after fixation in 2% glutaraldehyde, under 63x

DAVID E . BRILES AND JOSEPH M. DAVIE
1293
magnification with a graticule that had been calibrated with a stage micrometer (E . Leitz, Wetzlar,Germany) .
Determination of Avidity. Relative avidity of antibody secreted by individual cells can beestimated either by inhibition of plaque formation with soluble hapten (12, 29) or, as in this study, byvarying the epitope density on the target erythrocyte (30) . Thus, high affinity antibody will lyse bothlightly and heavily conjugated erythrocytes, whereas low affinity antibody will only lyse heavilyconjugated cells. Each spleen cell suspension was plaqued using the five GAC-SRBC preparations, 1,2, 3, 4 and 5, which varied from high to low epitope density and normal SRBC . Anti-SRBCPFC weresubtracted from the number of PFC observed with the GAC-SRBC preparations . The fraction of themaximum number of anti-GAC PFC observed was calculated for each GAC-SRBC preparation . Therelative number of PFC in the avidity subgroups 1-2 (lowest avidity), 2-3, 3-4, 4-5, and 5-0 (highestavidity) was calculated by subtracting the relative number of PFC observed with the GAC-SRBCdesignated by the second number from the relative number of PFC observed with the GAC-SRBCdesignated by the first number. The relative number of PFC in subgroup 5-0 was the fraction of totalPFC observed with the lowest epitope density GAC-SRBC, preparation 5. In some cases, where themice were not plaqued against GAC-SRBC preparation 5, the highest avidity subgroup was 4-0. Acoefficient of restriction was calculated for each avidity subgroup profile using the formula
R=10 Sn - 4.47
whereR is the coefficient of restriction, S is the fraction of PFC in each of the five individual aviditysubgroups. The more unequal the distribution of PFC in the different subgroups, the more restrictedthe response and the higher the coefficient of restriction . The theoretical minimum and maximumofthis function are 0 and 5.53, respectively .
The average avidity of the PFC of an individual spleen or pool ofspleens can be calculated from thefollowing sum of products: average avidity =(S, x 1) + (S, x 2) + (S, x 3) + (S, x 4) + (SS x 5),where S,, S,, S, etc. are the fraction of PFC in avidity subgroups 1-2, 2-3, 3-4, 4-5, and 5-0, re-spectively .
Hemagglutination ofAnti-GAC Sera .
Antisera were titrated in twofold dilutions in 25 ul 1% fetalcalf serum using microtiter apparatus (Cooke Engineering Company, Alexandria, Va .) . 25 ,1 of 0.75%GAC-SRBC, preparation 2, were added to each antiserum dilution . 2-ME inhibition of IgM wasperformed by incubating the serum in 0.1 M 2-ME for I h before titration.
In Vivo Propagation of Antibody-Producing Cell Clones .
This procedure has been previouslydescribed (15) and is a modification of that used by Askonas et al . (31) .
ResultsKinetics of Anti-GAC Antibody Production .
Mice of strains A, AKR, SWR,BALB/c and BSVS produce greatly increased numbers of direct PFC afterimmunization with streptococcal Group A vaccine. Fig. 1 shows the kinetics ofthe direct PFC responses for strains A, AKR, and SWR. After three injections thenumber of PFC in all three strains rose above 1,000 PFC/106 spleen cells. In AKRmice approximately 1% of the nucleated spleen cells secreted anti-GAC antibodyafter the fourth injection . The larger numbers of PFC seen after injections 3 and4were not merely the result of the larger antigen doses, since the same dose givento unprimed mice gave responses of 231, 41, and 0.5 PFC/106 for strains A, AKR,and SWR, respectively .The relationship of these high direct PFC responses to serum antibody levels in
strain A mice is shown in Fig . 2 . It can be seen that assays which favor IgMantibody (direct PFC and ME-sensitive HA) and IgG antibody (ME-resistantHA and serum antigen-binding capacity) have similar kinetics . The average

1294
FIG. 1.
Kinetics of direct PFC response to GAC of strain A, AKR, and SWR mice . Arrowsindicate immunizations at days 0, 7, 14 and 48 with 0.1 ml of Group A vaccine adjusted tocontain 3, 10, 30, and 30 kg of rhamnose, a component of GAC. Each point and brackets are themean and standard error of values from 5 to 14 mice .
`104w
W101
102100
RESTRICTED IgM ANTIBODY
10f
-
101- fdal HA fife---- 2- ME rosisfonf HA fife
ID
0 8 16 24 32 40 48
DAYS
W56
" "64
FIG. 2.
Anti-GAC response of strain A mice immunized with Group A vaccine, as monitoredby PFC/10 6 spleen cells, serum HA titers and mg antibody/ml serum. The immunizationschedule was the same as in Fig. 1.
concentration of antibody increased to 1 mg/ml after the third immunization andto 10 mg/ml after the fourth injection . Studies with AKR and SWR mice showedsimilar concordance between PFC kinetics and serum antibody . Table I showsthe number of direct PFC/106 spleen cells and the concentration of serum

TABLE IComparison of PFC and Serum Antibody Produced by Five Strains of Mice upon
Immunization with Streptococcal Group A Vaccine
Days after injection III
DAVID E . BRILES AND JOSEPH M. DAVIE
Days after injection IV
1295
* Geometric mean of values obtained from 4 to 14 mice .$ Standard error term is the numberby which the geometric mean must be multiplied or divided to yield the upperand lower bounds of the standard error respectively.
anti-GAC antibody for five inbred strains at various time points in theimmunization sequence . Compared to the other four strains of mice, BSVS micefailed to show large numbers of direct PFC or serum antibody .
Class of Antibody Secreted by PFC .
Animals hyperimmunized with strep-tococcal vaccines characteristically produce high concentrations of IgG antibody(7, 9, 15-18) . However, indirect (facilitated) PFC were never observed in any ofthe mouse strains in numbers greater than 10% of the number of direct plaques,even after the fourth injection when large amounts of IgG antibody wereproduced. This is demonstrated in Table II where three hyperimmune A/J micewere examined 10 days after their fifth injection of Group A vaccine . In none ofthese mice were significant numbers of indirect plaques observed, in spite of thefact that the serum concentration of anti-GAC antibody ranged from 30-41mg/ml. The bulk of the antibody in the sera of these three mice was shown to beIgG after isolation and immunoelectrophoresis as described previously (7, 15).Since, in rabbits, Read and Braun (32) have shown that both IgM and IgGanti-GAC PFC are direct PFC, it was crucial to our studies to provide additionalcharacterization of the mouse direct PFC.There are three simple techniques which have been used to inhibit selectively
IgM PFC, anti-p, serum, Con A, and 2-ME . These three reagents were testedagainst four splenic PFC populations: direct (IgM) anti-SRBC PFC from mice 4days after primary immunization with SRBC, indirect (IgG) anti-SRBC PFCfrom mice hyperimmunized with two or three biweekly injections of SRBC, directanti-GAC PFC 4 days after primary immunization with streptococcal vaccine,and direct PFC from GAC hyperimmune mice 10-15 days after the fourthimmunization . By all criteria, the anti-GAC PFC are IgM (Fig . 3) . Thus, boththe anti-GAC and the anti-SRBC direct PFC were completely inhibited at 0.014M 2-ME, while indirect anti-SRBC were only slightly affected . Similarly, theCon A and anti-la serum both inhibited the anti-GAC and direct anti-SRBC PFCat much lower concentrations than were required to inhibit indirect anti-SRBCPFC. Fig. 3 B and C also illustrate the fact that 4-day primary andhyperimmuneanti-GAC PFC gave inhibition curves that did not differ significantly from eachother . The data in Fig . 3 were all derived from strain A mice . Results with AKR
Mousestrain
4
GACPFC/106
Anti-GAC
mg/ml
GACPFC/10 6
12
Anti-GAC
mg/ml
4
GACPFC/10'
Anti-GAC
mglml
GACPFC/10 6
12
Anti-GAC
mg/mlA 2,250* (1 .4)$ 0 .213 (1.6) 270 (2 .3) 1 .09 (3 .1) 1,850(1 .3) i .38(1 .2) 2,040(1 .2) 11 .30(1 .2)AKR 1,980 (1 .5) 235(l .6) 0 .92(l .2) 16,800(l .3) 0 .51(l .2) 980(l .8) 10 .00(1 .8)SWR 351 (1 .5) 79 (3 .7) 0.28 (1 .6) 5,300 (2 .7) 0.45 (1 .8) 1,700(l .6) 5 .10 (1 .2)BALB/c 1,900 (1 .4) 1,086(l .5) 1 .84(l .6)BSVS 63 (1 .6) 39(3 .6) 0.03(l .3)

1296
RESTRICTED IgM ANTIBODY
TABLE IIDirect and Indirect Anti-GAC PFC Responses of Three Mice Hvperimmunized with
Group A Vaccine*
10
0.8
0.6
0.4
0.2
1 .0
0.8
0.6
04
0.2
-
a........... .4... .... ....0. ....... .. .a
anti-k serum . See text for immunization details .
* Mice were injected i.v . with doses of vaccine containing 3, 10, 30, 30, and 30 lag of rhamnose, as aconstituent of the GAC in the cell wall, on days 0, 7, 14, 49, and 110, respectively, and bled 12 daysafter the last injection .
A
o.~a... . .. .. .
anti-SRBC direct 4 day primary
anti-SRBC indirect hyperimmune
anti-GAC direct 4 day primary
anti-GAC direct hyperimmune
FIG. 3 .
Inhibition of anti-GAC and anti-SRBC PFC in strain A mice by 2-ME, Con-A, and
and SWR mice were essentially identical, which indicates that the PFC in thesemice similarly secreted IgM anti-GAC antibody .Avidity Restriction of IgM PFC. The relative avidities of anti-GAC IgM
antibodies produced by different populations of PFC have been compared byplaquing spleen cells from individual mice against SRBC coated with various
Mouse Anti-GAC Direct anti-GACPFC/108
Indirect anti-GACPFC/10 8
Indirect/Direct
mg/ml1 30 2,860 128 0.042 41 1,030 62 0.063 35 960 96 0.10
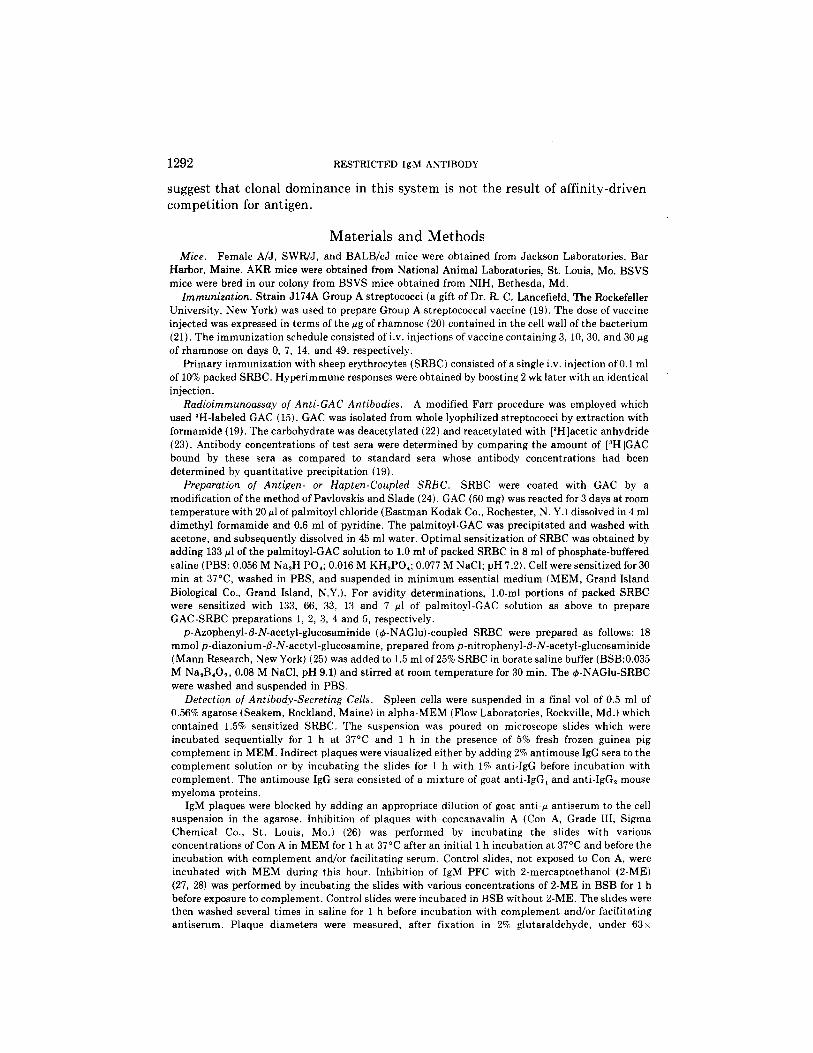
amounts of GAC . Avidity comparisons are possible since both high and lowavidity anti-GAC antibodies would be expected to plaque GAC-SRBC coatedwith a high density of GAC, whereas only the high avidity antibodies would beexpected to form plaques in SRBC coated with a low density of GAC . This pointis illustrated in Fig . 4 which shows the avidity data for the anti-GAC response oftwo AKR mice . In Fig . 4 A the relative number of PFC for each ofthe GAC-SRBCpreparations is plotted . The PFC population depicted by the solid line has cellswhich produce relatively high avidity antibody since almost 60% as many PFCwere observed with the GAC-SRBC bearing the lowest density of GAC as with
a0 o.s
Wm 0.6
2j 04
aW 02
A
DAVID E . BRILES AND JOSEPH M. DAVIE
1297
B
1 2 3 4 5 172 2-3 3-4 4-5 5-0CELL PREPARATIONS
AVIDITY SUBGROUPS(LOW)
(HIGH)
0.6
0 .5
0.4Wm
032W
02
W0 .1
FIG. 4.
(A). Relative number of anti-GAC PFC obtained using GAC-SRBC preparations 1-5with immune spleen cells from two AKR mice . GAC-SRBC preparations 1, 2, 3, 4, and 5 arecoated with decreasing amounts of GAC . (B) . Avidity subgroups calculated from the data inFig. 4 A, for the PFCof the two AKRmice . The subgroups are of increasing avidity going from1-2 to 5-0.
the SRBC bearing the highest density GAC . On the other hand, the cellpopulation producing low avidity anti-GAC IgM (dashed line) produced almostno plaques with the lowest epitope density GAC-SRBC . The differences inavidity of the PFC of these two mice is made even more clear by plotting the datain terms of avidity subgroups, where the number of additional PFC visualized byeach successively higher density of GAC on the SRBC are expressed as a fractionof the total number of PFC (Fig . 4 B) . This treatment of the data subdivides thetotal PFC population from a given spleen into five subgroups based on theiravidities . The average avidity for each spleen (see methods) are 4.4 and 2 .4 forthe high and low avidity spleens, respectively .
Fig . 5 shows the avidity subgroup profiles for 16 strain A mice which had beenimmunized for different time intervals . It is apparent from the shape of thecurves and from the coefficient of restriction (see methods) that the IgManti-GAC responses of most of the individual mice show restricted heterogeneityof their avidities . For example, the lowest avidity subgroup, 1-2, contains over

1298
NUMBEROF
IMMUNIZATIONS
3
4
AVIDITY SUBGROUPS OF 16INDIVIDUAL STRAIN A MICE
3T
2.81 .5
12
2.60.5
RESTRICTED IgM ANTIBODY
13
2.606
2.3 ::AVIDITYf08 RESTRICTION
N9
14
2.72.0
POOLED IMMUNE SPLEEN
2.62.0
CELLS FROM MICE 3 - 16am 0.3I
Z 2 0 .2
a O .IW2
AVIDITY 2.7 27RESTRICTION 0.6 0.7
15Tr
10
3.317
0 1 I I
1 -2 2-3 3-4 4-0AVIDITYSUBGROUPS
(LOW) (HIGH)
OUsNY"A Theory
FiG. 5. Avidity subgroups for 16 strain A mice 4 days after the 1st, 2nd, 3rd, and 4thimmunizations with streptococcal Group A vaccine. Average avidities and coefficients ofrestriction are given for each curve. Also shown are the avidity subgroups for a pool of immunespleen cells from mice 3-16 .
30% of the PFC from mice 1,2,5,7, 10, and 11 but none of the PFC from mice 3, 15and 16 . Likewise, avidity subgroup 2-3 comprises over 30% of the PFC response ofmice 3 and 6, but none of the response in mice 1, 5, 8, and 9. Subgroup 3-4 whichis a major subgroup of about two thirds of these mice comprised none of theresponse of mouse 10 and was less than 10% of the response of mouse 14 . Similarcontrasts can be made for subgroup 4-0.
Avidity differences obtained by this method were shown to be reproducible bymixing spleen cells with different avidities to obtain mixtures that possessed amore heterogeneous distribution of PFC . An example of this type of analysis isseen in Fig. 5, wherethe predicted and observed avidity intervals are plotted for apool of anti-GAC spleen cells from 14 mice (mice 3-16) . The coefficient ofrestriction has been calculated for the pool as well as for the mice making up thepool . These values along with average avidities are given along side each profile.The greater heterogeneity of PFC avidity for the pool as compared to that for theindividual mice is apparent from a comparison of the shapes of the aviditysubgroup profiles as well as a comparison of the coefficients of restriction for thePFC pool and the individual mice . It can be seen that the theoretical values forthe pool compare favorably with the observed values .

A second demonstration of the reliability of the avidity assay involved thetransfer of immune spleen cells to sublethally irradiated recipients . If the avidityassay were accurately measuring avidity we would expect all of the recipientsfrom a given donor's immune spleen cells to produce PFC with similar avidities .In the experiment depicted in Fig. 6 spleen cells from two donor mice wereinjected i.v . into four sublethally irradiated recipients . Each recipient wasimmunized and assayed 4 days later . It is clear that the avidity profiles within agroup of recipients are indistinguishable .
It has been suggested (33) that the rate of antibody secretion could seriouslyinfluence the apparent avidity measurements using plaque assays, so that cellssecreting large amounts of antibody may be difficult to inhibit, regardless of the
Vt 0.30
0.5
0.4
0 . 2~
0
-0 .1
DAVID E . BRILES AND JOSEPH M. DAVIE
1299
Donor 3
1-2 2-3 3-4 4-0
1-2 2-3 3-4 4-0Avidity Subgroups
FIG. 6.
Avidity subgroups of recipients of immune spleen cells from two strain A donor miceharvested 10 days after hyperimmunization with four injections of Group A vaccine (seeMaterials and Methods) . Recipient strain Amice were given 500 rads X-radiation 1 day beforecell transfer . The spleens of the recipient mice were plaqued 4 days after injection with anamount of Group A vaccine containing 30 ug of rhamnose . The recipients of donor 1 producedno more than background PFC.
avidity of the antibody . We therefore measured the plaque sizes in several of themice producing restricted anti-GAC PFC (Fig . 7) . The data shown were obtainedwith strain A mice ; essentially identical findings were obtained with SWR mice .Plaque size was found to vary inversely with average avidity . These resultsindicate that in general the avidity differences described were not due to differentaverage rates of immunoglobulin secretion from PFC of different mice, since, byour assay, "high" avidity antibody producers make small PFC as expected (28) .One possible exception was the PFC depicted in the lower left of Fig. 7 . Theplaques of this mouse were unusual in that they showed incomplete lysis andwere present only at the highest epitope densities . These rare PFC may representclones producing less than the usual amounts of antibody per cell .
Specificity Restriction of IgM PFC.
Restriction in the heterogeneity of IgM

1300
RESTRICTED IgM ANTIBODY
320
Z2 280
W
O 240
W0 220QJ
180
160 '
~ '
'2.0 22 2.4 2.6 28 3.0 32 3.4 3.6 38
AVERAGE AVIDITY
FIG. 7 .
Comparison of average plaque diameter and average avidity of anti-GAC PFCfrom 10AM mice immunized with Group A streptococcal vaccine. The correlation coefficient of theplaque diameter with average avidity for all 10 mice is -0.42. If the point at the lower left isomitted from the calculation, the correlation coefficient is -0.83. These two correlationcoefficients are statistically different from zero at 10% and 1%, respectively .
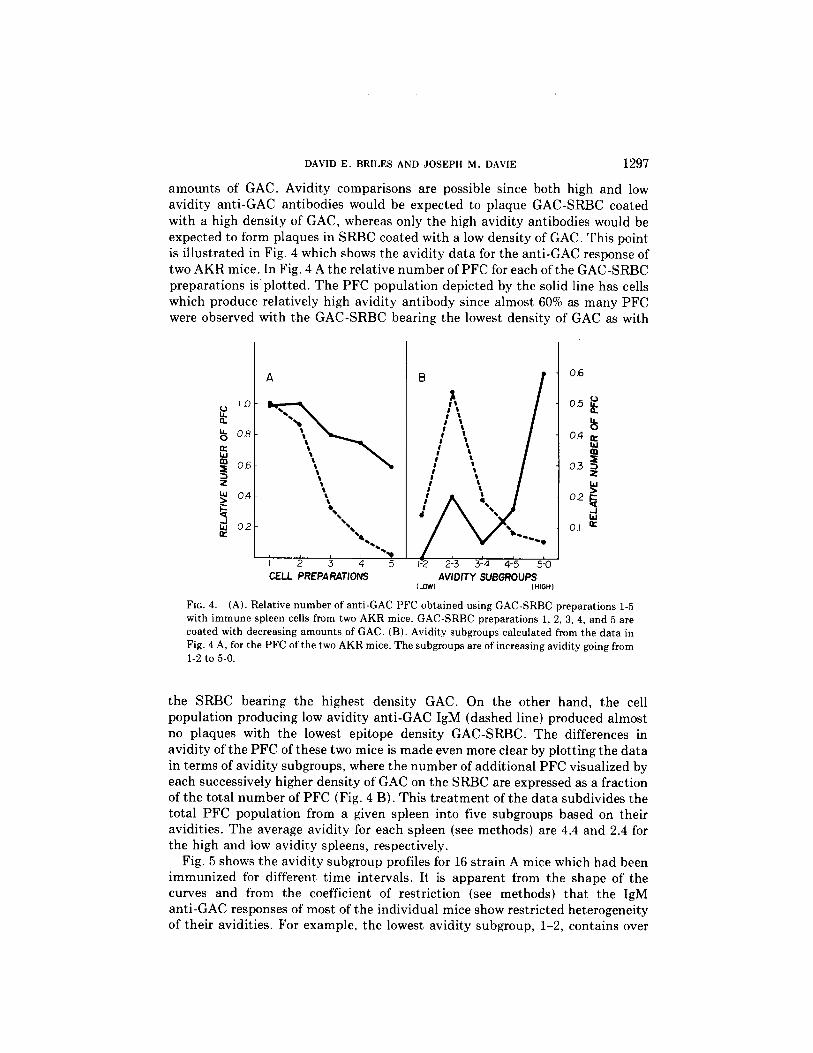
anti-GAC antibodies was also demonstrated by plaquing the spleens of miceimmunized with Group A vaccine against SRBC coated with O-NAGlu, ahaptenic determinant which cross-reacts to varying degrees with anti-GACantibodies (34) . The results for 13 A/J mice at three stages in the immunizationschedule are given in Table III. In 10 of these mice, less that 33% of anti-GACantibody-secreting cells formed plaques with O-NAGlu-SRBC. In three mice 49,66, and 96% of the anti-GAC cells formed plaques on O-NAGlu-SRBC . This resultis not a reflection of the avidity of the antibody for GAC (Table 111), but probablyrepresents variability among the immunodominant determinants detected bydifferent anti-GAC antibodies .
Kinetics of Avidity Restriction .
In all five strains of mice tested restriction inthe heterogeneity of avidity was seen, even in the earliest anti-GAC responses(Fig . 5) . The lack of increase in restriction or avidity of the IgM response withtime is illustrated in detail for strain A in Fig. 8, where the average coefficients ofrestriction and average avidities are measured throughout the course of immuni-zation . No significant changes were seen in this strain or with other strainsexamined . Average coefficients of restriction and avidities for the five mousestrains are shown in TableIV . While all strains produced about equally restrictedIgM antibodies, significant differences exist between strains with respect to theaverage avidities of the antibodies . Thus, BSVS and SWR mice producesignificantly higher avidity IgM antibody than do strainsA or AKR (P < 0.001) .
Discussion
The usefulness of the plaque assay in the evaluation of the relative avidity andspecificity of an antibody response is apparent. In addition to the obvious ease
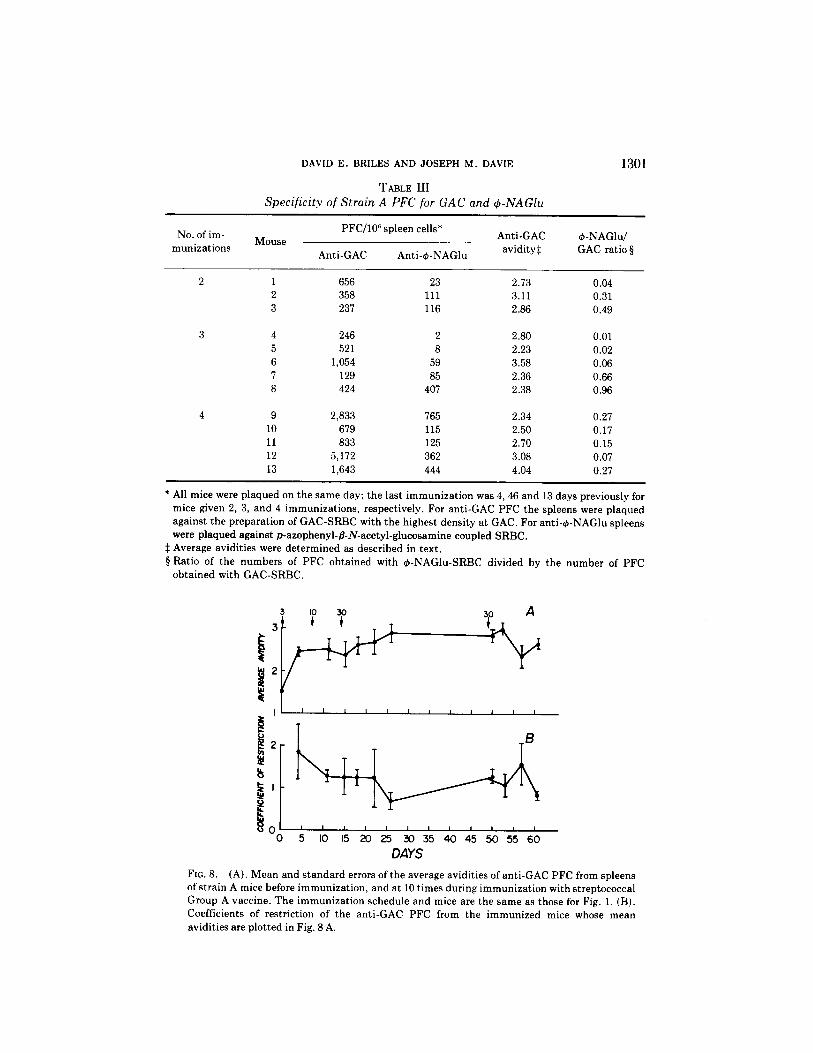
TABLE IIISpecificity of Strain A PFC for GAC and O-NAGlu
DAVID E. BRILES AND JOSEPH M. DAVIE
1301
* All mice were plaqued on the same day; the last immunization was 4, 46 and 13 days previously formice given 2, 3, and 4 immunizations, respectively . For anti-GAC PFC the spleens were plaquedagainst the preparation of GAC-SRBC with the highest density at GAC. For anti-o-NAGlu spleenswere plaqued against p-azophenyl-,B-N-acetyl-glucosamine coupled SRBC .
$ Average avidities were determined as described in text .§ Ratio of the numbers of PFC obtained with o-NAGlu-SRBC divided by the number of PFCobtained with GAC-SRBC .
u
DAYS
I
1
0
1
1 1
1
1
1
0 5 10 15 20 25 30 35 40 45 50 55 60
FIG. 8.
(A) . Mean and standard errors ofthe average avidities of anti-GAC PFCfrom spleensof strain A mice before immunization, and at 10 times during immunization with streptococcalGroup A vaccine. The immunization schedule and mice are the same as those for Fig. 1 . (B).Coefficients of restriction of the anti-GAC PFC from the immunized mice whose meanavidities are plotted in Fig. 8A.
No . of im-munizations
MousePFC/108
Anti-GAC
spleen cells*
Anti-0-NAGlu
Anti-GACavidity$
0-NAGlu/GAC ratio §
2 1 656 23 2.73 0.042 358 111 3.11 0.313 237 116 2.86 0.49
3 4 246 2 2.80 0.015 521 8 2.23 0.026 1,054 59 3.58 0.067 129 85 2.36 0.668 424 407 2.38 0.96
4 9 2,833 765 2.34 0.2710 679 115 2.50 0.1711 833 125 2.70 0.1512 5,172 362 3.08 0.0713 1,643 444 4.04 0.27

1302 RESTRICTED IgM ANTIBODY
TABLE IVAverage Avidity and Coefficient ofRestriction ofDirect Anti-GAC
PFC from Five Inbred Mouse Strains
* P values by Student's t test for avidity average comparisons :BSVS vs . AKR,
<0.001BSVS vs . SWR,
<0.1SWR vs . AKR,
<0.001SWR vs . A,
<0.001SWR vs . BALB/c,
<0.4BALB/c vs . AKR,
<0.05
and speed that the method offers, it is possible to characterize antibody responsesbefore significant serum concentrations of antibody are achieved . At the sametime, the present study demonstrates an obvious deficiency of the plaquetechnique, i .e ., a dependence on the hemolytic capacity of an antibody . Thus,animals which possessed greater than 10 mg/ml of specific IgG anti-GACantibody had insignificant numbers of IgG PFC, regardless of epitope density onthe red cells, facilitating sera, etc . It is probable that this was due to the lowaffinity of the IgG antibody, because isoelectric focusing of the serum antibody,which concentrated the antibody to higher levels than achieved around a singleantibody-secreting cell, resulted in the hemolysis of GAC-SRBC . 2 On the otherhand, it is theoretically possible that cells secreting very high affinity antibodywill not be detected as PFC since plaque size, as shown here, is inverselyproportional to the avidity of the antibody secreted . Thus, it is likely that afraction of total IgG and possibly IgM-secreting cells are ignored in the analysis ofthe PFC response to most antigens .
Since the pioneering studies of Kunkel, Kabat, and colleagues with human antipolysac-charide antibodies it has been clear that polysaccharides often elicit antibodies withunusually restricted heterogeneity (35-37) . In addition, hyperimmunization with polysac-charide-containing bacterial vaccines often leads to massive amounts of these restrictedantibodies (1, 2) . The studies reported here extend these findings by demonstrating thatmice which are producing large amounts of relatively homogeneous IgG antibody also areproducing large amounts of restricted IgM antibody . For example, in AKR micehyperimmune to GAC, approximately 1% of nucleated spleen cells secrete IgM antibody .Of the five strains of mice tested, only BSVS mice failed to produce large amounts ofeither IgM or IgG antibody (18) . It is interesting that the IgM antibodies produced byBSVS are the highest in average avidity of the strains tested .
2Brifes, D. and J. Davie. Detection of isoelectric focused antibody by autoradiography andhemolysis of antigen-coated erythrocytes. A comparison of methods. Manuscript submitted for pub-lication .
Mouse strain No . ofMice Avidity Coefficient ofrestriction
BSVS 9 3.57 t 0.25 1.91 f 0.24SWR 28 3.15t0.10 1.38t0.14BALB/c 10 2.91 t 0.20 1 .10 t 0.24A 43 2.68t0.09 1.15t0.10AKR 39 2.59 t 0.07 1.34 t 0.12

DAVID E . BRILES AND JOSEPH M. DAVIE
1303
Multiple hypotheses (2, 14, 38) have been advanced to account for the large amounts ofrestricted antipolysaccharide antibody, but none is totally satisfactory . In some an-tipolysaccharide responses, such as that of mice to the phosphorylcholine moiety ofpneumococcal C carbohydrate, all mice within an inbred strain make antibodies with thesame binding site specificity and the same idiotype (39, 40) . In this case, it is clear thatmice have a genetically limited repertoire of precursor cells with specificity forphosphorylcholine (41, 42) . With other restricted antipolysaccharide antibody responses,such an explanation will not suffice . For example, in the immune response to streptococcalgroup or pneumococcal type carbohydrates, where continued immunization with bacterialvaccines leads to the production of large amounts of restricted IgG, antipolysaccharideantibodies, it has been shown that individual animals (1, 2) or inbred lines' are capable ofproducing many different antibodies, but generally restrict their response to one or twomajor components .
It has been suggested that affinity maturation may in fact be responsible for therestricted antibody response to polysaccharides (2, 14, 38) . By this mechanism, which hasbeen shown to operate in the antibody response to proteins and hapten-protein conjugates(10-13), the initial antibody response is heterogeneous and includes both low and highaffinity antibodies . With time, the concentration of antigen decreases so that only thoseclones with high affinity receptors are stimulated to secrete antibody (13) . The result ofthis precursor cell selection is a gradual rise in the affinity of serum antibody . Kimball(14), in a study of the antibody response to type III pneumococcal carbohydrate inindividual rabbits, concluded that indeed affinity maturation takes place with thisantigen. However, it is not clear that the maturation he observed was responsible for therestricted antibody response since even the earliest antibodies he studied (1 wk afterimmunization) were already highly restricted, but of low affinity . It is equally possiblethat the gradual increase in affinity was a reflection of other control mechanisms resultingfrom the intensive immunization protocol where animals received weekly injections ofvaccine for 9 mo .
Our results are not consistent with the hypothesis that affinity maturation isresponsible for the restricted response to Group A carbohydrate . We found thatindividual mice produced IgM antibodies which were restricted in terms ofavidity and specificity at all times of observation . It was clear that no change inaverage avidity of the IgM antibody occurred with time or after multiple immuni-zations . There are several possible interpretations of our findings in relation tothe appearance of the massive, homogeneous IgG response seen with hyperim-munization : (a) There may be no memory induced with the early immunization sothat each injection of vaccine randomly stimulates new dominant clones .Therefore, the late homogeneous IgG antibody may be unrelated to the early IgMantibodies we have studied . (b) Memory might be induced among the IgM-responding cell populations, so that all IgM antibodies of an individual animalare derived from the initial dominant clone, while the homogeneous IgG antibodymay be derived from different precursors . It is clear from hapten-protein studiesthat the requirements for the stimulation of IgM and IgG production are different(43, 44) . It is therefore conceivable that the regulation of IgM and IgG antibodyproduction is also different . A further extension of this possibility is that aviditymaturation may be present in the IgG response to GAC but is not reflected in theIgM response (45) because the clones which develop the IgM, and which fail toswitch to IgG production, may be short lived, and therefore are continuallyreplaced by clones of random avidity . (c) The clones which give rise to the early

1304
RESTRICTED rgM ANTIBODY
restricted IgM antibodies may be the same clones which secrete massive amountsof IgG antibody after hyperimmunization . This possibility, which we favor, canbe distinguished experimentally from the others since it would be expected, inthis case, that early IgM and late IgG antibodies from individual animals wouldshare idiotypic (variable region) determinants . Studies are underway in thislaboratory to resolve this important question .
Regardless of the relationship of the IgM response to the restricted IgG antibody, it isunclear why only some GAC-specific clones are stimulated to make IgM antibody .Transfer studies (15) have established that a responding clone inhibits, in some fashion,the response of other precursor cells (46) . It is by no means clear whether this effect ismediated through active control by, for example, specific suppressor cells (47), or by morepassive means such as by massive, random expansion of individual clones so that theirprogeny may constitute the bulk of potential precursors at subsequent exposures toantigen . These crucial questions remain to be explored .
Finally, it is possible that the restriction of the response and its magnitude are notrelated events . Many antigens have been described now which give restricted but oftenmeager responses . These include antigens with a repeating unit structure, such as dextran(48) and dinitrophenyl-coated artificial membranes (49) . It may be that such molecules,because of their repetitive nature, are exceedingly efficient at triggering individual cells .At the same time, many of these molecules are tolerogenic (50), possibly for the same rea-son, so that "clonal dominance" may in fact be, as Haber suggested, a complex and ran-dom balance between stimulation and tolerization (51) . The magnitude of a response is it-self dependent on genetically controlled factors (52) which could have multiple levels ofcontrol . These could include the development of suppressor functions (53), participationof accessory cells (54), metabolism of antigenic determinants (50), antibody feedback (55),etc ., each of which could contribute to the regulation of the amount of antibody produced .Therefore, the seemingly simple, and highly repeatable, phenomenon of clonal dominanceas seen in the response to bacterial polysaccharides may be multifactorial . Answers tomany of the basic questions concerning the nature of clonal dominance should provide in-sight not only to our knowledge about the immune response to polysaccharides, but alsoto our appreciation of the complex mechanisms which control the immunologic machinery .
SummaryThe IgM antibody response of mice to the streptococcal group A carbohydrate
(GAC) was measured . With most strains tested, large amounts of IgM antibodywere produced ; in AKR mice, over 1% of the total nucleated spleen cells secretedIgM anti-GAC antibody after hyperimmunization . The relative avidity of theantibody was estimated by a modification of the Jerne plaque assay where spleencells from individual mice were tested against erythrocytes with varying GACepitope density . These studies showed that the earliest, as well as latest, IgMantibodies produced were highly restricted in avidity heterogeneity . No evidenceof affinity maturation was seen upon hyperimmunization . These data favor theconclusion that the restricted IgG response seen in mice hyperimmunized to GACis not the result of affinity driven competition for antigen among precursor cells .These studies profited from discussions with Dr . Latham Claflin, Dr. Stanley Read, and Mr . RobertWarren . We would like to thank Suzanne Murphy for excellent technical assistance .Received for publication 19 February 1975 .

DAVID E. BRILES AND JOSEPH M. DAVIE
1305
References1 . Krause, R . M . 1970 . The search for antibodies with molecular uniformity . Adu.
Immunol . 12 : 1 .2 . Haber, E . 1971 . Homogeneous elicited antibodies : Induction, characterization,
isolation and structure . Ann . N.Y. Acad . Sci . 190 : 285 .3 . Braun, D . G ., and J .-C . Jaton . 1974 . Homogeneous antibodies : induction and value as
probe for the antibody problem . Curr . Top . Microbiol . Immunol . 66 : 29 .4 . Chen, K . C . S ., T . J . Kindt, and R . M. Krause . 1974 . Amino-acid sequence of an
allotype b4 light chain from a rabbit antibody to streptococcal carbohydrate . Proc .Nati . Acad . Sci . U.S.A . 71 : 1995 .
5 . Strosberg, A. D., K . J . Fraser, M . N . Margolies, and E . Haber . 1972 . Amino acidsequence of rabbit pneumococcal antibody . I . Light-chain cysteine-containing pep-tides . Biochemistry . 11 : 4978 .
6 . Eichmann, K., A . S . Tung, and A. Nisonoff . 1974 . Linkage and rearrangement ofgenes encoding mouse immunoglobulin heavy chains . Nature (Lond.) . 250 : 509 .
7 . Briles, D . E ., and R. M. Krause . 1974 . Mouse strain-specific idi6typy and interstrainidiotypic cross-reactions . J . Immunol. 113 : 522 .
8 . Kindt, T . J ., A . L . Thunberg, M. Mudgett, and D. G . Klapper . 1974 . A study of V.region genes using allotypic and idiotypic markers . In The Immune System, Genes,Receptors, Signals . E . E . Sercarz, A . Williamson, and C. F . Fox, editors . AcademicPress, Inc ., New York . 69 .
9 . Cramer, M ., and D . G . Braun . 1974 . Genetics of restricted antibodies to streptococcalgroup polysaccharides in mice . I . Strain differences of isoelectric focusing spectra ofGroup A hyperimmune antisera . J. Exp . Med . 139 : 1513 .
10 . Eisen, H. N., and G . W . Siskind . 1964 . Variations in affinities of antibodies during theimmune response . Biochemistry . 3 : 996 .
11 . Siskind, G . W., and B . Benacerraf. 1969 . Cell selection by antigen in the immuneresponse . Adv . Immunol . 10 : 1 .
12 . Davie, J . M ., and W. E . Paul . 1972 . Receptors on immunocompetent cells . V . Cellularcorrelates of the "maturation" of the immune response . J. Exp . Med . 135 : 660 .
13 . Davie, J . M., and W. E . Paul . 1973 . Immunological maturation . Preferentialproliferation of high affinity precursor cells . J. Exp . Med . 137 : 201 .
14 . Kimball, J . W. 1972 . Maturation of the immune response to type III pneumococcalpolysaccharide . Immunochemistry . 9 : 1169 .
15 . Briles, D . E ., and R . M. Krause . 1972 . Mouse antibodies to Group A streptococcalcarbohydrate ; use of idiotypy to detect inbred strain specificity and to monitor spleencell transfer in syngenetic mice . J. Immunol . 109 : 1311 .
16 . Braun, D. G ., B . Kindred, and E . B . Jacobson . 1972 . Streptococcal Group Acarbohydrate antibodies in mice : evidence for strain differences in magnitude andrestriction of the response, and for thymus dependence . Eur . J . Immunol . 2 : 138 .
17 . Eichmann, K . 1972 . Idiotypic identity of antibodies to streptococcal carbohydrate ininbred mice . Eur . J . Immunol. 2 : 301 .
18 . Briles, D. E. 1973 . Studies on the inheritance of idiotypic markers of mouse antibodyto streptococcal Group A carbohydrate and on other genetic factors which influencethe immune response . Ph .D . Thesis . The Rockefeller University, New York .
19 . McCarty, M., and R . C . Lancefield . 1955 . Variation in the groupspecific carbohydrateon Group A streptococci . I . Immunochemical studies of the carbohydrates of variantstrains . J. Exp . Med . 102 : 11 .
20 . Dische, Z ., and L . B . Shettles . 1948. A specific color reaction of methylpentoses and aspectrophotometric micromethod for their determination . J . Biol . Chem . 175 : 595 .
1306
RESTRICTED IgM ANTIBODY
21 . Krause, R . M ., and M. McCarty . 1961 . Studies on the chemical structure of thestreptococcal cell wall . I . The identification of a mucopeptide in the cell walls ofGroups A and A-variant streptococci . J. Exp. Med. 114 : 127 .
22 . Kristiansen, T . L . Sundberg, and J . Porath . 1969 . Studies on blood group substances .II . Coupling of blood group substance A to hydroxyl-containing matrices, includingaminoethyl cellulose and agarose . Biochim . Biophys . Acta . 184 : 93 .
23 . Kuhn, R., and W. Kirschenlohr . 1956 . Darstellung von N-acetyl-lactosamine (4-0-D-galaktopyranosyl-desoxy-2-acetamino-D-glucopyranose) aus lactose . Annalen derChemi . 600 : 135 .
24 . Pavlovskis, O., and H. D . Slade . 1969 . Adsorption of 3H-fatty acid esters ofstreptococcal Groups A and E cell wall polysaccharide antigens by red blood cells andtheir effect on hemagglutination . J . Bacteriol . 100 : 641 .
25 . Chesebro, B ., and H . Metzger . 1972 . Affinity labeling of a phosphorylcholine bindingmouse myeloma protein . Biochemistry . 11 : 766 .
26 . Nordin, A . A ., H . Cosenza, and W. Hopkins . 1969 . The use of concanavalin A fordistinguishing IgM from IgG antibody producing cells . J. Immunol . 103 : 859 .
27 . Hosono, M., and S . Muramatsu . 1972 . Use of 2-mercaptoethanol for distinguishingbetween IgM and IgG antibody producing cells of mice immunized with bovine tiglobulin . J. Immunol . 109 : 857 .
28 . Jerne, N. K., C . Henry, A . A . Nordin, H . Fuji, A . M. C . Koros, and I . Lefkovits . 1974 .Plaque forming cells : methodology and theory . Transplant . Rev . 18 : 130 .
29 . Andersson, B . 1970 . Studies on the regulation of avidity at the level of the singleantibody forming cell . J. Exp . Med . 132 : 77 .
30 . Pasanen, V. J ., and O . Makela . 1969 . Effect of the number of haptens coupled to eacherythrocyte on haemolytic plaque formation . Immunology . 16 : 399 .
31 . Askonas, B . A ., A . R . Williamson, and B . E . G . Wright . 1970 . Selection of a singleantibody-forming cell clone and its propagation in syngeneic mice . Proc . Natl . Acad .Sci . U.S.A . 67 : 1398 .
32 . Read, S . E ., and D. G . Braun . 1974 . In vitro antibody response of primed rabbitperipheral blood lymphocytes to Group A variant streptococcal polysaccharide . Eur .J. Immunol. 4 : 422 .
33 . North, J . R ., and B . A . Askonas . 1974 . Analysis of affinity of monoclonal antibodyresponses by inhibition of plaque-forming cells . Eur . J. Immunol . 4 : 361 .
34 . McCarty, M . 1958 . Further studies on the chemical basis for serological specificity ofGroup A streptococcal carbohydrate . J. Exp . Med. 108 : 311 .
35 . Kunkel, H . G ., M . Mannik, and R . C . Williams . 1963 . Individual antigenic specificityof isolated antibodies . Science (Wash. D. C .) . 140 : 1218 .
36 . Edelman, G . M ., and E . A . Kabat . 1964 . Studies on human antibodies . I. Starch gelelectrophoresis of the dissociated polypeptide chains . J. Exp. Med. 119 : 443 .
37 . Allen, J . C ., H . G . Kunkel, and E. A. Kabat . 1964 . Studies on human antibodies . II .Distribution of genetic factors . J. Exp . Med . 119 : 453 .
38 . Ghose, A . C ., and F. Karush . 1973 . The affinity and temporal variation of isoelectricfractions of rabbit anti-lactose antibody . Biochemistry . 12 : 2437 .
39 . Claflin, J . L ., R . Lieberman, and J . M. Davie . 1974 . Clona l nature of the immuneresponse to phosphorylcholine . II . Idiotypic specificity and binding characteristics ofantiphosphorylcholine antibodies . J. Immunol . 112 : 1747 .
40 . Claflin, J . L ., and J . M . Davie . 1974 . Clonal nature of the immune response tophosphorylcholine . IV . Idiotypic uniformity of binding site-associated antigenicdeterminants among mouse antiphosphorylcholine antibodies . J. Exp . Med . 140 : 673 .
41 . Claflin, J . L ., R . Lieberman, and J . M. Davie . 1974 . Clona l nature of the immuneresponse to phosphorylcholine . I . Specificity, class, and idiotype of phosphorylcholine-binding receptors on lymphoid cells . J. Exp . Med. 139 : 58 .

DAVID E. BRILES AND JOSEPH M. DAVIE
1307
42 . Cosenza, H., and H . Kohler. 1972 . Specific suppression of the antibody response toreceptors . Proc . Natl . Acad . Sci . USA. 69 : 2701 .
43 . Makela, 0 . 1970 . Analogies between lymphocyte receptors and the resulting humoralantibodies . Transplant . Rev . 5 : 3 .
44 . Naor, D., S . Morecki, and G. F . Mitchell . 1974 . Differentia l induction of anti-trini-trophenyl plaque-forming cell responses to lightly and heavily conjugated trinitro-phenylated heterologous and autologous erythrocytes in mice . Eur . J . Immunol . 4 :311 .
45 . Kim, Y . D ., and F . Karush . 1973 . Equine anti-hapten antibody . VII . Anti-lactosideantibody induced by a bacterial vaccine . Immunochemistry . 10 : 365 .
46 . Askonas, B . A ., and A . R . Williamson . 1972 . Dominance of a cell clone formingantibody to DNP. Nature (Loud.) . 238 : 339 .
47 . Tada, T., and T . Takemori . 1974 . Selective roles of thymus-derived lymphocytes inthe antibody response . I . Differential suppressive effect of carrier-primed T cells onhapten-specific IgM and IgG antibody responses . J . Exp . Med . 140: 239 .
48 . Blomberg, B., W. Geckeler, and M. Weigert . 1972 . Genetics of the antibody responseto dextran in mice . Science (Wash. D. C.) . 177 : 178 .
49 . Uemura, K., J . L . Claflin, J . M . Davie, and S . C . Kinsky . 1975 . Immune response toliposomal model membranes : restricted IgM and IgG anti-dinitrophenyl antibodiesproduced in guinea pigs . J. Immunol. 114 : 958 .
50 . Howard, J . G . 1972 . Cellular events in the induction and loss of tolerance topneumococcal polysaccharides . Transplant . Rev . 8 : 50 .
51 . Chen, F. W., A . D . Strosberg, and E . Haber . 1973 . Evolution of the immune responseto type III and VIII pneumococcal polysaccharides . J. Immunol . 110 : 98 .
52 . McDevitt, H. 0., and B . Benacerraf. 1969 . Genetic control of specific immuneresponses . Adv . Immunol . 11 : 31 .
53 . Gershon, R . G . 1974 . T cell control of antibody production . Contemp . Top.Immunobiol . 3 : 1 .
54 . Wiener, E., and A . Bandieri . 1974 . Differences in antigen handling by peritonealmacrophages from the Biozzi high and low responder lines of mice . Eur . J. Immunol .4 : 457 .
55 . Uhr, J . W., and G . Moller . 1968 . Regulatory effect of antibody on the immuneresponse . Adv . Immunol . 8: 81 .