CLL / MBL Epidemiology - University of Manitoba · ©2014 MFMER | slide-1 CLL / MBL Epidemiology...
44
©2014 MFMER | slide-1 CLL / MBL Epidemiology Tim Call [email protected] Canadian CLL Conference September 18, 2014
Transcript of CLL / MBL Epidemiology - University of Manitoba · ©2014 MFMER | slide-1 CLL / MBL Epidemiology...
©2014 MFMER | slide-1
CLL / MBL EpidemiologyTim [email protected]
Canadian CLL ConferenceSeptember 18, 2014
©2014 MFMER | slide-2
Background
©2014 MFMER | slide-3
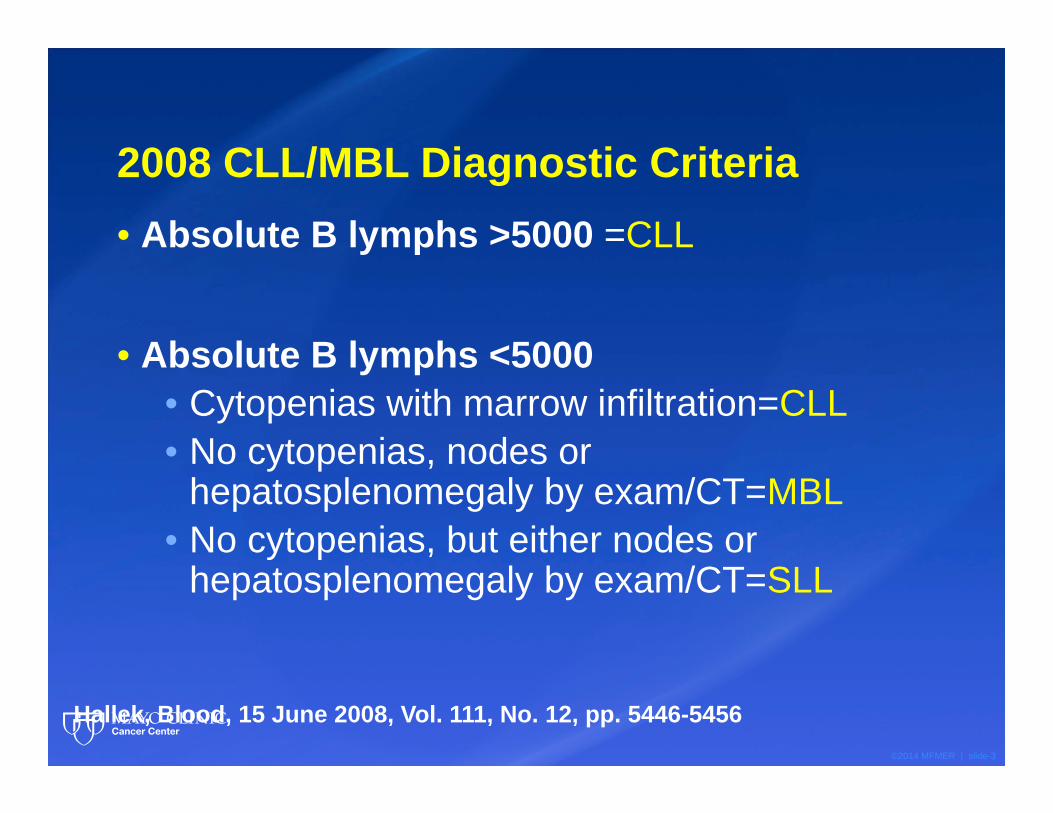
2008 CLL/MBL Diagnostic Criteria• Absolute B lymphs >5000 =CLL
• Absolute B lymphs <5000• Cytopenias with marrow infiltration=CLL• No cytopenias, nodes or
hepatosplenomegaly by exam/CT=MBL• No cytopenias, but either nodes or
hepatosplenomegaly by exam/CT=SLL
Hallek, Blood, 15 June 2008, Vol. 111, No. 12, pp. 5446-5456
©2014 MFMER | slide-4
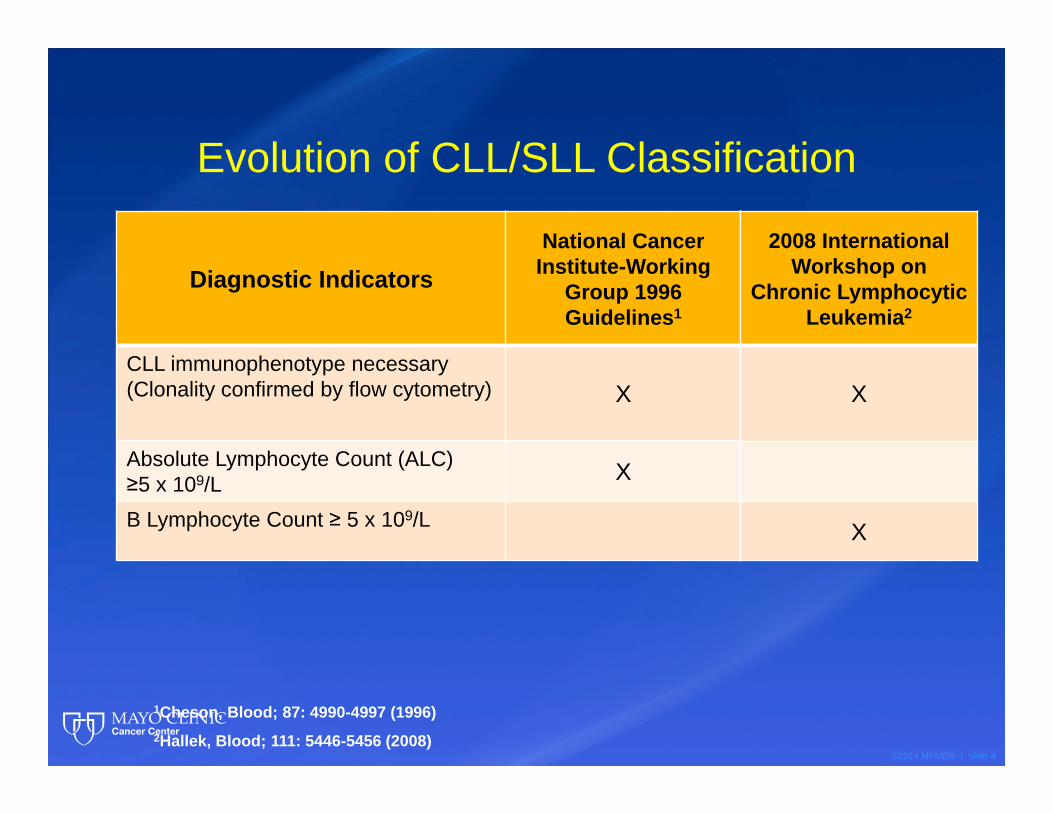
Evolution of CLL/SLL Classification
Diagnostic IndicatorsNational Cancer
Institute-Working Group 1996 Guidelines1
CLL immunophenotype necessary (Clonality confirmed by flow cytometry) X
Absolute Lymphocyte Count (ALC) ≥5 x 10⁹/L X
B Lymphocyte Count ≥ 5 x 10⁹/L
1Cheson, Blood; 87: 4990-4997 (1996)2Hallek, Blood; 111: 5446-5456 (2008)
2008 International Workshop on
Chronic Lymphocytic Leukemia2
X
X
©2014 MFMER | slide-5
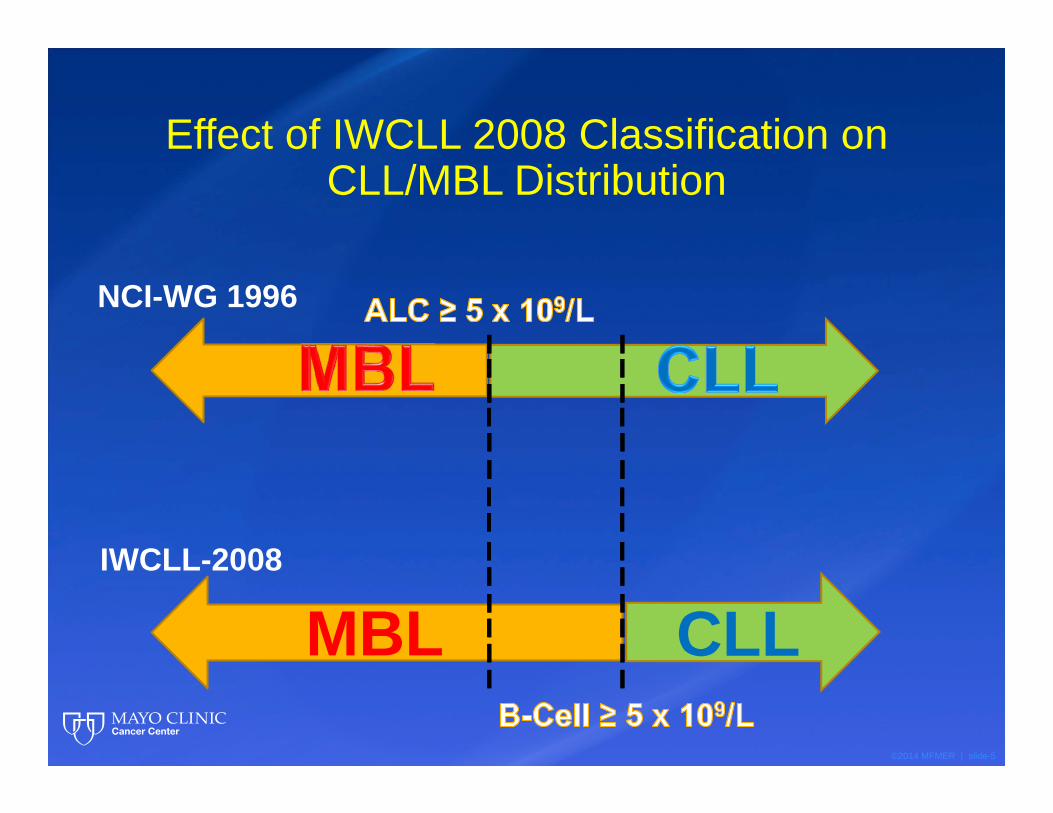
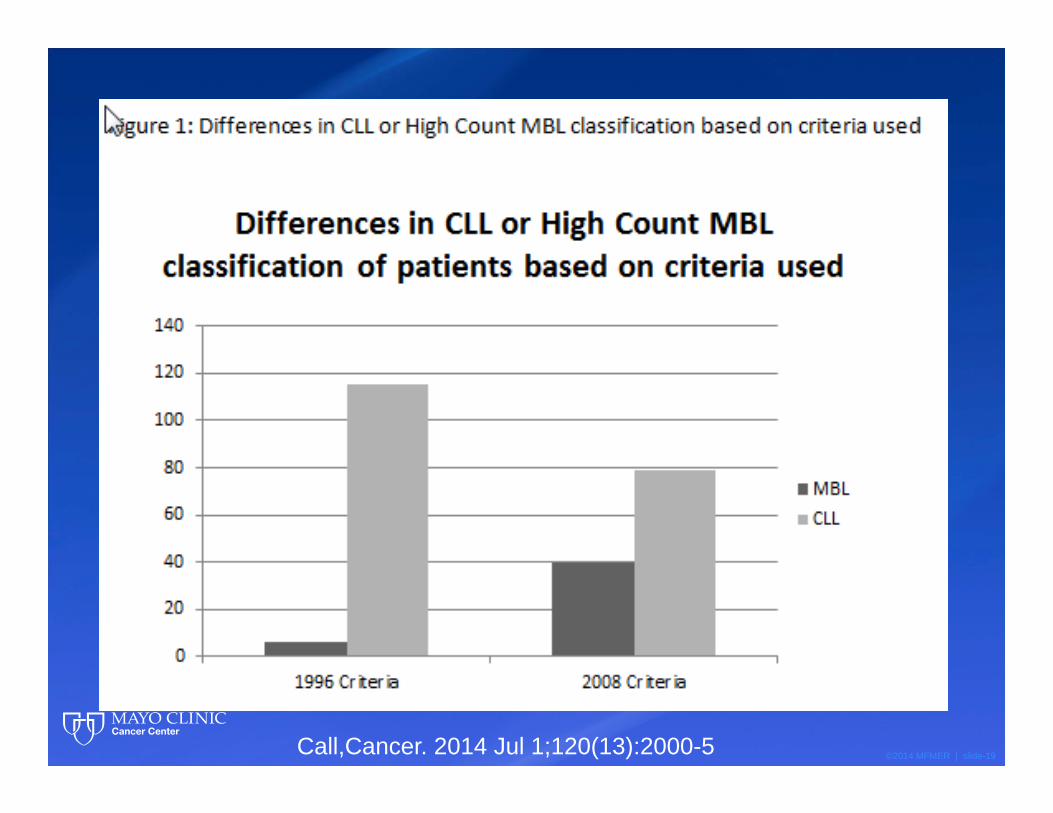
Effect of IWCLL 2008 Classification on CLL/MBL Distribution
CLLMBL
NCI-WG 1996
IWCLL-2008
©2014 MFMER | slide-6
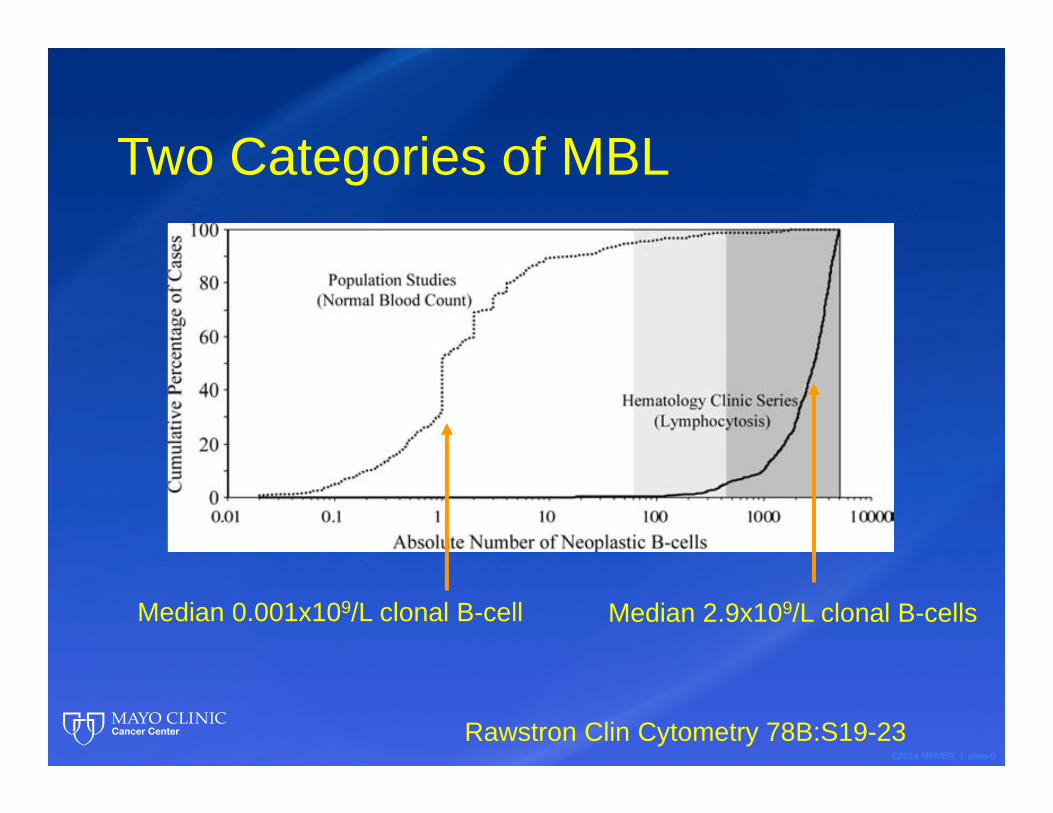
Two Categories of MBL
Rawstron Clin Cytometry 78B:S19-23
Median 0.001x10⁹/L clonal B-cell Median 2.9x10⁹/L clonal B-cells
©2014 MFMER | slide-7
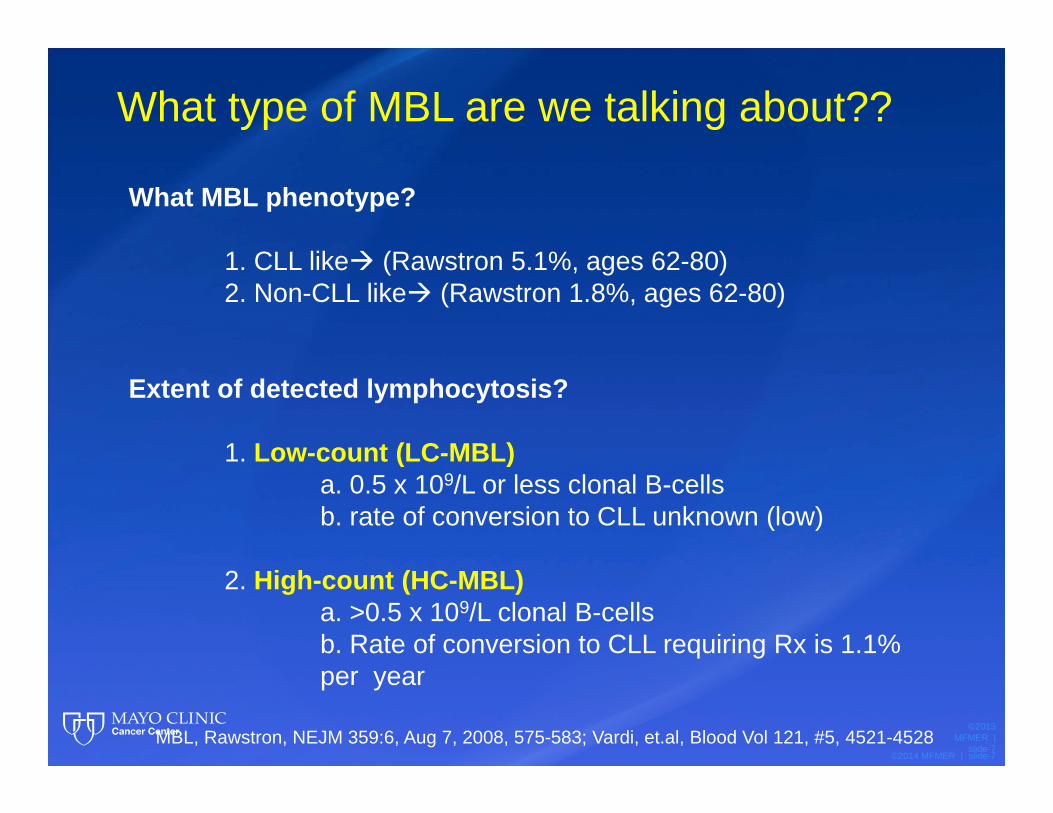
What type of MBL are we talking about??
©2013 MFMER |
slide-7MBL, Rawstron, NEJM 359:6, Aug 7, 2008, 575-583; Vardi, et.al, Blood Vol 121, #5, 4521-4528
What MBL phenotype?
1. CLL like (Rawstron 5.1%, ages 62-80)2. Non-CLL like (Rawstron 1.8%, ages 62-80)
Extent of detected lymphocytosis?
1. Low-count (LC-MBL)a. 0.5 x 10⁹/L or less clonal B-cellsb. rate of conversion to CLL unknown (low)
2. High-count (HC-MBL)a. >0.5 x 10⁹/L clonal B-cellsb. Rate of conversion to CLL requiring Rx is 1.1% per year
©2014 MFMER | slide-8
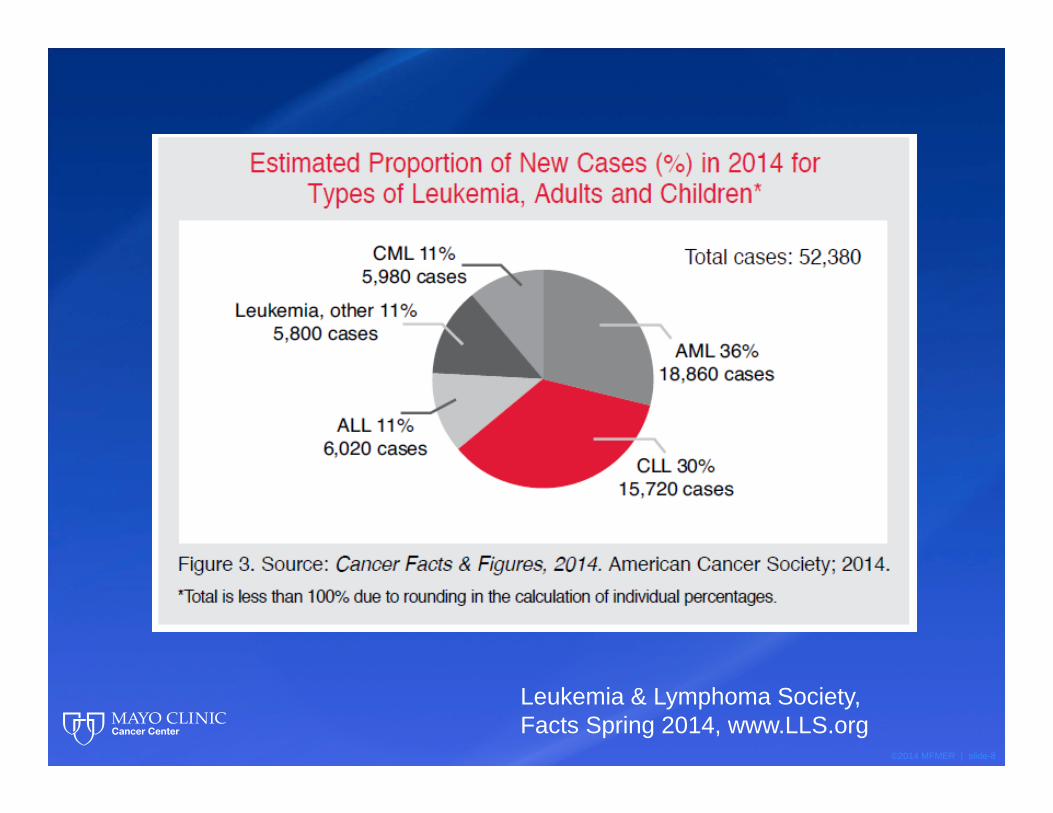
Leukemia & Lymphoma Society, Facts Spring 2014, www.LLS.org
©2014 MFMER | slide-9
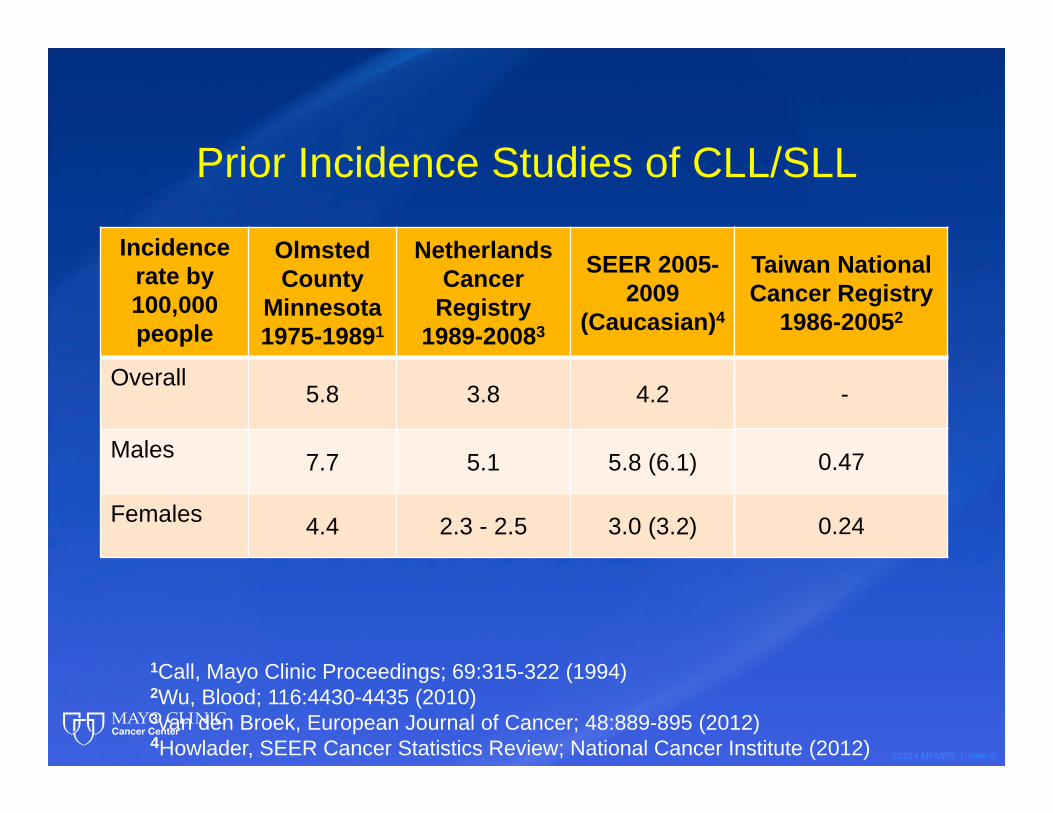
Prior Incidence Studies of CLL/SLL
Incidencerate by 100,000 people
OlmstedCounty
Minnesota 1975-19891
Netherlands Cancer
Registry 1989-20083
SEER 2005-2009
(Caucasian)4
Overall5.8 3.8 4.2
Males 7.7 5.1 5.8 (6.1)
Females 4.4 2.3 - 2.5 3.0 (3.2)
1Call, Mayo Clinic Proceedings; 69:315-322 (1994)2Wu, Blood; 116:4430-4435 (2010)3van den Broek, European Journal of Cancer; 48:889-895 (2012)4Howlader, SEER Cancer Statistics Review; National Cancer Institute (2012)
Taiwan National Cancer Registry
1986-20052
-
0.47
0.24
©2014 MFMER | slide-10
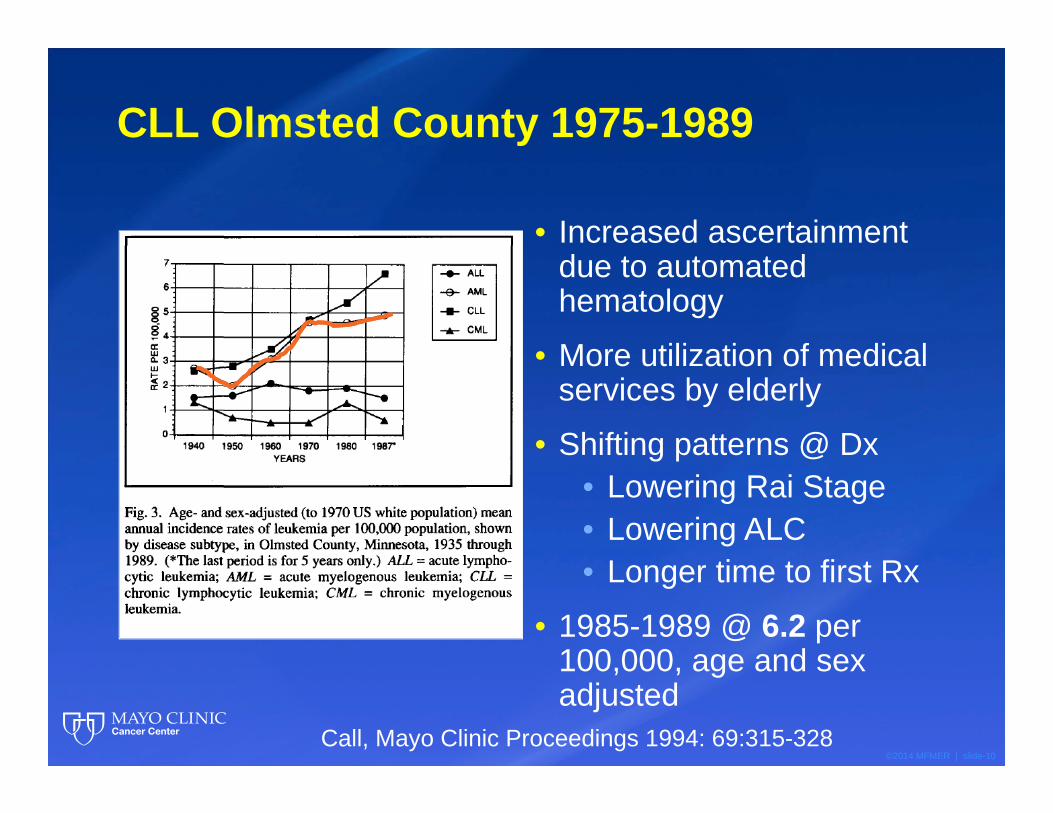
CLL Olmsted County 1975-1989
• Increased ascertainment due to automated hematology
• More utilization of medical services by elderly
• Shifting patterns @ Dx• Lowering Rai Stage• Lowering ALC• Longer time to first Rx
• 1985-1989 @ 6.2 per 100,000, age and sex adjusted
Call, Mayo Clinic Proceedings 1994: 69:315-328
©2014 MFMER | slide-11
Olmsted County, Minnesota Update 2014
©2014 MFMER | slide-12
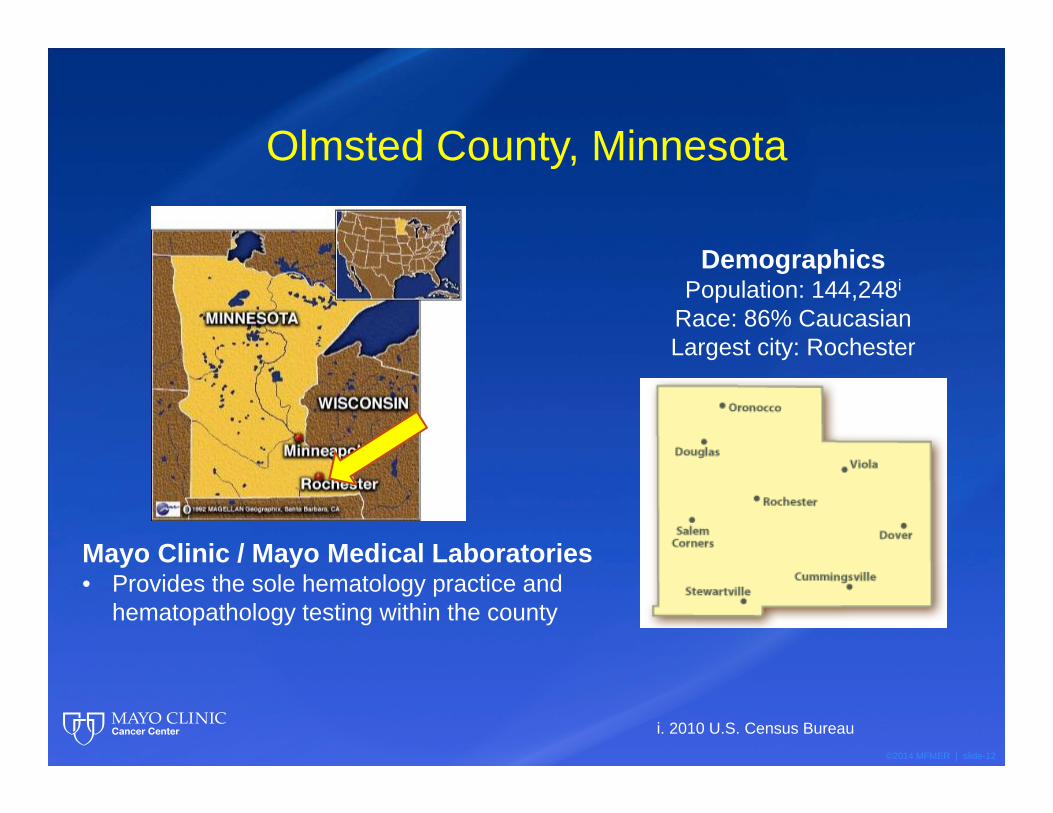
Olmsted County, Minnesota
DemographicsPopulation: 144,248i
Race: 86% CaucasianLargest city: Rochester
Mayo Clinic / Mayo Medical Laboratories • Provides the sole hematology practice and
hematopathology testing within the county
i. 2010 U.S. Census Bureau
©2014 MFMER | slide-13
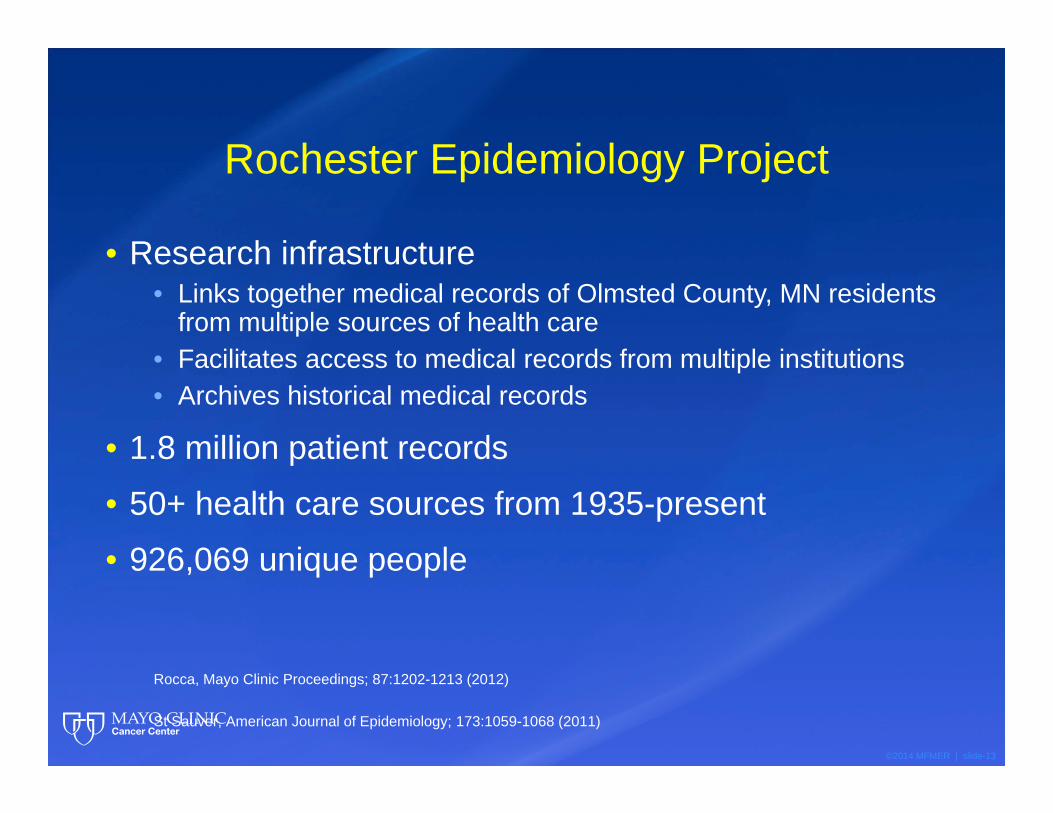
Rochester Epidemiology Project
• Research infrastructure• Links together medical records of Olmsted County, MN residents
from multiple sources of health care• Facilitates access to medical records from multiple institutions• Archives historical medical records
• 1.8 million patient records
• 50+ health care sources from 1935-present
• 926,069 unique people
Rocca, Mayo Clinic Proceedings; 87:1202-1213 (2012)
St Sauver, American Journal of Epidemiology; 173:1059-1068 (2011)
©2014 MFMER | slide-14
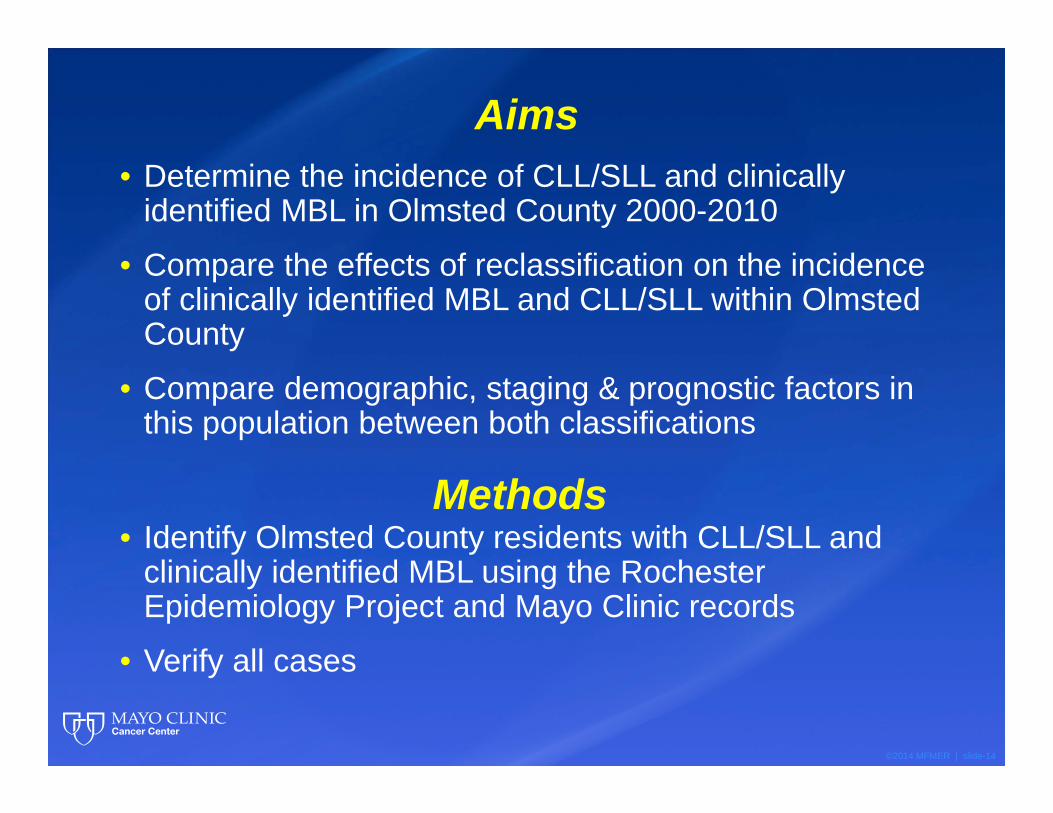
Aims• Determine the incidence of CLL/SLL and clinically
identified MBL in Olmsted County 2000-2010
• Compare the effects of reclassification on the incidence of clinically identified MBL and CLL/SLL within Olmsted County
• Compare demographic, staging & prognostic factors in this population between both classifications
• Identify Olmsted County residents with CLL/SLL and clinically identified MBL using the Rochester Epidemiology Project and Mayo Clinic records
• Verify all cases
Methods
©2014 MFMER | slide-15
Definitions used in study
• CLL=CLL/SLL• MBL=High count MBL,
• i.e. “clinically identified”
©2014 MFMER | slide-16
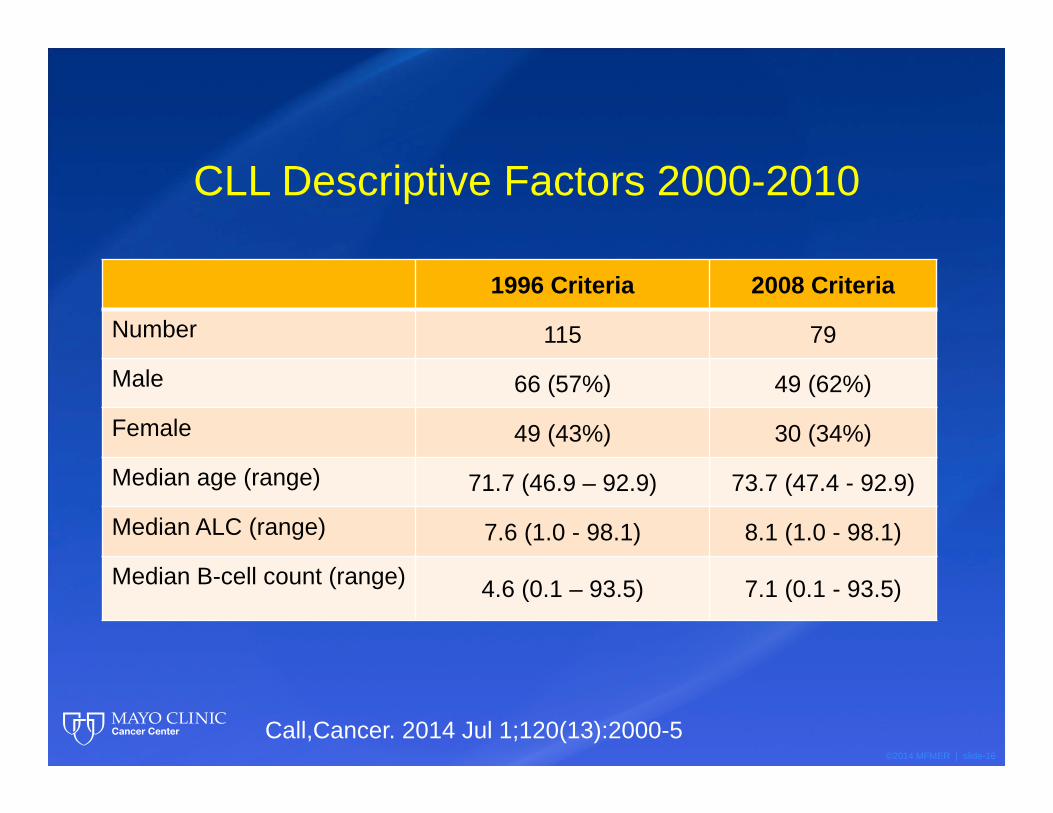
CLL Descriptive Factors 2000-2010
1996 Criteria 2008 Criteria
Number 115 79
Male 66 (57%) 49 (62%)
Female 49 (43%) 30 (34%)
Median age (range) 71.7 (46.9 – 92.9) 73.7 (47.4 - 92.9)
Median ALC (range) 7.6 (1.0 - 98.1) 8.1 (1.0 - 98.1)
Median B-cell count (range) 4.6 (0.1 – 93.5) 7.1 (0.1 - 93.5)
Call,Cancer. 2014 Jul 1;120(13):2000-5
©2014 MFMER | slide-17
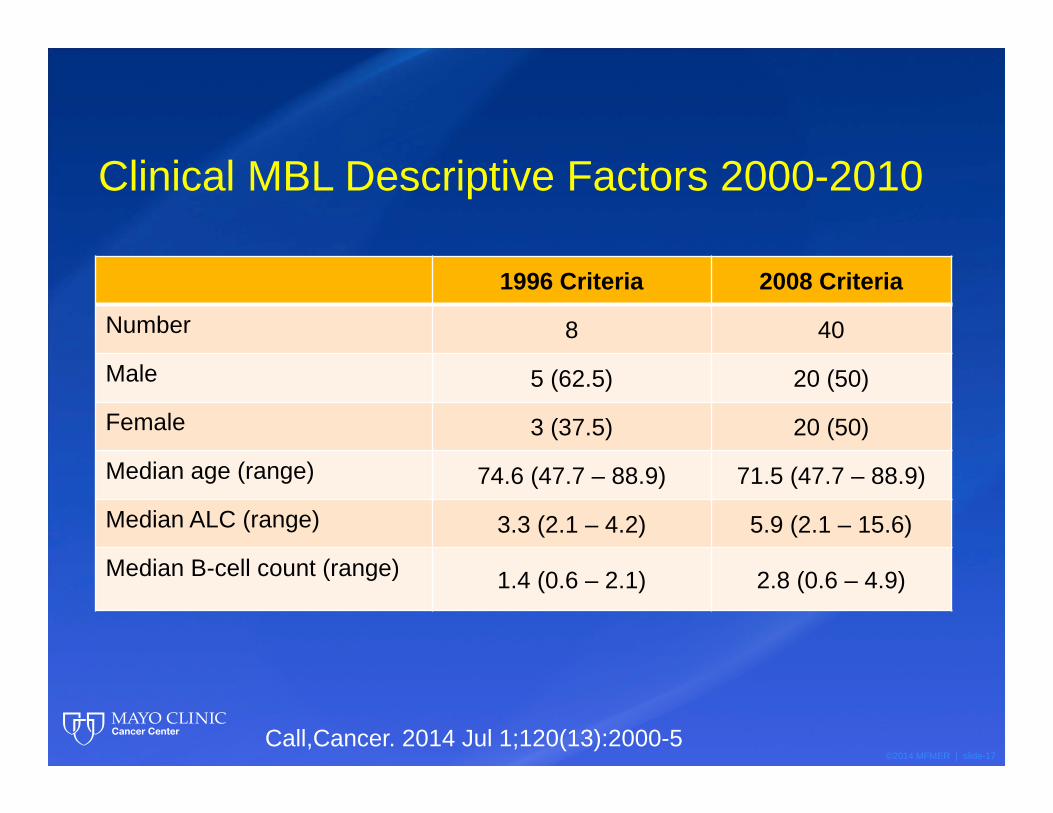
Clinical MBL Descriptive Factors 2000-2010
1996 Criteria 2008 Criteria
Number 8 40
Male 5 (62.5) 20 (50)
Female 3 (37.5) 20 (50)
Median age (range) 74.6 (47.7 – 88.9) 71.5 (47.7 – 88.9)
Median ALC (range) 3.3 (2.1 – 4.2) 5.9 (2.1 – 15.6)
Median B-cell count (range) 1.4 (0.6 – 2.1) 2.8 (0.6 – 4.9)
Call,Cancer. 2014 Jul 1;120(13):2000-5
©2014 MFMER | slide-18
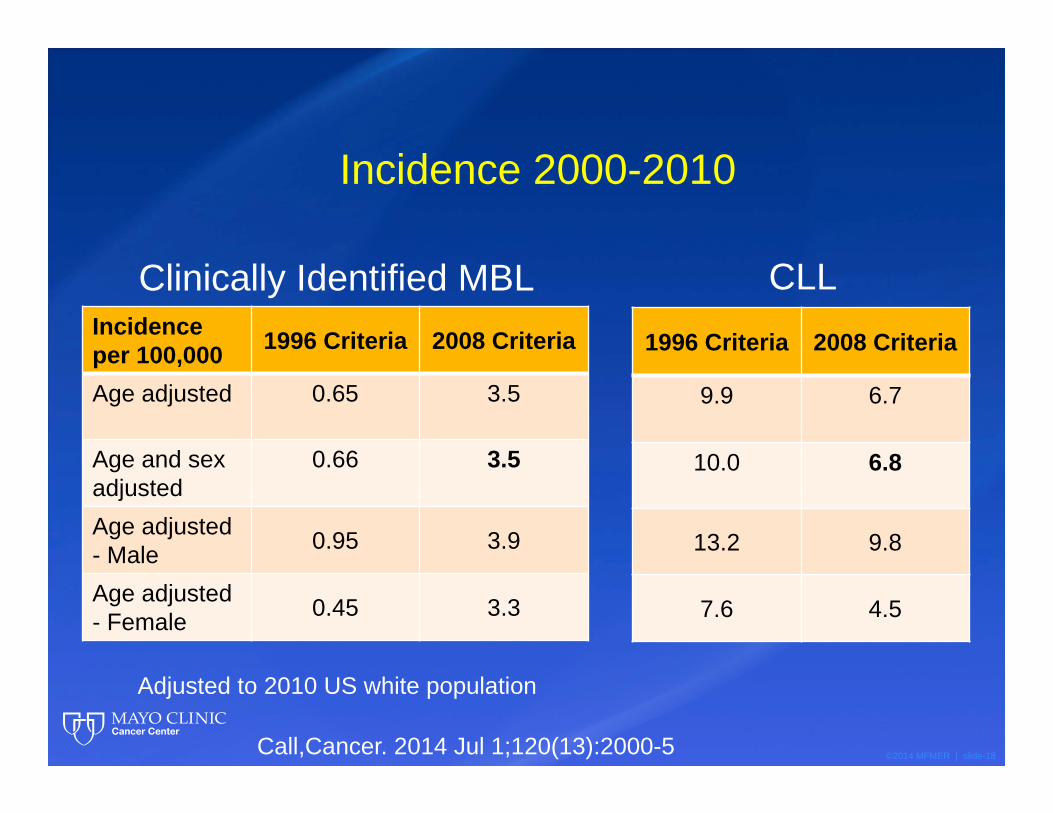
Incidence 2000-2010
Incidence per 100,000 1996 Criteria 2008 Criteria
Age adjusted 0.65 3.5
Age and sexadjusted
0.66 3.5
Age adjusted - Male 0.95 3.9
Age adjusted - Female 0.45 3.3
Adjusted to 2010 US white population
1996 Criteria 2008 Criteria
9.9 6.7
10.0 6.8
13.2 9.8
7.6 4.5
Clinically Identified MBL CLL
Call,Cancer. 2014 Jul 1;120(13):2000-5
©2014 MFMER | slide-19Call,Cancer. 2014 Jul 1;120(13):2000-5
©2014 MFMER | slide-20
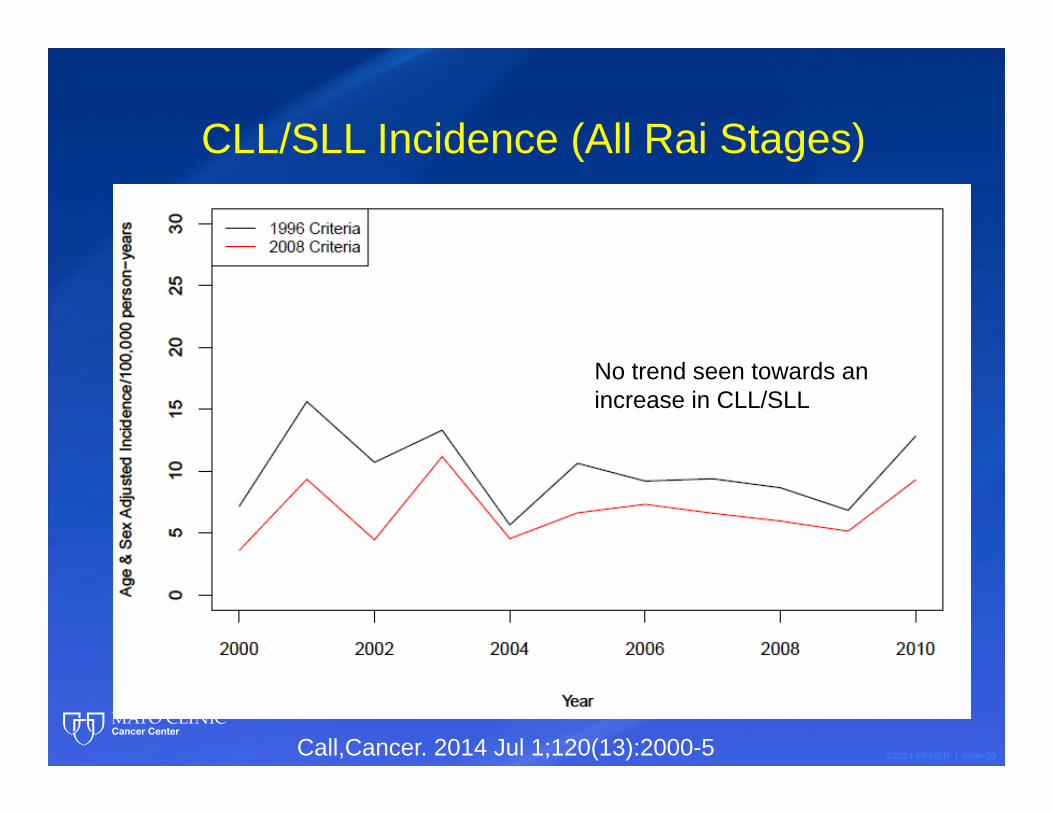
CLL/SLL Incidence (All Rai Stages)
No trend seen towards an increase in CLL/SLL
Call,Cancer. 2014 Jul 1;120(13):2000-5
©2014 MFMER | slide-21
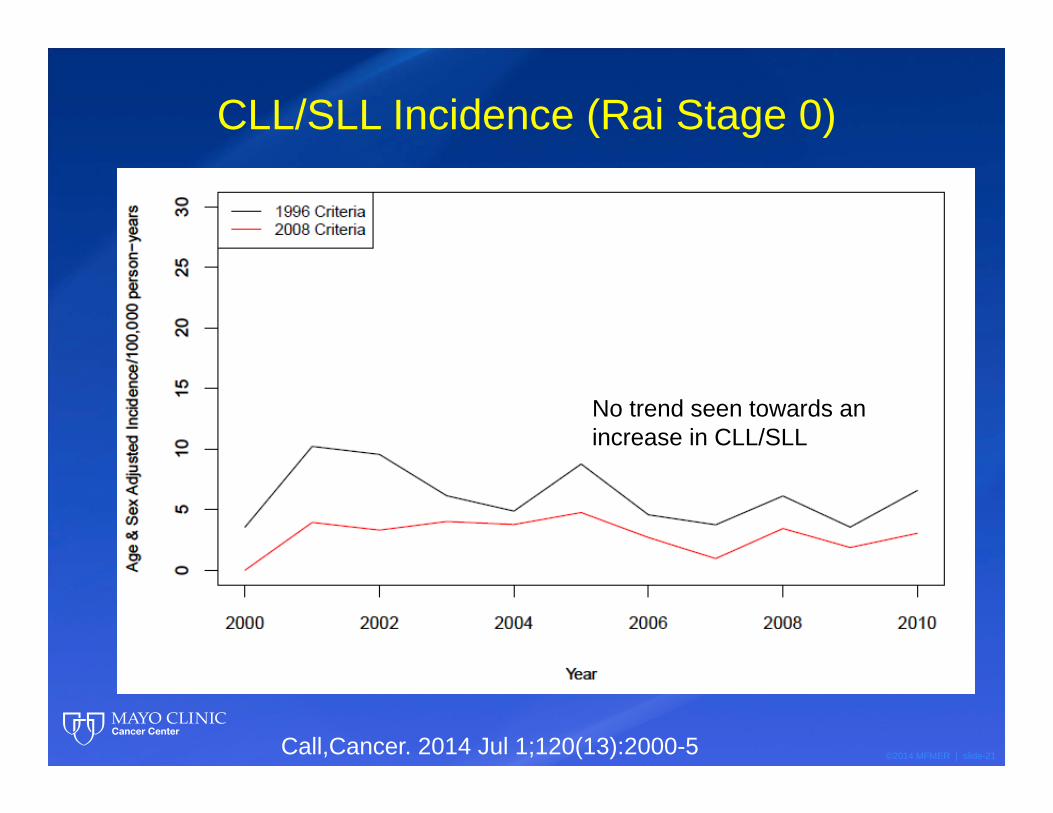
CLL/SLL Incidence (Rai Stage 0)
No trend seen towards an increase in CLL/SLL
Call,Cancer. 2014 Jul 1;120(13):2000-5
©2014 MFMER | slide-22
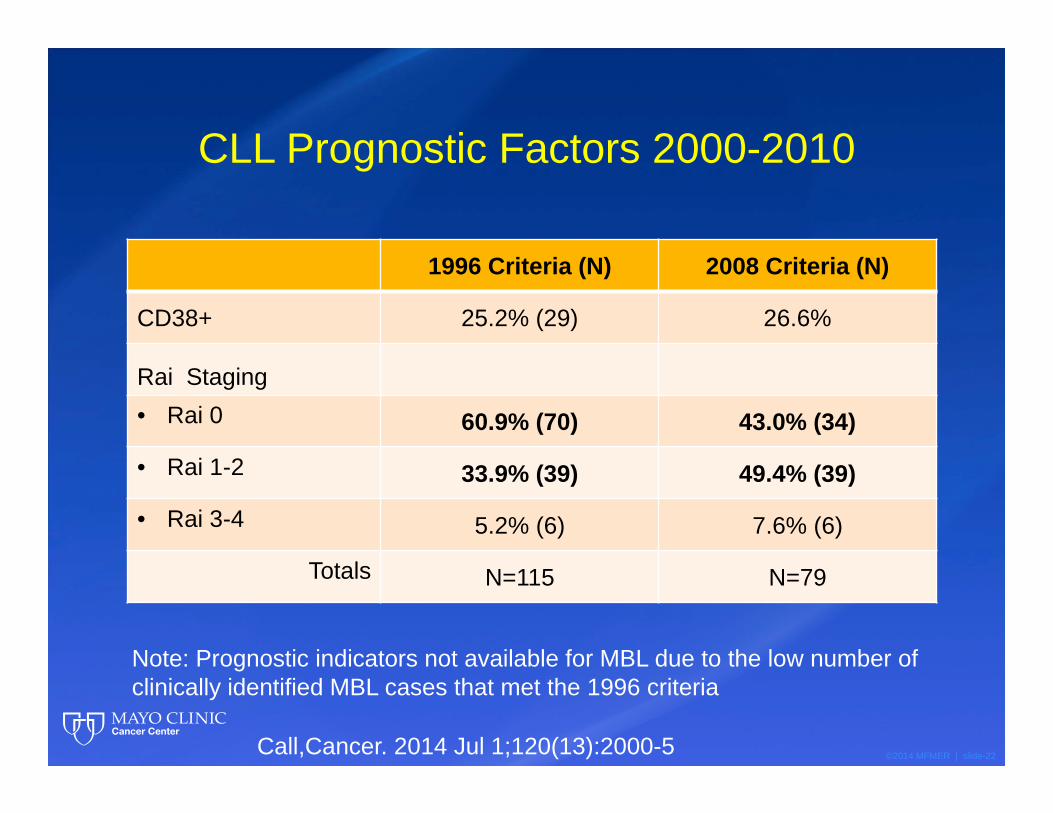
1996 Criteria (N) 2008 Criteria (N)
CD38+ 25.2% (29) 26.6%
Rai Staging• Rai 0 60.9% (70) 43.0% (34)
• Rai 1-2 33.9% (39) 49.4% (39)
• Rai 3-4 5.2% (6) 7.6% (6)
Totals N=115 N=79
CLL Prognostic Factors 2000-2010
Note: Prognostic indicators not available for MBL due to the low number of clinically identified MBL cases that met the 1996 criteria
Call,Cancer. 2014 Jul 1;120(13):2000-5
©2014 MFMER | slide-23
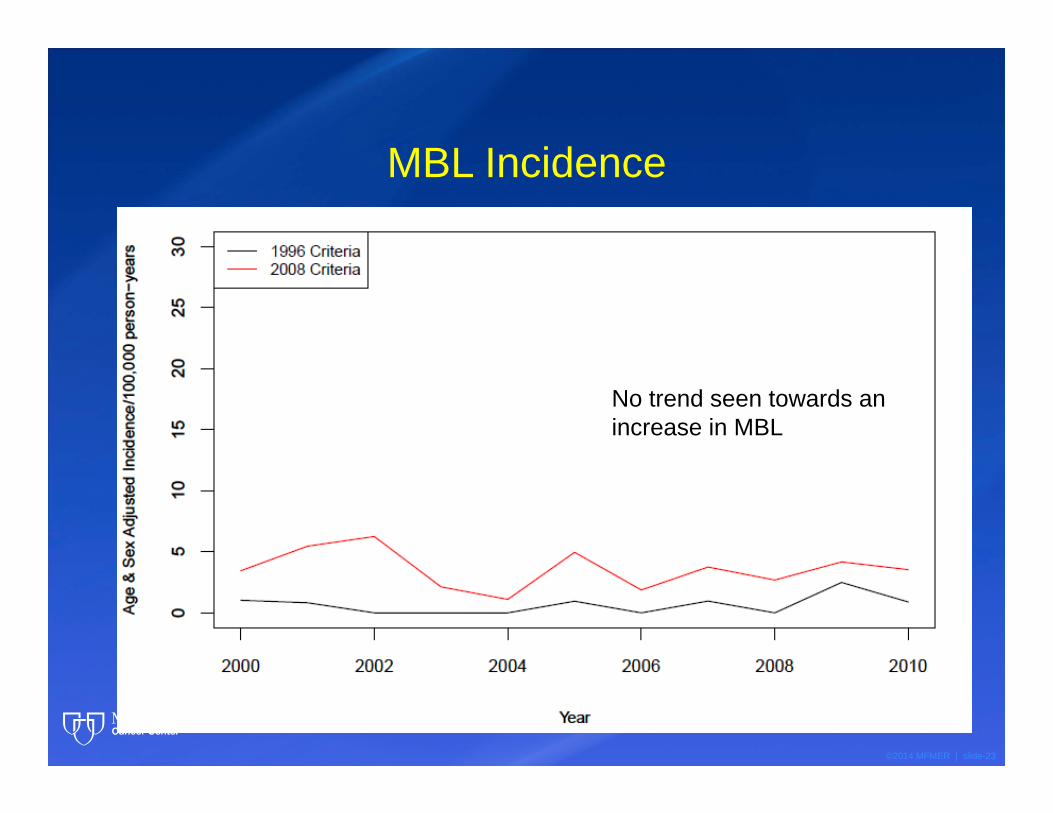
MBL Incidence
No trend seen towards an increase in MBL
©2014 MFMER | slide-24
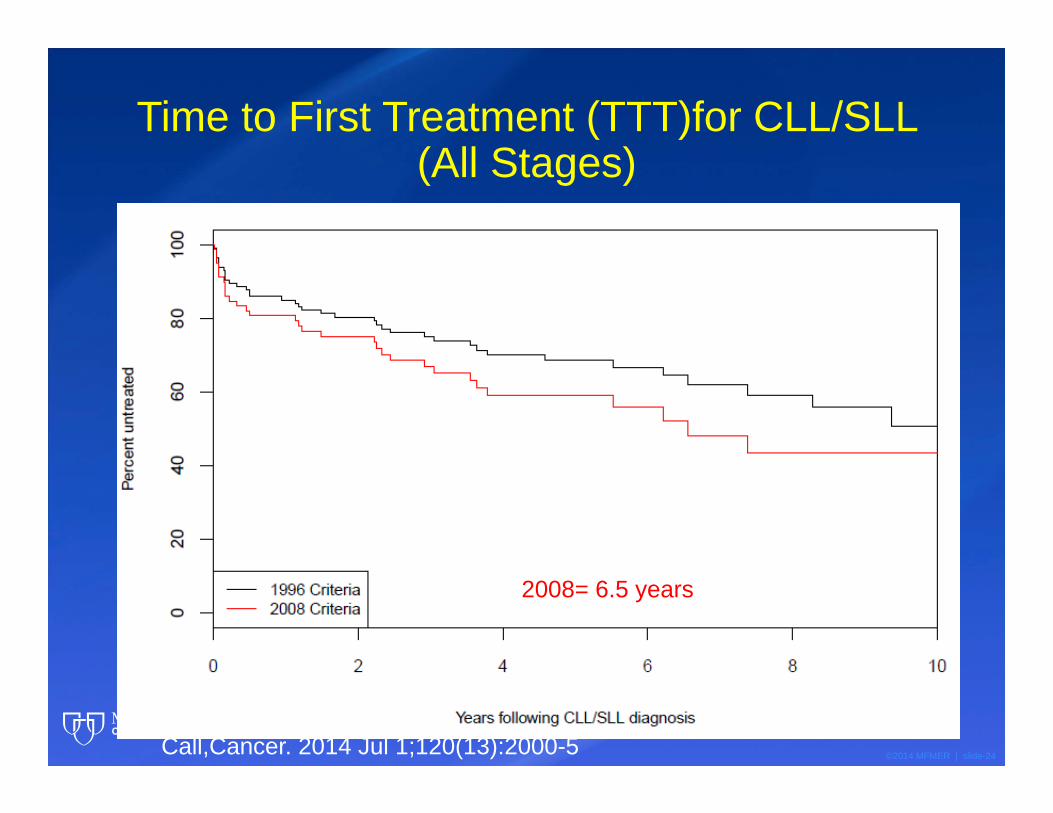
Time to First Treatment (TTT)for CLL/SLL (All Stages)
Median TTT1996= 9.2 years2008= 6.5 years
Call,Cancer. 2014 Jul 1;120(13):2000-5
©2014 MFMER | slide-25
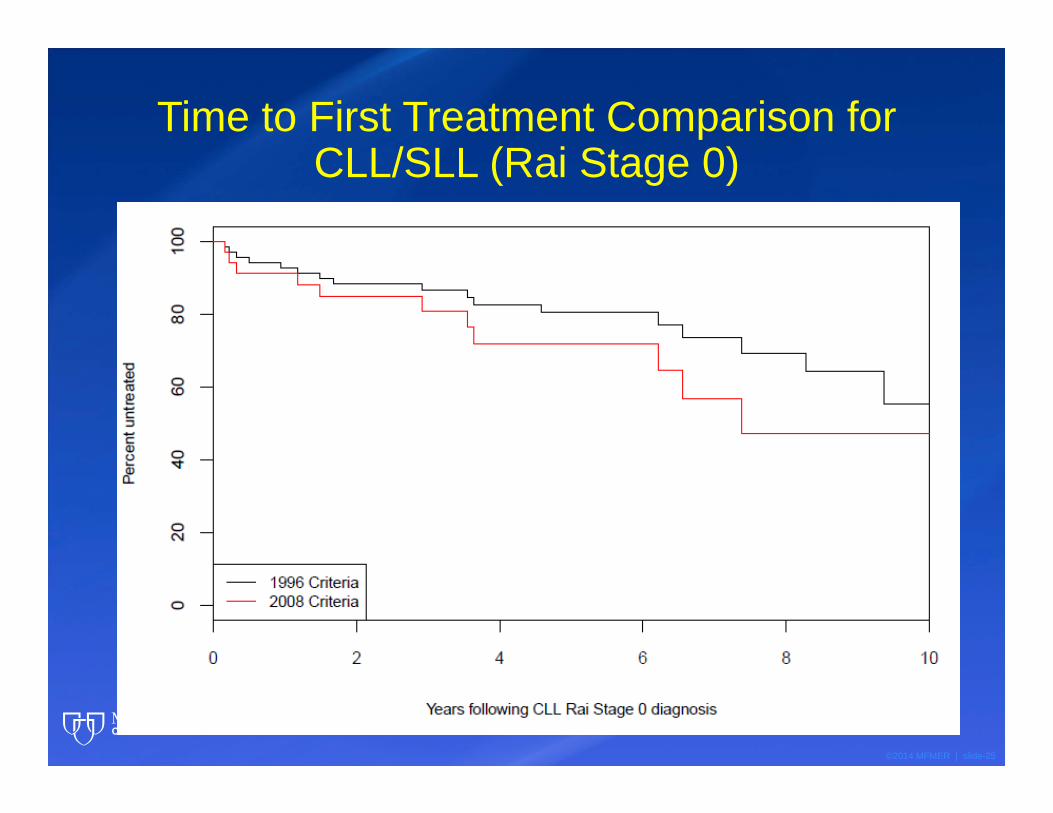
Time to First Treatment Comparison for CLL/SLL (Rai Stage 0)
©2014 MFMER | slide-26
How does the data compare?
©2014 MFMER | slide-27
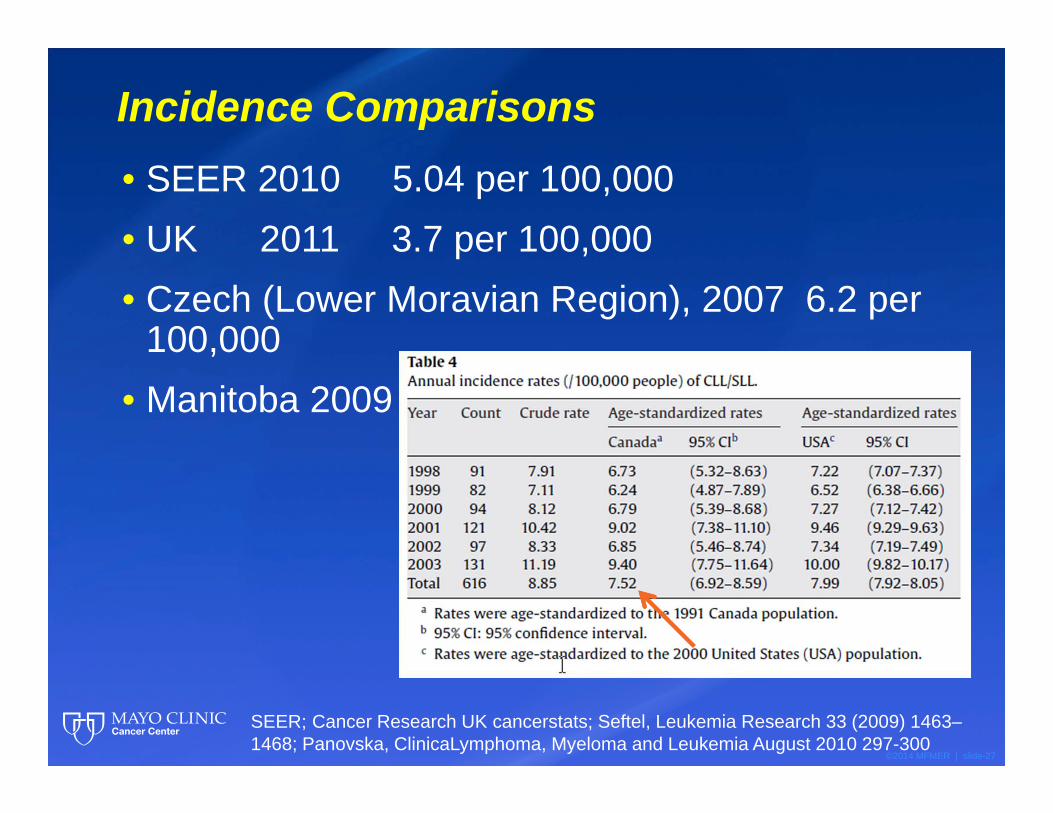
Incidence Comparisons• SEER 2010 5.04 per 100,000• UK 2011 3.7 per 100,000• Czech (Lower Moravian Region), 2007 6.2 per
100,000• Manitoba 2009
SEER; Cancer Research UK cancerstats; Seftel, Leukemia Research 33 (2009) 1463–1468; Panovska, ClinicaLymphoma, Myeloma and Leukemia August 2010 297-300
©2014 MFMER | slide-28
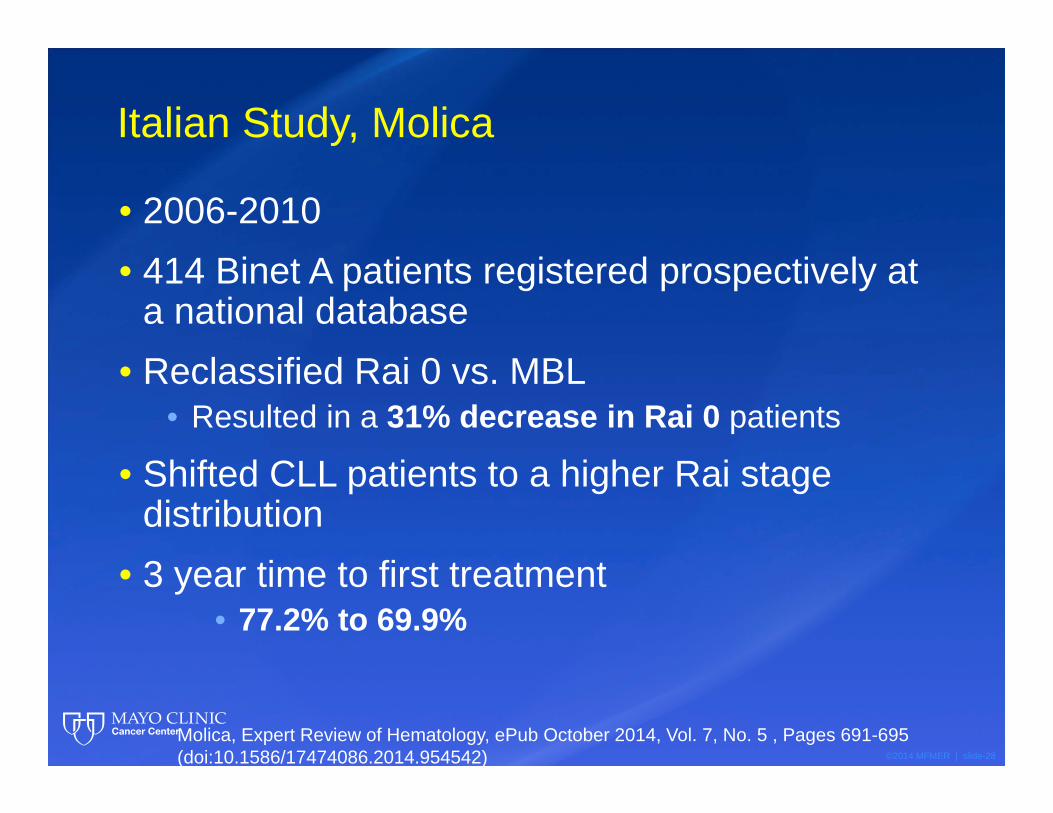
Italian Study, Molica
• 2006-2010• 414 Binet A patients registered prospectively at
a national database• Reclassified Rai 0 vs. MBL
• Resulted in a 31% decrease in Rai 0 patients
• Shifted CLL patients to a higher Rai stage distribution
• 3 year time to first treatment• 77.2% to 69.9%
Molica, Expert Review of Hematology, ePub October 2014, Vol. 7, No. 5 , Pages 691-695 (doi:10.1586/17474086.2014.954542)
©2014 MFMER | slide-29
What about CLL Prevalence?
©2014 MFMER | slide-30
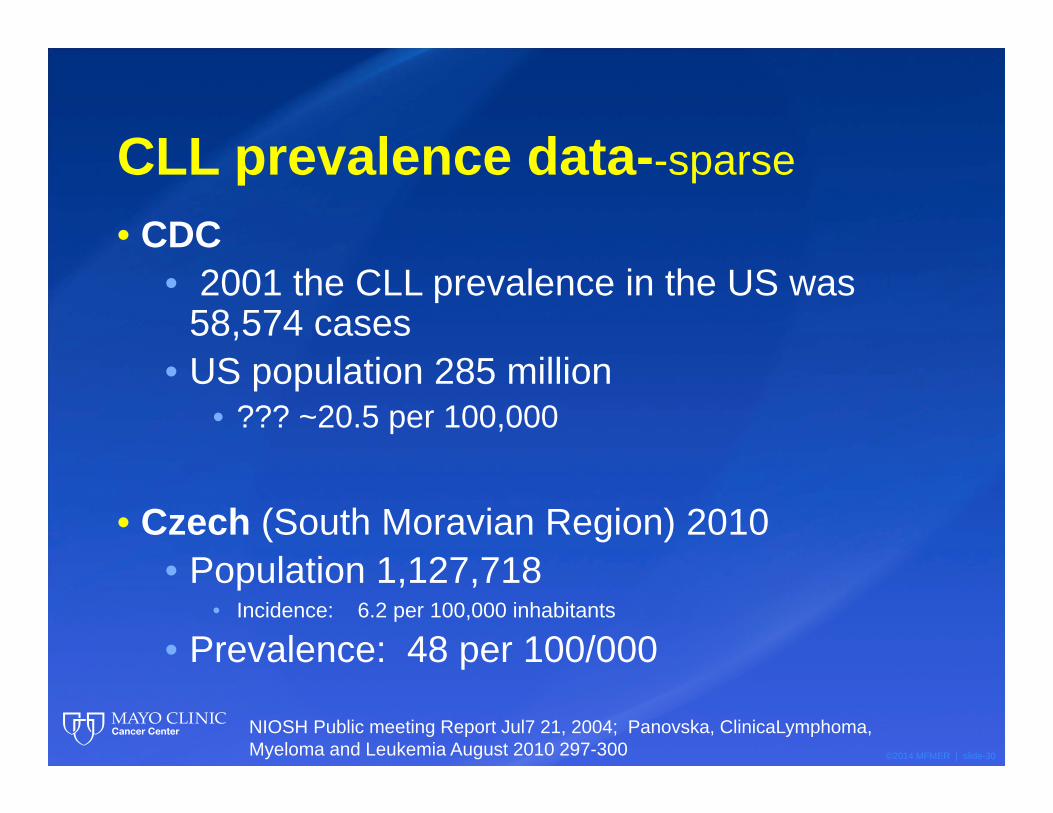
CLL prevalence data--sparse
• CDC• 2001 the CLL prevalence in the US was
58,574 cases • US population 285 million
• ??? ~20.5 per 100,000
• Czech (South Moravian Region) 2010• Population 1,127,718
• Incidence: 6.2 per 100,000 inhabitants
• Prevalence: 48 per 100/000
NIOSH Public meeting Report Jul7 21, 2004; Panovska, ClinicaLymphoma, Myeloma and Leukemia August 2010 297-300
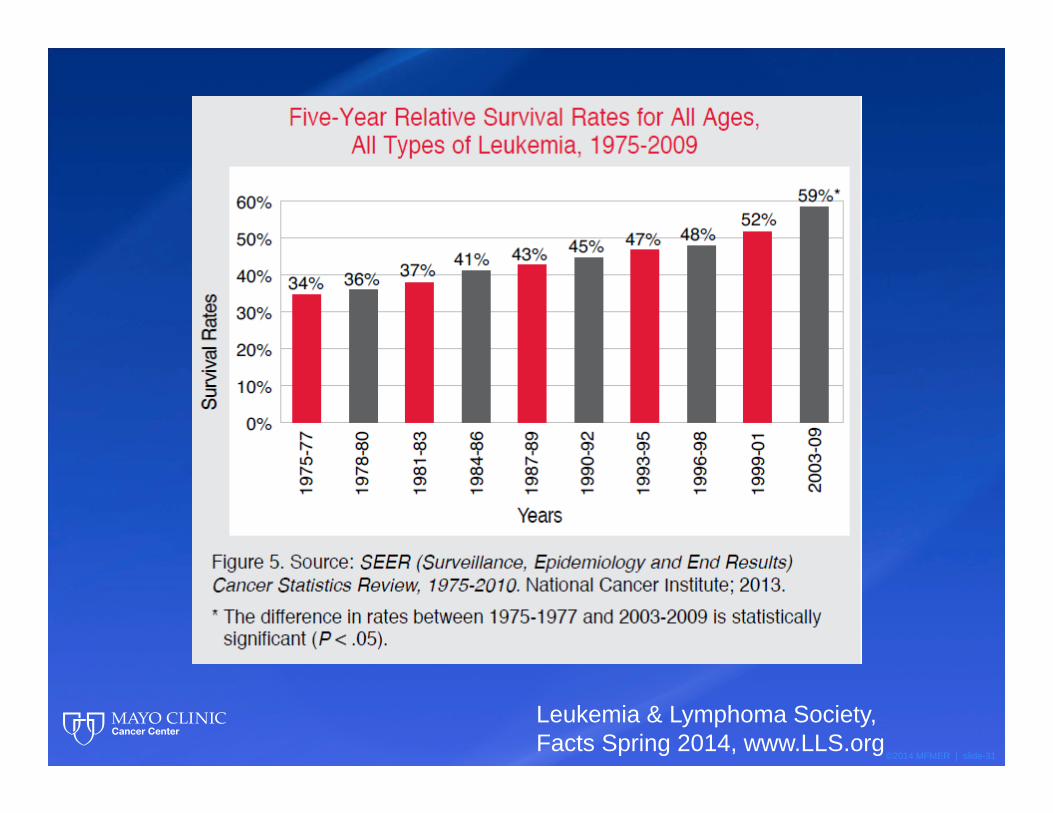
©2014 MFMER | slide-31
Leukemia & Lymphoma Society, Facts Spring 2014, www.LLS.org
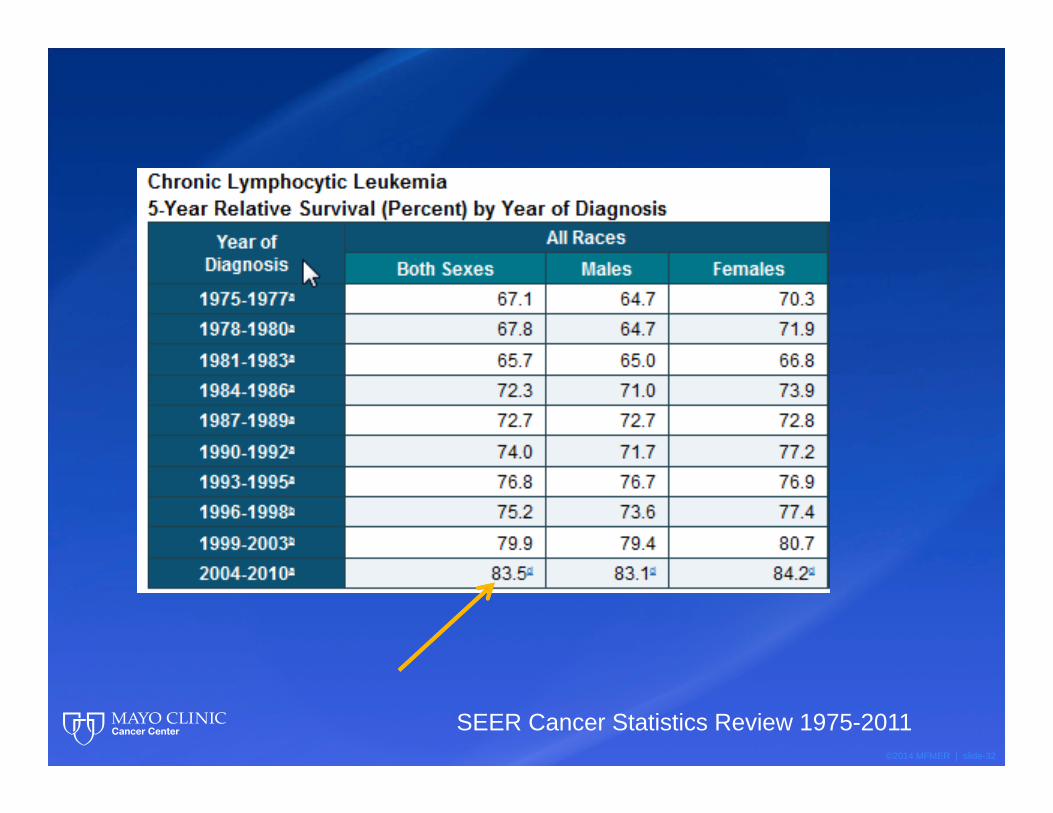
©2014 MFMER | slide-32
SEER Cancer Statistics Review 1975-2011
©2014 MFMER | slide-33
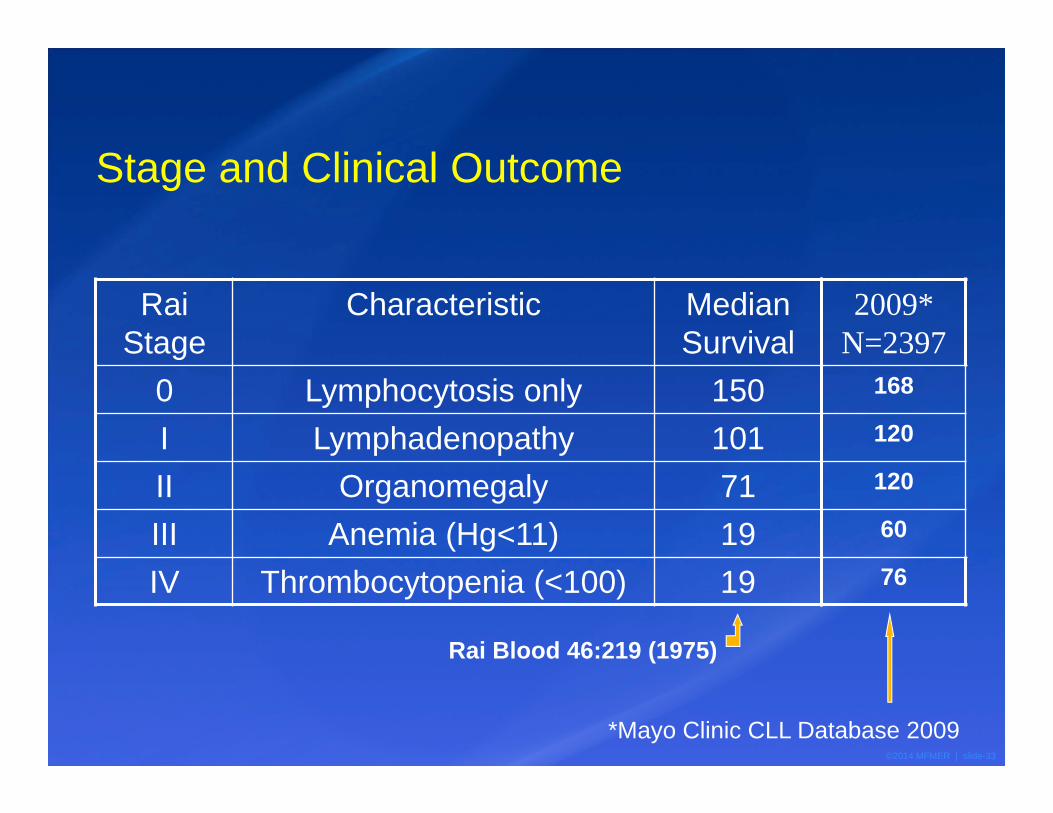
Stage and Clinical Outcome
Rai Stage
Characteristic Median Survival
0 Lymphocytosis only 150I Lymphadenopathy 101II Organomegaly 71III Anemia (Hg<11) 19IV Thrombocytopenia (<100) 19
2009* N=2397
168
120
120
60
76
*Mayo Clinic CLL Database 2009
Rai Blood 46:219 (1975)
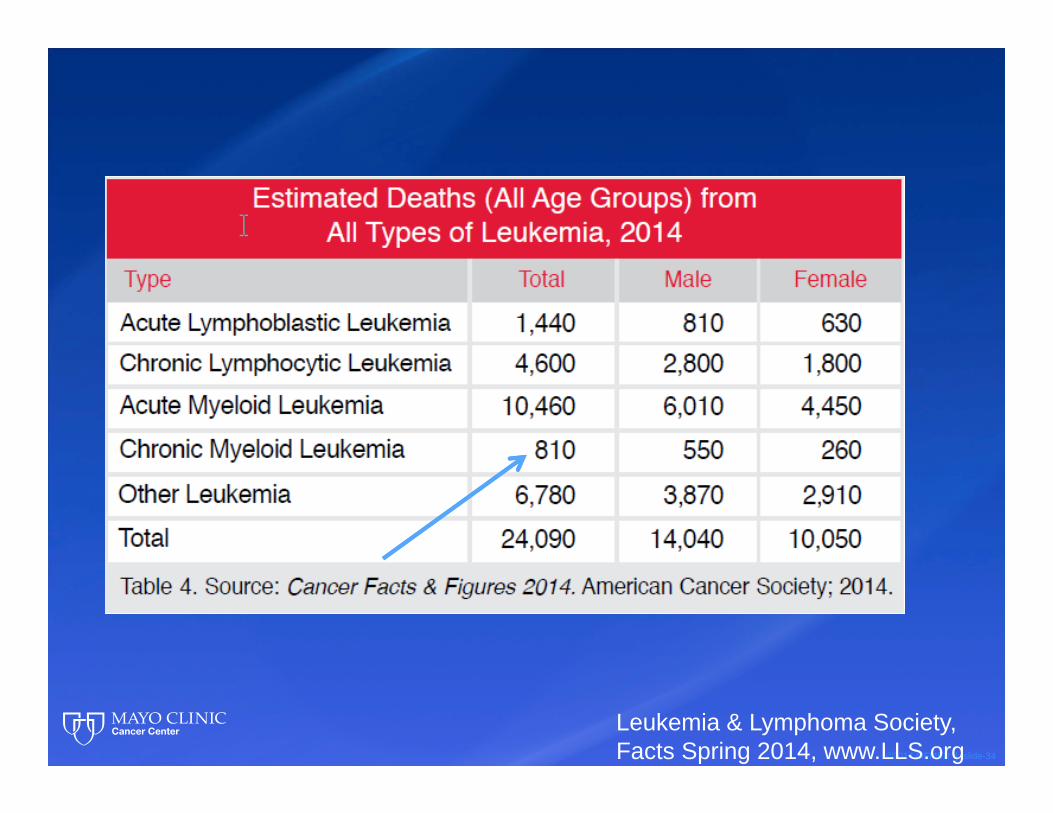
©2014 MFMER | slide-34
Leukemia & Lymphoma Society, Facts Spring 2014, www.LLS.org
©2014 MFMER | slide-35
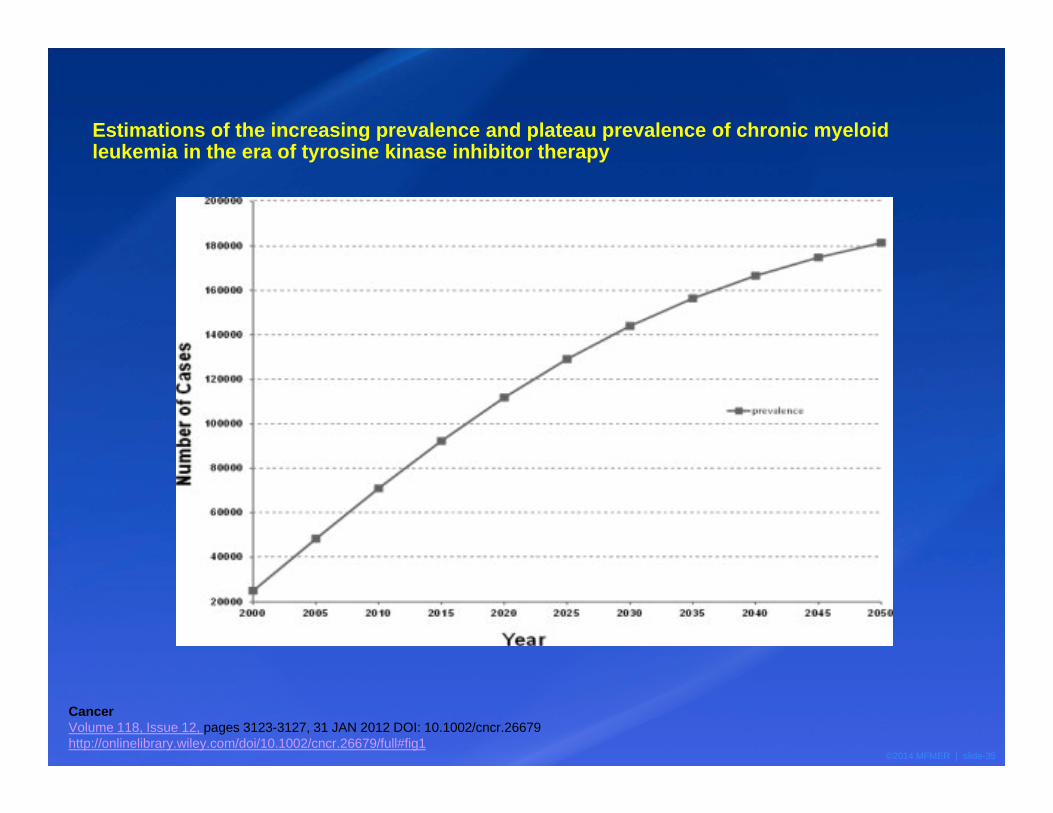
Estimations of the increasing prevalence and plateau prevalence of chronic myeloid leukemia in the era of tyrosine kinase inhibitor therapy
CancerVolume 118, Issue 12, pages 3123-3127, 31 JAN 2012 DOI: 10.1002/cncr.26679http://onlinelibrary.wiley.com/doi/10.1002/cncr.26679/full#fig1
©2014 MFMER | slide-36
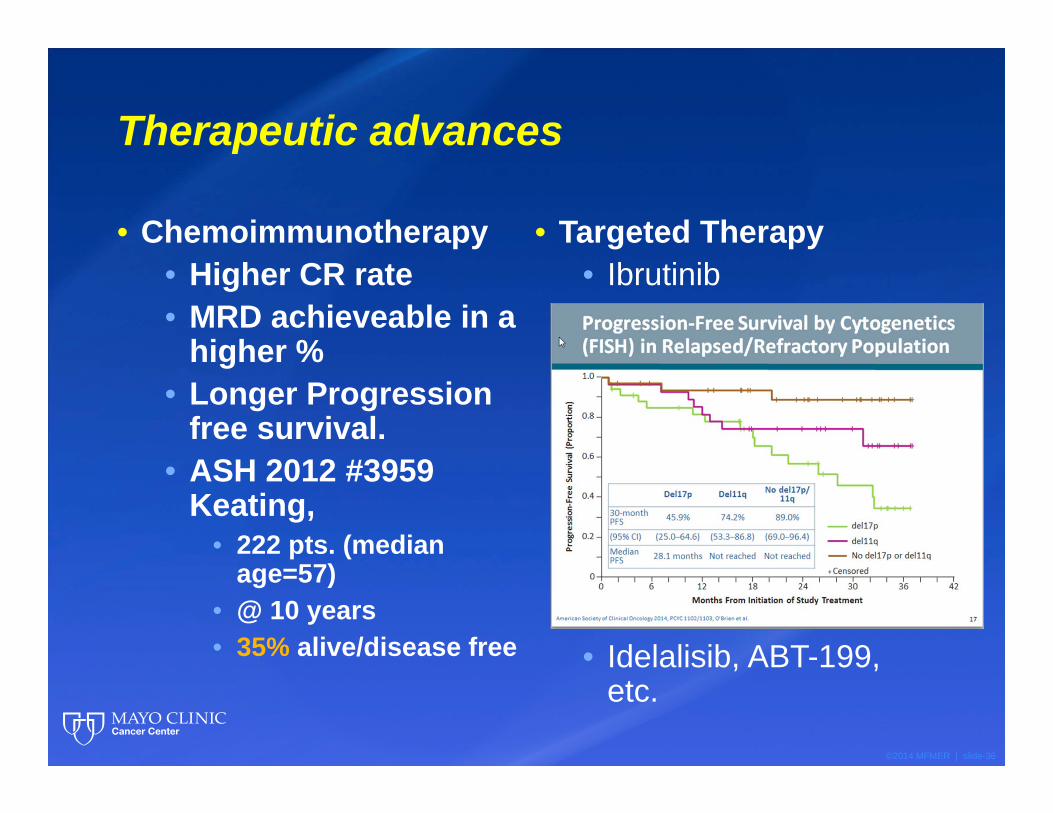
Therapeutic advances
• Chemoimmunotherapy• Higher CR rate• MRD achieveable in a
higher %• Longer Progression
free survival.• ASH 2012 #3959
Keating, • 222 pts. (median
age=57)• @ 10 years• 35% alive/disease free
• Targeted Therapy• Ibrutinib
• Idelalisib, ABT-199, etc.
©2014 MFMER | slide-37
One can only postulate that prevalence will rise significantly
• This data could• Have impact on health policy• Incentivize drug development• Alter practice patterns• etc.

©2014 MFMER | slide-38
How does this effect practice?
©2014 MFMER | slide-39
MBL• Develop practice guidelines/models• Recognize risks of
• Disease progression• Increased infection risks• Secondary cancer risks
• Establish an ICD code• Currently it can coded as:
• CLL• Lymphocytosis• Atypical lymphocytosis• Lymphoproliferative disorder
©2014 MFMER | slide-40
CLL
•It’s not as “good” a leukemia as it used to be.
©2014 MFMER | slide-41
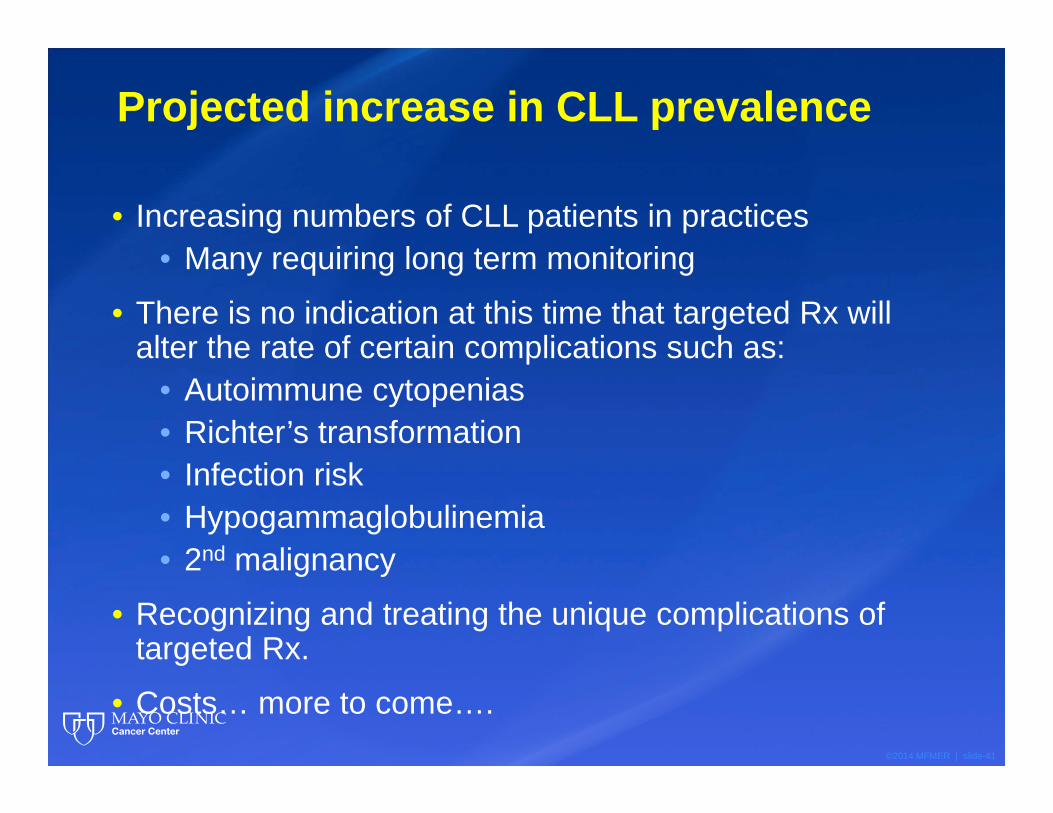
Projected increase in CLL prevalence
• Increasing numbers of CLL patients in practices• Many requiring long term monitoring
• There is no indication at this time that targeted Rx will alter the rate of certain complications such as:
• Autoimmune cytopenias• Richter’s transformation• Infection risk• Hypogammaglobulinemia• 2nd malignancy
• Recognizing and treating the unique complications of targeted Rx.
• Costs… more to come….
©2014 MFMER | slide-42
“Studies such as these are not glamorous in the current medical climate, but are of considerable interest to investigators who are attempting to establish relationships between disease and etiologic factors and are seeking ways to improve the public health.
The medical profession can only hope that the process of monitoring the incidence of various diseases in studies such as these will continue and be expanded. In trying to conquer leukemia, we must seek clues from every avenue and provide accurate data ….for comparison with those being gathered elsewhere.”
Leukemia, Whither Goest thou?Michael J KeatingMayo Clinic Proceedings 1994, 69:4 397-398
Acknowledgements
• Susan Slager, Ph.D
• Kari Rabe, M.S.
• Jim Cerhan, M.D., Ph.D.
• Susan Schwager
• Asher Chanan-Khan MD
• Curt Hanson, M.D.
• Joe Leis, M.D., Ph.D.
• Tait Shanafelt, M.D.• Neil Kay, M.D. • Wei Ding, MBBS, Ph.D.• Sameer Parikh, MBBS• Debbie Bowen, CNP• Michael Conte, PA-C.
©2014 MFMER | slide-44
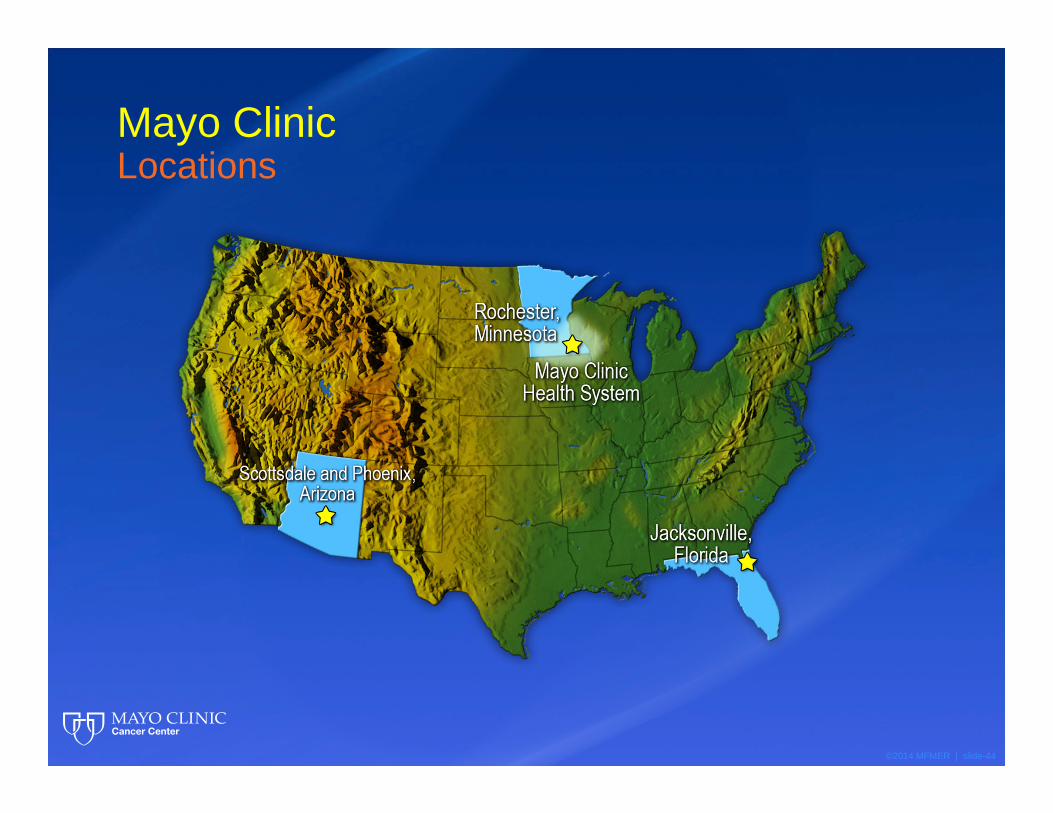
Mayo ClinicLocations