CLINICAL VERSION - Biofeedback Games | somaticvision.com · 1 CLINICAL VERSION USER GUIDE...
32
1 CLINICAL VERSION USER GUIDE SUpplEmEnt somaticvision.com how are you today? now for the emWave ® sensor For Wild Divine ® finger sensors
Transcript of CLINICAL VERSION - Biofeedback Games | somaticvision.com · 1 CLINICAL VERSION USER GUIDE...

1
CLINICAL VERSION USER GUIDE SUpplEmEnt
somaticvision.com
how are you today?
now for the emWave®
sensorFor Wild Divine®
finger sensors

2
Introduction to the Alive Clinical Features 3
Graph training 4
Absolute Heart Rate Graph 6
Accumulated Smoothness Graphs 8
Accumulated & Spectral Graphs 12
Skin Conductance Graph 14
notes abo BVp Graphing 21
Clinical multi-Session and Single-Session Review 22
Dual Drive Basic Instructions 25
What Can I Achieve through HRV (HR Smoothness) training? 26
the Future of HRV 27
Definitions 28
Contents
Statements in this User Guide Supplement have not been evaluated by the FDA. Alive is not intended for use as a treatment tool for heart disease and/or other medical conditions and Alive makes no claims as such.

3
Introduction to the Alive Clinical Featuresthe Clinical Version of Alive includes many features that make professional use of Alive easier and more effective when working with patients. this User Guide will give you in-depth information about all the advanced graph training features and how they work. We also provide some useful tips for training with the vaarious graphs.
First, however, there are some basic functionalities that you will want to be aware of as you begin using Alive in your practice.
uNLOCkINg thE mAIN mENu
When working with new Alive user profiles in a clinical setting, you may not want each new user to go through Alive’s orientation sequence, which in the standard version is a requirement whose successful completion unlocks the main menu (once the main menu is unlocked, the user can begin playing Games, taking Workshops, and exploring Environments).
You may want instead to introduce your patient to breathing techniques and biofeedback concepts in your own way, and then incorporate Alive biofeedback training according to your program.
In this case, the Alive Clinical Version allows you to unlock the main menu at any time with a simple click of the bACkquOtE ( ` ) key after selecting a user. You can also use the bACkquOtE key to reset any user’s statistics if you wish. this can be helpful if, for example, the first few sessions with a patient were uncharacteristic of their further performance; resetting the user statistics can create the opportunity for a new range of averages and data to be built that
better reflects the user’s current condition and rate of progress.
to begin graph training, go to Alive Workshops from the main menu, select gRAph tRAININg, and then select gRAph mOdE.
tO upgRAdE
Upgrading to the Clinical Version from the standard version of Alive is easy! Once you have purchased the upgrade, you will be given a serial number.
Open 1. Alive
From the main menu, navigate 2. to ALIVE WORkShOpS, then to gRAph tRAININg
Select Skin Conductance Graphs 3. from ChOOSE gRAph
the dialog will give you an 4. opportunity to enter your clinical serial number, which will unlock all the Alive clinical features.
Location of the backquote key, which unlocks the Main Menu

4
Alive Workshops offer heart rate graph training. the clinical version of Alive includes advanced graphing screens dis-playing real-time calculations derived from heart rate and skin conductance data.
thE mENu bAR
press ChOOSE gRAphS to select a graphing method. the clinical version of Alive includes Absolute Heart Rate Graphing, Accumulated Smoothness Graphing, Accumulated and Spectral Graphing, and Skin Conductance Graphing.
press bACk tO mAIN mENu to return to the Alive main menu. press pLAy/pAuSE to begin or pause a recording session. Once you press pLAy to begin recording a session, the pAuSE button will appear. press StOp to end a session.
Use the Add COmmENt window to add a comment during a session. Enter the comment and press the plus (+) sign to save it. A broken horizontal line will appear on the screen to mark the time of the comment. While reviewing the session, indexed comments will be shown together with all the related data (such as heart rate smoothness) at the moment of indexing.
gRAph WINdOWS fOR ALL gRAphINg mOdES
heart Rate Your heart beat is determined by the number of beats per unit of time, often expressed as beats per minute (Bpm). In Alive, data to calculate your heart rate is sampled 30 times per second.
pacer the pacer line helps you maintain your optimal breathing pace. Aim to breathe in as the line rises, and breathe out when it falls. Breathe effortlessly and evenly, without holding your breath. the pacer line will follow you at the optimal pace you have chosen throughout the array of Alive environments and games.
Your HRV (Heart Rate Variability, in Alive referred to as Heart Rate Smoothness) is greatly influenced by breathing. You can use the Alive Breathing Coach to determine your optimal breathing pace. the optimal breathing rate varies from individual to individual. A breathing rate of between 7.5 to 10 seconds per breath (6-8 breaths a minute) can help you achieve higher HRV smoothness.
What is heart Rate Variability?
most people assume that the length of time between each heart beat — called the Inter Beat Interval (IBI) — is the same. However, a normal heart beat is slightly irregular and there is some variation between one beat and the next.
the natural variation of time between heart beats is known as Heart Rate Variability (HRV).
Graph training

5
the Alive integrated pacer is set by default to its fastest speed of 7.5 seconds to a breath. As you get more comfortable breathing slowly, you will want to slow the pacer rate using the (+) sign. You can speed up the pacer using the (-) sign.
thE SmOOthNESS SLIdER
the slider is a visual display of the current smoothness of your HRV. the red region of the slider represents an uneven HRV, blue means you are progressing well toward achieving smoothness, and green means you are there!
tIpS fOR tRAININg IN ALIVE WORkShOpS
Using the Alive Breathing workshops will help you create positive changes in your HRV smoothness pattern and will help in balancing your nervous system.
Using the Alive mindfulness workshops and techniques in the User Guide will teach you how to achieve a quiet mind while effortlessly breathing, and will help you achieve a smoother HRV.
the Alive Finding Gratitude and Zoom Out workshops will help you shift away from a stressful state toward positive emotions and can improve social connection, a scientifically proven way to achieve greater HRV. Using these techniques will help you maintain a greater HRV for longer durations, compared to solely practicing the breathing techniques.
the Alive & beyond 8-week program in the main Alive User Guide combines physical exercise with self-regulating, cognitive, and behavioral techniques. this program helps you build commitment to the lifestyle changes needed to better manage stress. You will find that following the program improves HRV both in achieving smoother lines and gradually increasing amplitude.
Continuous training with HRV will allow you to keep a calm state and a clear mind even during intense stress. Our mind tends to focus on the negative aspects of a situation when we are stressed, and we tend to dwell on them; emotionally charged thoughts tend to “break” the wave line. When confronting a stressful situation such as an argument with a colleague at work, try sitting in front of the line graph, using the “following the line” technique — begin your exhale when the heart rate line begins to turn downward after an ascent, as shown below:
Focus on smoothing your exhale while letting your emotions be as they are.
You will gradually sink into smooth breathing, and you will notice your perspective beginning to change. Your thoughts start to lessen their intensity. If they remain very intense, try counting while exhaling: one 1000, two 1000, etc. Gradually focus on a different aspect of your day while inhaling, keep counting, and let go while exhaling. You can use the line graph this way to prepare yourself for sleep or to deal with stressful situations.
Following the line with breathing

6
this graph shows the changes in heart rate over time as the heart beat speeds up and slows down in patterns. Each cycle is influenced by breathing: the heart rate increases while you are breathing in, and decreases while you are breathing out.
the heart rate line is shown in orange. Each green dot along the heart rate line represents the average heart rate at that point in time. Smooth heart rate changes (a heart rate line that looks like regular waves) are healthy. Smooth heart changes allow for optimal mental function, and are associated with positive emotions such as appreciation or love.
Stress causes uneven changes in your heart rate. most people’s heart rate changes look irregular most of the time. Although your heart rate changes may never be perfectly smooth as you use Alive, you will increase the amount of time spent in positive states and will have increasingly smooth heart rate changes and a more balanced nervous system. Following the Alive & beyond 8-week program in the Alive User Guide will help you increase your smoothness more quickly and reliably.
Some things you may want to experiment with while using this graph:
the ideal length of time for most people from the beginning of one “wave” of variability to the beginning of the next is 10 seconds (also called the resonant frequency of 0.1 Hz). Creating this wave is an excellent way to recover from stress and to create a happy and healthy mind and body. try creating this 10-second wave, perhaps using the Alive breath pacer to help you. many people breathing at 10 seconds per breath (six breaths a minute) will find this too difficult at first, and may experience hyperventilation; if you feel you are trying too hard, or
have a sense of lacking air, start with a faster breathing pace (such as 7.5 breaths per minute). A useful method for Graph training is “following the line” as previously described.
heart Rate Variability (hRV)
HRV amplitude (or range) measures the difference between the average height of your heart rate peaks and valleys. For example, if your heart rate varies from 70 to 90 Bpm in a constant rhythm, then you have 20 Bpm of amplitude. When calculating amplitude, ignore movement artifacts or irregular peaks and valleys. Amplitude decreases with age. A higher range of variability has been found to correlate with good health. Chronic stress can cause a reduction in HRV amplitude. Healthy people under 50 will have a 5-20 Bpm variability range, while those over 50 can feel good about ranges above 5 Bpm. though a very deep breath will cause your heart beat to accelerate and temporarily increase amplitude, avoid breathing too deeply as this can lead to dizziness or nausea. Breathe evenly, and naturally.
After training for awhile, see if you can feel the heart rate changes during the breathing cycle. place two fingers on your right hand just above the wrist or against the carotid artery in your neck while watching the heart rate line rise and fall.
Absolute Heart Rate Graphing

7
1. Heart rate line2. Heart beats per minute 3. Breath pacer line4. Smoothness slider
1
2
3
4
Buttons, from left to right along the top of the screen:
ChOOSE gRAphS the clinical version of Alive includes Absolute Heart Rate Graphing, Accumulated Smoothness Graphing, Accumulated and Spectral Graphing, and Skin Conductance graphing (SCL is for IOM sensor only).
bACk tO mAIN mENu takes you back to the Alive main menu.
pLAy/pAuSE Begins or pauses a recording session. Once you press pLAy to begin recording a session, the pAuSE button will appear and so will the Add COmmENt window (see explanation below).
StOp: Stops recording a session
Add COmmENt type comments here during training and press (+) to save it.
AbSOLutE hEARt RAtE gRAph fEAtuRES

8
this graph shows progress during a training session using a three-color linear display.
Accumulated Smoothness
When your HRV is smooth (when the heart rate line is smooth) the slope of the line rises and the color of the line is green. When your smoothness is medium, the line color is blue, and its slope will be more moderate. the slope falls and the line is red when your HRV is uneven.
You are aiming to keep an upward movement as long as possible and to recover from a downward movement as quickly as you can.
Longest time smooth
While training, you will probably find yourself shifting between smoothness zones. most people start a training session with the red bar dominating as they begin. As you breathe and relax, your time in the blue and green zones will increase. this index shows you the longest period of time during each session that you were steadily staying in the high smoothness zone.
total time smooth
this index shows you the total period of time in seconds during each individual session you were staying in the high smoothness zone. Alive recommends your training includes staying in the smooth zone at least ten minutes a day.
Average time smooth
Average time smooth scores your level of smoothness in seconds on a scale between zero and one hundred, with zero representing a lack of any smoothness, and one hundred the ideal target.
your time in the different zones of smoothness
Your time in the zones of smoothness (high, medium and low) is shown using three real-time bars that show the relative time you stay in each zone up through the latest point in time.
High smoothness is represented by a green bar, medium smoothness by a blue bar, and uneven HRV or low smoothness by a red bar. the time you spend in zones will always add up to one hundred percent. While training, you aim to achieve the highest percent score in green, meaning you spent most of the time in the high smoothness zone.
Accumulated Smoothness Graphing
Average Smoothness
Your average smoothness number, represented in percentage from zero to one hundred, is a good way to track your HRV. An effective training session will include average smoothness above 50%.
Because it is an accumulating score, average smoothness will quickly change during the first few minutes of a training session, as at this stage the statistics are based on a small amount of data.
the average smoothness value begins to be meaningful three minutes into the training session, having collected enough data to reflect a true average.
As you lengthen the period of training time, average smoothness changes will be slower and more modest.

9
1. Heart rate line2. Accumulated smoothness3. Heart beats per minute 4. Adjustable breath pacer line, in seconds5. Longest time smooth, in seconds6. Total time smooth, in seconds7. Average time smooth, in seconds8. Your time in different zones of smoothness9. Smoothness slider
1
2
3
4
5
6
7
8
9
ACCumuLAtEd SmOOthNESS gRAph fEAtuRES
teaching and training abdominal effortless breathing.Clinical Tip: Focusing on the pacer or on the heart rate vaiability line (see technique) improves the ability to “let go” while practicing.
Seeing the baseline of the autonomic balance in the beginning of the session while resting, then watch what is happening when recalling a stressful event and after observe what happens when using a breathing or a mindfulness technique.
Continued on the following page
uSE thIS gRAph WhEN...

10
training for peak performance. Getting into the zone (high smoothness zone — the green bar) quickly and sustaining the smoothness is an important target. See Example 1 on the facing page.
As you are able to increase the time in this zone it enhances mental clarity, concentration and decision making.
After trainig for a while with this graph display you may want to use the different environments and games to increase the flexibility of your autonomic nervous system as you are challenged.
you are in-between sessions or for home training. try using this graph to achieve high smoothness scores at least 5 times a day for 3-5 minutes each time:
• Just after waiking up, to tune up and get in synch.
• During two break times at work, to avoid stress accumulating and to improve mental clarity (try the mini- mental breaks or the 5-minute breathing break)
• At the end of the day to recover from the stresses of the day and return to balance
• Just before sleep, to ensure a deep and refreshing sleep.
you want to see how thoughts and emotions effect the heart rhythm.
When your emotions need managing, a few minutes of high smoothness state can make a noticabe difference. When you find yourself worried or your attention focused on the negative aspects of the situation staying a few minutes in the high smoothness zone can help gaining a more balanced viewpoint.
you are about to engage in a competition or take a test. You can increase your smoothness to get your emotions balanced and your mental performance high on demand.
you want to mprove the flexibility of your nervous system. practice shifting from an alert to a calm and relaxed state.
You can use the accumulated smoothness graph to get anice feedback of the ability to shift quickly from state to state.
this is a good display to use when doing a desensitization while in CBt imaginal exposure .
See Example 2, on the facing page, showing a shift from a green upward slope to a red downward slope.
uSE thIS gRAph WhEN... Continued
ALIVE tEChNIquES tO bE uSEd VIEWINg thIS gRAph
Use this graph mode when practicing the various Alive breathing Workshops/techniques: Paced Breathing, Advanced Breathing, Mindfulness of Breath and 5-Minute Breathing Break). This graph is also useful when practicing Finding Gratitude and Trust. See how your heart rhythms become smoother.

11
Example 1, referenced on page 10 Sustaining high HRV smoothness levels
Example 2, referenced on page 10 Improving flexibility

12
this graph view includes a frequency bar graph as well as heart rate measures and the breath pacer.
heart Rate, page 9
Accumulated Smoothness, page 11
Average time smooth, page 11
total time smooth, page 11
Spectral power Ratio — Lf/hf
the HRV smoothness slider in Alive moves to the green when there is a lot of low Frequency (lF) activity, shown as large repeating waves around 0.10 Hz.
All of the Alive breath pacer speeds are well within the lF range of 0.04 to 0.15 Hz (which translates into 4 - 25 seconds per cycles).
therefore, breathing at any speed the breath pacer can be set to generates lF frequencies in the heart rate. High Frequency (HF) activity (0.15 to 0.40 Hz), momentary activation of the sympathetic nervous system, as well as other frequencies all interfere with the wave causing seemingly erratic changes.
High lF/HF ratios (a lot of lF, little HF) show as smooth in the slider (although the slider algorithm is more complex than this).
frequency spectrum
A summary of effective training options and information to get from the frequency analysis graph:
• Creating a peak around 0.10 Hz leads to optimal HRV. A peak around 0.10 (in the target zone of the HR Spectral Graph) indicates that your heart rate is increasing and decreasing at around 0.10 Hz. this corresponds to a 10-second increase and decrease cycle, a 10-second-per-breath breathing rate.
• Higher peaks (0.15, 0.20) could indicate faster breathing, lower peaks (0.05) could indicate slower breathing. A peak within the target zone, with the rest of the HR spectral line low, reflects optimal HRV and is shown simply by a rise in the HRV bar.
Accumulated and Spectral Graphing
understanding the Spectral graph
the Spectral Graph adds the power spectrum display — a kind of a window into the dynamics of our autonomic nervous system.
Very low frequency usually correlates with a “busy mind” and stronger sympathetic activity.

13
1. Heart rate line2. Accumulated smoothness3. Heart beats per minute 4. Adjustable breath pacer line5. Frequency spectrum6. Longest time smooth, in seconds7. Total time smooth, in seconds8. LH/HF9. Your time in different zones10. Smoothness slider
1
2
3
4
5
6
7
8
9
10
ACCumuLAtEd ANd SpECtRAL gRAph fEAtuRES
you want to train while your mind is calm. try to lower the bars in the very low frequency range while achieving high activity around the 0.1 zone. When in deeper relaxation, you may also see the 0.2 hz bar and the bar to the left of it also rise. See example below.
uSE thIS gRAph WhEN...

14
psychophysiologists have used skin conductance for many years as a sensi-tive index of bodily arousal related to emotion and cognitive processes. SCl is influenced by sympathetic stimulation of eccrine sweat glands in the skin. Sympa-thetic activity is linked to emotional and cognitive states.
Autonomic activity that is emotion-related has an important role in the maintenance of and consequences of stress-related psychopathology such as anxiety disor-ders. Chronic high levels of sympathetic arousal are hallmarks of anxiety disor-ders. Interventions that lower autonomic arousal are very helpful in the reduction of stress and anxiety and they contribute to feelings of well-being.
the Alive biofeedback device measures the electrical conductivity of the skin through two electrodes and compares this value to baseline readings. the SCl is measured in mho, conductance of elec-tricity across the skin surface.
the level of conductivity is directly linked to the level of sweat gland activity which is affected by sympathetic nervous system activity. Higher arousal will almost in-stantaneously (approximately 0.5 second delay) cause a rise in skin conductance; reduced arousal will cause a fall in skin conductance. A rise in skin conductance can indicate a positive state, such as excitement, or a negative state, such as fear; both are states of increased arousal (activation).
Alive’s line graph produces a graphical representation of the SCl almost in real time. We may want to focus on raising or lowering arousal. A low level of arousal is desirable for relaxation,
guided imagery, or hypnosis, and the subjective experience of psychic states and unconscious manifestations. A high level of arousal sometimes contributes to focused concentration, increased memory capacity and sharper reaction to stimuli.
Another aim in training may be keeping arousal within a predetermined zone. Such skill is important for the successful execution of many cognitive or delicate motor tasks. In a stressful environment, it may be important to habituate as rapidly as possible after a sharp rise in arousal.
the Alive SCl graphing screens are designed to enable such training to be done in the most effective and fun ways. Sessions are saved for later reference.
SCL % to target
After defining a target SCl, once you approach your target and enter the zone defined, the bar graph will rise according to the percent away from your predetermined target level. the bar shows % between starting SCl and target SCl. the bar is full when we reach or surpass the target SCl. the target SCl line may be above or below the starting SCl line.
SCL
the SCl line graph helps track changes in arousal level over time. to only view the SCl line, use the hIdE buttons.
Baseline level is automatically presented as a white broken line and will show as long as the training session runs.
Starting SCl and target SCl help you define the aim of the training. Both can be dragged up and down, giving you flexibility in changing the criteria during training and effectively adapt it to the training goals.
Skin Conductance GraphingSCL Graphing works with the IOM finger sensors only

15
1. Skin conductance line (SCL) 2. Sweat stability 3. Heart beats per minute 4. Adjustable breath pacer line 5. SCL % to target bar graph 6. SCL stability 7. Starting SCL, uSiemens (Mho) 8. Max SCL, uSiemens (Mho)
9. Baseline SCL, uSiemens (Mho) 10. Target SCL, uSiemens (Mho) 11. Min SCL, uSiemens (Mho) 12. Current SCL, uSiemens (Mho) 13. SCL % to target 14. Average SCL, uSiemens (Mho) 15. Audio options 16. Smoothness slider
1
2
34
5
6 7
10
13
8
11
14
9
12
15
16
SkIN CONduCtANCE gRAph fEAtuRES SCL Graphing works with the IOM finger sensors only
SCL Stability
Shows the current value of sweat stability.
Sweat Stability Line
Fluctuations in SCl are another measure of autonomic responses, correlating with intensive cognitive activity and emotional changes. this line graph will head down as fluctuations are greater. the smoother the SCl line declines the greater the relaxation ability and the higher the sweat stability line will appear. Sharp drops of the sweat stability line mean unease or troubled mind.
Audio Options
You may want to hear audio feedback while entering the defined zone. Set the volume of audio feedback while entering the zone and reaching target SCl.
Autorange
the AutORANgE button above the SCl graph will help track changes in SCl response while automatically keeping your SCl response in view. the AutORANgE buttons in the starting and target panels set the starting and target SCl values based on the current SCl.

16
you want to demo the mind body connection. You can find a walkthrough of an Alive body-mind connection demo at http://www.somaticvision.com/biofeedback-demo.
training to shift attention. Show arousal building up while a negative emotion is elicited, and returning to the baseline while making an attention shift. See Examples 1 and 1A on the next page.
training to quiet the mind after a period of rumination. the bar graph on the left will reach 100 percent as mind quiets. See Example 2 below.
Cultivating arousal in depressed* patients and for peak performance. See Example 3 on page 18
training to achieve a state of calm mind together with a high smoothness state. See Example 4 on page 18.
uSE thIS gRAph WhEN...
Example 2, referenced above
* The statements on this page have not been evaluated by the FDA. Alive is not intended for use as a treatment tool for depression or other medical conditions.

17
Examples 1 and 1A, referenced on the previous page Quieting the mind after a negative emotion was elicited causing a sharp rise in SCl. Using an attention-shifting technique helps return to baseline. notice the 100% score in sweat stability in the bottom blue bar.
Techniques in Alive that can be used for this training are the Body Scan, Mini Mental Breaks, Mental Imagery, and Safe Place.

18
Example 4, referenced on page 16 Quieting the mind and maintaining high HRV smoothness (coherence).
Example 3, referenced on page 16

19
A demonstration of the mind-body connection: Suggest the trainee relax, as you both watch the SCl line as it goes down. Once in a downward movement and after 2-3 min, tell your trainee that you are going to ask a difficult question. the trainee’s anticipation will usually cause a rise in arousal level, and the line graph will shoot upward.Watch the arousal level go up as you laugh, as you hear an unexpected noise in your surroundings, or as any change in the environment suddenly occur such as the opening of the door. It is important to show the trainee that tiny hand movements can also cause a rise in the SCl to familiarize him with this possible artifact.
Ask the trainee to perform a difficult arithmetic exercise such as subtracting 13 from 1000 continuously. Watch the rise in line due to performance effort.
Ask the trainee to take a very deep breath or breath rapidly to cultivate arousal.
Systematic desensitization
After creating hierarchies for anxiety provoking stimuli, SCl graphing is very helpful in showing the reduction in autonomic arousal as the process of exposure and desensitization advances.
It is important to notice that while laughter or deep breathing causes skin conductance level to increase, when those triggers are not emotionally arousing the return to baseline level is expected to be fairly quick. When
a stimuli is emotionally arousing a prolonged SCl response will be evident.
While using SCl biofeedback in therapy, it is important to remember that the situation may feel very intrusive to the trainee who may feel the trainer “sees” through him…
under-reactors vs. over-reactors
Under-reactors are those whose SCl changes very little in response to internal or external stimulation. these people tend to lack awareness of subjective feelings of internal body processes or emotions. Over reactors respond to stimuli with a sharp rise in SCl. they sometimes report feeling of extreme numbness while engaged in relaxation training and they find it hard to lower their SCl at will. It sometimes appears as if they are “addicted” to high arousal states.
there is no ideal skin conductance level; rather, training with SCl biofeedback increases the ability for self regulation (i.e., flexibility) in reaction and habituation. Self-regulation with the help of skin conductance biofeedback helps people learn to decrease sympathetic arousal, thereby improving their emotional regulation and cognitive performance.
It is important to remember that many factors influence the measurement. these include: room temperature, skin variables (thickness, dryness etc.), time of the day (due to circadian rhythms), use of caffeine or alcohol, times of meals or quality of sleep and more. the SCl varies from person to person and it is important to not to make any comparisons between people.
SOmE tIpS fOR tRAININg WIth thE SCL gRAphS
SCL Graphing works with the IOM finger sensors only

20
This session image shows a 5-minute segment beginning at 15:39 minutes in and continuing until 19:50 minutes in. The trainee was instructed to relax, and for a period of 3 minutes he is doing very well. Then at 18:50, a sharp rise appears due to a very disturbing thought. We can see the rise in the SCL line and the fluctuations in the sweat stability.
In the example immediately above, a very nice period of relaxation is interrupted by the trainee reaching the zone, becoming excited about the fact he has reached his goal, and then “losing it” as a consequence. Training helps cross the target with less fluctuation.

21
notes about BVp Graphing
you want to make sure that the pulse reading is accurate. tHE BEAtS-pER-mInUtE nUmBER WIll AppEAR ABOVE EACH SpIKE. See Example 1 below.
training for hand-warming. Watch how the volume of the blood increases. See Example 2 below.
training to “let go” after progressive muscle Relaxation. You will notice a change in blood volume due to the relaxation response.
uSE thIS gRAph WhEN...
Example 1
Example 2

22
Alive enables a comprehensive clinical review of session statistics. After clicking pROgRESS REVIEW and before clicking mORE INfO (clinical view) you can choose which set of sessions to review in the hIStORy drop down.
this way, you can review changes in heart rate smoothness(HRV), or other statistics, for all sessions, or only for sessions of a general type, such as games, or specific type, such as only Dual Drive™ sessions, or only muscle Relaxation sessions, and see change for sessions of that type.
gRAphS dISpLAyEd
Average Smoothness Here you can see the change in average smoothness for each session. this is a general indicator of how well the user did for each session.
An increase in average smoothness over the series of sessions shows improvement
in the user’s control of their heart rate smoothness, and is a positive trend.
min and max Smoothnessthe minimum smoothness during a ses-sion. the lowest smoothness read during the session can show how consistent the user is at keeping a high smoothness. Was the user able to avoid their smoothness dropping to 0 during the session?
the maximum smoothness during each session. the highest smoothness read during the session shows the user’s potential for reaching high smoothness. Initially many users cannot reach maximum smoothness at all, with their personal maximum for the session being between 25 and 50 percent.
Was the user able to reach a high smoothness during each session? An increase in maximum smoothness over time shows an increase in the user’s ability to reach states of high heart rate smoothness.
Clinical multi-Session Review

23
Session Start Smoothness Average smoothness for the first 15 seconds of the session. this is a “baseline” measurement showing the state of the user at the session start.
Before training how smooth was their heart rate? this is useful when compared to the average smoothness, or session end smoothness, to see if the user was able to effectively use the training to raise their heart rate smoothness.
Session End SmoothnessAverage smoothness for the last 15 seconds of the session. For this number to be useful, the session should be at least 30 seconds long (15 seconds for the session start smoothness, and 15 seconds for the session end smoothness). Session end smoothness shows the final state of the user at the end of training.
Change in SmoothnessCompares the session start smoothness with the session end smoothness. For this number to be useful, the session should be at least 30 seconds long (15 seconds for the session start smoothness, and 15 seconds for the session end smoothness).
positive values show an increase in smoothness over the session. Conversely, negative values show a decrease. Effective training should show an increase in smoothness over the session.
first third, middle third, and Last third Smoothness Session smoothness broken down into three even sections. If middle third smoothness is greater than last third smoothness for a session, the training time may have exceeded the user’s attention span, or be longer than needed for optimal results.
You can also compare the middle or last third to the first third, or to the session start measurement to look for
improvements in smoothness over the session. For long sessions, comparing the last third to the session start may be useful, as it may provide a more accurate reading of improvement by looking at the entire last third, instead of only the last 15 seconds of the session.
Average heart Rate All average heart rate measurements are average heart rates for a 15-second sliding heart rate window. tracking average heart rate over time has many uses. Average heart rate provides a sign of physical relaxation. A rise in average heart rate may indicate a user is trying too hard, or is stressed by a particular session.
For example, Dual Drive sessions on manual pilot may raise many people’s average heart rate, as they struggle to control the car. A decrease in average heart rate over a series of sessions can indicate greater relaxation. Additionally, average resting heart rate decreases with an increase in physical fitness.
If you wish to measure fitness changes with average heart rate, you should take a session of a fixed time between 15 and 60 seconds, and measure your heart rate consistently each morning upon waking up, just before getting out of bed.
min and max Average heart RateHaving a high minimum heart rate for a session could indicate that the user was less relaxed during the session. Having a low maximum heart rate could indicate that the user was more relaxed.
Change in heart RateCompares the first 15 seconds of heart rate data to the last 15 seconds of heart rate data. A decrease in heart rate from the start to end of the session could indicate an increase in relaxation for the session. An increase in heart rate could indicate that the user is less relaxed. playing an

24
intense game, such as Dual Drive in manual pilot, could raise the heart rate over the course of the session, even if the heart rate changes remain smooth.
If you observe an increased heart rate combined with an increased smoothness for the session this could reflect an ability to remain in a centered state during times of increased stress.
percent Change in heart Rate like the Change in Heart Rate measurement, but shown as a percentage. For instance if the average heart rate for the first 15 sec. is 60 Bpm., which increases to 90 Bpm for the last 15 sec. you would see 50% output here (heart rate is 50% higher at the end).
breath pacer Speed Shows the speed the pacer was set at during the session.
Skin Sweat Change IOM sensors only
Shows the change in skin sweat from the start of the session (first 15 sec. average) to the end of the session (last 15 sec. average). Skin Sweat in Alive is measured as skin conductance, which increases when you are excited. An increase in skin sweat over the course of the session indicates that there were one or more exciting (on the positive side) or scary (on the negative side) moments in the session, or that overall there was an increase in excitement or fear. An overall decrease in skin sweat indicates a relaxed session. An increase in skin sweat can occur when someone is feeling very good, so an increase in skin sweat is not necessarily negative.
Skin Sweat percent Change IOM sensors only
Similar to the Skin Sweat Change measurement, but shown as a percentage. For instance, if the skin sweat for the first 15 sec. is 4 uSiemens (mho), which
increases to 6 uSiemens for the last 15 sec., you would see 50% output here (skin sweat is 50% higher at the end).
Average Sweat Stability IOM sensors only
Stability indicates relaxation — a calm state, without much excitement or worry. Excitement and/or fear creates large skin sweat spikes (followed by drops).
bVp Amplitude Change BVp (blood volume pulse) is the raw signal that the heart rate is derived from. BVp measures changes in blood volume in the arteries and capillaries underneath the ppG (photoplethysmographic) sensor in the finger sensor hardware.
this measure is sensitive to sensory arousal, and breathing (deep, shallow, slow). Changes in BVp indicate changes in blood pressure.
Changes in BVp amplitude also reflect a reaction to emotional stressors. lower BVp amplitude will be evident after a sympathetic activation has occurred (response to a sudden noise, for example). Anticipation anxiety can cause sharp BVp changes. A lasting fearful emotion will mean a slower return to a baseline BVp level.
An increase in BVp amplitude reflects an increase in blood volume and will accom-pany an increase in peripheral tempera-ture, reflecting a more relaxed state.
Clinical Single-Session Review See information above about the multi-session review measurements, which are the same as those featured in single-session review.

25
Alive Games include two versions of the Dual Drive car racing game. Dual Drive Auto pilot enables you to build and mas-ter techniques for self-regulation, while Dual Drive manual pilot challenges you to maintain these self-regulating skills under a more stressful environment.
Autopilot mode
In autopilot mode your heart rate smoothness powers your car. You do not need to move or turn your car. Smooth your heart rate to win.
If your car gets stuck press Ctrl-R. Oth-erwise, you don’t need to steer — here, you relax to build speed.
manual pilot mode Steering
In manual pilot mode, your heart rate smoothness controls your car speed, but you steer your car using a keyboard, joystick, or gamepad.
try to complete each race in as short a time as possible. to do this, relax and use the breath pacer (if you like) to keep the heart rate line smooth and the smoothness slider high, well in the green.
Before you start a race, try selecting and customizing your car.
feedback modes
Use the mOdE button to choose the feedback type: Heart Rate (HR), Skin Conductance (SCl) or HR + SCl.
the calibration options in the SCl mode dialog enable you to optimize gameplay smoothness by manually setting Starting and target SCl. If you do not know your desired range or wish not to override this option, simply check the box for Automatically recalibrate SCl. (You can reopen this window while playing Dual Drive by pressing CtRL-S.
When choosing to play in the HR + SCl mode, your car speed is affected by SCl measures while fog is affected by HR. Keep your heart rate smooth to clear the fog and accelerate by lowering your SCl.
multiplayer option
play with up to 3 opponents over the internet! to create a multiplayer game, choose muLtIpLAyER, then choose CREAtE NEW muLtIpLAyER gAmE. Select a mission, and you’ll see which other players have joined. press StARt to begin playing. (If you are joining a game, after pressing muLtIpLAyER press jOIN muLtIpLAyER gAmE.) Enjoy!
Dual Drive Basic Instructions
keyboard Shortcuts
CtRL-p take a screenshot (saves to my Documents/Somatic Vision Sessions/user)
ALt- full Screen (toggles between windowed mode and Full Screen Dual Drive)
CtRL-R Restart car if you are stuck or have run off the track
CtRL-L Shows list of levels, and the option to change level
move/turn: Forward, Backward, left, Right (manual pilot mode only)
ESC Exit to main menu
t
t
t
t
or ASdW keys
ENtER
26
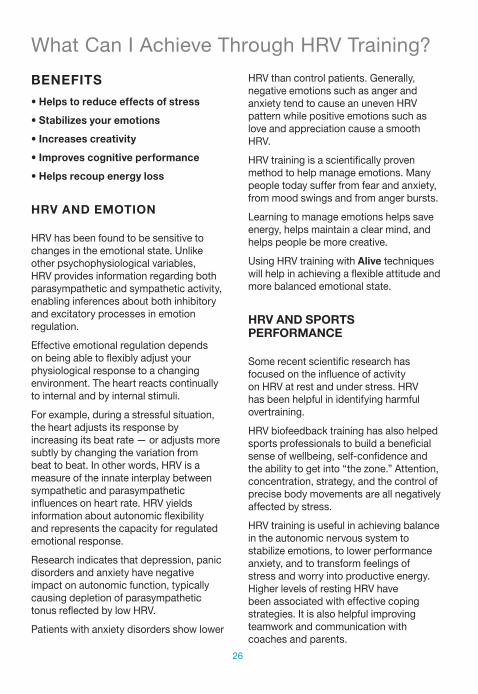
bENEfItS
• helps to reduce effects of stress
• Stabilizes your emotions
• Increases creativity
• Improves cognitive performance
• helps recoup energy loss
hRV ANd EmOtION
HRV has been found to be sensitive to changes in the emotional state. Unlike other psychophysiological variables, HRV provides information regarding both parasympathetic and sympathetic activity, enabling inferences about both inhibitory and excitatory processes in emotion regulation.
Effective emotional regulation depends on being able to flexibly adjust your physiological response to a changing environment. the heart reacts continually to internal and by internal stimuli.
For example, during a stressful situation, the heart adjusts its response by increasing its beat rate — or adjusts more subtly by changing the variation from beat to beat. In other words, HRV is a measure of the innate interplay between sympathetic and parasympathetic influences on heart rate. HRV yields information about autonomic flexibility and represents the capacity for regulated emotional response.
Research indicates that depression, panic disorders and anxiety have negative impact on autonomic function, typically causing depletion of parasympathetic tonus reflected by low HRV.
patients with anxiety disorders show lower
HRV than control patients. Generally, negative emotions such as anger and anxiety tend to cause an uneven HRV pattern while positive emotions such as love and appreciation cause a smooth HRV.
HRV training is a scientifically proven method to help manage emotions. many people today suffer from fear and anxiety, from mood swings and from anger bursts.
learning to manage emotions helps save energy, helps maintain a clear mind, and helps people be more creative.
Using HRV training with Alive techniques will help in achieving a flexible attitude and more balanced emotional state.
hRV ANd SpORtS pERfORmANCE
Some recent scientific research has focused on the influence of activity on HRV at rest and under stress. HRV has been helpful in identifying harmful overtraining.
HRV biofeedback training has also helped sports professionals to build a beneficial sense of wellbeing, self-confidence and the ability to get into “the zone.” Attention, concentration, strategy, and the control of precise body movements are all negatively affected by stress.
HRV training is useful in achieving balance in the autonomic nervous system to stabilize emotions, to lower performance anxiety, and to transform feelings of stress and worry into productive energy. Higher levels of resting HRV have been associated with effective coping strategies. It is also helpful improving teamwork and communication with coaches and parents.
What Can I Achieve through HRV training?

27
the Future of HRVIt is believed that Heart Rate Variability (HRV) will soon become as common in patient charts as pulse, blood pressure or temperature.
the connection between health and the amount of variation in the heart rate was noted as early as the third Century AD. In the last ten years, more than two thousand published articles have been written about HRV, which is being used as a screening tool for many diseases.
many different medical disciplines are looking at HRV. lowered HRV is associated with aging, decreased autonomic activity, hormonal tonus and specific types of autonomic neuropathies. HRV has been proven to be predictive of the likelihood of future diabetes and heart disease events; a reduced HRV is considered a primary indicator of cardiovascular autonomic diabetic neuropathy.*
measuring HRV provides useful information regarding inflammatory changes in the body. Additionally, a reduced HRV was found that among high-risk patients with cardiovascular diseases.
During rehabilitation of patients with cardiovascular disease, a significantly higher mortality rate has been shown in post-infarction patients with reduced HRV compared to patients with normal HRV; it is well documented that low HRV is an independent risk factor for several negative cardiovascular outcomes.
* The statements on this page have not been evaluated by the FDA. Alive is not intended for use as a treatment tool for heart disease and/or other medical conditions.

28
feedback
the return of an output of a system to an input of that same system. the display of the output often affects the input, creating a “feedback loop”. In biofeedback, heart rate is one output from your body that can be fed back to you via a computer monitor, i.e., your eyes and ears are the inputs.
biofeedback
the process of making unconscious or involuntary bodily processes, such as heart rate, more easily observed. the goal of biofeedback is to teach you how to consciously change a bodily process in a beneficial manner.
heart Rate
the number of times your heart beats per minute. A typical measurement of heart rate is based on a 15-second to 1-minute reading of the number of times the heart beats. that number is shown on the bottom bar of the Alive screen.
the heart rate line shown in Alive Graph training mode displays an “instantaneous heart rate,” determined solely from the time between your last two heart beats. this measure is useful in that it reflects real-time changes in heart rate due to breathing, stress and relaxation.
Vagal Nerve Activity
the rhythm of the heart is primarily under the control of the parasympathetic (relaxing) vagus nerve.
Vagal nerve activity lowers your heart rate as you breathe out. As you breathe in, vagal nerve activity decreases and your heart rate rises again. If you are breathing slowly and steadily, and are feeling relaxed — experiencing low sympathetic (SnS) activity — your heart rate will match your breathing due to the activity of the vagus nerve.
heart Rate Variability
Real-time patterns of natural heart rate increase and decrease. When your heart rate follows a continuing pattern of smooth increase in heart rate followed by a smooth decrease in heart rate (about ten seconds per cycle), you have optimal HRV. Optimal HRV is an element in many biofeedback games, including those in Alive. For example, optimal HRV is the measure that the Alive Dual Drive game uses to cause your car to accelerate.
measuring hRV
Short-term HRV analysis requires much shorter recordings – typically five minutes long. typically, such measurements should be done in either supine or comfortably sitting relaxed position, limiting body movements, conversations, or any mental activities. Standards set forth In 1996 by the task Force of the European Society of Cardiology and north American Society of pacing and Electrophysiology include two methods for analysis of HRV data: time analysis and frequency-domain analysis. In either method, the interbeat intervals should be properly calculated and any abnormal heartbeats found should later be removed to generate scientifically sound data.
Autonomic Nervous System
the autonomic nervous system (AnS) is a part of the nervous system that non-voluntarily controls all organs and systems of the body. there are two branches of the autonomic nervous system: the sympathetic (SnS) and parasympathetic (pSnS / vagal) nervous systems that always work as antagonists in their effect on target organs. the sympathetic and parasympathetic branches of the autonomic nervous system antagonistically influence the lengths of time between consecutive
Definitions

29
heartbeats. Faster heart rates, which can be due to increased SnS and/or lower pSnS activity, correspond to a shorter between-beat interval, while slower heart rates have a longer between-beat interval, often attributed to increased pSnS and /or decreased SnS activity. the pSnS assumes a mostly inhibitory effect, while the SnS has an activating function. For most organs, including the heart, the SnS stimulates organ function. An increase in sympathetic stimulation causes an increase in heart rate. In contrast, the parasympathetic stimulation causes a decrease in heart rate. Both the AnS and the SnS are influenced by the brain and receive feedback from internal organs. In this way, the HRV measurement provides very unique information.
the higher the HRV smoothness, the quicker and more flexibly the heart adapts to external and internal influences and the better the organism reacts to its environment.
baroreceptor Reflex
the baroreceptor reflex is one of the body’s homeostatic mechanisms for maintaining blood pressure. Baroreceptors are sensors located in the blood vessels. they detect the pressure of blood flowing through them by measuring the amount of stretch in the blood vessel walls. When the baroreceptors detect a change in the blood vessel walls, a signal is sent to the nervous system, which will then act to return the pressure to a normal level. An elevated blood pressure reflexively causes blood pressure to decrease; similarly, decreased blood pressure depresses the baroreflex, causing blood pressure to rise.
Factors affecting autonomic regulation of the heart include but are not limited to: respiration, thermoregulation, immune responses, blood pressure, and cardiac output. One of the most important among these factors is blood pressure.
Respiratory Sinus Arrhythmia
Rhythmic oscillation in the heart rate produced by respiration is called respiratory sinus arrhythmia (RSA). Inhaling temporarily gates off the influence of the parasympathetic influence on heart rate, increasing the heart rate. Exhaling reinstates parasympathetic influence on heart rate, decreasing the heart rate. Heart rate is normally controlled by the medulla, which increases parasympathetic nervous system input to the heart via the vagus nerve. the magnitude of the RSA increases with physical conditioning and self-induced, relaxed breathing. RSA becomes less robust with age, diabetes and cardiovascular disease.
fourier transform and Autonomic Nervous System
Fourier transform is a mathematical operation that transforms one function into another that is called the frequency domain representation. the frequency-based HRV analyses in Alive use Fourier transform, based on the fact that the variations in heart rate produced by SnS and pSnS activity occur at different speeds, or frequencies. SnS is slow-acting and mediated by norepinephrine, while pSnS influence is fast-acting and mediated by acetylcholine.
photoplethysmograph
the Alive hardware sensor is based on a photoplethysmograph (ppG). this sensor sends a beam of light into the finger from a light emitting diode (lED) and then measures the amount of light reflected to a light sensor. Variation in the light intensity at the sensor and resulting electrical signal indicates variations in blood volume correlated with the pulse.

30
notes

31
notes

32somaticvision.com
how are you today?
© 2009-2011 Somatic Vision Inc. Alive, Gains & Drains, today log, Zoom Out,
Change the Channel, and mental mini-Breaks are trademarks of Somatic Vision
Inc. All rights reserved. manufactured under license from Quantum Intech, Inc.
Quantum Intech and the Quantum Intech logo are trademarks of Quantum Intech,
Inc. in the U.S. and other countries. Heartmath and the Heartmath logo are
trademarks or registered trademarks of the Institute of Heartmath in the U.S. and
other countries. All other trademarks belong to their respective owners. Coherence
algorhithms contained within this product licensed from and © 1999-2010
Quantum Intech, Inc, with all rights reserved, and are protected by the following
patents in the US: 6,358,201; 7,117,032; 7,163,512; and 7,462,151. Other patents
include: European Union 1156851; Canada 2,365,032; Australia 770323; China
Zl00807109.8; Hong Kong HK1042056; Japan 4410234; Korea 10-0616370