Che 440/540 Proton Nuclear Magnetic Resonance (NMR) Spectroscopy.
CLINICAL SCIENCE
A proton nuclear magnetic resonance-basedmetabonomics study of metabolic profiling inimmunoglobulin a nephropathyWeiguo Sui,I Liping Li,I,II Wenti Che,I Guimai Zuo,I Jiejing Chen,I Wuxian Li,III Yong DaiI,IV
I 181st Hospital Guangxi, Central Laboratory, Laboratory of Metabolic Diseases Research, Guangxi Province, China. II Guangxi Normal University, the Life
Science College, Guangxi Province, China. III Key Laboratory of Laboratory Medical Diagnostics of Education Ministry, Chongqiong Medical University,
Chongqing, China. IV Clinical Medical Research Center, the Second Clinical Medical College of Jinan University (Shenzhen People’s Hospital), Shenzhen,
Guangdong Province, China.
OBJECTIVES: Immunoglobulin A nephropathy is the most common cause of chronic renal failure among primaryglomerulonephritis patients. The ability to diagnose immunoglobulin A nephropathy remains poor. However, renalbiopsy is an inconvenient, invasive, and painful examination, and no reliable biomarkers have been developed foruse in routine patient evaluations. The aims of the present study were to identify immunoglobulin A nephropathypatients, to identify useful biomarkers of immunoglobulin A nephropathy and to establish a humanimmunoglobulin A nephropathy metabolic profile.
METHODS: Serum samples were collected from immunoglobulin A nephropathy patients who were not usingimmunosuppressants. A pilot study was undertaken to determine disease-specific metabolite biomarker profiles inthree groups: healthy controls (N = 23), low-risk patients in whom immunoglobulin A nephropathy was confirmed asgrades I-II by renal biopsy (N = 23), and high-risk patients with nephropathies of grades IV-V (N = 12). Serum sampleswere analyzed using proton nuclear magnetic resonance spectroscopy and by applying multivariate patternrecognition analysis for disease classification.
RESULTS: Compared with the healthy controls, both the low-risk and high-risk patients had higher levels ofphenylalanine, myo-Inositol, lactate, L6 lipids ( = CH-CH2-CH = O), L5 lipids (-CH2-C = O), and L3 lipids (-CH2-CH2-C = O)as well as lower levels of b-glucose, a-glucose, valine, tyrosine, phosphocholine, lysine, isoleucine, glycerolpho-sphocholine, glycine, glutamine, glutamate, alanine, acetate, 3-hydroxybutyrate, and 1-methylhistidine.
CONCLUSIONS: These metabolites investigated in this study may serve as potential biomarkers of immunoglobulin Anephropathy. Point scoring of pattern recognition analysis was able to distinguish immunoglobulin A nephropathypatients from healthy controls. However, there were no obvious differences between the low-risk and high-riskgroups in our research. These results offer new, sensitive and specific, noninvasive approaches that may be of greatbenefit to immunoglobulin A nephropathy patients by enabling earlier diagnosis.
KEYWORDS: Immunoglobulin A Nephropathy; Metabonomics; Biomarkers; Proton Nuclear Magnetic ResonanceSpectroscopy; Orthogonal Partial Least-Squares Discriminant Analysis.
Sui W, Li L, Che W, Zuo G, Chen J, Li W, Dai Y. A proton nuclear magnetic resonance-based metabonomics study of metabolic profiling inimmunoglobulin a nephropathy. Clinics. 2012;67(4):363-373.
Received for publication on November 28, 2011; First review completed on November 28, 2011; Accepted for publication on December 26, 2011
E-mail: [email protected]
Tel.: 86 0755-25626750
INTRODUCTION
Immunoglobulin A nephropathy (IgAN) is the mostcommon primary glomerulopathy worldwide; it is amesangial proliferative glomerulonephritis characterizedby diffuse mesangial deposition of immunoglobulin A (1).
The underlying mechanism of IgAN is poorly understood,and the outcomes of patients vary greatly. Variations in themethods used to treat IgAN patients account for less thanhalf of the variability in outcomes (2). Determining anaccurate diagnosis poses great challenges. Multiple observa-tional cohort studies have identified several risk factorsassociated with the progression of IgAN (3,4). Five clinicalfeatures, namely high proteinuria, hypertension, impairedrenal function, hypoproteinemia, and hyperuricemia, areindependent predictors of an unfavorable renal outcome (5).However, the threshold above which the risk develops is stilldebated. IgAN presents with variable clinical symptoms andpathological patterns, making it difficult to predict the risk of
Copyright � 2012 CLINICS – This is an Open Access article distributed underthe terms of the Creative Commons Attribution Non-Commercial License (http://creativecommons.org/licenses/by-nc/3.0/) which permits unrestricted non-commercial use, distribution, and reproduction in any medium, provided theoriginal work is properly cited.
No potential conflict of interest was reported.
CLINICS 2012;67(4):363-373 DOI:10.6061/clinics/2012(04)10
363
progression to end-stage renal failure in individuals. Despitethe fact that the progression of IgAN is generally slow, up to15-40% of patients with IgAN develop end-stage renaldisease within 20 years (6). As a "gold standard," renalbiopsy is currently the primary diagnostic tool for renaldisease, as well as for treatment and prognosis. Therefore,renal biopsy has been quite helpful in the understanding ofthe different types of human renal diseases and has alsoprovided insight into their pathogenesis (7). Nevertheless,renal biopsy requires an inconvenient, invasive, and painfulexamination that is lacking in sensitivity, specificity andreproducibility and that suffers from inappropriate categor-ization and can even result in some complications (4,8).Additionally, general physicians find it difficult to performbiopsies. Thus, although both the clinical and histologicfeatures of IgAN are highly variable (9), a novel andconvenient strategy for predicting diagnosis from a biopsy-based pathological evaluation has not been well established(4). Neither a biomarker nor a biomarker profile is generallyaccepted in clinical practice. Therefore, identifying definite,as well as sensitive, biomarkers for early diagnosis would beof great significance for making diagnostic and treatmentdecisions.
Metabonomics is a well-established field in systemsbiology, which refers to the study of individual metabolicprofiles and to their changes over time due to disease, toxicityand nutritional, environmental, and genetic alterations (10-12). In a process that is known as ‘‘metabolic fingerprinting,’’global metabolite profiles of complex samples are used toidentify potential biomarkers, and this process can providenew and unexpected insights into biological processes (13).Nuclear magnetic resonance (NMR) spectroscopy appears tobe a cost-effective, useful technique for providing routinecare and screening (14) and is well suited for the analysis ofdifferent types of biological fluids for the evaluation ofindividual metabolomes (15). Thus, proton-NMR (H-NMR)spectroscopic analysis allows for the simultaneous detection,identification, and quantification of hundreds of low-mole-cular-weight metabolites (max. 20 kDa) within a biologicalmatrix (16) for the detection of dynamic changes in globalmetabolism and, specifically, of noninvasive blood markers,which represents a novel and robust method for assessingorgan response to pathophysiologic stimuli (17-18). Due to itsusefulness in evaluating systemic responses to any subtlemetabolic perturbation, 1H NMR-based metabonomics hasbeen extensively applied for the diagnosis and evaluation ofcancer (19-21), diabetes (22), neurological diseases (23), heartdisease (17), and cerebral infarction (24). To date, no NMR-based metabolomic studies of IgAN have been reported.
In the present work, we investigated the perturbedmetabolic pattern in serum derived from IgAN patientsand identified potential biomarkers of this disease usinghigh-resolution NMR spectroscopy coupled with multi-variate statistical analysis. The integration of metabolic datacould provide a systematic approach for the study ofmetabolic profiles associated with IgAN and could facilitatea detailed examination of the underlying molecularmechanisms of the disease. We sought to determinewhether we could identify the metabolic phenotypes andcharacterize the metabolic changes related to the degree ofIgAN, whether we could distinguish valuable biomarkersfor disease diagnosis, and most importantly, whetherunderstanding the pathogenetic process of IgAN on asystemic, metabolic level could hold the key to designing
therapies to arrest the development of IgAN and prevent itslater manifestations. The results highlight the possibility for"metabolic fingerprinting" to become a new diagnosticmethod with improved sensitivity and specificity.
MATERIALS AND METHODS
SubjectsBefore starting this study, the patients and controls were
informed of the study protocol and signed written consentforms, which were approved by the Regional EthicsCommittee of the 181st Hospital Guilin, Guangxi.
For this study, 35 IgAN patients and 23 age- and sex-matched healthy controls were recruited from theNephrology Department of the 181st Hospital Guilin,Guangxi, China, from August 2010 to December 2010. Allpatients with biopsy-proven primary IgAN were reviewed.The subjects were classified into three groups: a controlgroup consisting of 23 healthy subjects, a low-risk groupconsisting of twenty-three IgAN patients with diseases ofgrades I-III based on renal biopsies stained for IgAN-A, and ahigh-risk group composed of twelve IgAN patients withdiseases of grades IV-V based on biopsies stained for IgAN-B.The inclusion criteria for IgAN were (1) patient age rangingfrom 18 to 60 years and evidence of predominant mesangialIgA deposits from a renal biopsy, and (2) absence ofcorticosteroid or immunosuppressive therapy in the previous10 weeks in both the patients and controls. The exclusioncriteria were (1) presence of a secondary cause of IgAN, suchas systemic lupus erythematous, Schonlein-Henoch purpura,chronic liver disease, malignancies, active peptic-ulcer dis-ease and other autoimmune disorders; (2) diagnosis ofdiabetes mellitus, acute interstitial nephritis, Alport’s syn-drome, acute myocardial infarction or stroke; (3) evidence orsuspicion of severe uncontrolled hypertension (systolic bloodpressure $220 mmHg and/or diastolic blood pressure$120 mmHg); and (4) history of alcoholism, smoking or oralcontraception within the previous six months.
Approximately 4 mL of peripheral venous blood wascollected in separate biochemistry tubes from the IgAN patientsand healthy volunteers in the morning following a 12-h fastingperiod. The blood was allowed to clot for 60 min at roomtemperature and was centrifuged at 20006g for 10 min. Thesupernatants were then divided into 0.5-mL polyethylene tubesand were stored at –80 C until the NMR analysis wasperformed.
Clinical chemistry and histopathologyClinical chemistry analyses of serum samples were
conducted, using an automatic chemistry analyzer (MOL-300, Heal Force, China) with enzymatic methods usingcommercially available kits, for the measurement of severalserum parameters, including proteinuria, alanine amino-transferase, aspartate aminotransferase, total protein, albu-min, globulin, glucose, urea nitrogen, creatinine, uric acid,cholesterol, triglyceride, HDL cholesterol, and LDL choles-terol. The values were expressed as the means ¡ SDs.Statistical comparisons were performed using SPSS 11.5software (SPSS Inc., Chicago, IL, USA), and differences wereconsidered significant when p,0.05.
Renal tissue was obtained from all patients by percuta-neous renal biopsy. Histopathological changes in kidneytissue were assessed in at least 20 randomly selected tissuesections from each group under study. Sections of 2-3 mm in
Metabonomics profiling in immunoglobulin A nephropathySui W et al.
CLINICS 2012;67(4):363-373
364
thickness were paraffin-embedded and stained with Mayer’shematoxylin and eosin for direct immunofluorescenceobservations. The pathological diagnosis of IgAN was madeaccording to the previous World Health Organizationdiagnostic system and its reference standard of clinical typebased on Lee’s classification scheme (45).
Proton nuclear magnetic resonance spectroscopyFor the NMR experiments, the serum samples were
thawed at room temperature and centrifuged at 30006g for5 minutes at 4 C. The supernatants were then adjusted topH 7.4 with sodium phosphate buffer solutions and mixedwith 100 mL of deuterium oxide solution to calibrate theNMR spectrometer. Finally, an aliquot of the preparedmixture (500 mL) was transferred to a 5-mm NMR tube(Wilmad, Buena, NJ, USA).
The 1H NMR spectra were acquired using a Varian UnityINOVA-600 MHz NMR spectrometer (Varian Inc., PaloAlto, CA, USA) operating at a 599.93-MHz frequency anda temperature of 300 K. The spectra were acquired usinga conventional presaturation pulse sequence with aNOESYPR 1-D solvent suppressor (RD-90 -t1-90 -tm-90 -ACQ). Standard two-dimensional (2-D) total correlationspectroscopy (TOCSY) NMR spectra were also acquired forspectral assignment purposes in the selected samples. 1H-1HTOCSY experiments were performed using the tntocsypulse sequence. For each sample, the free-induction decayswere collected with 128 transients into 32K data pointsusing a spectral width of 8000 Hz with a relaxation delay of2.1 s, an acquisition time of 1 s and a mixing time of 100 ms.All of the spectra were multiplied by an exponentialweighting function corresponding to a line-broadening of1.0 Hz prior to Fourier transformation (25).
Data reduction and multivariate patternrecognition analysis
All of the NMR spectra were phased, baseline-corrected,and data-reduced to 225 integrated regions of d0.002 inwidth, corresponding to the region of d0.5 to d9.0, usingTopSpin software (Varian 3.0, Bruker Biospin, Germany).The 1H-NMR spectra of the serum samples were referencedto the internal lactic acid CH3 resonance at 1.33 ppm. Then,the region of water resonance (d4.37-6.88) was excluded toeliminate the baseline effects of an imperfect water signal.The remaining bins were integrated and normalized for usein further analysis. The normalized data were imported intothe SIMCA-P software package, version 11.0 (Umetrics AB,Umea, Sweden).
Unsupervised principal components analysis (PCA),supervised projection to partial least squares-discriminantanalysis (PLS-DA), and orthogonal partial least squares-discriminant analysis (OPLS-DA) were performed for classdiscrimination and biomarker identification. First, PCA,based on a mean center-scaling model, was performed toexamine the intrinsic variation in the dataset. The data werevisualized with the score plots of the first two principalcomponents (PC1 and PC2) to provide the most efficienttwo-dimensional representation of the information (21). Asan extension of PLS-DA and featuring integrated orthogonalsignal correction (OSC), OPLS-DA can remove variabilitynot relevant to class separation. OPLS-DA was used tomaximize the covariance between the measured data (Xvariable, peak intensities in NMR spectra) and the responsevariable (Y variable, predictive classifications) (21) and to
simultaneously remove uncorrelated variations between theX and Y variables or X variables that were orthogonal to Yvariables (26). A scores plot combining the reliability andcorrelation from the OPLS-DA model helped to identifydifferential metabolites among the groups (27). The relevantmetabolites for each separation model and their differencesamong the groups are shown as coefficient of variationplots. With a significance level of 0.05, a correlationcoefficient (Corr(t,X)) of ¡0.497 was adopted as a cutoffvalue to select the variables that were most correlated withthe OPLS-DA discriminant scores. The correlation coeffi-cients were calculated using Pearson linear correlationcoefficients incorporated into MATLAB R2007a software(MathWorks, Inc., Natick, MA, USA).
Both the PLS-DA and OPLS-DA models were based on aunit variance scaling strategy. A 10-fold cross-validationwas employed to obtain Q2 and R2 values. R2 is defined asthe proportion of variance in the data explained by themodels and indicates goodness of fit, while Q2 is defined asthe proportion of variance in the data predictable by themodel and indicates predictability (24). To further validatethe quality of the PLS-DA model and to investigate thepredictability of the OPLS-DA model, permutation tests,consisting of random permutation class membership andthe performance of 200 iterations, were conducted (28).These tests compared the goodness of fit of the originalmodel with the goodness of fit of several models based ondata in which the order of the Y observations wererandomly permuted while the X matrix was kept intact(29). p-values were generated by an unpaired t-test, and a p-value of ,0.05 was considered statistically significant.
RESULTS
Clinical chemistry analysis and histopathologyThe percentages of IgAN patients with microscopic
hematuria, hypertension, hyperlipidemia, and chronic renalfailure were 97.01, 27.74, 13.26, and 20.32%, respectively. Atotal of 80.44% of long-term hypertension patients (bloodpressure .140/90 mmHg) were required to undergo anti-hypertensive therapy to maintain normotension before under-going renal biopsy. The demographic features and body fluidparameters determined by biochemical analyses of all of thepatients and healthy volunteers are shown in Table 1. Nosignificant differences in age, sex distribution, BMI, or systolicand diastolic blood pressures were found among the threegroups. The serum levels of total protein, albumin andglobulin were lower in the IgAN patients than in the healthycontrols, whereas the urea nitrogen, creatinine, and uric acidlevels were higher in IgAN patients than in the healthycontrols. Furthermore, proteinuria was significantly higher inthe IgAN-B patients compared with the IgAN-A patients.
In the renal biopsy, both the IgAN-A and IgAN-B groupswere similar with regard to mesangial proliferation, cellularcrescents, global and segmental glomerulosclerosis, inter-stitial fibrosis and tubular atrophy, with some IgAN-Bpatients displaying a predominance of active/proliferativelesions and chronic/sclerosing lesions. As shown in Table 2,the most common IgAN pathological category in 35 caseswas the mesangial proliferative type (35 cases; 57.14%), andthe second most common was focal segmental glomerulo-sclerosis (FSGS) (12 cases; 34.29%). Membranous glomer-ulonephritis (MGN) (2 cases; 5.71%) and sclerosisglomerulonephritis (SGN) (1 case; 2.86%) were the next
CLINICS 2012;67(4):363-373 Metabonomics profiling in immunoglobulin A nephropathySui W et al.
365
most common disease types. The classes of the IgANpathological grades were predominantly II, III, and IV,while grades I and V were rare. This result may haveoccurred because grade I corresponded to the earliest stageof kidney disease and was hidden in the clinic due tountimely treatment or insufficient medical attention, andgrade V was the most severe stage of renal disease thatalways progressed to renal failure, often requiring dialysistreatment in the clinic. Therefore, these patients rarelyunderwent biopsy.
Qualitative proton nuclear magnetic resonanceanalysis of serum samples
Figure 1 depicts the typical 1H CPMG spectra of serumsamples obtained from healthy individuals and from IgAN-A and IgAN-B patients. The 1H-NMR signals of all commonmetabolites, including amino acids, organic acids, andcarbohydrates, were assigned according to previous pub-lications (30). The spectral profiles were generally similar,making accurate visual comparison difficult, but somerelative intensity differences could be observed among thethree groups. As shown in Figure 1, predominantly
endogenous compounds were identified from the spectracomprising numerous lipoprotein fractions, some of whichwere derived from the glycerol of lipids, glycerolpho-sphocholine, low-density lipoprotein (L), and very low-density lipoprotein (VLDL). The sharp peaks arose fromsugar signals, including n-acetyl glycoprotein, a-glucose,and b-glucose. There were also a large number of aminoacid signals, such as methylhistidine, alanine, glutamine,glutamate, glycine, isoleucine, leucine, lysine, phenylala-nine, tyrosine, and valine, as well as signals from acetate,citrate, creatine, lactate, phosphocholine, pyruvate, acetone,creatinine, myo-Inositol, and methylamine.
Metabonomic analysis of human serum in controlsand IgAN patients
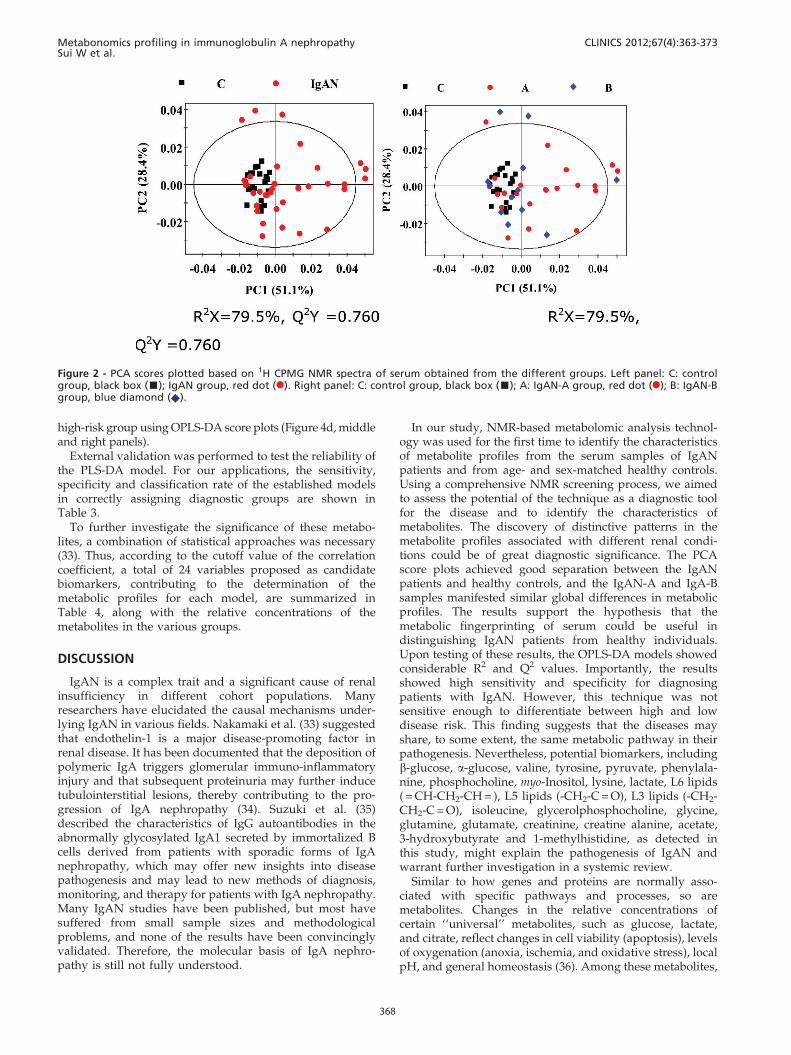
Unsupervised PCA was applied to examine the intrinsicvariation in the serum data sets. Figure 2 shows the two-dimensional PCA scores plots based on the 1H CPMG NMRspectra of the serum obtained from different groups. Moresamples were present in the 95% confidence interval of themodeled variation. We found that the control samples werevery homogeneous and that their distributions of PCA scoreplots were relatively close. The IgAN patients and healthycontrols, although scattered, were located in differentclusters, demonstrating a relatively clear distinction, whilethe score plots showed slight separations between theIgAN-A and IgAN-B groups and the serum (R2X = 79.5%;Q2Y = 0.760) models.
PLS-DA, which is more focused on detecting variationthan the PCA approach, was further performed to investi-gate subtle metabolic differences among the groups. Theparameters used to assess modeling quality, including R2X,R2Y, and Q2Y, are displayed under each picture in Figure 3.The model parameters for the explained variation, R2, andthe predictive capability, Q2, were significantly higher(R2, Q2.0.5) in the serum, indicating excellent models.
Table 1 - Demographic and clinical patient characteristics.
IgAN-A IgAN-B Controls
Number of samples 23 12 23
Age (years)a 31.46¡9.31 36.00¡7.34 35.61¡11.35
Age range (years) 21-47 22-47 21-51
Sex (F/M) 1 10/13 6/6 12/11
BMI (kg/m2) a 22.35¡2.22 24.60¡2.41 23.40¡3.26
DBP (mmHg) a 76.76¡9.05 79.42¡9.32 74.4¡4.81
SBP (mmHg) a 125.82¡12.94 126.88¡16.28 125.30¡11.31
Proteinuria (g/day) b 0.95¡0.39 2.13¡1.44 0.04¡0.04
Alanine aminotransferase (U/L) a 21.28¡19.32 22.71¡21.59 17.48¡11.96
Aspartate aminotransferase (U/L) a 23.63¡12.44 23.84¡11.39 18.13¡11.30
Total protein (g/L) c 61.36¡12.26 59.63¡8.84 70.83¡7.82
Albumin (g/L) b 37.06¡8.00 32.94¡11.65 44.43¡6.34
Globulin (g/L) c 24.29¡7.29 23.28¡8.53 25.73¡4.19
Fasting glucose (mmol/L) a 4.82¡0.70 5.04¡0.51 4.92¡0.38
Urea nitrogen (mmol/L) b 6.04¡5.36 7.29¡6.30 4.56¡1.13
Creatinine (mmol/L) b 109.71¡49.27 123.73¡47.09 87.42¡13.46
Uric acid (mmol/L) b 369.56¡80.76 427.84¡90.39 230.16¡113.76
Total cholesterol (mmol/L) a 5.61¡2.07 4.62¡1.26 4.53¡0.84
Triglycerides (mmol/L) a 1.65¡0.83 1.45¡0.77 1.14¡0.31
HDL cholesterol (mmol/L) c 1.68¡0.61 1.75¡0.42 1.43¡0.53
LDL cholesterol (mmol/L)c 2.62¡2.02 2.61¡1.95 2.26¡0.56
Data are presented as the means ¡ SDs.1Categorical variables are expressed in percentages.aThere was no significant difference in demographic data among the IgAN-A, IgAN-B and control groups (p.0.05).bSignificantly higher between the IgAN and control groups, as well as between the IgAN-A and IgAN-B groups (p,0.001).cSignificantly lower between the IgAN and control groups, as well as between the IgAN-A and IgAN-B groups (p,0.05).
Table 2 - Brief summary of histologic changes in 35 casesof IgAN according to Lee9s classification system.
Pathology category I II III IV V
Mesangial proliferative Slight 3 6 1 0 0
Moderate 0 4 2 2 0
Severe 0 0 1 1 0
FSGS 0 0 6 4 2
MGN 0 0 0 2 0
SGN 0 0 0 0 1
Total 3 10 10 9 3
The comparisons between all pathological types resulted in significance
levels of p,0.01.
Metabonomics profiling in immunoglobulin A nephropathySui W et al.
CLINICS 2012;67(4):363-373
366

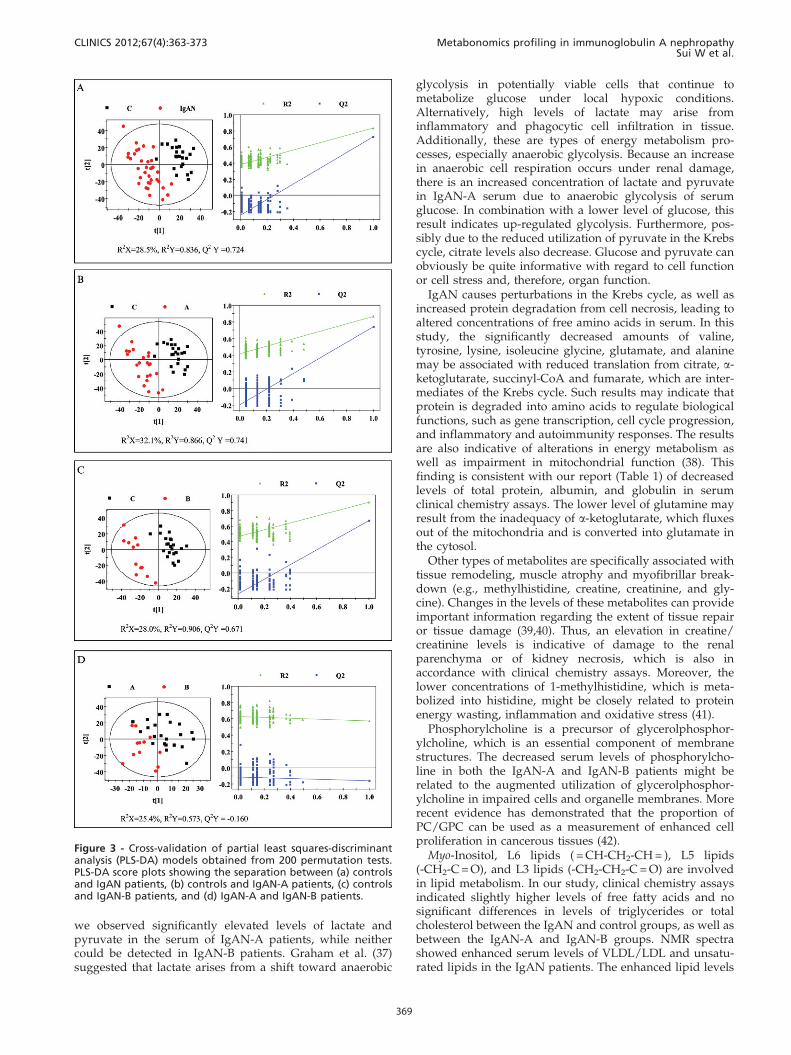
The PLS-DA scores plot (Figure 3a) showed that the clusterof IgAN patients was located further away from the clusterof healthy controls (R2X = 28.5%, R2Y = 0.836, Q2Y = 0.724),indicating that the metabolic profile of the IgAN patientswas quite different from that of the healthy controls.Furthermore, Figure 3(b) shows a clear distinction betweenthe IgAN-A patients and healthy controls (R2X = 32.1%,R2Y = 0.866, Q2Y = 0.741). Similarly, Figure 3(c) reveals thescores plot of the IgAN-B patients and healthy controls,which were also located in different clusters, demonstratingwell-pronounced discrimination (R2X = 28.0%, R2Y = 0.906,Q2Y = 0.671). In Figure 3(d), some samples from IgAN-Apatients are relatively mixed into the cluster of IgAN-Bsamples, which indicates that the metabolic profiles of thosegroups were quite similar (R2X = 25.4%, R2Y = 0.573, Q2Y =-0.160). The goodness of fit (R2 and Q2) of the original PLS-DA models and of the cluster of 200 Y-permutated modelscan be visualized in validation plots (Figure 3, left panel).The validation plots clearly show that the original PLS-DAmodels were valid, as the Q2 regression line had a negativeintercept, and all of the permuted R2 values on the left werelower than the original points on the right.
An OPLS-DA model was constructed in which one PLScomponent and one orthogonal component were calculatedusing the spectral data scaled to that used by Pareto (31).OSC filters were developed to remove the strong structuredvariation in X that was not correlated with Y. That is, OSCfilters removed the structured Y-orthogonal variation fromX in such a way that the filters could be applied to furtherdata (32). The OPLS-DA models used to compare thespectral data between the groups were built using the NMRdata as the X matrix and group information (i.e., control orIgAN patient groups) as the Y matrix (31). In the OPLS-DAmodel score plots, a clear differentiation between healthyindividuals and IgAN patients (Figure 4a, left panel) can beseen. Additionally, a significant biochemical distinctionbetween the IgAN-B group and control group (Figure 4b,left panel) is evident, as well as between the IgAN-A groupand control group (Figure 4c, left panel). Some degree of
separation between the IgAN-A patients and IgAN-Bpatients can also be observed (Figure 4d, left panel).
The OPLS-DA loading plots (Figure 4, middle and rightpanels) were generated to identify the metabolites responsiblefor the differentiation in the score plots. The color map showsthe significance of metabolite variations between the twoclasses. Peaks in the positive direction indicate metabolites thatare more abundant in the groups in the positive direction ofthe first principal component (t[1]P). Consequently, metabo-lites that are more abundant in the groups in the negativedirection of the first primary component are presented aspeaks in the negative direction. In addition, the signals in thespectrum are associated with the significance of metabolites incharacterizing the NMR data for a given group and the color-scaling map on the right-hand side of each loading plot. Thiswas a function of variable importance in OPLS-DA loadingplots (Figure 4) providing information about the magnitude ofthe importance of the metabolites in explaining the scores. Forinstance, red indicates a more significant contribution to theseparation between the groups than blue. Based on the resultsof the OPLS-DA loading plot, in which the targeted profile canbe observed, the serum of IgAN patients was characterized byhigher levels of lactate, myo-Inositol, phenylalanine, and L6( = CH-CH2-CH = ), L5 (-CH2-C = O) and L3 (-CH2-CH2-C = O)lipids, as well as by lower levels of b-glucose, a-glucose, valine,tyrosine, phosphocholine, lysine, isoleucine, glycerolphospho-choline, glycine, glutamine, glutamate, alanine, acetate, 3-hydroxybutyrate, and 1-methylhistidine, compared withhealthy individuals (Figure 4a, middle and right panels).Compared with the control group, the IgAN-A and IgAN-Bgroups had very similar levels of metabolic changes. Increasedlevels of pyruvate, phenylalanine, lactate, L5 lipids (CH2-C = O), creatinine, and creatine and decreased levels of glycinewere marked in the IgAN-A patients, while obvious differ-ences were not observed in the IgAN-B group (Figure 4b, c,middle and right panels). Overall, the high-risk patients hadrelatively higher or lower statistically significant differences in24 variable metabolites than the low-risk patients. Intriguingly,it was difficult to differentiate the low-risk group from the
Figure 1 - 600-MHz 1H NMR spectra (d0.4-4.7 and d5.2-9.0) of serum obtained from the (A) control, (B) IgAN-A and (C) IgAN-B groups.The region of d5.2-9.0 (in the dashed box) was magnified 8 times compared with the corresponding region of d0.4-4.7 for the purposeof clarity. Key: 1-MH: 1-Methylhistidine; Ace: Acetate; Acet: Acetone; Ala: Alanine; Ci: Citrate; Cr: Creatine; Cn: Creatinine; GL: Glycerolof lipids; Gln: Glutamine; Glu: Glutamate; Gly: Glycine; GPC: Glycerolphosphocholine; Ileu: Isoleucine; L1: LDL&VLDL, CH3-(CH2)n-; L2:LDL&VLDL, CH3-(CH2)n-; L3: -CH2-CH2-C = O; L4: -CH2-CH = CH-; L5: -CH2-C = O; L6: = CH-CH2-CH = ; L7: -CH = CH-; Lac: Lactate; Leu:Leucine; Lys: Lysine; MA: Methylamine; m-I: myo-Inositol; NAG: N-acetyl glycoprotein signals; PC: Phosphocholine: Phe: Phenylalanine;Py: Pyruvate; Tyr: Tyrosine; Val: Valine; a-Glc: a-Glucose; b-Glc: b-Glucose.
CLINICS 2012;67(4):363-373 Metabonomics profiling in immunoglobulin A nephropathySui W et al.
367
high-risk group using OPLS-DA score plots (Figure 4d, middleand right panels).
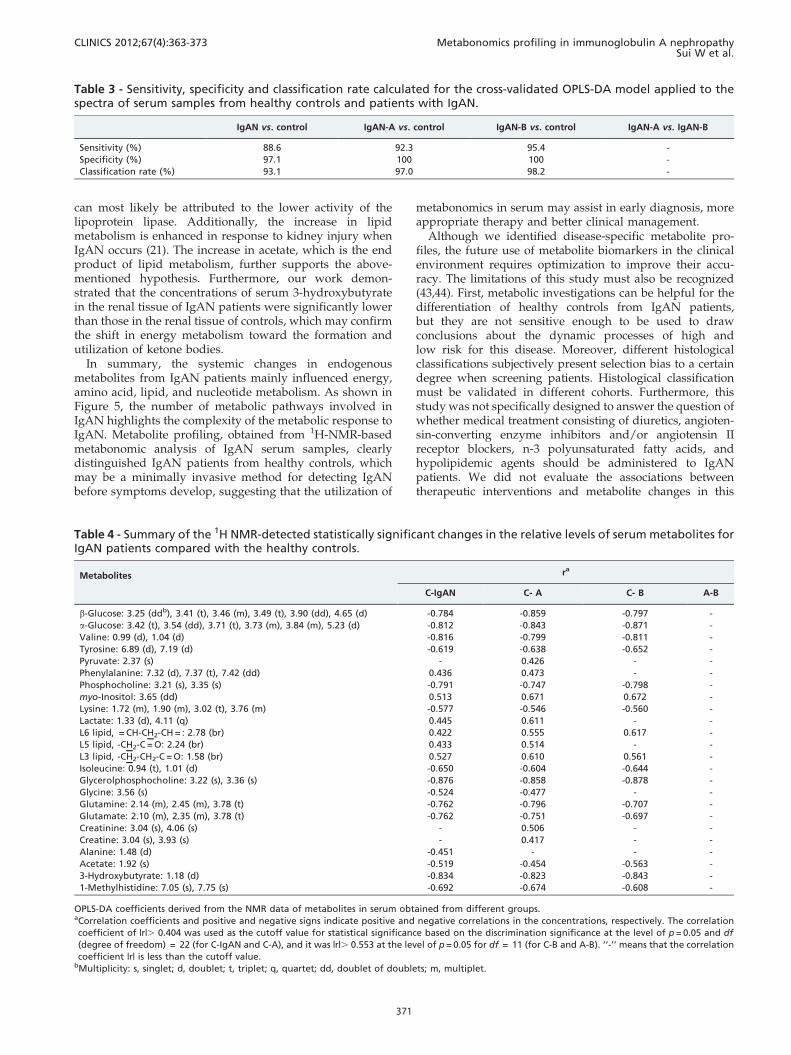
External validation was performed to test the reliability ofthe PLS-DA model. For our applications, the sensitivity,specificity and classification rate of the established modelsin correctly assigning diagnostic groups are shown inTable 3.
To further investigate the significance of these metabo-lites, a combination of statistical approaches was necessary(33). Thus, according to the cutoff value of the correlationcoefficient, a total of 24 variables proposed as candidatebiomarkers, contributing to the determination of themetabolic profiles for each model, are summarized inTable 4, along with the relative concentrations of themetabolites in the various groups.
DISCUSSION
IgAN is a complex trait and a significant cause of renalinsufficiency in different cohort populations. Manyresearchers have elucidated the causal mechanisms under-lying IgAN in various fields. Nakamaki et al. (33) suggestedthat endothelin-1 is a major disease-promoting factor inrenal disease. It has been documented that the deposition ofpolymeric IgA triggers glomerular immuno-inflammatoryinjury and that subsequent proteinuria may further inducetubulointerstitial lesions, thereby contributing to the pro-gression of IgA nephropathy (34). Suzuki et al. (35)described the characteristics of IgG autoantibodies in theabnormally glycosylated IgA1 secreted by immortalized Bcells derived from patients with sporadic forms of IgAnephropathy, which may offer new insights into diseasepathogenesis and may lead to new methods of diagnosis,monitoring, and therapy for patients with IgA nephropathy.Many IgAN studies have been published, but most havesuffered from small sample sizes and methodologicalproblems, and none of the results have been convincinglyvalidated. Therefore, the molecular basis of IgA nephro-pathy is still not fully understood.
In our study, NMR-based metabolomic analysis technol-ogy was used for the first time to identify the characteristicsof metabolite profiles from the serum samples of IgANpatients and from age- and sex-matched healthy controls.Using a comprehensive NMR screening process, we aimedto assess the potential of the technique as a diagnostic toolfor the disease and to identify the characteristics ofmetabolites. The discovery of distinctive patterns in themetabolite profiles associated with different renal condi-tions could be of great diagnostic significance. The PCAscore plots achieved good separation between the IgANpatients and healthy controls, and the IgAN-A and IgA-Bsamples manifested similar global differences in metabolicprofiles. The results support the hypothesis that themetabolic fingerprinting of serum could be useful indistinguishing IgAN patients from healthy individuals.Upon testing of these results, the OPLS-DA models showedconsiderable R2 and Q2 values. Importantly, the resultsshowed high sensitivity and specificity for diagnosingpatients with IgAN. However, this technique was notsensitive enough to differentiate between high and lowdisease risk. This finding suggests that the diseases mayshare, to some extent, the same metabolic pathway in theirpathogenesis. Nevertheless, potential biomarkers, includingb-glucose, a-glucose, valine, tyrosine, pyruvate, phenylala-nine, phosphocholine, myo-Inositol, lysine, lactate, L6 lipids( = CH-CH2-CH = ), L5 lipids (-CH2-C = O), L3 lipids (-CH2-CH2-C = O), isoleucine, glycerolphosphocholine, glycine,glutamine, glutamate, creatinine, creatine alanine, acetate,3-hydroxybutyrate and 1-methylhistidine, as detected inthis study, might explain the pathogenesis of IgAN andwarrant further investigation in a systemic review.
Similar to how genes and proteins are normally asso-ciated with specific pathways and processes, so aremetabolites. Changes in the relative concentrations ofcertain ‘‘universal’’ metabolites, such as glucose, lactate,and citrate, reflect changes in cell viability (apoptosis), levelsof oxygenation (anoxia, ischemia, and oxidative stress), localpH, and general homeostasis (36). Among these metabolites,
Figure 2 - PCA scores plotted based on 1H CPMG NMR spectra of serum obtained from the different groups. Left panel: C: controlgroup, black box (&); IgAN group, red dot (N). Right panel: C: control group, black box (&); A: IgAN-A group, red dot (N); B: IgAN-Bgroup, blue diamond (X).
Metabonomics profiling in immunoglobulin A nephropathySui W et al.
CLINICS 2012;67(4):363-373
368
we observed significantly elevated levels of lactate andpyruvate in the serum of IgAN-A patients, while neithercould be detected in IgAN-B patients. Graham et al. (37)suggested that lactate arises from a shift toward anaerobic
glycolysis in potentially viable cells that continue tometabolize glucose under local hypoxic conditions.Alternatively, high levels of lactate may arise frominflammatory and phagocytic cell infiltration in tissue.Additionally, these are types of energy metabolism pro-cesses, especially anaerobic glycolysis. Because an increasein anaerobic cell respiration occurs under renal damage,there is an increased concentration of lactate and pyruvatein IgAN-A serum due to anaerobic glycolysis of serumglucose. In combination with a lower level of glucose, thisresult indicates up-regulated glycolysis. Furthermore, pos-sibly due to the reduced utilization of pyruvate in the Krebscycle, citrate levels also decrease. Glucose and pyruvate canobviously be quite informative with regard to cell functionor cell stress and, therefore, organ function.
IgAN causes perturbations in the Krebs cycle, as well asincreased protein degradation from cell necrosis, leading toaltered concentrations of free amino acids in serum. In thisstudy, the significantly decreased amounts of valine,tyrosine, lysine, isoleucine glycine, glutamate, and alaninemay be associated with reduced translation from citrate, a-ketoglutarate, succinyl-CoA and fumarate, which are inter-mediates of the Krebs cycle. Such results may indicate thatprotein is degraded into amino acids to regulate biologicalfunctions, such as gene transcription, cell cycle progression,and inflammatory and autoimmunity responses. The resultsare also indicative of alterations in energy metabolism aswell as impairment in mitochondrial function (38). Thisfinding is consistent with our report (Table 1) of decreasedlevels of total protein, albumin, and globulin in serumclinical chemistry assays. The lower level of glutamine mayresult from the inadequacy of a-ketoglutarate, which fluxesout of the mitochondria and is converted into glutamate inthe cytosol.
Other types of metabolites are specifically associated withtissue remodeling, muscle atrophy and myofibrillar break-down (e.g., methylhistidine, creatine, creatinine, and gly-cine). Changes in the levels of these metabolites can provideimportant information regarding the extent of tissue repairor tissue damage (39,40). Thus, an elevation in creatine/creatinine levels is indicative of damage to the renalparenchyma or of kidney necrosis, which is also inaccordance with clinical chemistry assays. Moreover, thelower concentrations of 1-methylhistidine, which is meta-bolized into histidine, might be closely related to proteinenergy wasting, inflammation and oxidative stress (41).
Phosphorylcholine is a precursor of glycerolphosphor-ylcholine, which is an essential component of membranestructures. The decreased serum levels of phosphorylcho-line in both the IgAN-A and IgAN-B patients might berelated to the augmented utilization of glycerolphosphor-ylcholine in impaired cells and organelle membranes. Morerecent evidence has demonstrated that the proportion ofPC/GPC can be used as a measurement of enhanced cellproliferation in cancerous tissues (42).
Myo-Inositol, L6 lipids ( = CH-CH2-CH = ), L5 lipids(-CH2-C = O), and L3 lipids (-CH2-CH2-C = O) are involvedin lipid metabolism. In our study, clinical chemistry assaysindicated slightly higher levels of free fatty acids and nosignificant differences in levels of triglycerides or totalcholesterol between the IgAN and control groups, as well asbetween the IgAN-A and IgAN-B groups. NMR spectrashowed enhanced serum levels of VLDL/LDL and unsatu-rated lipids in the IgAN patients. The enhanced lipid levels
Figure 3 - Cross-validation of partial least squares-discriminantanalysis (PLS-DA) models obtained from 200 permutation tests.PLS-DA score plots showing the separation between (a) controlsand IgAN patients, (b) controls and IgAN-A patients, (c) controlsand IgAN-B patients, and (d) IgAN-A and IgAN-B patients.
CLINICS 2012;67(4):363-373 Metabonomics profiling in immunoglobulin A nephropathySui W et al.
369
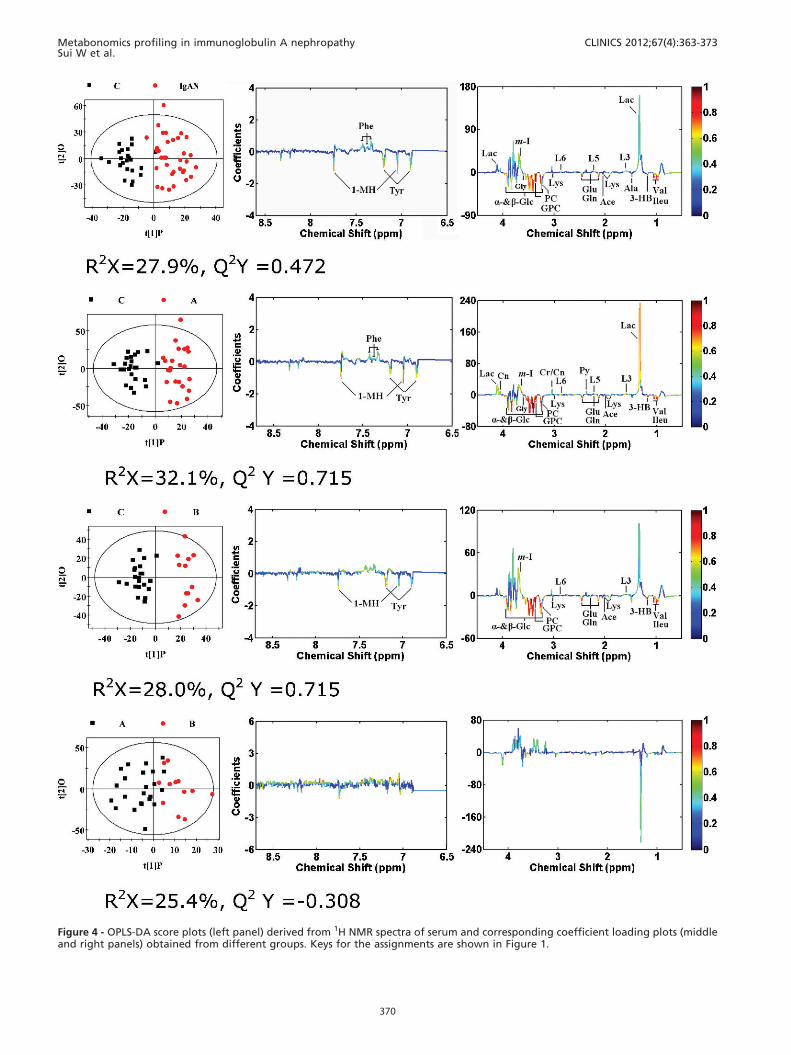
Figure 4 - OPLS-DA score plots (left panel) derived from 1H NMR spectra of serum and corresponding coefficient loading plots (middleand right panels) obtained from different groups. Keys for the assignments are shown in Figure 1.
Metabonomics profiling in immunoglobulin A nephropathySui W et al.
CLINICS 2012;67(4):363-373
370
can most likely be attributed to the lower activity of thelipoprotein lipase. Additionally, the increase in lipidmetabolism is enhanced in response to kidney injury whenIgAN occurs (21). The increase in acetate, which is the endproduct of lipid metabolism, further supports the above-mentioned hypothesis. Furthermore, our work demon-strated that the concentrations of serum 3-hydroxybutyratein the renal tissue of IgAN patients were significantly lowerthan those in the renal tissue of controls, which may confirmthe shift in energy metabolism toward the formation andutilization of ketone bodies.
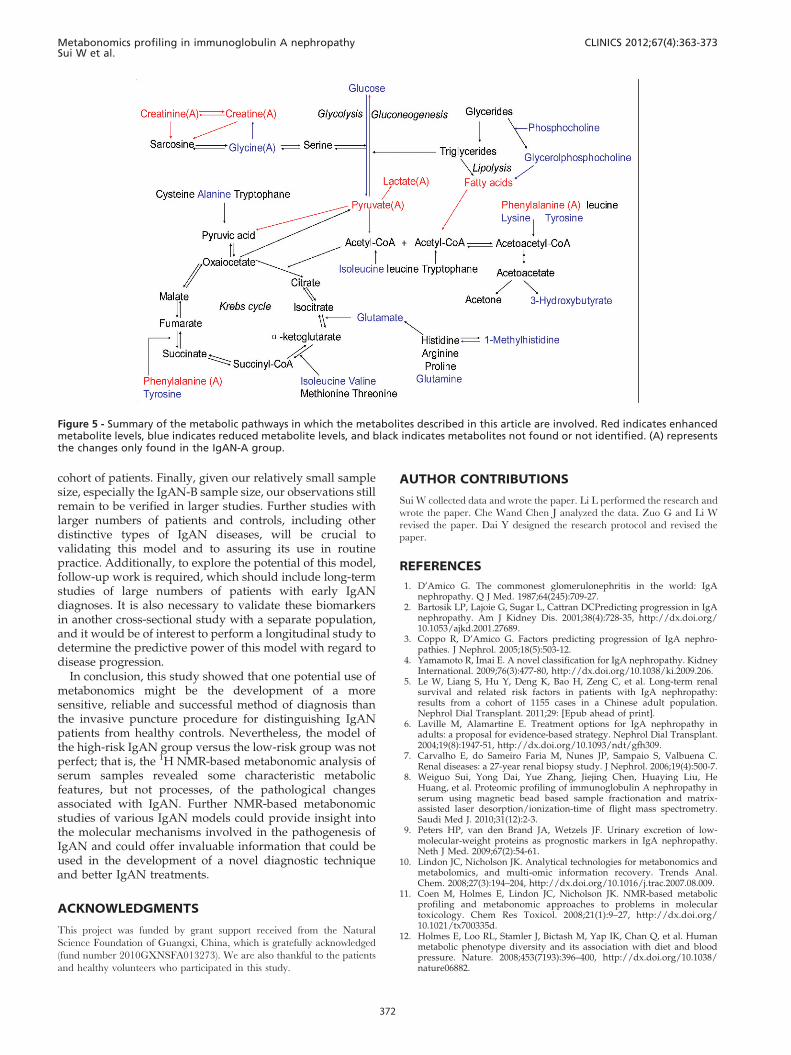
In summary, the systemic changes in endogenousmetabolites from IgAN patients mainly influenced energy,amino acid, lipid, and nucleotide metabolism. As shown inFigure 5, the number of metabolic pathways involved inIgAN highlights the complexity of the metabolic response toIgAN. Metabolite profiling, obtained from 1H-NMR-basedmetabonomic analysis of IgAN serum samples, clearlydistinguished IgAN patients from healthy controls, whichmay be a minimally invasive method for detecting IgANbefore symptoms develop, suggesting that the utilization of
metabonomics in serum may assist in early diagnosis, moreappropriate therapy and better clinical management.
Although we identified disease-specific metabolite pro-files, the future use of metabolite biomarkers in the clinicalenvironment requires optimization to improve their accu-racy. The limitations of this study must also be recognized(43,44). First, metabolic investigations can be helpful for thedifferentiation of healthy controls from IgAN patients,but they are not sensitive enough to be used to drawconclusions about the dynamic processes of high andlow risk for this disease. Moreover, different histologicalclassifications subjectively present selection bias to a certaindegree when screening patients. Histological classificationmust be validated in different cohorts. Furthermore, thisstudy was not specifically designed to answer the question ofwhether medical treatment consisting of diuretics, angioten-sin-converting enzyme inhibitors and/or angiotensin IIreceptor blockers, n-3 polyunsaturated fatty acids, andhypolipidemic agents should be administered to IgANpatients. We did not evaluate the associations betweentherapeutic interventions and metabolite changes in this
Table 3 - Sensitivity, specificity and classification rate calculated for the cross-validated OPLS-DA model applied to thespectra of serum samples from healthy controls and patients with IgAN.
IgAN vs. control IgAN-A vs. control IgAN-B vs. control IgAN-A vs. IgAN-B
Sensitivity (%) 88.6 92.3 95.4 -
Specificity (%) 97.1 100 100 -
Classification rate (%) 93.1 97.0 98.2 -
Table 4 - Summary of the 1H NMR-detected statistically significant changes in the relative levels of serum metabolites forIgAN patients compared with the healthy controls.
Metabolites ra
C-IgAN C- A C- B A-B
b-Glucose: 3.25 (ddb), 3.41 (t), 3.46 (m), 3.49 (t), 3.90 (dd), 4.65 (d) -0.784 -0.859 -0.797 -
a-Glucose: 3.42 (t), 3.54 (dd), 3.71 (t), 3.73 (m), 3.84 (m), 5.23 (d) -0.812 -0.843 -0.871 -
Valine: 0.99 (d), 1.04 (d) -0.816 -0.799 -0.811 -
Tyrosine: 6.89 (d), 7.19 (d) -0.619 -0.638 -0.652 -
Pyruvate: 2.37 (s) - 0.426 - -
Phenylalanine: 7.32 (d), 7.37 (t), 7.42 (dd) 0.436 0.473 - -
Phosphocholine: 3.21 (s), 3.35 (s) -0.791 -0.747 -0.798 -
myo-Inositol: 3.65 (dd) 0.513 0.671 0.672 -
Lysine: 1.72 (m), 1.90 (m), 3.02 (t), 3.76 (m) -0.577 -0.546 -0.560 -
Lactate: 1.33 (d), 4.11 (q) 0.445 0.611 - -
L6 lipid, = CH-CH2-CH = : 2.78 (br) 0.422 0.555 0.617 -
L5 lipid, -CH2-C = O: 2.24 (br) 0.433 0.514 - -
L3 lipid, -CH2-CH2-C = O: 1.58 (br) 0.527 0.610 0.561 -
Isoleucine: 0.94 (t), 1.01 (d) -0.650 -0.604 -0.644 -
Glycerolphosphocholine: 3.22 (s), 3.36 (s) -0.876 -0.858 -0.878 -
Glycine: 3.56 (s) -0.524 -0.477 - -
Glutamine: 2.14 (m), 2.45 (m), 3.78 (t) -0.762 -0.796 -0.707 -
Glutamate: 2.10 (m), 2.35 (m), 3.78 (t) -0.762 -0.751 -0.697 -
Creatinine: 3.04 (s), 4.06 (s) - 0.506 - -
Creatine: 3.04 (s), 3.93 (s) - 0.417 - -
Alanine: 1.48 (d) -0.451 - - -
Acetate: 1.92 (s) -0.519 -0.454 -0.563 -
3-Hydroxybutyrate: 1.18 (d) -0.834 -0.823 -0.843 -
1-Methylhistidine: 7.05 (s), 7.75 (s) -0.692 -0.674 -0.608 -
OPLS-DA coefficients derived from the NMR data of metabolites in serum obtained from different groups.aCorrelation coefficients and positive and negative signs indicate positive and negative correlations in the concentrations, respectively. The correlation
coefficient of |r|. 0.404 was used as the cutoff value for statistical significance based on the discrimination significance at the level of p = 0.05 and df
(degree of freedom) = 22 (for C-IgAN and C-A), and it was |r|. 0.553 at the level of p = 0.05 for df = 11 (for C-B and A-B). ‘‘-’’ means that the correlation
coefficient |r| is less than the cutoff value.bMultiplicity: s, singlet; d, doublet; t, triplet; q, quartet; dd, doublet of doublets; m, multiplet.
CLINICS 2012;67(4):363-373 Metabonomics profiling in immunoglobulin A nephropathySui W et al.
371
cohort of patients. Finally, given our relatively small samplesize, especially the IgAN-B sample size, our observations stillremain to be verified in larger studies. Further studies withlarger numbers of patients and controls, including otherdistinctive types of IgAN diseases, will be crucial tovalidating this model and to assuring its use in routinepractice. Additionally, to explore the potential of this model,follow-up work is required, which should include long-termstudies of large numbers of patients with early IgANdiagnoses. It is also necessary to validate these biomarkersin another cross-sectional study with a separate population,and it would be of interest to perform a longitudinal study todetermine the predictive power of this model with regard todisease progression.
In conclusion, this study showed that one potential use ofmetabonomics might be the development of a moresensitive, reliable and successful method of diagnosis thanthe invasive puncture procedure for distinguishing IgANpatients from healthy controls. Nevertheless, the model ofthe high-risk IgAN group versus the low-risk group was notperfect; that is, the 1H NMR-based metabonomic analysis ofserum samples revealed some characteristic metabolicfeatures, but not processes, of the pathological changesassociated with IgAN. Further NMR-based metabonomicstudies of various IgAN models could provide insight intothe molecular mechanisms involved in the pathogenesis ofIgAN and could offer invaluable information that could beused in the development of a novel diagnostic techniqueand better IgAN treatments.
ACKNOWLEDGMENTS
This project was funded by grant support received from the Natural
Science Foundation of Guangxi, China, which is gratefully acknowledged
(fund number 2010GXNSFA013273). We are also thankful to the patients
and healthy volunteers who participated in this study.
AUTHOR CONTRIBUTIONS
Sui W collected data and wrote the paper. Li L performed the research and
wrote the paper. Che Wand Chen J analyzed the data. Zuo G and Li W
revised the paper. Dai Y designed the research protocol and revised the
paper.
REFERENCES
1. D’Amico G. The commonest glomerulonephritis in the world: IgAnephropathy. Q J Med. 1987;64(245):709-27.
2. Bartosik LP, Lajoie G, Sugar L, Cattran DCPredicting progression in IgAnephropathy. Am J Kidney Dis. 2001;38(4):728-35, http://dx.doi.org/10.1053/ajkd.2001.27689.
3. Coppo R, D’Amico G. Factors predicting progression of IgA nephro-pathies. J Nephrol. 2005;18(5):503-12.
4. Yamamoto R, Imai E. A novel classification for IgA nephropathy. KidneyInternational. 2009;76(3):477-80, http://dx.doi.org/10.1038/ki.2009.206.
5. Le W, Liang S, Hu Y, Deng K, Bao H, Zeng C, et al. Long-term renalsurvival and related risk factors in patients with IgA nephropathy:results from a cohort of 1155 cases in a Chinese adult population.Nephrol Dial Transplant. 2011;29: [Epub ahead of print].
6. Laville M, Alamartine E. Treatment options for IgA nephropathy inadults: a proposal for evidence-based strategy. Nephrol Dial Transplant.2004;19(8):1947-51, http://dx.doi.org/10.1093/ndt/gfh309.
7. Carvalho E, do Sameiro Faria M, Nunes JP, Sampaio S, Valbuena C.Renal diseases: a 27-year renal biopsy study. J Nephrol. 2006;19(4):500-7.
8. Weiguo Sui, Yong Dai, Yue Zhang, Jiejing Chen, Huaying Liu, HeHuang, et al. Proteomic profiling of immunoglobulin A nephropathy inserum using magnetic bead based sample fractionation and matrix-assisted laser desorption/ionization-time of flight mass spectrometry.Saudi Med J. 2010;31(12):2-3.
9. Peters HP, van den Brand JA, Wetzels JF. Urinary excretion of low-molecular-weight proteins as prognostic markers in IgA nephropathy.Neth J Med. 2009;67(2):54-61.
10. Lindon JC, Nicholson JK. Analytical technologies for metabonomics andmetabolomics, and multi-omic information recovery. Trends Anal.Chem. 2008;27(3):194–204, http://dx.doi.org/10.1016/j.trac.2007.08.009.
11. Coen M, Holmes E, Lindon JC, Nicholson JK. NMR-based metabolicprofiling and metabonomic approaches to problems in moleculartoxicology. Chem Res Toxicol. 2008;21(1):9–27, http://dx.doi.org/10.1021/tx700335d.
12. Holmes E, Loo RL, Stamler J, Bictash M, Yap IK, Chan Q, et al. Humanmetabolic phenotype diversity and its association with diet and bloodpressure. Nature. 2008;453(7193):396–400, http://dx.doi.org/10.1038/nature06882.
Figure 5 - Summary of the metabolic pathways in which the metabolites described in this article are involved. Red indicates enhancedmetabolite levels, blue indicates reduced metabolite levels, and black indicates metabolites not found or not identified. (A) representsthe changes only found in the IgAN-A group.
Metabonomics profiling in immunoglobulin A nephropathySui W et al.
CLINICS 2012;67(4):363-373
372
13. Kaddurah-Daouk R, Krishnan KR. Metabolomics: a global biochemicalapproach to the study of central nervous system diseases.Neuropsychopharmacology. 2009;34(1):173–86, http://dx.doi.org/10.1038/npp.2008.174.
14. Ala-Korpela M. Potential role of body fluid 1H NMR metabonomics as aprognostic and diagnostic tool. Expert Rev Mol Diagn. 2007;7(6):761-73,http://dx.doi.org/10.1586/14737159.7.6.761.
15. Pradat PF, Dib M. Biomarkers in amyotrophic lateral sclerosis: facts andfuture horizons. Mol Diagn Ther. 2009;13(2):115-25.
16. Serkova N, Klawitter J, Niemann CU. Organ-specific response toinhibition of mitochondrial metabolism by cyclosporine in the rat.Transpl Int. 2003;16(10):748-55, http://dx.doi.org/10.1111/j.1432-2277.2003.tb00235.x.
17. Brindle JT, Antti H, Holmes E, Tranter G, Nicholson JK, Bethell HW, et al.Rapid and noninvasive diagnosis of the presence and severity ofcoronary heart disease using 1H-NMR-based metabonomics. Nat Med.2002;8(12):1439-44, http://dx.doi.org/10.1038/nm1202-802.
18. Beckwith-Hall BM, Holmes E, Lindon JC, Gounarides J, Vickers A,Shapiro M, et al. NMR-based metabonomic studies on the biochemicaleffects of commonly used drug carrier vehicles in the rat. Chem ResToxicol. 2002;15(9):1136-41, http://dx.doi.org/10.1021/tx020020+.
19. Ludwig C, Ward DG, Martin A, Viant MR, Ismail T, Johnson PJ, et al. Fasttargeted multidimensional NMR metabolomics of colorectal cancer. MagnReson Chem. 2009;47(Suppl 1):S68-73, http://dx.doi.org/10.1002/mrc.2519.
20. Tiziani S, Lopes V, Gunther UL. Early stage diagnosis of oral cancerusing 1H NMR-based metabolomics. Neoplasia. 2009;11(3):269-76.
21. Gao H, Lu Q, Liu X, Cong H, Zhao L, Wang H, et al. Application of 1HNMR-based metabonomics in the study of metabolic profiling of humanhepatocellular carcinoma and liver cirrhosis. Cancer Sci. 2009;100(4):782-5, http://dx.doi.org/10.1111/j.1349-7006.2009.01086.x.
22. Maher AD, Crockford D, Toft H, Malmodin D, Faber JH, McCarthy MI,et al. Optimization of human plasma 1H NMR spectroscopic dataprocessing for high-throughput metabolic phenotyping studies anddetection of insulin resistance related to type 2 diabetes. Anal Chem2008;80(19):7354-62, http://dx.doi.org/10.1021/ac801053g.
23. Quinones MP, Kaddurah-Daouk R. Metabolomics tools for identifyingbiomarkers for neuropsychiatric diseases. Neurobiol Dis. 2009;35(2):165-76, http://dx.doi.org/10.1016/j.nbd.2009.02.019.
24. Jung JY, Lee HS, Kang DG, Kim NS, Cha MH, Bang OS, et al. 1H-NMR-Based Metabolomics Study of Cerebral Infarction. Stroke. 2011;42(5):1282-8, http://dx.doi.org/10.1161/STROKEAHA.110.598789.
25. Kang SM, Park JC, Shin MJ, Lee H, Oh J, Ryu do H, et al. (1)H nuclearmagnetic resonance based metabolic urinary profiling of patients withischemic heart failure. Clin Biochem. 2011;44(4):293-9, http://dx.doi.org/10.1016/j.clinbiochem.2010.11.010.
26. Larsen FH, van den Berg F, Engelsen SB. An exploratory chemometricstudy of 1H NMR spectra of table wines. J Chemometr. 2006;20(4):198–208, http://dx.doi.org/10.1002/cem.991.
27. Wiklund S, Johansson E, Sjostrom L, Mellerowicz EJ, Edlund U, Shockcor JP,et al. Visualization of GC/TOF-MS-based metabolomics data for identifica-tion of biochemically interesting compounds using OPLS class models. AnalChem.2008;80(1):115-22, http://dx.doi.org/10.1021/ac0713510.
28. Ni Y, Su M, Lin J, Wang X, Qiu Y, Zhao A, et al. Metabolic profilingreveals disorder of amino acid metabolism in four brain regions from arat model of chronic unpredictable mild stress. FEBS Lett.2008;582(17):2627-36, http://dx.doi.org/10.1016/j.febslet.2008.06.040.
29. Aarøe J, Lindahl T, Dumeaux V, Saebø S, Tobin D, Hagen N, et al. Geneexpression profiling of peripheral blood cells for early detection of breastcancer. Breast Cancer Res. 2010;12(1):R7, http://dx.doi.org/10.1186/bcr2472.
30. Wishart DS, Lewis MJ, Morrissey JA, Flegel MD, Jeroncic K, Xiong Y,et al. The human cerebrospinal fluid metabolome. J Chromatogr B AnalytTechnol Biomed Life Sci. 2008;871(2):164-73.
31. Kang SM, Park JC, Shin MJ, Lee H, Oh J, Ryu do H, et al. 1H nuclearmagnetic resonance based metabolic urinary profiling of patients withischemic heart failure. Clinical Biochemistry. 2011;44(4):293-9, http://dx.doi.org/10.1016/j.clinbiochem.2010.11.010.
32. Grove H, Jørgensen BM, Jessen F, Søndergaard I, Jacobsen S, Hollung K,et al. Combination of statistical approaches for analysis of 2-DE datagives complementary results. J Proteome Res. 2008;7(12):5119-24, http://dx.doi.org/10.1021/pr800424c.
33. Nakamaki S, Satoh H, Kudoh A, Hayashi Y, Hirai H, Watanabe T.Adiponectin reduces proteinuria in streptozotocin-induced diabeticWistar rats. Exp Biol Med (Maywood). 2011;236(5):614-20, http://dx.doi.org/10.1258/ebm.2011.010218.
34. Rifai A, Dworkin LD. IgA nephropathy: markers of progression andclues to pathogenesis. Kidney Int. 2008;73(12):1338–40, http://dx.doi.org/10.1038/ki.2008.158.
35. Suzuki H, Moldoveanu Z, Hall S, Brown R, Vu HL, Novak L, et al. IgA1secreting cell lines from patients with IgA nephropathy produceaberrantly glycosylated IgA1. J Clin Invest. 2008;118(2):629–39.
36. Oberholzer J, Testa G, Sankary H, et al. Kidney transplantation at theUniversity of Illinois at Chicago from 1988–2004. Clin Transpl. 2004;143–9.
37. Graham GD, Blamire AM, Howseman AM, Rothman DL, FayadPB,Brass LM, et al. Proton magnetic resonance spectroscopy of cerebrallactate and other metabolites in stroke patients. Stroke. 1992;23(3):333–40,http://dx.doi.org/10.1161/01.STR.23.3.333.
38. Waters NJ, Waterfield CJ, Farrant RD, Holmes E, Nicholson JK.Metabonomic deconvolution of embedded toxicity: application tothioacetamide hepato- and nephrotoxicity. Chem ResToxicol.2005;18(4):639-54.
39. Nicholson JK, Lindon JC, Holmes E. ‘Metabonomics’: understanding themetabolic responses of living systems to pathophysiological stimuli viamultivariate statistical analysis of biological NMR spectroscopic data.Xenobiotica. 1999;29(11):1181–9, http://dx.doi.org/10.1080/004982599238047.
40. Lindon JC, Holmes E, Bollard ME, Stanley EG, Nicholson JK.Metabonomics technologies and their applications in physiologicalmonitoring, drug safety assessment and disease diagnosis. Biomarkers.2004;9(1):1–31, http://dx.doi.org/10.1080/13547500410001668379.
41. Kumar A, Bala L, Kalita J, Misra UK, Singh RL, Khetrapal CL, et al.Metabolomic analysis of serum by (1) H NMR spectroscopy inamyotrophic lateral sclerosis. Clin Chim Acta. 2010;411(7-8):563-7,http://dx.doi.org/10.1016/j.cca.2010.01.016.
42. Glunde K, Ackerstaff E, Mori N, Jacobs MA, Bhujwalla ZM. Cholinephospholipid metabolism in cancer: consequences for molecular phar-maceutical interventions. Mol Pharm. 2006;3:496-506, http://dx.doi.org/10.1021/mp060067e.
43. Lovejoy TI, Revenson TA, France CR. Reviewing manuscripts for peer-review journals: a primer for novice and seasoned reviewers. Ann BehavMed. 2011;42(1):1-13, http://dx.doi.org/10.1007/s12160-011-9269-x.
44. Garmel GM. Reviewing manuscripts for biomedical journals. Perm J.2010;14(1):32-40.
45. Lee SM, Rao VM, Franklin WA, Schiffer MS, Aronson AJ, Spargo BH,et al. IgA nephropathy: morphologic predictors of progressive renaldisease. Hum Pathol. 1982;13(4):314-22, http://dx.doi.org/10.1016/S0046-8177(82)80221-9.
CLINICS 2012;67(4):363-373 Metabonomics profiling in immunoglobulin A nephropathySui W et al.
373