CLINICAL RESEARCH Additional value of three … · connected to an iE-33 ultrasound system...
12
Archives of Cardiovascular Disease (2009) 102, 497—508 CLINICAL RESEARCH Additional value of three-dimensional echocardiography in patients with cardiac resynchronization therapy Apport de l’échographie cardiaque 3-dimensionnelle chez les patients bénéficiant d’une resynchronisation biventriculaire Antoine Deplagne b , Pierre Bordachar a,b,∗ , Patricia Reant a,b , Michel Montaudon b , Sylvain Reuter b , Julien Laborderie b , Pierre Dos Santos a,b , Raymond Roudaut b , Pierre Jais b , Michel Haissaguerre b , Franc ¸ois Laurent b , Jacques Clementy b , Stéphane Lafitte a,b a Université Bordeaux-2, Bordeaux, France b CHU of Bordeaux, Bordeaux, France Received 28 October 2008; received in revised form 13 March 2009; accepted 16 March 2009 Available online 21 June 2009 KEYWORDS Cardiac resynchronization therapy; Echocardiography; Dyssynchrony; 3-dimensionnal Summary Background. — There is no gold standard technique for quantification of ventricular dyssyn- chrony. Aim. — To investigate whether additional real-time three-dimensional morphologic assessment of ventricular dyssynchrony affects response after biventricular pacing. Methods. — Forty-one patients with severe heart failure were implanted with a biventric- ular pacing device and underwent two-dimensional (time dispersion of 12 left ventricular electromechanical delays) and three-dimensional echocardiographic assessment of ventricular dyssynchrony (dispersion of time to minimum regional volume for 16 left ventricular segments), Abbreviations: 2D, two-dimensional; 3D, three-dimensional; BVP, biventricular pacing; CRT, cardiac resynchronization therapy; LVEF, left ventricular ejection fraction; NYHA, New York Heart Association. ∗ Corresponding author. Hôpital cardiologique du Haut-Lévêque, 33604 Bordeaux-Pessac, France. Fax: +33 5 57 65 65 09. E-mail address: [email protected] (P. Bordachar). 1875-2136/$ — see front matter © 2009 Elsevier Masson SAS. All rights reserved. doi:10.1016/j.acvd.2009.03.013
Transcript of CLINICAL RESEARCH Additional value of three … · connected to an iE-33 ultrasound system...
Archives of Cardiovascular Disease (2009) 102, 497—508
CLINICAL RESEARCH
Additional value of three-dimensionalechocardiography in patients with cardiacresynchronization therapy
Apport de l’échographie cardiaque 3-dimensionnelle chez les patientsbénéficiant d’une resynchronisation biventriculaire
Antoine Deplagneb, Pierre Bordachara,b,∗,Patricia Reanta,b, Michel Montaudonb,Sylvain Reuterb, Julien Laborderieb,Pierre Dos Santosa,b, Raymond Roudautb,Pierre Jaisb, Michel Haissaguerreb,Francois Laurentb, Jacques Clementyb,Stéphane Lafittea,b
a Université Bordeaux-2, Bordeaux, Franceb CHU of Bordeaux, Bordeaux, France
Received 28 October 2008; received in revised form 13 March 2009; accepted 16 March 2009Available online 21 June 2009
KEYWORDSCardiacresynchronizationtherapy;Echocardiography;
SummaryBackground. — There is no gold standard technique for quantification of ventricular dyssyn-chrony.Aim. — To investigate whether additional real-time three-dimensional morphologic assessment
Dyssynchrony;3-dimensionnal
of ventricular dyssynchrony affects response after biventricular pacing.Methods. — Forty-one patients with severe heart failure were implanted with a biventric-ular pacing device and underwent two-dimensional (time dispersion of 12 left ventricularelectromechanical delays) and three-dimensional echocardiographic assessment of ventriculardyssynchrony (dispersion of time to minimum regional volume for 16 left ventricular segments),
Abbreviations: 2D, two-dimensional; 3D, three-dimensional; BVP, biventricular pacing; CRT, cardiac resynchronization therapy; LVEF, leftventricular ejection fraction; NYHA, New York Heart Association.∗ Corresponding author. Hôpital cardiologique du Haut-Lévêque, 33604 Bordeaux-Pessac, France. Fax: +33 5 57 65 65 09.
E-mail address: [email protected] (P. Bordachar).
1875-2136/$ — see front matter © 2009 Elsevier Masson SAS. All rights reserved.doi:10.1016/j.acvd.2009.03.013
498
MOTS CLÉSÉchographietridimensionnelle ;Resynchronisationbiventriculaire ;Asynchronisme
Conclusion. — Cette étude prospective démontre un intérêt important de la mesure del’asynchronisme 3D pour prédire la réponse après resynchronisation et pour permettrel’optimisation des réglages de l’appareil.
. Tou
I
Ctpot[dfpgpia
theceiewd[t
© 2009 Elsevier Masson SAS
ntroduction
RT has an established role in the management of symp-omatic drug-refractory heart failure in patients withrolonged QRS complexes [1—3]. Despite the applicationf established selection electrocardiographic criteria, upo one-third of patients do not respond to the therapy3,4]. In single-centre studies, direct assessment of echocar-iographic mechanical ventricular dyssynchrony has beenound to be useful in selecting appropriate patients for CRT,redicting a favourable response and optimizing device pro-
ramming [5—9]. Currently, an array of echocardiographicarameters for quantification of ventricular dyssynchronys available but a gold standard technique has yet to beccepted. A recent, prospective, multicentre study foundeqtc
s droits réservés.
hat some indices of 2D dyssynchrony were associated withigh inter- and intraobserver variability, and that no 2Dchocardiographic measurement alone improved the pro-ess of patient selection for CRT reliably [10]. Real-time 3Dchocardiography has already shown a high level of accuracyn determining LVEF and left ventricular volume [11,12]. 3Dchocardiography with appropriate software for segmentalall motion analysis allows the quantification of mechanicalyssynchrony, taking all myocardial segments into account13]. The present study was designed to examine whetherhe measurement of left ventricular synchronicity by 3D
A. Deplagne et al.
before implantation, 2 days postimplantation with optimization of the pacing interventriculardelay and 6 months postimplantation.Results. — Individual optimization of sequential biventricular pacing based on three-dimensional ventricular dyssynchrony provided more improvement (p < 0.05) in left ventricularejection fraction and cardiac output than simultaneous biventricular pacing. During the dif-ferent configurations of sequential biventricular pacing, the changes in three-dimensionalventricular dyssynchrony were highly correlated with those of cardiac output (r = −0.67,p < 0.001) and ejection fraction (r = −0.68, p < 0.001). The correlations between two-dimensional ventricular dyssynchrony and cardiac output or ejection fraction were significantbut less (r = −0.60, p < 0.01 and r = −0.56, p < 0.05, respectively). After 6 months, 76% of patientswere considered responders (10% decrease in end-systolic volume). Before implantation, weobserved a significant difference between responders and non-responders in terms of three-dimensional (p < 0.05) — but not two-dimensional — ventricular dyssynchrony.Conclusion. — This prospective study demonstrated the additional value of three-dimensionalassessment of ventricular dyssynchrony in predicting response after biventricular pacing andoptimizing the pacing configuration.© 2009 Elsevier Masson SAS. All rights reserved.
RésuméIntroduction. — Dans cette étude prospective, nous avons évalué l’intérêt d’une évaluation del’asynchronisme ventriculaire gauche par échographie tridimensionnelle (3D) chez les patientsayant bénéficié de l’implantation d’une resynchronisation biventriculaire (BV).Méthodes. — Quarante et un patients insuffisants cardiaques ont été implantés d’un pacemakerou d’un défibrillateur triple-chambre et ont bénéficié d’une échographie bidimensionnelle (2D)et tridimensionnelle avec mesure de l’asynchronisme ventriculaire gauche (1) avant implanta-tion, (2) deux jours après l’implantation avec optimisation des délais interventriculaires et (3)six mois après l’implantation.Résultats. — (1) L’optimisation du délai interventriculaire basée sur l’évaluation del’asynchronisme 3D a permis un bénéfice significatif (p < 0,05) en termes de fraction d’éjectionet de débit cardiaque. (2) Les variations d’asynchronisme ventriculaire gauche 3D étaient haute-ment corrélées aux variations de débit cardiaque (r = −0,67 ; p < 0,001) et de fraction d’éjection(r = −0,68 ; p < 0,001). Ces mêmes corrélations étaient significatives mais moindres entre asyn-chronisme 2D et débit cardiaque ou fraction d’éjection (r = −0,60 ; p < 0,01 and r = −0,56 ;p < 0,05, respectivement). (3) Après six mois de stimulation biventriculaire, 76 % des patientsétaient considérés comme répondeurs à la resynchronisation (réduction d’au moins 10 % du vol-ume télésystolique). Avant l’implantation, les répondeurs présentaient un asynchronisme 3Dsignificativement (p < 0,05) supérieur que les non répondeurs. En revanche, cette différencen’était pas significative pour l’asynchronisme 2D.
chocardiography, using regional volumetric changes, coulduantify the effect of CRT on global left ventricular func-ion and mechanical asynchrony in patients with refractoryhronic heart failure, and provide additional information to
sfTdPadpwasus
P
A
3D echocardiography and cardiac resynchronization
optimize CRT device programming and distinguish betweenresponders and non-responders.
Methods
Reproducibility of 3D echocardiographicmeasurements
Interobserver and intraobserver reproducibility of 3Dechocardiographic measurements was assessed with lin-ear regression analysis and the Bland-Altman methodin 32 patients (28 men; mean age: 53 ± 16 years). Thesepatients were selected to demonstrate different levels ofleft ventricular dysfunction from normal heart to severecardiomyopathy.
Study population
Consecutive patients with drug-resistant heart failureundergoing implantation of a BVP device were enrolledprospectively on the following basis: LVEF less than 35%,
alrvl
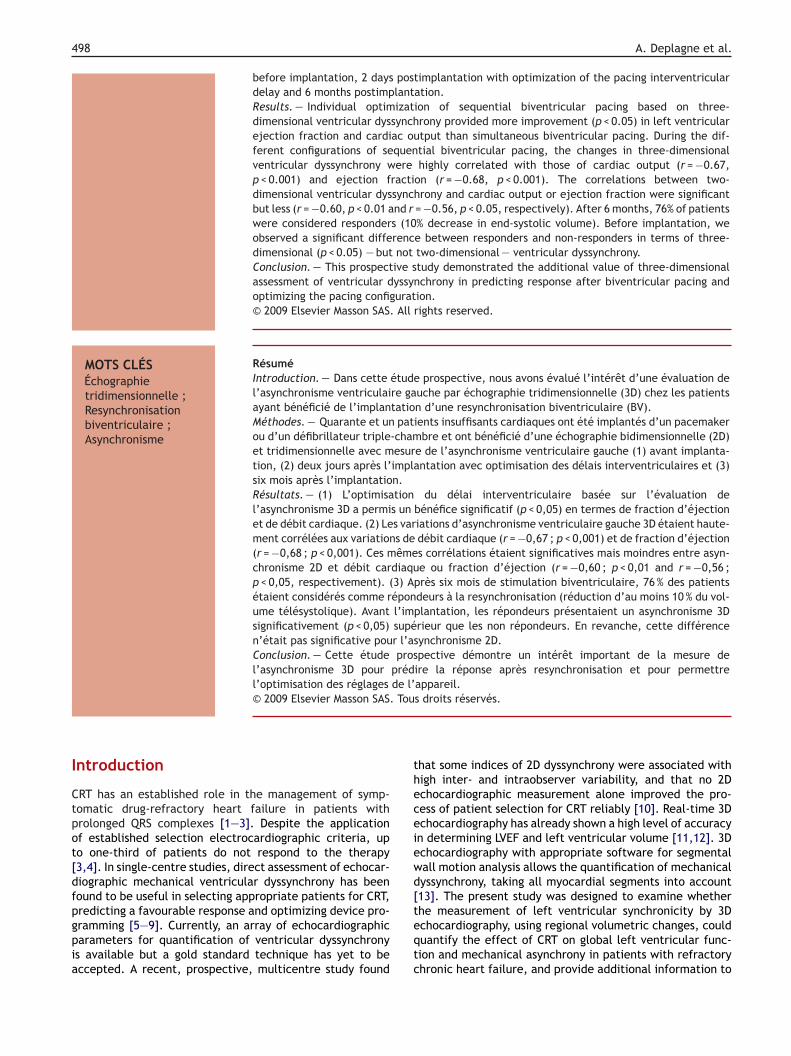
Figure 1. Upper part: left ventricle cast produced by quantitative offla patient with severe intraventricular dyssynchrony.
499
inus rhythm, QRS duration more than 120 ms, and NYHAunctional class III or IV, despite optimal medical therapy.he presence of echocardiographic evidence of ventricularyssynchrony was not an inclusion or exclusion criterion.atients with a history of atrial arrhythmias, completetrioventricular block or ongoing symptoms of myocar-ial ischaemia were excluded from the study protocol. Allatients provided written, informed consent to the study,hich was approved by the institutional clinical researchnd ethics committee. Of the 46 patients who met the inclu-ion criteria, five had to be excluded because of a poorltrasonic window that did not allow exploitable 3D acqui-itions.
acemaker implantation
ll patients had successful implantation of a CRT device
nd all leads were positioned transvenously. The atrialead was positioned at the right atrial appendage and theight ventricular lead was positioned at the apex. The leftentricular lead (Attain OTW 4194, Medtronic, Minneapo-is, MN, USA) was positioned in a posterior (n = 7), lateraline analysis. Lower part and right side: regional volume curves in
5 A. Deplagne et al.
(nMeo
S
ACDiFmpaedaro
5tiptsvdlcwpatttsto
cdtdahiu(vta1spro
si
days after implantation, various predetermined pacingconfigurations were assessed using spontaneous atrial syn-chronized pacing: right ventricular pacing; left ventricularpacing; simultaneous BVP; sequential BVP with right ven-tricular pre-activation with interventricular intervals of 20and 40 ms; and sequential BVP with left ventricular pre-activation with interventricular intervals of 20 and 40 ms.These configurations were performed in a random order.The optimal interventricular delay was defined as the onethat resulted in maximal decrease in 3D dyssynchrony. Asdescribed previously, the atrioventricular delay was opti-mized for each configuration to provide the longest trans-mitral filling time without truncation of the A-wave frompulsed Doppler analysis of the left ventricular filling [15].
Statistical analysis
All data are presented as mean values ± standard deviations.Sequential data measurements were analysed by repeatedmeasures of analysis of variance. Spontaneous rhythm wasconsidered as the reference pacing configuration for thecomparison of all sequential BVP configurations and to assessthe correlations between the percentage change in cardiacoutput and LVEF on the one hand, and markers of ventriculardyssynchrony on the other. Pearson’s correlation coefficientwas used to quantify correlations between quantitative vari-ables. Reproducibility of measurements was assessed withlinear regression analysis and the Bland-Altman method. Sta-tistical significance was established at p < 0.05.
Results
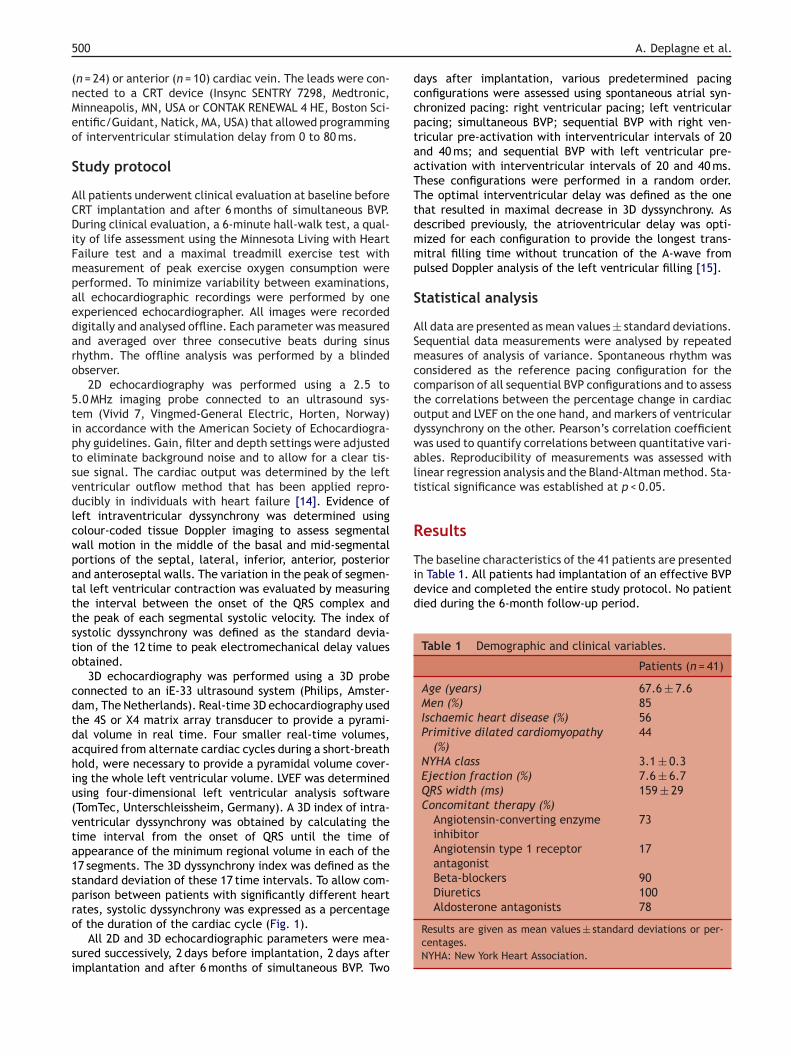
The baseline characteristics of the 41 patients are presentedin Table 1. All patients had implantation of an effective BVPdevice and completed the entire study protocol. No patientdied during the 6-month follow-up period.
Table 1 Demographic and clinical variables.
Patients (n = 41)
Age (years) 67.6 ± 7.6Men (%) 85Ischaemic heart disease (%) 56Primitive dilated cardiomyopathy
(%)44
NYHA class 3.1 ± 0.3Ejection fraction (%) 7.6 ± 6.7QRS width (ms) 159 ± 29Concomitant therapy (%)
Angiotensin-converting enzymeinhibitor
73
Angiotensin type 1 receptorantagonist
17
Beta-blockers 90Diuretics 100
00
n = 24) or anterior (n = 10) cardiac vein. The leads were con-ected to a CRT device (Insync SENTRY 7298, Medtronic,inneapolis, MN, USA or CONTAK RENEWAL 4 HE, Boston Sci-ntific/Guidant, Natick, MA, USA) that allowed programmingf interventricular stimulation delay from 0 to 80 ms.
tudy protocol
ll patients underwent clinical evaluation at baseline beforeRT implantation and after 6 months of simultaneous BVP.uring clinical evaluation, a 6-minute hall-walk test, a qual-
ty of life assessment using the Minnesota Living with Heartailure test and a maximal treadmill exercise test witheasurement of peak exercise oxygen consumption wereerformed. To minimize variability between examinations,ll echocardiographic recordings were performed by onexperienced echocardiographer. All images were recordedigitally and analysed offline. Each parameter was measurednd averaged over three consecutive beats during sinushythm. The offline analysis was performed by a blindedbserver.
2D echocardiography was performed using a 2.5 to.0 MHz imaging probe connected to an ultrasound sys-em (Vivid 7, Vingmed-General Electric, Horten, Norway)n accordance with the American Society of Echocardiogra-hy guidelines. Gain, filter and depth settings were adjustedo eliminate background noise and to allow for a clear tis-ue signal. The cardiac output was determined by the leftentricular outflow method that has been applied repro-ucibly in individuals with heart failure [14]. Evidence ofeft intraventricular dyssynchrony was determined usingolour-coded tissue Doppler imaging to assess segmentalall motion in the middle of the basal and mid-segmentalortions of the septal, lateral, inferior, anterior, posteriornd anteroseptal walls. The variation in the peak of segmen-al left ventricular contraction was evaluated by measuringhe interval between the onset of the QRS complex andhe peak of each segmental systolic velocity. The index ofystolic dyssynchrony was defined as the standard devia-ion of the 12 time to peak electromechanical delay valuesbtained.
3D echocardiography was performed using a 3D probeonnected to an iE-33 ultrasound system (Philips, Amster-am, The Netherlands). Real-time 3D echocardiography usedhe 4S or X4 matrix array transducer to provide a pyrami-al volume in real time. Four smaller real-time volumes,cquired from alternate cardiac cycles during a short-breathold, were necessary to provide a pyramidal volume cover-ng the whole left ventricular volume. LVEF was determinedsing four-dimensional left ventricular analysis softwareTomTec, Unterschleissheim, Germany). A 3D index of intra-entricular dyssynchrony was obtained by calculating theime interval from the onset of QRS until the time ofppearance of the minimum regional volume in each of the7 segments. The 3D dyssynchrony index was defined as thetandard deviation of these 17 time intervals. To allow com-arison between patients with significantly different heart
ates, systolic dyssynchrony was expressed as a percentagef the duration of the cardiac cycle (Fig. 1).All 2D and 3D echocardiographic parameters were mea-ured successively, 2 days before implantation, 2 days aftermplantation and after 6 months of simultaneous BVP. Two
Aldosterone antagonists 78
Results are given as mean values ± standard deviations or per-centages.NYHA: New York Heart Association.

3D echocardiography and cardiac resynchronization 501
ricul
iw(f2wtrueafd(sv(
s
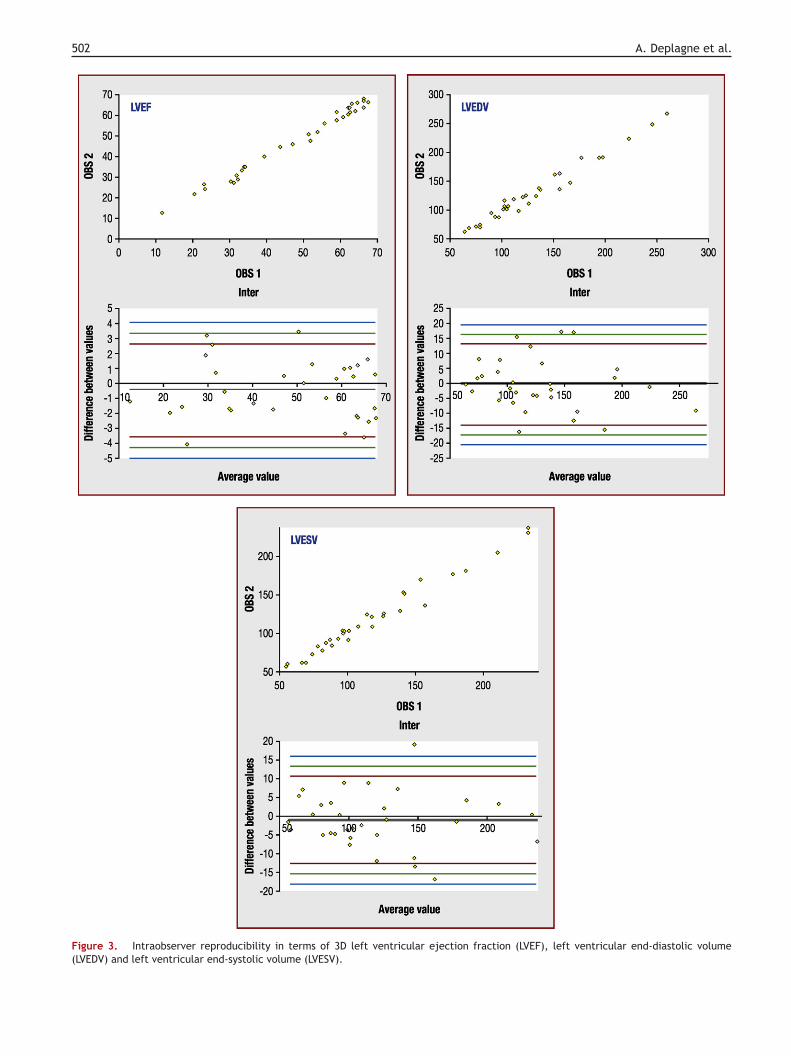
Figure 2. Interobserver reproducibility in terms of 3D left vent(LVEDV) and left ventricular end-systolic volume (LVESV).
Reproducibility of echocardiographicmeasurements
Interobserver variability mean average error (and 95% confi-dence interval value) obtained from the Bland-Altmananalysis of 3D LVEF and 3D left ventricular end-systolic andend-diastolic volumes were −0.2% (3.3%), −1.2 mL (13.7 mL)and −0.2 mL (16.1 mL), respectively (Figs. 2 and 3).
Intraobserver variability mean average error (and 95%confidence interval value) obtained from the Bland-Altmananalysis of 3D LVEF and 3D left ventricular end-systolic andend-diastolic volumes were 0.1% (2.8%), −0.1 mL (8.4 mL)and 0.3 mL (9.6 mL), respectively.
Acute impact of biventricular pacing
Compared with baseline evaluation, simultaneous BVPincreased LVEF significantly from 27.6 ± 6.7 to 31.0 ± 6.7%(p < 0.05), increased cardiac output significantly from
2.2 ± 0.4 to 2.8 ± 0.6 L/min (p < 0.01), reduced 2D leftventricular dyssynchrony significantly from 32.0 ± 8.9 to23.7 ± 10.0 ms (p < 0.01) and reduced 3D left ventriculardyssynchrony significantly from 10.0 ± 2.8 to 6.9 ± 2.3%(p < 0.01) (Table 2) (Figs. 4—7).prpiw
Table 2 Echocardiographic data: baseline, simultaneous and
Baseline
Cardiac output (L/min) 2.2 ± 0.4LVEF (%) 27.6 ± 6.73D left ventricular dyssynchrony (%) 10.0 ± 2.82D left ventricular dyssynchrony (ms) 32.0 ± 8.9
Results are given as mean values ± standard deviations.2D: two-dimensional; 3D: three-dimensional; BVP: biventricular pacinga p < 0.05 versus baseline.b p < 0.01 versus baseline.c p < 0.05 versus simultaneous BVP.d p < 0.01 versus simultaneous BVP.
ar ejection fraction (LVEF), left ventricular end-diastolic volume
After optimization of the interventricular delay accord-ng to the level of 3D dyssynchrony, simultaneous BVPas the optimal pacing configuration for three patients
7%). Pre-activation of the left ventricle was optimalor 23 patients (56%) with an interventricular interval of0 ms for eight patients, 40 ms for five patients, andith left ventricular pacing alone for 10 patients. For
he 15 remaining patients (37%), pre-activation of theight ventricular lead was optimal with an interventric-lar interval of 20 ms for seven patients and 40 ms foright patients. Compared with simultaneous BVP, individu-lly optimized sequential BVP increased LVEF significantlyrom 31.0 ± 6.7 to 33.5 ± 6.9% (p < 0.05), increased car-iac output significantly from 2.8 ± 0.6 to 3.1 ± 0.6 L/minp < 0.05) and decreased 3D left ventricular dyssynchronyignificantly from 6.9 ± 2.3 to 4.9 ± 1.8% (p < 0.01). 2D leftentricular dyssynchrony was not decreased significantly23.7 ± 10.0 ms versus 21.5 ± 9.9 ms; p = not significant).
Changes in 3D left ventricular dyssynchrony betweenimultaneous BVP, right ventricular pacing, left ventricular
acing and sequential BVP exhibited highly significant cor-elation with changes in cardiac output and LVEF (r = −0.67,< 0.001 and r = −0.68, p < 0.001, respectively). Changesn 2D left ventricular dyssynchrony correlated significantlyith changes in cardiac output and LVEF, but with lower
optimized sequential biventricular pacing.
Simultaneous BVP Optimized sequential BVP
2.8 ± 0.6b 3.1 ± 0.6b,c
31.0 ± 6.7a 33.5 ± 6.9b,c
6.9 ± 2.3b 4.9 ± 1.8b,d
23.7 ± 10.0b 21.5 ± 9.9b
; LVEF: left ventricular ejection fraction.
502 A. Deplagne et al.
F(
igure 3. Intraobserver reproducibility in terms of 3D left ventriculLVEDV) and left ventricular end-systolic volume (LVESV).
ar ejection fraction (LVEF), left ventricular end-diastolic volume
3D echocardiography and cardiac resynchronization 503
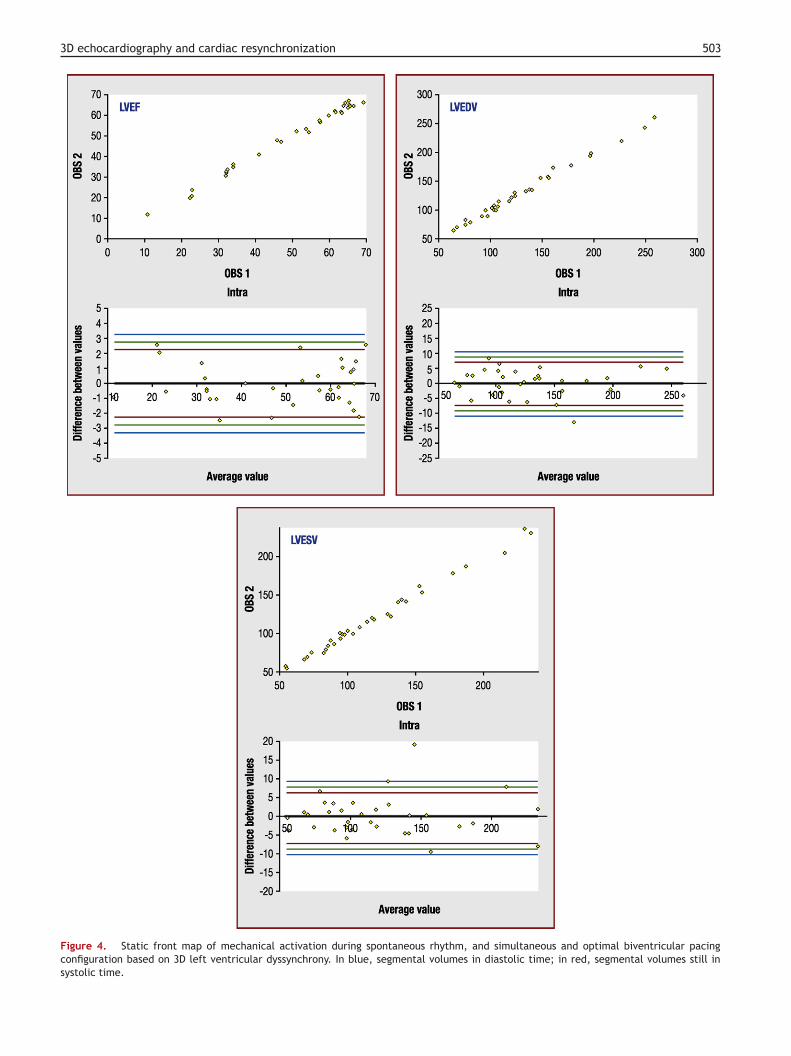
Figure 4. Static front map of mechanical activation during spontaneous rhythm, and simultaneous and optimal biventricular pacingconfiguration based on 3D left ventricular dyssynchrony. In blue, segmental volumes in diastolic time; in red, segmental volumes still insystolic time.
504 A. Deplagne et al.
F left vo
rrau
M
Aqmi3(au
l1(tp
trsw
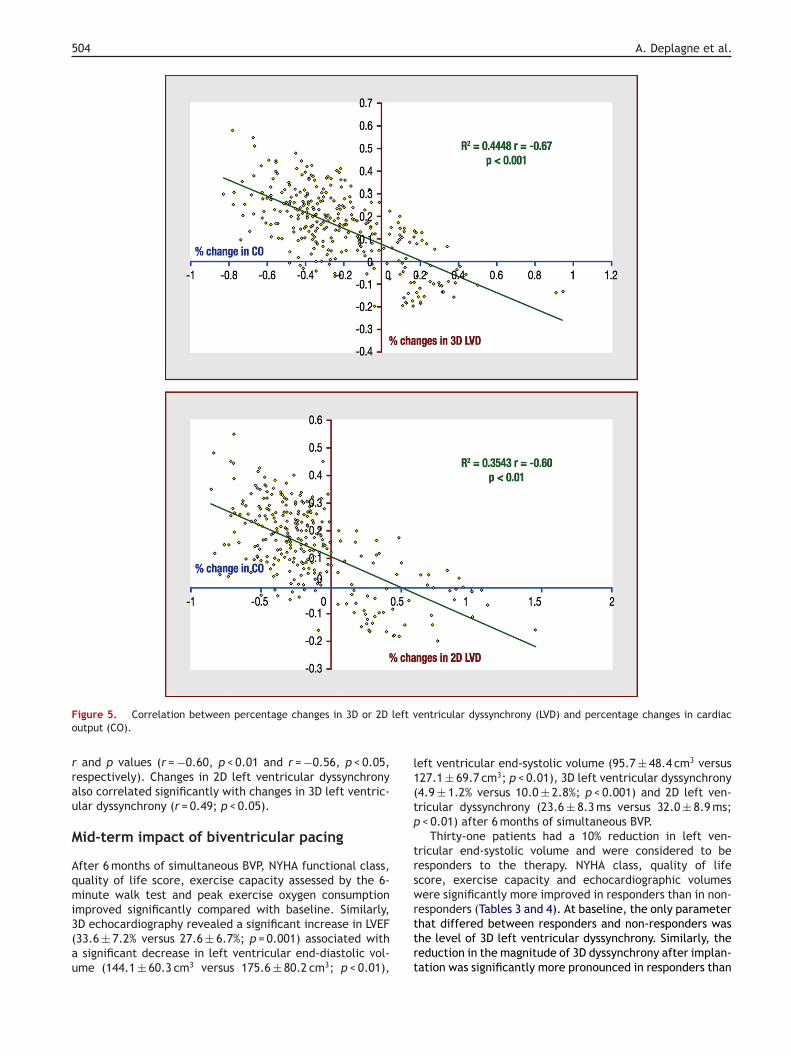
igure 5. Correlation between percentage changes in 3D or 2Dutput (CO).
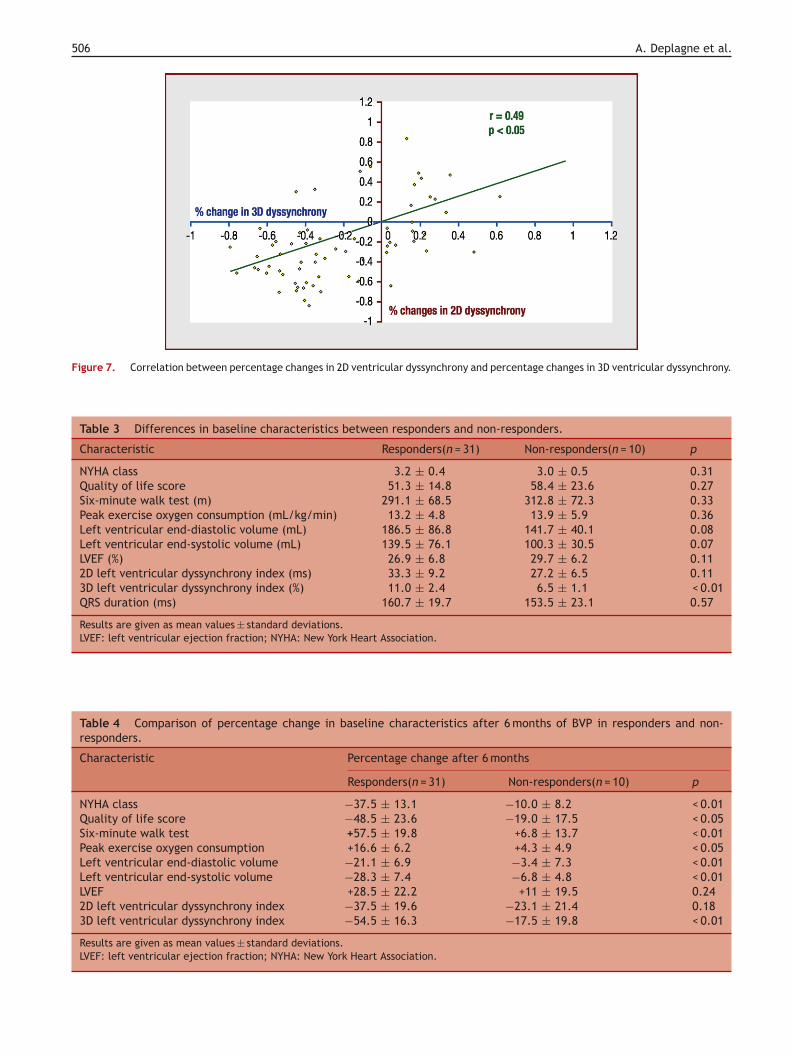
and p values (r = −0.60, p < 0.01 and r = −0.56, p < 0.05,espectively). Changes in 2D left ventricular dyssynchronylso correlated significantly with changes in 3D left ventric-lar dyssynchrony (r = 0.49; p < 0.05).
id-term impact of biventricular pacing
fter 6 months of simultaneous BVP, NYHA functional class,uality of life score, exercise capacity assessed by the 6-inute walk test and peak exercise oxygen consumption
mproved significantly compared with baseline. Similarly,D echocardiography revealed a significant increase in LVEF33.6 ± 7.2% versus 27.6 ± 6.7%; p = 0.001) associated withsignificant decrease in left ventricular end-diastolic vol-
me (144.1 ± 60.3 cm3 versus 175.6 ± 80.2 cm3; p < 0.01),
rttrt
entricular dyssynchrony (LVD) and percentage changes in cardiac
eft ventricular end-systolic volume (95.7 ± 48.4 cm3 versus27.1 ± 69.7 cm3; p < 0.01), 3D left ventricular dyssynchrony4.9 ± 1.2% versus 10.0 ± 2.8%; p < 0.001) and 2D left ven-ricular dyssynchrony (23.6 ± 8.3 ms versus 32.0 ± 8.9 ms;< 0.01) after 6 months of simultaneous BVP.
Thirty-one patients had a 10% reduction in left ven-ricular end-systolic volume and were considered to beesponders to the therapy. NYHA class, quality of lifecore, exercise capacity and echocardiographic volumesere significantly more improved in responders than in non-
esponders (Tables 3 and 4). At baseline, the only parameterhat differed between responders and non-responders washe level of 3D left ventricular dyssynchrony. Similarly, theeduction in the magnitude of 3D dyssynchrony after implan-ation was significantly more pronounced in responders than
3D echocardiography and cardiac resynchronization 505
left
gadpcacbiv
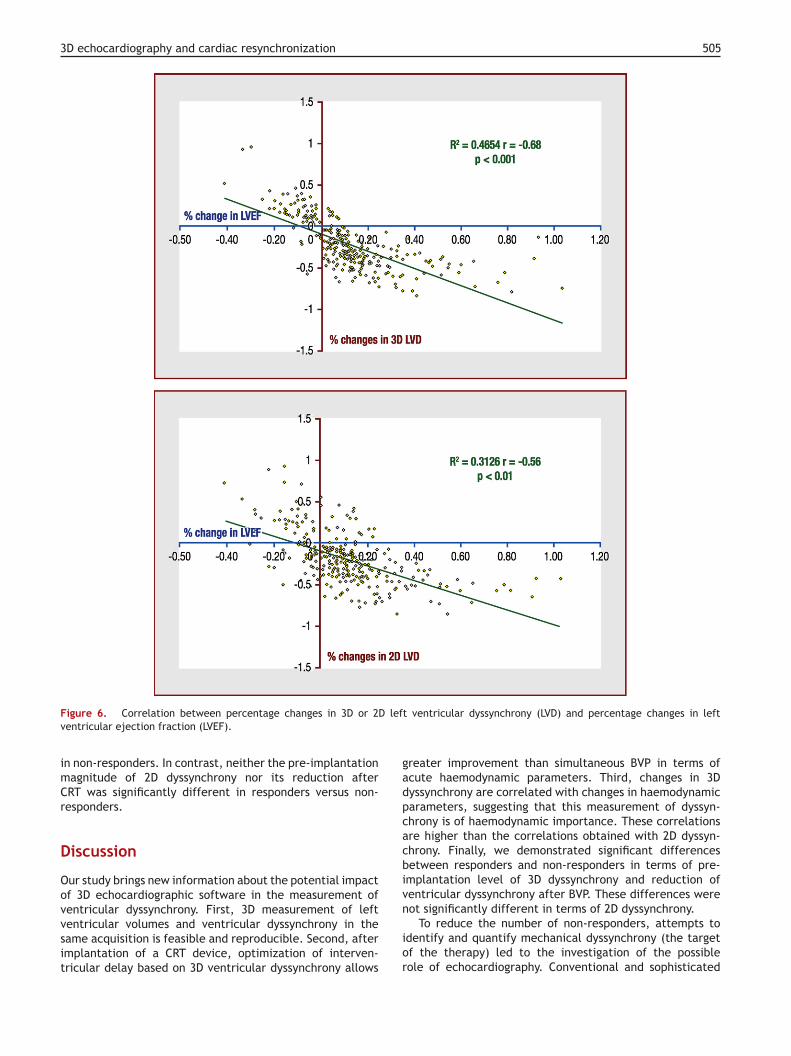
Figure 6. Correlation between percentage changes in 3D or 2Dventricular ejection fraction (LVEF).
in non-responders. In contrast, neither the pre-implantationmagnitude of 2D dyssynchrony nor its reduction afterCRT was significantly different in responders versus non-responders.
Discussion
Our study brings new information about the potential impactof 3D echocardiographic software in the measurement of
ventricular dyssynchrony. First, 3D measurement of leftventricular volumes and ventricular dyssynchrony in thesame acquisition is feasible and reproducible. Second, afterimplantation of a CRT device, optimization of interven-tricular delay based on 3D ventricular dyssynchrony allowsn
ior
ventricular dyssynchrony (LVD) and percentage changes in left
reater improvement than simultaneous BVP in terms ofcute haemodynamic parameters. Third, changes in 3Dyssynchrony are correlated with changes in haemodynamicarameters, suggesting that this measurement of dyssyn-hrony is of haemodynamic importance. These correlationsre higher than the correlations obtained with 2D dyssyn-hrony. Finally, we demonstrated significant differencesetween responders and non-responders in terms of pre-mplantation level of 3D dyssynchrony and reduction ofentricular dyssynchrony after BVP. These differences were
ot significantly different in terms of 2D dyssynchrony.To reduce the number of non-responders, attempts todentify and quantify mechanical dyssynchrony (the targetf the therapy) led to the investigation of the possibleole of echocardiography. Conventional and sophisticated
506 A. Deplagne et al.
Figure 7. Correlation between percentage changes in 2D ventricular dyssynchrony and percentage changes in 3D ventricular dyssynchrony.
Table 3 Differences in baseline characteristics between responders and non-responders.
Characteristic Responders(n = 31) Non-responders(n = 10) p
NYHA class 3.2 ± 0.4 3.0 ± 0.5 0.31Quality of life score 51.3 ± 14.8 58.4 ± 23.6 0.27Six-minute walk test (m) 291.1 ± 68.5 312.8 ± 72.3 0.33Peak exercise oxygen consumption (mL/kg/min) 13.2 ± 4.8 13.9 ± 5.9 0.36Left ventricular end-diastolic volume (mL) 186.5 ± 86.8 141.7 ± 40.1 0.08Left ventricular end-systolic volume (mL) 139.5 ± 76.1 100.3 ± 30.5 0.07LVEF (%) 26.9 ± 6.8 29.7 ± 6.2 0.112D left ventricular dyssynchrony index (ms) 33.3 ± 9.2 27.2 ± 6.5 0.113D left ventricular dyssynchrony index (%) 11.0 ± 2.4 6.5 ± 1.1 < 0.01QRS duration (ms) 160.7 ± 19.7 153.5 ± 23.1 0.57
Results are given as mean values ± standard deviations.LVEF: left ventricular ejection fraction; NYHA: New York Heart Association.
Table 4 Comparison of percentage change in baseline characteristics after 6 months of BVP in responders and non-responders.
Characteristic Percentage change after 6 months
Responders(n = 31) Non-responders(n = 10) p
NYHA class −37.5 ± 13.1 −10.0 ± 8.2 < 0.01Quality of life score −48.5 ± 23.6 −19.0 ± 17.5 < 0.05Six-minute walk test +57.5 ± 19.8 +6.8 ± 13.7 < 0.01Peak exercise oxygen consumption +16.6 ± 6.2 +4.3 ± 4.9 < 0.05Left ventricular end-diastolic volume −21.1 ± 6.9 −3.4 ± 7.3 < 0.01Left ventricular end-systolic volume −28.3 ± 7.4 −6.8 ± 4.8 < 0.01LVEF +28.5 ± 22.2 +11 ± 19.5 0.242D left ventricular dyssynchrony index −37.5 ± 19.6 −23.1 ± 21.4 0.183D left ventricular dyssynchrony index −54.5 ± 16.3 −17.5 ± 19.8 < 0.01
Results are given as mean values ± standard deviations.LVEF: left ventricular ejection fraction; NYHA: New York Heart Associa
tion.
ortatebdfoabwImamfeoPvt
C
Tiddar
R
3D echocardiography and cardiac resynchronization
echocardiographic techniques have been investigatedextensively but, to date, there is still no gold standardechocardiographic parameter for use in clinical prac-tice [5—9]. Some tissue Doppler imaging parameters ofdyssynchrony have clearly been shown to correlate withhaemodynamic parameters, to help in optimization ofdevice programming and to predict response after CRT, andare therefore used widely in the literature [5,7,9,16,17].However, the widespread adoption of these techniques inclinical practice has been limited by aspects of acquisi-tion and analysis, low reproducibility, poor spatial resolutionand non-simultaneous evaluation of segmental motion. Onlythe longitudinal function in the basal and mid-segmentsare studied. Moreover, the PROSPECT study concluded thatno single 2D echocardiographic measurement improved theprocess of patient selection for CRT reliably [10].
3D echocardiography provides a more accurate deter-mination of left ventricular volumes and systolic functionthan 2D echocardiography and may become very useful inthe field of CRT [11—13]. Indeed, 3D echocardiography mayovercome some of the limitations observed with 2D echocar-diography. As demonstrated in this study, the reproducibilitywith a semi-automatic endocardial contour analysis wasreliable and seemed superior than that obtained with the12-segment analysis of 2D dyssynchrony. The reproducibilityof an echocardiographic measurement is of major impor-tance if it is to be included in a multicentre study as aselection criterion. Moreover, quantification of mechanicaldyssynchrony with 3D echocardiography takes all myocardialsegments into account by examining the composite effectof radial, circumferential and longitudinal contraction. 2Dand 3D echocardiographic parameters explore different sys-tolic periods (end-systole with 3D echocardiography, peakof systolic velocity with 2D echocardiography). This mayexplain the difference in terms of correlation of 2D and 3Dechocardiographic parameters with haemodynamic status.Changes in 3D dyssynchrony were found to correlate highlywith changes in cardiac output and ejection fraction.
Echocardiographic dyssynchrony parameters may helpin the management of patients with heart failure, interms of selecting the candidate for CRT and optimizingthe programming of the pacing device after implantation.Before implantation, we demonstrated that future respon-ders exhibited significantly higher 3D dyssynchrony thanfuture non-responders. This seems promising in terms ofoptimizing the selection of candidates for CRT. In our study,the difference in terms of 2D dyssynchrony did not reachsignificance, in contrast with data published previously. Thelimited number of patients may be a possible explanation.Interestingly, responders had a significantly higher decreasein 3D dyssynchrony, suggesting that this parameter may helpwith the pre-implantation optimization of pacing sites basedon an acute maximal reduction of 3D dyssynchrony. Similarly,individually optimized sequential BVP based on 3D dyssyn-chrony allowed a significant improvement in haemodynamicparameters. Pre-discharge optimization of the interventric-ular delay may be proposed, despite the need for definite
proof of the clinical value of sequential BVP. However, assuggested by the PROSPECT study, no single-centre studycan come to a definitive conclusion about the value of anechocardiographic technique in the field of CRT [10]. A mul-ticentre study may be required to confirm our results.507
There are limitations to this study and to a 3D assessmentf ventricular dyssynchrony. The sample size (n = 41) wasather small to determine predictive factors of response, buthe protocol, with seven different echocardiographic evalu-tions, provided enough data for a solid statistical analysiso estimate the haemodynamic significance of the param-ters of dyssynchrony. We have demonstrated differencesetween responders and non-responders in terms of 3Dyssynchrony; however, we did not determine a cut-off valueor this parameter that allows selection and/or exclusionf CRT candidates in everyday clinical practice. The semi-utomated border detection algorithms are user-friendly,ut their use is very limited in patients with a poor ultrasonicindow, and the total procedure is still time-consuming.
mproved automatic endocardial border detection and a seg-ental online volume analysis may help to establish the
ssessment of 3D dyssynchrony as a daily practice clinicalethod for selecting, monitoring and optimizing CRT. The
act that 2D and 3D dyssynchrony were measured on differ-nt echocardiographic machines may have interfered withur data. Finally, the rate of response was high in our study.atients with a 10% reduction in left ventricular end-systolicolume were considered to be responders to the therapy; ahreshold of 15% might have yielded different results.
onclusion
his prospective echocardiographic study provides newnformation about the potential impact of 3D echocar-iographic software in the measurement of ventricularyssynchrony and demonstrates the additional value of 3Dssessment of ventricular dyssynchrony in predicting theesponse after BVP and optimizing the pacing configuration.
eferences
[1] Abraham WT, Fisher WG, Smith AL, et al. Cardiac resynchro-nization in chronic heart failure. N Engl J Med 2002;346:1845—53.
[2] Bristow MR, Saxon LA, Boehmer J, et al. Cardiac-resynchronization therapy with or without an implantabledefibrillator in advanced chronic heart failure. N Engl J Med2004;350:2140—50.
[3] Cleland JG, Daubert JC, Erdmann E, et al. The effect of cardiacresynchronization on morbidity and mortality in heart failure.N Engl J Med 2005;352:1539—49.
[4] Reuter S, Garrigue S, Barold SS, et al. Comparison of charac-teristics in responders versus nonresponders with biventricularpacing for drug-resistant congestive heart failure. Am J Cardiol2002;89:346—50.
[5] Bax JJ, Marwick TH, Molhoek SG, et al. Left ventricular dyssyn-chrony predicts benefit of cardiac resynchronization therapyin patients with end-stage heart failure before pacemakerimplantation. Am J Cardiol 2003;92:1238—40.
[6] Breithardt OA, Stellbrink C, Kramer AP, et al. Echocardio-graphic quantification of left ventricular asynchrony predictsan acute hemodynamic benefit of cardiac resynchronization
therapy. J Am Coll Cardiol 2002;40:536—45.[7] Sogaard P, Egeblad H, Kim WY, et al. Tissue Doppler imagingpredicts improved systolic performance and reversed left ven-tricular remodeling during long-term cardiac resynchronizationtherapy. J Am Coll Cardiol 2002;40:723—30.

5
[
[
[
[
[
[
[
Cardiol 2004;43:248—56.
08
[8] Yu CM, Fung JW, Zhang Q, et al. Tissue Doppler imaging is supe-rior to strain rate imaging and postsystolic shortening on theprediction of reverse remodeling in both ischemic and nonis-chemic heart failure after cardiac resynchronization therapy.Circulation 2004;110:66—73.
[9] Yu CM, Fung WH, Lin H, et al. Predictors of left ventricularreverse remodeling after cardiac resynchronization therapy forheart failure secondary to idiopathic dilated or ischemic car-diomyopathy. Am J Cardiol 2003;91:684—8.
10] Chung ES, Leon AR, Tavazzi L, et al. Results of the predic-tors of response to CRT (PROSPECT) trial. Circulation 2008;117:2608—16.
11] Jenkins C, Bricknell K, Hanekom L, et al. Reproducibil-ity and accuracy of echocardiographic measurements ofleft ventricular parameters using real-time three-dimensionalechocardiography. J Am Coll Cardiol 2004;44:878—86.
12] Sugeng L, Mor-Avi V, Weinert L, et al. Quantitative assessmentof left ventricular size and function: side-by-side comparison ofreal-time three-dimensional echocardiography and computedtomography with magnetic resonance reference. Circulation2006;114:654—61.
[
A. Deplagne et al.
13] Kapetanakis S, Kearney MT, Siva A, et al. Real-time three-dimensional echocardiography: a novel technique to quantifyglobal left ventricular mechanical dyssynchrony. Circulation2005;112:992—1000.
14] Gola A, Pozzoli M, Capomolla S, et al. Comparison of Dopplerechocardiography with thermodilution for assessing cardiacoutput in advanced congestive heart failure. Am J Cardiol1996;78:708—12.
15] Kindermann M, Frohlig G, Doerr T, et al. Optimizing the AVdelay in DDD pacemaker patients with high degree AV block:mitral valve Doppler versus impedance cardiography. PacingClin Electrophysiol 1997;20:2453—62.
16] Bader H, Garrigue S, Lafitte S, et al. Intra-left ventricularelectromechanical asynchrony. A new independent predictorof severe cardiac events in heart failure patients. J Am Coll
17] Bordachar P, Lafitte S, Reuter S, et al. Echocardiographicparameters of ventricular dyssynchrony validation in patientswith heart failure using sequential biventricular pacing. J AmColl Cardiol 2004;44:2157—65.