Clinical Pediatrics Simplified Pediatric Electrocardiogram...
10
Simplified Pediatric Electrocardiogram Interpretation William N. Evans, MD, Ruben J. Acherman, MD, Gary A. Mayman, MD, Robert C. Rollins, MD, and Katrinka T. Kip, MD 1 Step 1: Determine the Rate and Rhythm Rate Using lead II or the lead with the least artifact, calculate the approximate heart rate by counting the number of large boxes between 2 QRSs: heart rate = 300 ÷ number of large boxes between QRSs (Figure 2). Rhythm 1. Sinus rhythm is present if the PR interval is consistent throughout the tracing, and the P wave T he abbreviation EKG, for electrocardiogram, is easier to say than ECG, and in the hospi- tal, EKG is less likely to be confused with EEG, either verbally or in the medical record. 1 For this reason, some hospitals (for example, the Cardiology Department, Sunrise Hospital and Medical Center, Las Vegas, NV) require that staff use EKG. Willem Einthoven first used the abbrevia- tion “EKG” in a 1912 report composed in English, not German. 2 Thus, for this article, we use EKG rather than ECG. Our method for simplified EKG interpretation requires 4 short steps and only a few memorized rules. With these 4 steps and condensed rules, any health care provider can provide initial interpretation for most pediatric EKGs. A pediatric cardiologist should eventu- ally review all EKGs performed on children. The basis for a properly performed EKG is lead placement. The limb leads are simply placed on the right and left arms and the left leg. Beware arm lead reversal as this will cause false P wave abnormalities. The precordial leads are more diffi- cult to place accurately; leads V1 through V6 are positioned as displayed in Figure 1. We describe a simplified method for interpreting a pediatric electrocardiogram (EKG). The method uses 4 steps and requires only a few memorized rules, and it can aid health care providers who do not have immediate access to pediatric cardiology services. Most pediatric EKGs are normal. However, both abnormal and normal EKGs should be sent to a pediatric cardiologist for later, confirmatory interpretation. Keywords: electrocardiogram; children From the Children’s Heart Center–Nevada, Las Vegas, Nevada and the Division of Cardiology, Department of Pediatrics, University of Nevada School of Medicine, Las Vegas, Nevada. Address correspondence to: William N. Evans, MD, FACC, Children’s Heart Center, 3006 S. Maryland Pkwy, Ste 690, Las Vegas, NV 89109; E-mail: [email protected]. Clinical Pediatrics Volume XX Number X Month XXXX xx-xx © 2009 The Author(s) 10.1177/0009922809336206 http://clp.sagepub.com Figure 1. Precordial lead placement. CLIN PEDIATR OnlineFirst, published on January 28, 2010 as doi:10.1177/0009922809336206
Transcript of Clinical Pediatrics Simplified Pediatric Electrocardiogram...

Simplified Pediatric Electrocardiogram Interpretation
William N. Evans, MD, Ruben J. Acherman, MD, Gary A. Mayman, MD, Robert C. Rollins, MD, and Katrinka T. Kip, MD
1
Step 1: Determine the Rate and Rhythm
Rate
Using lead II or the lead with the least artifact, calculate the approximate heart rate by counting the number of large boxes between 2 QRSs: heart rate = 300 ÷ number of large boxes between QRSs (Figure 2).
Rhythm
1. Sinus rhythm is present if the PR interval is consistent throughout the tracing, and the P wave
The abbreviation EKG, for electrocardiogram, is easier to say than ECG, and in the hospi-tal, EKG is less likely to be confused
with EEG, either verbally or in the medical record.1 For this reason, some hospitals (for example, the Cardiology Department, Sunrise Hospital and Medical Center, Las Vegas, NV) require that staff use EKG. Willem Einthoven first used the abbrevia-tion “EKG” in a 1912 report composed in English, not German.2 Thus, for this article, we use EKG rather than ECG.
Our method for simplified EKG interpretation requires 4 short steps and only a few memorized rules. With these 4 steps and condensed rules, any health care provider can provide initial interpretation for most pediatric EKGs. A pediatric cardiologist should eventu-ally review all EKGs performed on children.
The basis for a properly performed EKG is lead placement. The limb leads are simply placed on the right and left arms and the left leg. Beware arm lead reversal as this will cause false P wave abnormalities. The precordial leads are more diffi-cult to place accurately; leads V1 through V6 are positioned as displayed in Figure 1.
We describe a simplified method for interpreting a pediatric electrocardiogram (EKG). The method uses 4 steps and requires only a few memorized rules, and it can aid health care providers who do not have immediate access to pediatric cardiology services. Most pediatric
EKGs are normal. However, both abnormal and normal EKGs should be sent to a pediatric cardiologist for later, confirmatory interpretation.
Keywords: electrocardiogram; children
From the Children’s Heart Center–Nevada, Las Vegas, Nevada and the Division of Cardiology, Department of Pediatrics, University of Nevada School of Medicine, Las Vegas, Nevada.
Address correspondence to: William N. Evans, MD, FACC, Children’s Heart Center, 3006 S. Maryland Pkwy, Ste 690, Las Vegas, NV 89109; E-mail: [email protected].
Clinical PediatricsVolume XX Number X
Month XXXX xx-xx© 2009 The Author(s)
10.1177/0009922809336206http://clp.sagepub.com
Figure 1. Precordial lead placement.
CLIN PEDIATR OnlineFirst, published on January 28, 2010 as doi:10.1177/0009922809336206

2 Clinical Pediatrics / Vol. XX, No. X, Month XXXX
Figure 2. Electrocardiogram, heart rate.
Figure 3. Electrocardiogram, sinus rhythm.
deflection is positive in leads II and aVF but negative in aVR (Figure 3).
2. The most common heart rate variations are not true arrhythmias. The following are sinus rhythms that have normal P wave deflections and consistent PR intervals. a. “Sinus arrhythmia” (Figure 4) is a normal
variation in sinus rhythm that occurs with respiration. The heart rate rises and falls with inspiration and expiration. The variation is more pronounced in young children and less pronounced in infants and adolescents.
b. “Sinus bradycardia” (Figure 5) is a slow sinus rhythm seen normally in aerobically trained individuals, but also occasionally in hypothy-roidism and long QTc.
c. “Sinus tachycardia” (Figure 6) is a fast sinus rhythm that is consistent with anxiety, crying, fever, and occasionally hyperthyroidism.
3. Sinus rhythm is not present if the P wave is negative in lead II and aVF but positive in aVR (Figure 7). This pattern may be consistent with a nonsinoatrial-atrial rhythm, such as when the intrinsic cardiac pacemaker is in the low right atrium or in the left atrium.
4. Occasionally a child may have a pacemaker, and a paced rhythm will then be found (Figure 8).
5. If there are ectopics, describe them: a. Frequent or infrequent narrow QRS ectopics
(Figure 9): usually premature atrial contrac-tions (PACs).
b. Frequent or infrequent wide QRS ectopics (Figure 10): usually premature ventricular contractions (PVCs).
6. If there is a pathologic tachycardia, also describe it: a. Narrow QRS tachycardia with P waves diffi-
cult to see or not seen (Figure 11): likely supraventricular tachycardia (SVT).
b. Wide QRS tachycardia (Figure 12): usually ventricular tachycardia (VT).
7. Each P wave is normally followed by a QRS with a constant PR interval. If some or all P waves are not followed by a QRS or the PR intervals vary, then atrioventricular (AV) block is present (Figure 13). For the simplified method, it is more important to recognize the presence of AV block than to specify the degree of AV block.
8. Detailed arrhythmia analysis always requires pediatric cardiology input.

Simplified Pediatric Electrocardiogram Interpretation / Evans et al 3
Figure 4. Electrocardiogram, sinus arrhythmia.
Step 2: Evaluate the PR, QRS, and QT Intervals
Using lead II or the lead with the least artifact, inspect the PR, QRS, and QT intervals. Measured values can be expressed either as sec or msec. For example, 1 small box is 0.04 sec (40 msec), and 1 big box is 0.2 sec (200 msec) (Figure 14). PR intervals are often expressed in sec and QT intervals as msec. We include both values for mea-sured intervals.
PR
The PR interval can be normal, long, or short:
1. In older children and adolescents, if the PR is < 0.2 sec (< 200 msec or 1 big box) but does not adjoin a wide-based QRS (see 4 below), then the PR interval is likely normal (Figure 15).
2. At any age, a PR interval ≥ 0.2 sec (≥ 200 msec or 1 big box) is long and consistent with first-degree AV block (Figure 16).
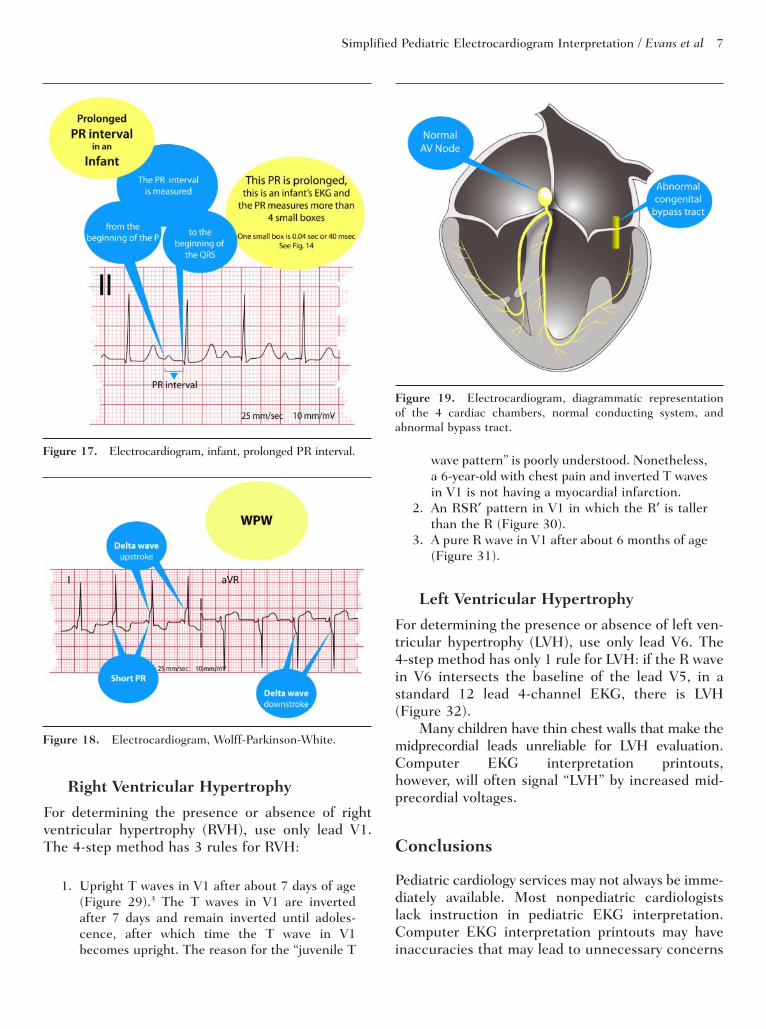
3. In infants and young children, however, a PR interval ≥ 0.16 (≥ 160 msec or 4 small boxes) is long and also consistent with first-degree AV block (Figure 17).3
Figure 5. Electrocardiogram, sinus bradycardia.
Figure 6. Electrocardiogram, sinus tachycardia.
Figure 7. Electrocardiogram, not sinus rhythm.

4 Clinical Pediatrics / Vol. XX, No. X, Month XXXX
4. A short PR interval can adjoin the QRS and may be normal if the QRS is narrow or it may be abnormal and consistent with preexcitation (WPW, named for Drs. Louis Wolff, John Parkinson, and Paul Dudley White4) if the QRS base is wide. In 1930, Wolf, Parkinson, and White described the EKG appearance of a short PR interval associated with a widened QRS. The widened QRS pattern consists of a characteristic upstroke or downstroke (depending on the lead) forming a “delta wave” for the D shape the upstroke or downstroke makes with the vertical part of the QRS (Figure 18 demonstrates both upstroke and downstroke). The EKG appearance of preexcitation is caused by an early excitation of the ventricles via congenital bypass tracts (Figure 19). Preexcitation is associated with SVT and on rare occasions, sudden death. Most patients with preexcitation and SVT should undergo electro-physiology studies with pathway ablation.
QRS
A normal QRS is usually only about 1 small box wide (.04 sec or 40 msec). A wide QRS is usually 2 small boxes or more (≥ .08 sec or ≥ 80 msec). A wide QRS is seen in PVCs, bundle branch blocks, WPW, ventricular rhythm, or with a pacemaker (Figure 20).
QT and T Waves
The most important interval is the QT or the QTc; “c” signifies corrected for heart rate. As with the previous intervals, lead II or the lead with the least artifact should be used. The QTc is calculated using the Bazett formula (Figure 21).5 The Bazett formula requires values in sec rather tha n in msec for calculating the QTc, but the result may be expressed in sec or msec. A long QTc of > 0.45 sec (> 450 msec) is usually abnormal and requires interpreta-tion by a pediatric cardiologist. An abnormal QTc can result in sudden death; therefore, the QTc must be checked closely in every EKG.
It is also important to inspect the morphology of the T waves, including T wave inversions in the left precordium or throughout all leads. Such a finding can be consistent with myocardial dysfunction, either primary or secondary to metabolic abnormali-ties (Figure 22).
Step 3: Evaluate the frontal QRS and frontal P wave axis
Use AVF for this evaluation.
P Axis
1. The P wave is normally positive in AVF (Figure 23).
2. If the P wave is negative in AVF, then the electri-cal conduction direction may be abnormal, such as in a low atrial or a left atrial pacemaker. Even so, some left atrial rhythms have a positive P wave in AVF. The nuances of left atrial or low atrial rhythm can be left to a pediatric cardiolo-gist’s interpretation (Figure 24).
QRS Axis
1. The QRS is normally positive in AVF (Figure 25).
2. A negative QRS in AVF is present in some cardiac malformations, most commonly atrioventricular septal defects or univentricular hearts (Figure 26).
3. A biphasic QRS in AVF may be normal, but the pattern needs review by a pediatric cardiologist (Figure 27).
Summary of Steps 1 Through 3
Steps 1 through 3 are the most important. These steps evaluate the electrical health of the heart, the primary purpose for an EKG. An EKG does not pro-vide a structural diagnosis. Thus, an EKG performed for a heart murmur may be of little benefit, as a normal EKG does not rule in or rule out structural heart disease.
Step 4. Evaluate for Right and Left Ventricular Hypertrophy
StandardizationFirst, always check for the standardization marks on the EKG (Figure 28), they are usually seen in multiple leads and are 2 big boxes tall for normal, full standard. Beware of half-standard EKGs, as they will have standardization marks that are only 1 big box tall. For consistency, EKGs should always be performed using full-standard settings.

Simplified Pediatric Electrocardiogram Interpretation / Evans et al 5
Figure 10. Electrocardiogram, premature ventricular contractions.
Figure 11. Electrocardiogram, supraventricular tachycardia.
Figure 12. Electrocardiogram, ventricular tachycardia.
Figure 8. Electrocardiogram, paced QRS complexes.
Figure 9. Electrocardiogram, premature atrial contractions.

6 Clinical Pediatrics / Vol. XX, No. X, Month XXXX
Figure 15. Electrocardiogram, normal PR interval.
Figure 16. Electrocardiogram, prolonged PR interval.Figure 14. Electrocardiogram, paper time intervals.
Figure 13. Electrocardiogram, second-degree atrioventricular block.
Simplified Pediatric Electrocardiogram Interpretation / Evans et al 7
Figure 17. Electrocardiogram, infant, prolonged PR interval.
Figure 18. Electrocardiogram, Wolff-Parkinson-White.
Figure 19. Electrocardiogram, diagrammatic representation of the 4 cardiac chambers, normal conducting system, and abnormal bypass tract.
Right Ventricular Hypertrophy
For determining the presence or absence of right ventricular hypertrophy (RVH), use only lead V1. The 4-step method has 3 rules for RVH:
1. Upright T waves in V1 after about 7 days of age (Figure 29).3 The T waves in V1 are inverted after 7 days and remain inverted until adoles-cence, after which time the T wave in V1 becomes upright. The reason for the “juvenile T
wave pattern” is poorly understood. Nonetheless, a 6-year-old with chest pain and inverted T waves in V1 is not having a myocardial infarction.
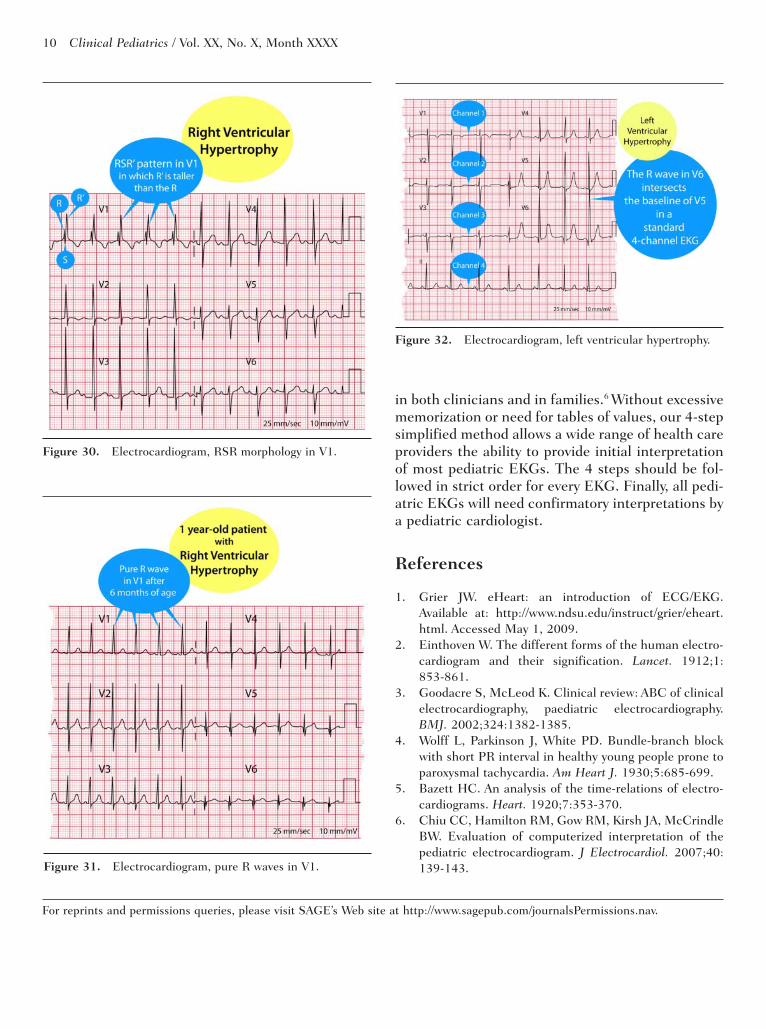
2. An RSR′ pattern in V1 in which the R′ is taller than the R (Figure 30).
3. A pure R wave in V1 after about 6 months of age (Figure 31).
Left Ventricular Hypertrophy
For determining the presence or absence of left ven-tricular hypertrophy (LVH), use only lead V6. The 4-step method has only 1 rule for LVH: if the R wave in V6 intersects the baseline of the lead V5, in a standard 12 lead 4-channel EKG, there is LVH (Figure 32).
Many children have thin chest walls that make the midprecordial leads unreliable for LVH evaluation. Computer EKG interpretation printouts, however, will often signal “LVH” by increased mid-precordial voltages.
Conclusions
Pediatric cardiology services may not always be imme-diately available. Most nonpediatric cardiologists lack instruction in pediatric EKG interpretation. Computer EKG interpretation printouts may have inaccuracies that may lead to unnecessary concerns

8 Clinical Pediatrics / Vol. XX, No. X, Month XXXX
Figure 21. Electrocardiogram, corrected QT interval (QTc).
Figure 22. Electrocardiogram, inverted T waves in V6.
Figure 23. Electrocardiogram, normal upright P waves in aVF.
Figure 20. Electrocardiogram, normal and wide QRS complexes.

Simplified Pediatric Electrocardiogram Interpretation / Evans et al 9
Figure 24. Electrocardiogram, negative P waves in aVF.
Figure 25. Electrocardiogram, normal upright QRS com-plexes in aVF.
Figure 26. Electrocardiogram, negative QRS complexes in aVF.
Figure 27. Electrocardiogram, biphasic QRS complexes in aVF.
Figure 28. Electrocardiogram, full standard calibration.
Figure 29. Electrocardiogram, upright T waves in V1.
10 Clinical Pediatrics / Vol. XX, No. X, Month XXXX
Figure 30. Electrocardiogram, RSR morphology in V1.
Figure 31. Electrocardiogram, pure R waves in V1.
Figure 32. Electrocardiogram, left ventricular hypertrophy.
in both clinicians and in families.6 Without excessive memorization or need for tables of values, our 4-step simplified method allows a wide range of health care providers the ability to provide initial interpretation of most pediatric EKGs. The 4 steps should be fol-lowed in strict order for every EKG. Finally, all pedi-atric EKGs will need confirmatory interpretations by a pediatric cardiologist.
References
1. Grier JW. eHeart: an introduction of ECG/EKG. Available at: http://www.ndsu.edu/instruct/grier/eheart.html. Accessed May 1, 2009.
2. Einthoven W. The different forms of the human electro-cardiogram and their signification. Lancet. 1912;1:853-861.
3. Goodacre S, McLeod K. Clinical review: ABC of clinical electrocardiography, paediatric electrocardiography. BMJ. 2002;324:1382-1385.
4. Wolff L, Parkinson J, White PD. Bundle-branch block with short PR interval in healthy young people prone to paroxysmal tachycardia. Am Heart J. 1930;5:685-699.
5. Bazett HC. An analysis of the time-relations of electro-cardiograms. Heart. 1920;7:353-370.
6. Chiu CC, Hamilton RM, Gow RM, Kirsh JA, McCrindle BW. Evaluation of computerized interpretation of the pediatric electrocardiogram. J Electrocardiol. 2007;40: 139-143.
For reprints and permissions queries, please visit SAGE’s Web site at http://www.sagepub.com/journalsPermissions.nav.