Clinical Impact of New Viral Hepatitis Data From San ...
45
Clinical Impact of New Viral Hepatitis Data From San Francisco 2018 This program is supported by educational grants from AbbVie and Gilead Sciences CCO Independent Conference Coverage* of The Liver Meeting 2018; November 9-13, 2018; San Francisco, California *CCO is an independent medical education company that provides state-of-the-art medical information to healthcare professionals through conference coverage and other educational programs.
Transcript of Clinical Impact of New Viral Hepatitis Data From San ...

Clinical Impact of New Viral Hepatitis Data From San Francisco 2018
This program is supported by educational grants fromAbbVie and Gilead Sciences
CCO Independent Conference Coverage*of The Liver Meeting 2018; November 9-13, 2018; San Francisco, California
*CCO is an independent medical education company that provides state-of-the-art medical information to healthcare professionals through conference coverage and other educational programs.

§ Please feel free to use, update, and share some or all of these slides in your noncommercial presentations to colleagues or patients
§ When using our slides, please retain the source attribution:
§ These slides may not be published, posted online, or used in commercial presentations without permission. Please contact [email protected] for details
About These Slides
Slide credit: clinicaloptions.com

Faculty
Paul Y. Kwo, MDProfessor of MedicineDirector of HepatologyStanford University School of MedicinePalo Alto, California
Nancy Reau, MDProfessor of MedicineChief, Section of HepatologyAssociate Director, Solid Organ TransplantationRichard B. Capps Chair of HepatologyRush University Medical CenterChicago, Illinois

Faculty Disclosures
Paul Y. Kwo, MD, has disclosed that he has received consulting fees from AbbVie, Arrowhead, Bristol-Myers Squibb, Ferring, Gilead Sciences, Johnson & Johnson, Merck, Quest, and Surrozen; has received funds for research support from Assembly, Bristol-Myers Squibb, Gilead Sciences, and La Jolla; has served on data and safety monitoring boards for Durect and Johnson and Johnson; and has ownership interest in Durect.
Nancy Reau, MD, has disclosed that she has received salary from AASLD; consulting fees from Abbott, AbbVie, Gilead Sciences, and Merck; and funds for research support from Genfit, Intercept, and Shire.

Treatment of HCV Infection

EXPEDITION-8: GLE/PIB for 8 Wks in Patients With GT1-6 HCV and Compensated Cirrhosis§ Multicenter, open-label, single-arm phase IIIb study
‒ 83% HCV GT1; 90% CP5, 9% CP6, 1% CP7; 17% with platelet count < 100 x 109
cells/L
‒ Mean FibroScan score at baseline: 23.7 kPa
Brown. AASLD 2018. Abstr LB-7. Slide credit: clinicaloptions.com
Treatment-naive adults with GT1-6* HCV infection, HCV RNA ≥ 1000 IU/mL,
and compensated cirrhosis†; no HCC or HBV/HIV coinfection
(N = 280)
GLE/PIB QD
Wk 8
*GT3 added in protocol amendment with enrollment ongoing; excluded from current analysis.
†FibroTest ≥ 0.75 and APRI > 2, FibroScan ≥ 14.6 kPa, or biopsy at screening.
§ Primary endpoint: SVR12
‒ ITT: includes all patients receiving ≥ 1 study drug dose; PP: excludes ITT patients with
virologic breakthrough or discontinuation before Wk 8, missing data in SVR12 window

EXPEDITION-8: Efficacy and Safety With 8-Wk GLE/PIB
§ In ITT and PP analyses, lower bounds of 95% CIs exceeded predefined efficacy thresholds
‒ No virologic failures
§ No deaths, HCC, d/c for AEs, single AE in ≥ 10% of patients, notable ALT/AST or bilirubin elevations
Brown. AASLD 2018. Abstr LB-7. Slide credit: clinicaloptions.com
*Missing SVR12 data, n = 5 (all undetectable at last visit); premature d/c, n = 1. †Excludes ITT nonresponders, n = 6; patient achieving SVR12 with < 8 wks GLE/PIB, n = 1.
AE GLE/PIB (N = 280)
Any AE, n (%) 134 (48)Serious AEs, n (%) 6 (2)*AEs in 5% to < 10% of patients, %§ Pruritus§ Fatigue§ Headache§ Nausea
9.68.68.26.4
*Atrial fibrillation, bronchitis, duodenal ulcer hemorrhage, peripheral edema, pneumonia, pyelonephritis; none related to treatment.
SVR12, % (n/N) GLE/PIBITT 98 (274/280)*PP 100 (273/273)†
§ No unexpected safety events

GLE/PIB ± RBV for GT1 HCV After Failure of NS5A Inhibitor + SOF ± RBV § Multicenter, randomized, open-label phase IIIb study
‒ Primary endpoint: SVR12
Sulkowski. AASLD 2018. Abstr 226. Slide credit: clinicaloptions.com
Adults with chronic GT1 HCV infection who experienced failure of previous NS5Ai + SOF ± RBV; HIV coinfection on stable ART permitted;
no decompensated cirrhosis or HBV coinfection
(N = 177)
GLE/PIB QD(n = 78)
GLE/PIB QD(n = 49)
Wk 12 Wk 16
Compensated cirrhosis(n = 50)
GLE/PIB QD + weight-based RBV(n = 21)
GLE/PIB QD(n = 29)
No cirrhosis(n = 127)
Stratified by HCV GT (1b vs non-1b)

Efficacy and Safety of GLE/PIB ± RBV for GT1 HCV After Failure of NS5A Inhibitor + SOF ± RBV
§ No VF in GT1b; VF in GT1a associated with treatment-emergent RASs
§ RBV associated with increased toxicity but not increased efficacy
Sulkowski. AASLD 2018. Abstr 226. Slide credit: clinicaloptions.com
Virologic Outcome12-Wk GLE/PIB ± RBV 16-Wk GLE/PIB
All(n = 99)
GT1b(n = 21)
GT1a†
(n = 78)All
(n = 78)GT1b
(n = 13)GT1a
(n = 65)SVR12, % 89 95 87 95 100 94§ Relapse, n 4 0 4 3 0 3§ Breakthrough, n 5 0 5 1 0 1§ Reinfection, n 1 0 1 0 0 0§ Death, n 1 1* 0 0 0 0
*HCC, not drug related. †Includes n = 4 non-GT1 patients.

VA HCV Case Registry: SOF/VEL/VOX in DAA-Experienced Patients With GT1-4 HCV§ Observational ITT cohort analysis of DAA-experienced patients with GT1-4 HCV
initiating SOF/VEL/VOX in any VA center with EOT by March 31, 2018 (N = 573)
‒ Primary endpoint: SVR where HCV RNA < LLOQ at least 12 wks after EOT
Belperio. AASLD 2018. Abstr 227. Slide credit: clinicaloptions.com
SVR,* % (n/N) GT1 GT2 GT3 GT4Overall 90.7 (429/473) 90.0 (18/20) 91.3 (42/46) 100 (12/12)
Cirrhosis § No § Yes
91.5 (289/316)89.2 (140/157)
92.9 (13/14)83.3 (5/6)
91.3 (21/23)91.3 (21/23)
100 (5/5)100 (7/7)
History of decompensation
§ No§ Yes
90.5 (391/432)92.7 (38/41)
88.9 (16/18)100 (2/2)
91.7 (33/36)90.0 (9/10)
100 (11/11)100 (1/1)
Duration of SOF/VEL/VOX
§ < 12 wks§ 12 wks
46.5 (20/43)95.1 (409/430)
100 (1/1)89.5 (17/19)
0 (0/1)93.3 (42/45)
--100 (12/12)
*n = 22 patients excluded from analysis for lack of HCV RNA measurement ≥ 12 wks after EOT.

VA HCV Case Registry: Efficacy in Patients Receiving Full
12-Wk Course of SOF/VEL/VOX by Prior Treatment
§ In analysis restricted to patients receiving full 12 wks of SOF/VEL/VOX, lower SVR rates in GT2 with prior NS5A and/or NS5B experience, in GT1-3 with prior SOF/VEL
Belperio. AASLD 2018. Abstr 227. Slide credit: clinicaloptions.com
SVR With 12-Wk SOF/VEL/VOX, % (n/N) GT1 GT2 GT3
Class of prior treatment
§ NS3/4A§ NS5A§ NS5B§ NS3/4A + NS5A§ NS5A + NS5B§ PegIFN/RBV
94 (148/158)95 (409/430)95 (352/370)95 (134/141)96 (261/272)
95 (37/39)
100 (1/1)89 (16/18)90 (17/19)100 (1/1)
88 (15/17)100 (4/4)
--93 (37/40)93 (42/45)
--93 (37/40)100 (3/3)
Prior regimen
§ GZR/EBR§ LDV/SOF ± RBV§ OBV/PTV/RTV/DSV ± RBV§ SOF/VEL*§ SOF + SMV
96 (68/71)95 (286/300)
96 (67/70)82 (14/17)
83 (5/6)
--67 (2/3)
100 (1/1)86 (12/14)
--
--94 (16/17)
--85 (11/13)
--*P < .05

French Compassionate Use Study: SOF/VEL/VOX in Patients With DAA Failure, Compensated Cirrhosis§ Real-world cohort of adults with GT1-5 HCV, compensated cirrhosis, and prior DAA
failure of an NS5A inhibitor and/or PI receiving 12-wk SOF/VEL/VOX ± RBV (N = 44)
‒ SVR12: 95% (38/40)
‒ Serious AEs: n = 2 (liver decompensation, HCC in 1 patient with baseline Child B8 score)
‒ Relapse: n = 2, both in patients with prior SOF + DCV
Hezode. AASLD 2018. Abstr 629. Slide credit: clinicaloptions.com
Pt With Relapse*
Age, Yrs
FibroScan, kPa
HCV GT Baseline RASs SOF/VEL/VOX HCV RNA at
EOT, IU/mLRelapse
RASsMale 59 13 1a NS3, NS5A 12 wks < 15 PendingMale 53 16 3a Y93H 12 wks + RBV < 12 Pending*Among n = 40 with ≥ 12 wks of follow-up after d/c of treatment.

Additional Data on Real-World Efficacy of SOF/VEL/VOX
§ Trio Health: examination of SOF/VEL/VOX initiation (± RBV) from July 2017 to April 2018 in US patients with chronic HCV infection (N = 196)[1]
‒ 88% treatment experienced
‒ 73% male, 60% GT1a HCV, 42% cirrhotic
§ DHC-R: examination of SOF/VEL/VOX retreatment (± RBV) as of February 2018 in German patients with chronic HCV infection and prior DAA failure (N = 86)[2]
‒ Prior treatment experience
‒ OBV/PTV/RTV/DSV ± RBV, 31%
‒ LDV/SOF ± RBV, 30%
‒ SOF/VEL ± RBV, 14%
‒ 86% male, 64% GT1 HCV, 24% cirrhotic
§ SVR12: 100% in 52 evaluable patients
1. Bacon. AASLD 2018. Abstr 706. 2. Vermehren. AASLD 2018. Abstr 676. Slide credit: clinicaloptions.com
SVR12 by Prior Regimen, % (n/N) PP ITT
LDV/SOF ± RBV 99 (88/89) 96 (88/92)
SOF/VEL ± RBV 95 (19/20) 95 (19/20)
GZR/EBR ± RBV 100 (17/17) 89 (17/19)
OBV/PTV/RTV/DSV 100 (10/10) 91 (10/11)
Other (SOF-based) 100 (16/16) 94 (16/17)

SHARED 2: LDV/SOF Without On-Treatment Laboratory Monitoring in Rwandan Patients With GT4 HCV§ Prospective, open-label, single-arm, single-site study in Rwanda
‒ Primary endpoints: SVR12, grade 3/4 AEs, early d/c for AEs
Grant. AASLD 2018. Abstr 54. Slide credit: clinicaloptions.com
X = study physician blinded to results; labs reviewed in real time by independent monitor to ensure trial safety.
DAA-naive adults with GT4 HCV infection, HCV RNA > 1000 IU/mL; no decompensated cirrhosis, HCC, active HBV/uncontrolled HIV
(N = 60)LDV/SOF QD
Wk 12
Laboratory Assessment Screen Entry Wk 4 Wk 8 Wk 12 Wk 24HCV GT, HCV/HIV Ab, HBsAg X HCV RNA X X X XCBC, CMP X X X X XPT/INR/albumin X

SHARED 2: Efficacy and Safety
§ SVR12: 88% (53/60)
‒ Failures: n = 7 (all relapse)
‒ Lower SVR12 rate (56%) in subtype GT4r due to more frequent RASs
§ Adherence ≥ 90% by pill count at Wks 4, 8 in 58 evaluable patients
§ In 3 cases, independent monitor released labs to study physician
‒ Labs normalized without intervention
§ No d/c for AEs or lab abnormalities, grade 4 AEs, or deaths
Slide credit: clinicaloptions.com
Grade 3 AE, n LDV/SOFAny 11*§ Hypertension 6§ Insomnia 2§ Hyperglycemia 1§ Knee pain 1§ Weakness 1
*Occurring in 7 patients; none drug related.
Grant. AASLD 2018. Abstr 54.

ANCHOR: SOF/VEL in PWID With Chronic HCV and Ongoing Injection Drug Use§ Single-center study at harm reduction organization in Washington, DC
‒ 76% men, 93% black, 33% cirrhotic, 58% injected drugs at least daily
§ Primary endpoint: SVR12
§ Adherence assessments: Wk 4 HCV RNA, treatment interruptions, completion of study drugs, EOT timing vs Wk 12
Slide credit: clinicaloptions.comKattakuzhy. AASLD 2018. Abstr 18.
Patients with chronic HCV infection, opioid use disorder, and opioid injection in last 3 mos; no
decompensated cirrhosis or contraindicated DDIs(N = 100)
SOF/VEL* QD
Wk 12
*Dispensed in 28-day increments at Day 1, Wk 4, Wk 8 (ie, 3 bottles).

ANCHOR: Efficacy and Adherence
§ SVR12 in ITT population:
78% (73/93)
‒ Virologic success
unaffected by BL
demographics such as
frequency of drug use,
housing stability, MAT
§ Through Wk 12 in full
study population (N = 100)
Slide credit: clinicaloptions.comKattakuzhy. AASLD 2018. Abstr 18.
Adherence Measure in ITT Population SVR12, % PValue
Wk 4 HCV RNA
< 200 IU/mL
§ Yes (n = 80)
§ No (n = 8)
86
25.0005
No treatment
interruptions
§ Yes (n = 76)
§ No (n = 12)
86
67.22
Completed 2 or 3 of
3 SOF/VEL bottles
§ Yes (n = 87)
§ No (n = 6)
84
0.0001
Finished SOF/VEL on
time (vs late)
§ Yes (n = 20)
§ No (n = 43)
95
88.65
‒ SOF/VEL prescriptions dispensed: 92% to 97%
‒ Visit attendance: 70% to 88%

HCV Continuum of Care

HCV Linkage to Care in the United States: 2013 vs 2016
§ Analysis of real-world demographic data, clinical test results from 2 large commercial labs in the United States
‒ Limited to patients who underwent HCV antibody screening
§ From 2013-2016, proportion with follow-up HCV RNA test increased
Reau. AASLD 2018. Abstr 1567. Slide credit: clinicaloptions.com
Care Step in HCV Ab+ Patients 2013(N = 179,144)
2016(N = 287,130)
HCV RNA test performed, % 45.0 76.5§ Positive result, % 63.8 63.9
•Saw a specialist,* % (n) 21.2 (10,903) 17.4 (24,358)*Gastroenterology, hepatology, infectious disease.

HCV Linkage to Care in the United States: Baby Boomers vs Young Adults
§ From 2013-2016, treatment rates rose in both groups, with highest increases in baby boomers across provider types
§ In 2016, specialist vs PCP visit associated with greater likelihood of treatment
Slide credit: clinicaloptions.comReau. AASLD 2018. Abstr 1567.
HCV RNA Positive, %
Baby Boomers*
Young Adults†
2013 66.1 58.92016 63.5 65.5
Patients Engaging in Care Step by Yr, %
Linked to Specialist Linked to PCPBaby
Boomers*Young
Adults†Baby
Boomers*Young
Adults†
Saw provider § 2013§ 2016
25.423.4
17.19.2
37.740.9
32.640.3
Received treatment after provider visit
§ 2013§ 2016
10.632.0
15.422.6
2.98.1
4.24.5
*48-71 yrs of age. †18-39 yrs of age.

Age-Stratified Examination of HCV Continuum of Care for PWID in Philadelphia§ From 2013-2017, N = 29,820
HCV Ab+ labs reported to the Philadelphia Dept of Public Health
‒ Subset interviewed as part of routine surveillance: n = 5184, 46% of whom self-identified as PWID
‒ 76% white in younger cohort; 41% black, 40% white in older cohort
§ Linkage to HCV care, treatment rates significantly lower in younger vs older cohort
Addish. AASLD 2018. Abstr 1632. Slide credit: clinicaloptions.com
Care Step in HCV Ab+ PWID, %
≤ 35 Yrs(n = 1239)
> 35 Yrs(n = 1151)
HCV RNA test performed
81 90
HCV RNA positive 75 85
Initiated HCV care*† 41 66
HCV tx initiated or infection resolved† 8 25
*Saw a specialist or had a subsequent HCV RNA measurement > 180 days after initial result. †P < .0001 for difference between groups.

Posttreatment HCV Outcomes

C-EDGE CO-STAR: Assessment of HCV Reinfection Risk in Patients on OAT Who Received GZR/EBR § Part A: GZR/EBR for 12 wks in patients with HCV GT1, 4, or 6 on OAT (N = 296)
‒ SVR12: 91% in full analysis set; 97% of patients had > 95% adherence
§ Part B: observational follow-up study in patients who received ≥ 1 dose of GZR/EBR; HCV reinfection, drug use assessed (n = 199)
§ 10 reinfections during 36 mos following end of HCV treatment
‒ Occurred in first 6 mos post-treatment, n = 6
‒ Spontaneous clearance, n = 2; persistent viremia, n = 8 (4/8 cleared with retreatment)
Grebely. AASLD 2018. Abstr 52. NCT02105688.
Parameter at Posttreatment Mo 36
All Patients(n = 296)
Part B*IDU (n = 80) No IDU (n = 119)
Reinfection rate/100 PY (95% CI) 1.8 (0.8-3.3) 2.8 (1.0-6.2) 0.3 (0-1.8)
Slide credit: clinicaloptions.com*IDU self-reported after completion of HCV treatment.

C-EDGE CO-STAR: Assessment of Drug Use Behavior in Patients on OAT Who Received GZR/EBR
§ Stable drug use patterns through Mo 30 with 15% to 26% reporting IDU
Grebely. AASLD 2018. Abstr 52. Slide credit: clinicaloptions.com
*Excludes buprenorphine, methadone.
Urine Drug Screen, %
Part A Part B
Day 1(n = 199)
Day 1 (n = 199)
Mo 6(n = 190)
Mo 12(n = 177)
Mo 18(n = 172)
Mo 24(n = 152)
Mo 30(n = 142)
Any positive* 59 60 59 62 59 59 53
Reported Drug Use in Part B, %Mo 6
(n = 191)Mo 12
(n = 178)Mo 18
(n = 173)Mo 24
(n = 155)Mo 30
(n = 148)
Injection § Previous mo§ Previous 6 mos
2125
1926
1721
1520
1622
Non-injection
§ Previous mo§ Previous 6 mos
3945
3840
4242
3938
3639

HCC Recurrence Rate After HCV DAA Therapy Among Patients With HCC Complete Response § Retrospective multicenter cohort study in North American patients
achieving CR after ablation, radiation therapy, resection, or TACE/TARE for HCV-related HCC between January 2013 and December 2016 (N = 795)
‒ Exclusion criteria: extrahepatic HCC, HCV DAAs before initial HCC, recurrent HCC within 30 days of CR, unknown HCC response
§ Primary analysis: association between HCV DAA therapy and time to HCC recurrence by Cox regression
§ Significant BL differences between HCV DAA-treated vs DAA-untreated cohorts in type (P < .001) and number (P = .04) of HCC treatments leading to CR, Child-Pugh at CR (P < .001)
Slide credit: clinicaloptions.comSingal. AASLD 2018. Abstr 92.

HCC Recurrence After DAA Therapy: Outcomes
§ HCC recurrence with median follow-up of 10.4 mos[1]
‒ DAA treated: all, n = 128; early, n = 52
‒ DAA untreated: all, n = 289; early, n = 228
§ No increased risk of HCC recurrence (early or overall) in patients receiving DAA therapy after CR for HCV-related HCC[1]
‒ Finding consistent across predefined subgroups
§ In a separate, prospective evaluation of 163 Sicilians with HCV cirrhosis and CR by resection or ablation after early HCC[2]
‒ No difference in HCC recurrence, improved OS (P = .03) and rate of hepatic decompensation (P = .02), with DAA initiation vs matched, DAA-untreated controls
Slide credit: clinicaloptions.com
HCC Recurrence[1]aHR (95% CI)
Overall Early
Time-dependent exposure* 0.90 (0.70-1.16) 0.96 (0.96-1.33)
DAA start time after HCC CR§ ≤ 6 mos§ > 6 mos
0.90 (0.67-1.21)0.90 (0.64-1.27)
1.04 (0.74-1.47)0.55 (0.22-1.38)
Adjusted for age, sex, site, CP, AFP, tumor burden, HCC therapy. *Stratified by receipt of DAA therapy.
1. Singal. AASLD 2018. Abstr 92. 2. Cabibbo. AASLD 2018. Abstr 95.

HCV D+R- Transplantation

HCV D+R- Liver Transplantation
§ Retrospective analysis of liver transplantation from April 2014 to
January 2018 in the Scientific Registry of Transplant Recipients; HCV
treatment status unknown (N = 16,858)
§ Increasing use of HCV NAT+ donors
‒ 2014: 8 D+R+, 0 D+R- vs 2017: 269 D+R+, 46 D+R-
§ Similar graft survival rates in HCV-negative pts receiving D+ vs D- livers
Slide credit: clinicaloptions.comPaul. AASLD 2018. Abstr 249.
Graft Survival, % D+R+(n = 753)
D+R-(n = 87)
D-R+(n = 4748)
D-R-(n = 11,270)
Yr 1 94.3 92.8 92.9 92.6
Yr 2 89.7 85.7 88.0 88.3

Preemptive DAAs in HCV D+R- Cardiac Transplantation
§ Open-label, single-center, proof-of-concept trial in HCV-negative patients awaiting cardiac transplantation and willing to receive an HCV-positive donor heart (N = 25)
‒ NAT+ donor heart, n = 20
‒ VAD as bridge, n = 16; long-term inpatients, n = 13
§ Pan-genotypic DAA therapy initiated preemptively immediately prior to transplantation if BL NAT+ or with return of HCV RNA if BL NAT-
‒ GLE/PIB for 8 wks
‒ All patients monitored to Wk 52 for HCV Abs, HCV RNA, and LFTs
Slide credit: clinicaloptions.comBethea. AASLD 2018. Abstr 7.

Efficacy of Preemptive DAAs in HCV D+R- Cardiac Transplantation§ Viral suppression achieved by
posttransplant Day 9 in all NAT+ recipients
§ As of November 10, 2018, 12/25 patients have reached the SVR12 time point
‒ HCV RNA undetectable in all
§ No HCV/DAA-related AEs or serious AEs
§ No lapse in or d/c of DAAs for drug reactions or interactions
§ Reduced time to transplantation resulted in an estimated $3.4 million in cost savings
Slide credit: clinicaloptions.comBethea. AASLD 2018. Abstr 7.
OutcomeHCV
ProtocolStandard Protocol
Median pretransplant wait time,* days (IQR)
11.5 (5-35)
113.0 (40-366)
*P = .0001
Median HCV RNA, IU/mL
NAT+ Heart Recipients (n = 20)
Donor 3,000,000Peak recipient 500

HCV D+R- Lung Transplantation
§ Prospective study of single or bilateral lung transplantation from HCV NAT+ donors to HCV- recipients (N = 20)
‒ Ex vivo lung perfusion for 6 hrs to reduce HCV RNA; postoperative HCV RNA monitoring; SOF/VEL for 12 wks if HCV RNA > 1000 IU/mL
§ 90-day survival: 100%
§ 19/20 recipients infected with HCV within 1 wk after transplantation
‒ Median time to DAAs: 21 days
‒ Viral relapse after SVR12: 25% (2/8)
Slide credit: clinicaloptions.comFeld. AASLD 2018. Abstr 223.

Managing HBV Infection

HBsAg Seroclearance in Untreated Patients With CHB
§ Retrospective cohort study of untreated patients with CHB in North America (n = 1635) and Asia (n = 8979)
§ Male sex, higher age or ALT level, HBeAg negativity predicted spontaneous HBsAg seroclearance in multivariable analysis
§ Annual HBsAg seroclearance rate:1.33% (95% CI: 1.26% to 1.40%)
‒ CIR: 4.92% at 5 yrs, 11.27% at 10 yrs, 19.36% at 15 yrs, 25.42% at 20 yrs
Slide credit: clinicaloptions.comYeo. AASLD 2018. Abstr 212.
BL Characteristic aHR* (95% CI) P Value
Sex§ Female§ Male
11.17 (1.04-1.33) .012
Age, yrs
§ < 35§ 35-44§ 45-54§ > 55
11.25 (1.06-1.48)1.52 (1.28-1.80)1.79 (1.49-2.15)
.009< .001< .001
HBeAg status
§ Negative§ Positive
10.25 (0.19-0.32) < .001
ALT§ Every 10 U/L
increase1.01 (1.00-1.01) < .001
*Adjusted for age, sex, race, study setting, BL cirrhosis, ALT level, and HBeAg status.

Baseline Characteristic
TDF (n = 65)
Placebo(n = 67)
Fibrosis stage, %§ 0§ 1§ 2§ 3§ 4
9.243.135.49.23.1
10.534.328.413.413.4
HBeAg positive, % 20.0 26.9Median HBsAg, log IU/mL (IQR)
3.03 (2.39-3.61)
3.15 (2.61-3.84)
TDF vs Placebo for Patients With HBsAg-Positive CHB and Mild ALT Elevation§ Multicenter, randomized, triple-blind
phase IV trial
§ Primary endpoint: histological progression of liver fibrosis, resolution of necroinflammation
Hsu. AASLD 2018. Abstr 264. NCT01522625.
Patients with HBeAg+ or HBeAg- CHB, ALT 1-2 x ULN, HBV DNA > 2000
IU/mL, no cirrhosis (N = 160*)
TDF QD(n = 79)
Placebo QD(n = 81)
*Results for 132 patients completing treatment with paired biopsy; last patient to finish in December 2018.
Yr 3
Slide credit: clinicaloptions.com

TDF vs Placebo for Patients With HBsAg-Positive CHB and Mild ALT Elevation: Key Findings
Hsu. AASLD 2018. Abstr 264. Slide credit: clinicaloptions.com
Outcome at Yr 3 TDF (n = 65) Placebo (n = 67) P Value
Progression, n (%)§ In fibrosis stage*§ To cirrhosis†
15 (23.1)2 (3.1)
30 (44.8)9 (13.4)
.01
.05Inflammation score, n (%)§ Median (IQR)§ Decrease
2 (1-2)34 (52.3)
3 (2-4)29 (43.3)
.0004.38
Undetectable HBV DNA,‡ % 81.5 13.4 < .0001ALT normalization, % 75.4 52.2 .007Entecavir given for clinical flare, n 2 10 NRHCC, n 2 1 1.0HBsAg loss, n 0 1 1.0HBeAg loss in HBeAg-positive patients, n/N (%) 2/13 (15.4) 5/18 (27.8) .67
*RR: 0.52 (95% CI: 0.31-0.85). †RR: 0.23 (95% CI: 0.06-0.88). ‡< 6 IU/mL.

STOP: Nucleos(t)ide Analogue Cessation in HBeAg-Negative Patients With CHB§ Prospective, randomized, controlled, open-label phase IV trial
‒ 97% Asian
Slide credit: clinicaloptions.com
HBeAg-negative patients with CHB and virologic suppression,* ETV or TDF ≥ 12 mos, HBsAg+ ≥ 6 mos; no HCV or HIV coinfection, decompensated cirrhosis
(N = 67)
Discontinue NA Therapy (n = 45)
Continue NA Therapy (n = 22)
Liem. AASLD 2018. Abstr 268.
Wk 72
*If HBeAg+ at NA start, HBeAg seroconversion + undetectable HBV DNA ≥ 12 mos; if HBeAg-, undetectable HBV DNA ≥ 36 mos.
§ Primary endpoint: HBV DNA < 2000 IU/mL at Wk 48Patients retreated for HBeAg seroreversion, HBV DNA > 2000 IU/mL + (ALT > 5 x ULN at 2 consecutive visits or > 15 x ULN at any visit), or HBV DNA > 20,000 IU/mL at 2 consecutive visits; ALT ULN: 40 IU/mL.

STOP: Virologic and Safety Outcomes
§ Limited HBsAg decline across arms
Slide credit: clinicaloptions.com
Outcome, %Stop (n = 45)
Wk 0
Wk 24
Wk 48
Wk 72
Retreatment 0 27 29 38Clinical relapse† 0 7 4 13Virologic relapse‡ 0 33 40 20Sustained response§ 100 31 24 27HBsAg loss 0 2 2 2
Liem. AASLD 2018. Abstr 268.
†HBV DNA > 2000 IU/mL + ALT > 1.5 x ULN. ‡Lone HBV DNA > 2000 IU/mL. §HBeAg negative + HBV DNA < 2000 IU/mL + ALT < 1.5 x ULN.
Outcome, n (%) Stop (n = 45)
Continue (n = 22)
HBV DNA < 2000 IU/mL§ Wk 48*§ Wk 72
11 (24)12 (27)
21 (95)NR
ALT§ Grade 3 (> 5 x ULN)§ Grade 4 (> 20 x ULN)
22 (49)7 (16)
00
*Primary endpoint.

Predictors of Relapse After NA Cessation in CHB
§ Unmet need for biomarkers to assess risk of treatment withdrawal
‒ Data from multiple small prospective studies support use of HBcrAg and/or HBsAg to predict risk of relapse
1. Hsu. AASLD 2018. Abstr 397. 2. Papatheodoridi. AASLD 2018. Abstr 408. 3. Seto. AASLD 2018. Abstr 417. 4. Carey. AASLD 2018. Abstr 530. Slide credit: clinicaloptions.com
Prospective Study Findings
(N = 135)[1] § HBcrAg, HBsAg independently predict off-treatment clinical relapse, can be combined with age, ALT, and TDF use in novel risk score
DARING-B (N = 60)[2] § HBsAg loss associated with lower levels of HBsAg at ETV/TDF d/c § HBcrAg levels at d/c, 1 mo before retreatment predict probability of retreatment
(N = 103)[3]
§ Significantly lower HBV reactivation rate in patients with BL HBsAg ≤ vs > 10 IU/mL§ Lower BL HBcrAg level associated with reduced HBV reactivation rate in patients
with BL HBsAg > 20 IU/mL
(N = 15)[4] § HBcrAg or pregenomic HBV RNA at TDF d/c may predict significant ALT flares necessitating retreatment

MYR203: Bulevirtide ± PegIFN in Patients With Chronic HBV/HDV Coinfection§ Interim analysis of randomized,
multicenter, open-label phase II study
‒ Bulevirtide: first-in-class, investigational HBV/HDV entry inhibitor
‒ Synthetic peptide that blocks bile salt transporter NTCP
‒ Self-administered SC QD
§ Primary endpoint: undetectable HDV RNA at Wk 72
Slide credit: clinicaloptions.com
Patients with chronic HBV/HDV
coinfection, HBsAg+, anti-HDAg+ for ≥ 6
mos, HDV RNA+ in serum, ALT ≥ 1 to
< 10 x ULN(N = 60)
PegIFN(n = 15)
Bulevirtide 5 mg+ PegIFN(n = 15)
Bulevirtide 2 mg+ PegIFN(n = 15)
Bulevirtide 2 mg(n = 15)
Wk 48
Wedemeyer. AASLD 2018. Abstr 16.

MYR203: Efficacy and Safety
§ 95% (57/60) completed 48 wks of treatment; 13.6% (6/44) missed bulevirtide doses
§ Most bulevirtide-related AEs were mild to moderate (none serious, none causing d/c), not
dose dependent, resolved without intervention or sequelae
Slide credit: clinicaloptions.com
*Undetectable or ≥ 2 log10 IU/mL decline in HDV RNA + normal ALT. †Undetectable or ≥ 1 log10 decline.
Wedemeyer. AASLD 2018. Abstr 16.
Wk 48 OutcomePegIFN(n = 15)
Bulevirtide 2 mg + PegIFN(n = 15)
Bulevirtide 5 mg + PegIFN(n = 15)
Bulevirtide 2 mg(n = 15)
Median Δ from BL in HDV RNA, log10 -1.14 -3.62 -4.48 -2.84
Undetectable HDV RNA, n 2 9 6 2
ALT normalization, n 4 4 7 10
Combined treatment response,* n 2 4 6 8
HBsAg response,† n 0 7 2 0
Asymptomatic rise in bile salts, % 67 60 87 53

JNJ-6379 in Treatment-Naive Patients With CHB
§ Phase I dose-escalating study in the European Union and Asia/Pacific ‒ JNJ-6379: investigational capsid assembly modulator
§ Main endpoints including: safety, PK, antiviral activity
Slide credit: clinicaloptions.com
Treatment-naive adults with CHB, HBeAg positive or negative,
HBV DNA > 2000 IU/mL, no cirrhosis (F0-F2), ALT < 2.5 x ULN
(N = 48)
Zoulim. AASLD 2018. Abstr 74. NCT02662712.
JNJ-6379 25,* 75, 150, or 250 mg PO QD(n = 34)
Placebo(n = 14)
*100 mg loading dose at baseline in this subset.
Day 28

JNJ-6379 in CHB: Safety and Efficacy
§ No drug-related serious AEs; 1 d/c for AEs (grade 4 ALT, grade 3 AST elevation at Day 8 in 150-mg group)
§ Mean HBV DNA and RNA levels declined with JNJ-6379, regardless of dose
‒ No relevant changes observed in HBsAg or HBeAg
§ Dose-proportional pharmacokinetics, with similar clearance between doses
Slide credit: clinicaloptions.com
OutcomeJNJ-6379 Placebo
(n = 14)25 mg (n = 8) 75 mg (n = 8) 150 mg (n = 9) 250 mg (n = 9)
≥ 1 AE, n (%) 5 (63) 4 (50) 6 (67) 4 (44) 9 (64)
Mean Δ from BL at Day 28§ HBV DNA, log10 IU/mL (SD)§ HBV RNA, log10 c/mL (SD)
-2.16 (0.49)-2.30 (0.59)
-2.89 (0.48)-1.85 (1.42)
-2.70 (0.53)-1.83 (0.93)*
-2.70 (0.33)-1.43 (1.13)
-0.11 (0.36)0.02 (1.10)
Zoulim. AASLD 2018. Abstr 74.
*n = 8 evaluable.
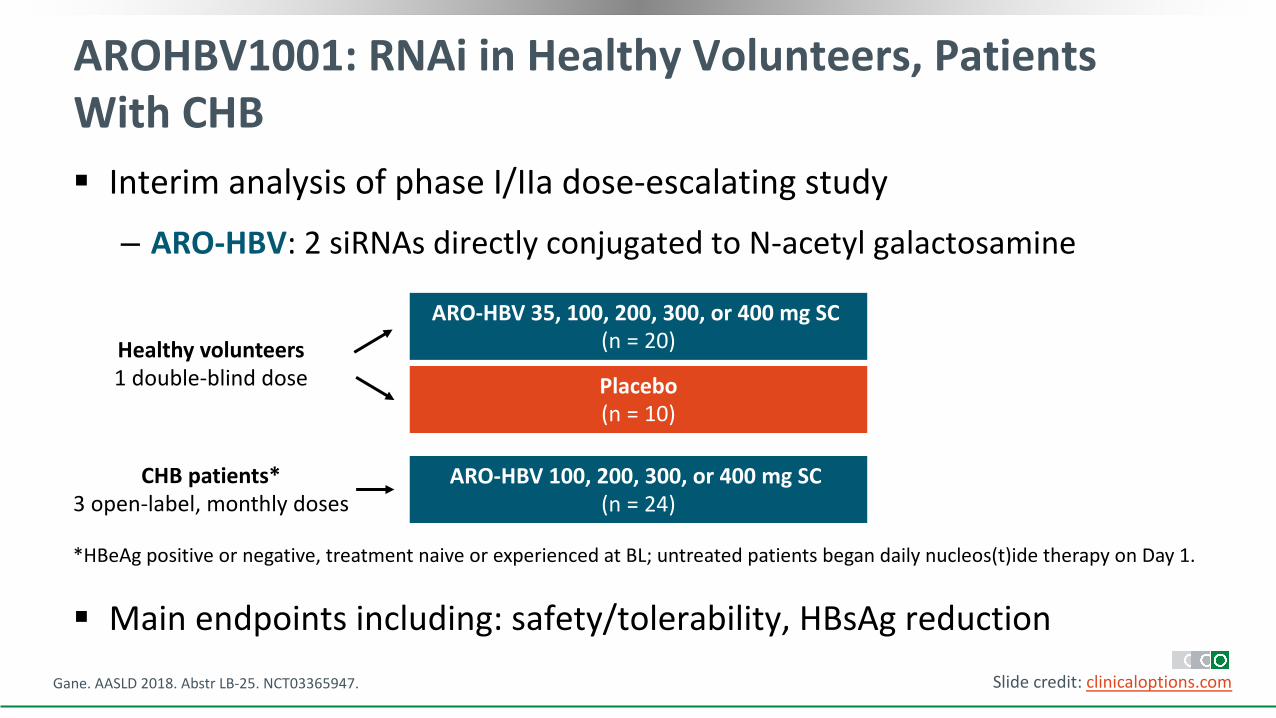
AROHBV1001: RNAi in Healthy Volunteers, Patients With CHB§ Interim analysis of phase I/IIa dose-escalating study
‒ ARO-HBV: 2 siRNAs directly conjugated to N-acetyl galactosamine
§ Main endpoints including: safety/tolerability, HBsAg reductionGane. AASLD 2018. Abstr LB-25. NCT03365947. Slide credit: clinicaloptions.com
ARO-HBV 35, 100, 200, 300, or 400 mg SC (n = 20)Healthy volunteers
1 double-blind dose
ARO-HBV 100, 200, 300, or 400 mg SC (n = 24)
CHB patients*3 open-label, monthly doses
Placebo(n = 10)
*HBeAg positive or negative, treatment naive or experienced at BL; untreated patients began daily nucleos(t)ide therapy on Day 1.

AROHBV1001: Safety and Efficacy
§ No serious AEs
§ 12% of subcutaneous injections in CHB patients accompanied by an AE
‒ All were mild in severity
§ Mean nadir HBsAg reduction:-1.9 log10 (range: -1.3 to -3.8)
‒ Similar responses across CHB dose cohorts, regardless of previous treatment experience or HBeAg status
Gane. AASLD 2018. Abstr LB-25. Slide credit: clinicaloptions.com
Safety Outcome, nHealthy Volunteers CHB Patients
ARO-HBV (n = 20) Placebo (n = 10) ARO-HBV (n = 24)Any AE in > 1 individual 39 17 22Injection-site reactions 2* 0 7†
*Bruising, tenderness. †Erythema, bruising/hematoma, rash, tenderness.

clinicaloptions.com/SanFrancisco2018
Go Online for More CCO Coverage of San Francisco 2018!
Capsule Summaries and downloadable slidesets on key viral hepatitis and NAFLD/NASH data
On-demand audio and ClinicalThought commentaries with expert perspectives on how conference data will change practice