Climate Variability, SCF, and Corn Farming in Isabela ... · PDF fileClimate Variability, SCF,...
66
For comments, suggestions or further inquiries please contact: Philippine Institute for Development Studies Surian sa mga Pag-aaral Pangkaunlaran ng Pilipinas The PIDS Discussion Paper Series constitutes studies that are preliminary and subject to further revisions. They are be- ing circulated in a limited number of cop- ies only for purposes of soliciting com- ments and suggestions for further refine- ments. The studies under the Series are unedited and unreviewed. The views and opinions expressed are those of the author(s) and do not neces- sarily reflect those of the Institute. Not for quotation without permission from the author(s) and the Institute. The Research Information Staff, Philippine Institute for Development Studies 5th Floor, NEDA sa Makati Building, 106 Amorsolo Street, Legaspi Village, Makati City, Philippines Tel Nos: (63-2) 8942584 and 8935705; Fax No: (63-2) 8939589; E-mail: [email protected] Or visit our website at http://www.pids.gov.ph March 2009 DISCUSSION PAPER SERIES NO. 2009-06 Celia M. Reyes, Sonny N. Domingo Christian D. Mina, and Kathrina G. Gonzales Climate Variability, SCF, and Corn Farming in Isabela, Philippines: a Farm and Household Level Analysis
Transcript of Climate Variability, SCF, and Corn Farming in Isabela ... · PDF fileClimate Variability, SCF,...

For comments, suggestions or further inquiries please contact:
Philippine Institute for Development StudiesSurian sa mga Pag-aaral Pangkaunlaran ng Pilipinas
The PIDS Discussion Paper Seriesconstitutes studies that are preliminary andsubject to further revisions. They are be-ing circulated in a limited number of cop-ies only for purposes of soliciting com-ments and suggestions for further refine-ments. The studies under the Series areunedited and unreviewed.
The views and opinions expressedare those of the author(s) and do not neces-sarily reflect those of the Institute.
Not for quotation without permissionfrom the author(s) and the Institute.
The Research Information Staff, Philippine Institute for Development Studies5th Floor, NEDA sa Makati Building, 106 Amorsolo Street, Legaspi Village, Makati City, PhilippinesTel Nos: (63-2) 8942584 and 8935705; Fax No: (63-2) 8939589; E-mail: [email protected]
Or visit our website at http://www.pids.gov.ph
March 2009
DISCUSSION PAPER SERIES NO. 2009-06
Celia M. Reyes, Sonny N. DomingoChristian D. Mina, and Kathrina G. Gonzales
Climate Variability, SCF, and CornFarming in Isabela, Philippines:
a Farm and Household Level Analysis

CLIMATE VARIABILITY, SEASONAL CLIMATE FORECAST AND CORN FARMING IN ISABELA, PHILIPPINES: A FARM AND HOUSEHOLD LEVEL ANALYSIS*
Celia M. Reyes, Sonny N. Domingo, Christian D. Mina, and Kathrina G. Gonzales†
ABSTRACT
Seasonal Climate Forecast (SCF) is one of the tools, which could help farmers and decision makers better prepare for seasonal variability. Using probabilistic principles in projecting climatic deviations, SCF allows farmers to make informed decisions on the proper choice of crop, cropping schedule, levels of input and use of mitigating measures. However, a cloud of uncertainty looms over the true value of SCF to its target users. To shed light on the true value of SCF in local agricultural decision making and operations, farm and household level survey was conducted. A total of 85 corn farmers from the plains and highlands of Echague and Angadanan, Isabela were interviewed.
Results showed that climate and climate-related information were undoubtedly among the major factors being considered by farmers in their crop production activities. All aspects explored on the psychology of corn growers pointed to the high level of importance given to climatic conditions and SCF use. This was evident on the farmers’ perceptions, attitudes, and decision-making processes. Though the high regard of farmers on climate forecast and information cannot be questioned, actual application of such information seemed still wanting. Most corn farmers still started the season by “feel”—relying on the coming of rains and usual seasonal cropping schedules when commencing key farm operations. Reliable indigenous knowledge on climate forecasting was scarce. With corn farmers in Isabela still thirsting for climate-related information, the delivery of appropriate information and accurate forecasts should be addressed through proper extension and provision of support.
Overall, SCF still has to solidify its role in the decision making process. Reliable SCFs remain the key to answer the riddle of seasonal variability and allow farmers to securely harness the goodness of the changing seasons. Ultimately, a holistic approach is necessary to truly elevate the productivity in Isabela’s corn lands.
Keywords: Seasonal climate forecast, corn productivity, Isabela corn industry, climate variability, climate information and corn farming
* This paper is part of the outputs of the ACIAR-sponsored project on “Bridging the gap between seasonal climate forecasts (SCFs) and decisionmakers in agriculture.” † Senior Research Fellow, Supervising Research Specialist, Research Specialist and Research Analyst, respectively, Philippine Institute for Development Studies (PIDS), NEDA Bldg., Makati City

2
Climate Variability, Seasonal Climate Forecasts and Corn Farming in Isabela Philippines: A Farm and Household Level Analysis
1.0 Introduction 1.1 The Corn Crop. A typical cropping cycle for corn requires only 90-120 days after planting (DAP) to complete. Boiler type (food) corn could be harvested in 65 to75 DAP, and baby corn (vegetable) could already be marketed after only 50DAP.
Climatic variability and pests and diseases are the main challenges confronting local farmers. Since most corn producing areas are rainfed, they depend greatly on rains to have a good cropping season. Those without supplemental irrigation risk getting their standing crop wiped out during prolonged dry spells or drought. But excessive rains and flooding could also as easily destroy the season’s crop. Add the two most economically significant pests of the corn crop-- the Asiatic Corn Borer and weeds—and you have a complex mix of concerns.
Varietal choice is said to spell a lot of difference when projecting yield. But looking at established figures, all commercial corn varieties have potential yields of more than 6Mt per hectare. With the average national corn yield only reaching about 2MT, a lot could be said about the management practices among local growers. Either the seed companies have been exaggerating claims of varietal productivity, or local cropping practices greatly fall short of meeting the optimum needs of the crop. Whatever reason there is, the level of productivity in the country’s corn producing areas must be improved.
Farmers could now choose to grow three types of corn varieties: hybrid, open pollinated or Bt (biotech). Hybrid varieties yield much higher than open pollinated varieties(OPV), but are priced higher and require more inputs. Hybrid seeds are designed to be used for just one season, while OPV could be used for multiple seasons. Biotech corn beats conventional hybrid and OPV seeds by exhibiting genetic resistance to major pests. Though priced much higher, Bt corn compensates through lesser yield loss from pest attacks. Advocates claim that in severe corn borer infested areas, the yield advantage of biotech corn over other varieties could go as high as 25 to 30 percent. 1.2 Corn requirements and physiology. Corn requires less production inputs, especially water, compared to rice. Corn also thrives well in marginal areas, making it a viable source of livelihood for resource-constrained smallholder farmers.
The most desirable soil for corn production is deep, medium textured, well drained, and with high organic matter and water holding capacity. Soil types with these characteristics are loam, silt loam, and silty clay loam (PCARRD, 1981). Land is prepared as early as one month before the actual planting date. It is plowed and then harrowed two weeks after to meet the desired soil texture. Plowing is done when the field is of the right moisture content.
A corn plant requires 4 to 5mm of water per day. During critical periods like silking and soft dough stages, the requirement could be as much as 6 to 8mm/day. If the crop does not receive enough water during this period, as much as 20 to 50% yield could be lost. Lansigan, et.al (2004) estimated that the most critical point falls around 55 DAP. Other literatures state that water should be available

3
at 40 DAP during the start of flowering/reproductive stage. In areas where water is not a problem, farmers are advised to irrigate every two weeks.
Harvesting is done when the crop reaches its physiological maturity at around 90-120 DAP. Signs of grain maturity include drying-up of the corn ear and darkening of the base of kernels. 1.3 Corn and climate variability. Most of the country’s corn-producing areas are rainfed. Farmers await the coming of rains before planting the season’s crop. A good cropping is highly dependent on sustained rainfall, especially during the critical stages of crop development. One could therefore equate good seasonal precipitation to a good corn cropping season. In the same light, climatic irregularities could spell disaster to local growers.
Seasonal climatic variability is a major challenge to many. More frequent occurrences of El Niño and La Niña phenomena during the past decade have made this concern very apparent. Without assured rainfall, the risk involved in rainfed farming is multiplied by so many folds. And with most rainfed farmers belonging among the poorest of the poor, improper timing or commencement of planting is a mistake many cannot afford.
Proper issuance of seasonal climate forecasts would give rainfed farmers a certain level of confidence in their on-farm decision-making. Though natural climatic occurrences are beyond the control of man, farming operations could be tapered to reduce losses from dry spells or eventual floodings.
2.0 Corn Farming in Isabela, Philippines 2.1 The corn industry. Corn is the second most important cereal crop in the Philippines. It is the staple food of many Filipinos from the south. Five million Filipinos depend on the commodity for their livelihood. In terms of gross value added (GVA) in agriculture, corn ranks third overall--next only to rice and coconut (PCARRD,2005).
In 2005, corn registered an output of 5.3 million metric tons, 2.9% short of the previous year’s record of 5.4 million metric tons. Productivity slightly improved by 0.5% owing to increased use of good quality seeds. However, there was an 85 thousand hectare drop in area harvested. Extended dry spell during the first semester of the year and flooding/excessive rains before yearend caused most of the losses. Forecasts of corn production for the first half of 2006 suggested good recovery and positive growths. Palay and corn performance for the initial half of 2006 looked promising given improved weather conditions.(BAS 2006)
Table 1. Corn yield (MT/ha) from 1996 to 2005 Region/Province 1996 1997 1998 1999 2000 2001 2002 2003 2004 2005
Philippines 1.52 1.59 1.62 1.74 1.80 1.82 1.80 1.92 2.14 2.15 Region II 2.05 2.56 2.40 3.11 3.23 3.09 3.04 3.33 3.79 2.98 Isabela 2.22 2.70 2.49 3.25 3.44 3.21 3.21 3.54 3.91 3.11
Note: computed from BAS data, 2006

4
Table 2. Corn area harvested in hectares by region/province, 1996-2005 Region/Province 1996 1997 1998 1999 2000 2001 2002 2003 2004 2005 Philippines 2,735,723 2,725,875 2,354,208 2,642,208 2,510,342 2,486,588 2,395,456 2,409,828 2,527,135 2,441,788 CAR 22,777 24,892 22,913 27,520 27,337 33,058 32,954 31,211 34,961 42,010 Region I 62,208 62,662 69,877 59,121 52,490 51,590 52,869 53,837 56,305 67,298 Region II 226,911 261,253 237,520 331,367 294,546 293,385 273,562 247,142 316,411 258,180 Isabela 142,560 160,066 145,864 226,710 196,681 201,740 172,717 163,914 217,333 165,049 Region III 18,809 21,676 33,056 25,677 24,517 31,841 33,739 36,823 36,921 44,500 Region IV-A 43,017 39,316 35,252 36,110 36,757 36,520 35,403 36,480 37,298 36,365 Region IV-B 40,108 41,964 23,604 32,995 33,369 31,090 31,318 28,266 29,729 36,407 Region V 120,140 115,815 100,162 96,240 81,124 84,529 88,429 81,762 81,068 80,237 Region VI 92,573 92,215 66,210 72,486 81,813 75,067 77,440 81,827 88,700 107,030 Region VII 259,280 243,371 222,932 229,944 228,981 238,438 241,833 244,699 244,259 246,463 Region VIII 59,396 61,343 52,956 58,719 58,303 57,687 57,415 56,969 56,858 58,589 Region IX 211,635 219,346 218,484 197,756 173,562 175,261 176,155 184,992 183,005 163,365 Region X 450,205 439,104 402,188 399,866 384,388 377,933 339,707 377,276 393,149 381,499 Region XI 213,523 202,961 174,472 183,108 181,340 177,217 189,582 195,783 203,420 200,409 Region XII 566,328 529,107 376,604 515,749 472,694 445,148 433,379 421,326 418,019 398,343 CARAGA 51,042 54,444 53,276 41,068 49,713 47,782 51,357 49,839 57,055 55,765 ARMM 297,771 316,406 264,702 334,482 329,408 330,042 280,314 281,596 289,977 265,328
Source: BAS, 2006
Table 3. Corn volume of production in metric tons by region/province, 1996-2005 Region/Province 1996 1997 1998 1999 2000 2001 2002 2003 2004 2005 Philippines 4,151,332 4,332,417 3,823,184 4,584,593 4,511,104 4,525,012 4,319,262 4,615,625 5,413,386 5,253,160 CAR 34,533 41,910 40,298 67,005 72,415 93,552 93,611 84,162 106,282 130,464 Region I 162,610 199,729 214,469 180,706 173,446 182,666 182,061 196,679 223,855 300,184 Region II 466,228 669,821 571,208 1,029,863 951,904 907,177 832,411 824,053 1,198,394 769,506 Isabela 316,853 432,937 362,612 736,112 675,716 647,979 554,176 580,128 850,046 513,687 Region III 52,805 70,974 117,739 77,459 77,298 114,065 122,546 143,619 147,230 182,333 Region IV-A 47,215 44,452 39,060 40,821 41,308 42,297 41,309 42,772 53,034 64,102 Region IV-B 63,639 67,137 27,311 55,812 56,526 58,755 62,005 59,359 67,564 94,161 Region V 101,482 99,157 75,083 83,541 62,787 62,842 73,963 66,361 81,285 118,115 Region VI 72,119 80,652 77,619 68,510 80,340 75,540 87,065 128,728 138,205 193,736 Region VII 159,042 142,908 141,188 138,618 137,536 154,011 166,960 192,061 183,995 188,525 Region VIII 43,156 44,307 33,349 45,813 46,306 47,525 49,651 51,835 59,906 68,416 Region IX 191,861 182,922 196,722 122,306 123,233 134,309 135,072 176,287 199,631 223,208 Region X 816,424 875,027 840,997 776,819 777,828 798,733 701,211 817,182 927,689 938,227 Region XI 150,413 144,737 131,940 145,814 151,307 148,406 181,947 214,344 247,781 293,413 Region XII 1,117,688 959,380 777,732 1,028,086 990,300 919,042 885,055 870,124 1,025,312 959,286 CARAGA 45,433 49,875 71,575 37,434 70,959 67,747 68,043 74,545 95,260 98,595 ARMM 626,684 659,429 466,894 685,986 697,611 718,345 636,352 673,514 657,963 630,889
Source: BAS, 2006

5
2.2 Isabela as top producing province. Until 2004, Isabela ranked as the number one corn producing province in the country. Over the years, the province had been a consistent top producer with a national production share ranging from 9 to 16 percent. In 2004, it posted an impressive national share of 16%, producing a total volume of 850,000MT.
However, in 2005, provincial production fell by 40% (340,000MT), decreasing its share of the national production pie to only 10%. Isabela had to settle for second place in the corn production race due to dry spells in the early part of the year and flooding in September and December. Bukidnon province overtook it with a record production high of 651,136MT.
The key to Isabela’s productivity is its extensive broad and flood plains. Hilly areas are also used for planting corn. The crop grows well in the province even without irrigation infrastructure, with the local climate classification bordering on types III and IV (no pronounced dry season and even rainfall distribution year-round).
As of 2005, the top producing municipalities in Isabela were: San Agustin, Naguilian, San Guillermo, San Mariano, Tumauini, Angadanan, Jones, Echague, Cauayan City and Ilagan.
Table 4. Top corn-producing municipalities per district, 2003-2004District Municipality Production Area
Metric Tons Rank Hectarage Rank I Ilagan 57,872 1 16,474 1 Tumauini 29,946 6 7,585 5 II San Mariano 24,341 7 6,080 7 Naguilian 20,546 9 5,253 8 Benito Soliven 18,658 11 4,616 9 III Cauayan City 51,117 2 11,874 2 Angadanan 29,998 5 7,267 6 San Guillermo 21,355 8 3,378 11 IV Echague 42,165 3 9,844 3 Jones 35,507 4 8,491 4 San Agustin 18,789 10 3,637 10
2.3 Production vs. climatic variability. Most of Isabela’s prime corn lands are rainfed. Irrigated farms are usually reserved for rice growing, with farmers putting more value on this staple crop. Though such is the case, the province remains one of the top producers of corn in the country.
Planting in the country’s less developed agricultural lands, however, has its price. Without assured irrigation, farmers are at the mercy of nature. Because of this, the effects of climatic variabilities are very much felt in Isabela.
Since 1990, several cycles of El Niño and La Niña have wrought havoc to the local farming community. In the year 2005 alone, local farmers experienced dry spells and bouts of flooding causing a total damage of P838Million. These events caused many farmers to replant 2-3 times in two consecutive cropping seasons. The 6 percent decrease in national corn production share was attributed to these aberrations of nature. The extent of impact on the livelihood and socio-economic conditions of farmers could be much worse.

6
Proper timing and a good seasonal climate advisory would have spared many farmers from
going through so much loss.
Table 5. Damages on Corn Production in Isabela Caused by Drought and Flooding in 2005
Event Duration Total Affected Area (Ha)
Production Loss(MT)
Total Cost (P)
El Niño Months Drought Jan-Mar 2005 93,359 206,153 609,281,264.00 June-Aug 2005 La Niña Months Flooding due to Sept. 2005 7,273 13,789 59,203,768.00 excessive rains caused by typhoon “Labuyo" and ITCZ Flooding due to Dec. 2005 25,688 71,492 169,023,157.00 excessive rains caused by typhoon
“Quedan" and Monsoon
Rains TOTAL 126,320 291,434 837,508,189 Source: Department of Agriculture, 2006 Note: Production in Isabela actually decreased by 40% or 340,000MT in 2005, decreasing its
national production share to only 10% 3.0 Farm and household level study on corn farming and value of SCF 3.1 Valuing Seasonal Climate Forecast (SCF). SCF is one of the tools, which could help farmers and decision makers better prepare for seasonal variability. SCF applies probabilistic principles in projecting climatic deviations. The Philippine Atmospheric Geophysical, Astronomical Service Administration (PAGASA) is presently using the ACIAR-developed RAINMAN, together with other tools, in coming-up with SCFs.
Appropriate warnings through SCFs could help farmers cope-up with climate variability by allowing them to make informed decisions on the proper choice of crop, timing of cropping period, levels of input use and use of other mitigating measures. However, a cloud of uncertainty looms over the true value of SCF to its target users.
The accuracy of forecasts, the accessibility of information, the general psychology of Filipino farmers and the interplay of these elements– determine the significance of SCF to Philippine agriculture in general and on-farm decision making in particular. Proper accounting of these elements and the dynamics in the field would allow for better risk management at the local and national level.

7
To shed light on the true value of SCF in local agricultural decision making and operations, farm and household level surveys were conducted in select provinces in the Philippines. 3.2 Conceptual Framework. On-farm decision making among corn farmers is a complex and dynamic exercise. With crop productivity as end-goal, processes toward coming-up with production decisions oftentimes involve the consideration of both internal and external elements. Farmers consider climate and other biophysical elements such as pests and diseases and soil, irrigation and other related resources. Societal influences, economic factors, and the overall psychological makeup of the farmer complete the mix. The challenge for change agents is to diligently consider this complex mix in addressing needs and identifying appropriate entry points for institutional support like SCF and development interventions.
This study attempted to characterize the corn farmer, by focusing on attributes that influence
his decision-making in relation to corn farming and use of SCF and other climate information. This would allow for better understanding of the subject and permit a more workable fit between needs and proposed interventions.
Figure 1. Conceptual Framework of the Study
3.2 Profile of farmer respondents and covered sites. Echague and Angadanan are among the top corn producing munipalities of Isabela province. They are respectively ranked 3rd and 5th in terms of production and hectarage. The following present the major physical and agronomic attributes of the two municipalities; and the profile of surveyed corn farmers. 3.2.1_Physical Characteristics of survey sites. Echague and Angadanan are located in the southern part of Isabela. The physical characteristics of the two municipalities fairly represent the pedo-
CO
RN
INFLUENCING FACTORS• Climate and other Bio
Physical Elements• Farmers’ Characteristics
– Knowledge, Attitude, Perceptions
– Indigenous Knowhow• Economic factors
– Capital and market– Input and output prices– Gross margin
• Social Influences
INSTITUTIONALSUPPORT
• SCF and other Climate Information
• Development programs and Interventions
PRO
DU
CT
IVIT
Y
GO
AL
S
FAR
ME
R
DECISION MAKING PROCESS
DECISION MAKING PROCESS

8
ecological and agroclimatic features of the province and a substantial part of the Cagayan Valley Region (Region II).
According to the Bureau of Soils and Water Management(BSWM), the corn growing areas of
the province belong to only two categories: (1)Warm lowland (<100m elevation, <8%slope, >25oC) and (2)Warm cool upland (100-500m elevation, <18%slope, 22.5-25oC). Though still with varied topography, Echague is pretty much a typical warm lowland municipality, while Angadanan has both warm lowland and warm-cool upland areas. Topographical classifications of river flood plains, broad plains and hillylands are all present in the two municipalities.
The agroclimatic features of corn producing areas in Isabela belong to two categories: (1)
moist and (2) dry. A moist zone receives an annual rainfall of 1500 –to 2500 mm and has an effective crop growing period of 210-270days. A dry zone receives less than 1500 mm per year and has an effective growing period of 90 to 210 days. The classification determines the timing and number of cropping a rainfed farmer can have in a year. Echague has dry to moist conditions, while Angadanan has mostly moist conditions. 3.2.2 Land use. Corn-based farmers in Isabela are mostly located along the length of the Cagayan Valley River. Most farms along the zone are rainfed as these areas usually do not have communal or national irrigation facilities. Others use pumps to draw water from the river.
Located along the Cagayan river, Angadanan and Echague are prime corn producing areas
with the following corn-based cropping systems: 1.corn+corn, 2.corn+corn+corn, 3.corn+tobacco, 4.corn+corn+watermelon, 5.corn+peanut (BSWM,1995).
Over the years, some changes have occurred on the land use of the two municipalities. But the
dominance of corn-based cropping in the area was validated by the farm-level survey. Based on the description of all parcels planted/tilled by farmers, majority were planted to corn (86%). Other parcels were devoted to rice (3%), corn-vegetable (5%), corn-fruit trees (2%), corn-banana (3%), and corn-peanut (1%).
Among the farmers who concentrated on cultivating corn, most planted in monocrop for two
croppings a year (83%), while a few fallow the land after a season of cropping (3%). 3.2.3 Profile of farmer respondents. A total of 85 corn farmers from the plains and highlands of Echague and Angadanan were interviewed for the farm and household level study.
More than one third (38%) of the respondents were educated only up to the elementary level
with many forced to work in the farm early in their lives. The average household size was 4.88. Twenty one years was the average length of farming experience among those interviewed. The
average length as resident of the Barangay is 35.1 years. One third of the respondents had average monthly income of P6,651.57. The figure included
the additional incomes generated by all family members. The rest of the farmers only had seasonal income from farming operations.

9
Table 6. Profile of respondents Description Average
Years of farming experience 20.9 years Farm size 3.56 hectares Household size 4.88 persons Years as resident in barangay 35.1 years Monthly household income* PhP6,651.57
Note: * only 30 respondents disclosed monthly incomes,
the rest only had seasonal income from planting operations
Table 7.Educational attainment of farmer respondents Educational Level Frequency %
Elementary 32 37.65 High school 35 41.17 Vocational 5 5.88 College 5 5.88 College graduate 8 9.41 Total 85 100
Although the average area farmed by each household was computed at 3.56 hectares, more than half of the respondents had farmlands less than 2ha. Twenty-eight percent of the farmers had very small land holdings ranging from 0.3 to 1 ha. Maximum farm size was 30 hectares.
Table 8. Size of Landholdings among farmers Farm Size (ha) Frequency %
0 < 1 23 28 1 < 2 19 23 2 < 3 15 18 3 < 4 5 6 4 < 5 7 8 5 < 30 14 17 Total 83 100
More than half of the farmers (62%) owned the land that they farm. Twenty two percent were renters/lessees and 11% were tenants/shareholders. A few (5%) were mortgage owners (had their lands on mortgage).

10
Table 9. Tenurial status of farmers, classified by parcels
Tenurial Status Number of Parcels Percentage
Owner 104 62 Mortgage Owner 8 5 Renter/Lessee 36 22 Tenant/ Shareholder 19 11 Total 167 100
In terms of occupation, 97% were primarily dependent on farming. The most common secondary source of income were livestock raising (34%) and driving (12%). The other popular secondary occupations were carpentry (6%), barangay offical (6%), fisherman (5%), store owner (5%) and entrepreneur (5%). Four percent of the respondents only had farming as secondary occupation. Thirty three percent of the farmers had no secondary occupation.
Table 10. Primary and secondary occupations of farmers Occupation Frequency Percentage
Primary Occupation
Farmer 82 97 Office Worker 1 1 Vendor 1 1 Teacher 1 1 Total 85 100
Secondary Occupation
No secondary occupation 29 34 Livestock raiser 28 33 Vendor 3 4 Fisherman 4 5 Driver 10 12 Mechanic 1 1 Fishpond owner 1 1 Carpenter 5 6 Painter 1 1 Barangay Official 5 6 Entrepreneur 4 5 Canteen operator 1 1 Sarisari store owner 4 5 Farmer 3 4 Electrician 1 1 Orchard owner 1 1

11
3.3.4 Cropping patterns. The traditional start of corn planting seasons in Echague and Angadanan are April-June for wet season cropping and October to December for dry season cropping. Each cropping season lasts for approximately 120 days or 4 months.
The top corn varieties being planted in the province are from the giant corporations of Pioneer,
Monsanto and Syngenta. The provincial corn coordinator of Isabela estimated that these three corporations are supplying as much as 70% of the seed requirements of farmers. Biotech corn is also already being planted in the province. Seeds produced by local research institutions (like IPB911) are no longer being planted. Presently, the most common varieties being patronized by farmers are DK818, Pioneer30B80, and TSG81.
The cropping activities of farmers varied with the seasons. The hectarage planted to corn
increased during the dry season or October to December planting. The higher average yield of 3.47 MT during this period partly explains the reason for the deviation.
The average size of farm area planted to corn was consistent during the two consecutive wet
cropping seasons, indicating that farmers were following a certain set of cultural practices. The average farm sizes planted to corn were 1.51 has during the 2005 wet season and 1.52 has during the 2006 wet season.
Table 11. Average farm area planted to corn and yield per planting season
Description
PLANTING WINDOW
April-June 2005
October. - December
2005
April-June 2006
Average farm size planted to corn (ha) 1.51 1.62 1.52 Average corn yield (MT/ha) 3.21 3.47
3.3.4 Cultural practices. Cultural practices of corn growers in the area were found to be similar to those practiced in other corn-producing districts. Below are the general cultivation practices employed by local farmers:
o Farmers prepare the land in advance and wait for the coming of rains before starting to plant. Water is critical within two weeks after planting, hence they have to make sure that rainfall would be sustained.
o Planting is done within furrows with an average spacing of 70x25cm. o Fertilizer application is done twice during the season. Ammonium phosphate (16-20-0)
is usually applied basally during planting. Urea is applied as side or top dressing 30-45 days after planting. Hilling-up is done simultaneously with the second fertilizer application.
o Though many suspect that the soil is already acidic, liming is a rare practice among farmers.

12
o Harvesting is done 110-120 days after planting. Farmers usually wait for good weather before commencing harvest. This is so that the grains/corn seeds will not germinate.
o After harvesting, threshing and drying are done before the grains are sold in the market. A rate of P18-20/sack is usually charged for threshing.
o Plowing in many farms is highly mechanized with the use of tractor. The traditional carabao or cattle is used during planting, fertilizer application and hilling-up. Wage rates for farm workers are fixed. A person is paid P100/day, while a worker with his carabao is paid P200/MAD.
3.3 Farmers’ knowledge and psychology on seasonal climate information 3.3.1 Perception on significance of SCF. Farmers validated the significance of SCF in their agricultural activities. Many believed that SCF serves as guide in decision making (92%) and proper crop management (99%), reduces uncertainty from climate variability (92%), provides info on the seasonal rainfall (93%), and helps predict the possible occurrence of disasters like flooding and landslides (94%).
With 78% of the respondents agreeing that climate variability is a major source of uncertainty
in their agricultural production, the value of accurate seasonal climate advisory cannot be overlooked. Sixty Three percent (63%) further responded that SCF should be considered in making crop production management decisions.
Table 12. Knowledge, perception and attitude of farmers on SCF
Statement Response (%)
Yes No Don’t Know Total
1. Climate is the average weather condition in a particular area that prevails over a particular period (e.g. season).
66 14 20 100
2. Climate is a major source of uncertainty in agricultural production.
78 15 7 100
3. Seasonal climate forecasts (SCFs), which refer to forecasts made prior to the start of a season, would guide farmers’ crop production decision making.
92 6 2 100
4. SCF is an important information for crop production management decision.
99 1 - 100
5. Accurate SCF has the potential to reduce the uncertainty brought about by climate variability and risk.
92 7 1 100
6. SCF should not be taken into account when making decisions in crop production.
32 63 5 100

13
Statement Response (%)
Yes No Don’t Know Total
7. SCF is useful because it allow us to know the amount and onset of rain in the next season.
94 5 1 100
8. SCF may help in predicting the likelihood of Disasters like mudslide, flood or drought.
94 5 1 100
3.3.2 Sources of climate information among farmers. The most common sources of climate information among farmers were: Television (93%), radio(88%), co-farmers (51%), agricultural technicians (27%) and newspaper (11%). Only 4% answered that they received information from the local PAGASA station..
Table 13. Sources of information on climate among farmers Source Frequency %
PAGASA local station 3 4 Radio 75 88 Television 79 93 Indigenous knowledge 23 27 Co-farmer 43 51 Technician 23 27 Ernie Baron 1 1 Newspaper 9 11 None 1 1
3.3.3 Awareness and appreciation on PAGASA climate information products. PAGASA advisories on ENSO (94%) and tropical cyclone occurrence (85%) were the most received climate information among farmers. Table 10 shows the awareness and perception of farmers on PAGASA’s information products.
Among those who received information on El Niño and La Niña, thirty eight percent found
them useful, and 24% considered them reliable. Only 11% and 9% considered the forecast not useful and unreliable, respectively. Among the farmers who received tropical cyclone warning, 76% and 67% respectively answered positively on the usefulness and reliability of the information. Only 5% considered it not useful and 6% viewed it unreliable.
Both ENSO and tropical cyclone advisories received excellent marks from almost one fifth of
the respondents. Sixteen percent of the farmers considered both information products as vital, while 18% answered that their reliability is excellent.

14
Table 14. Awareness on, usefulness and reliabilty of PAGASA climate information products
Product Awareness
Usefulness*
Reliability**
1 2 3 4 5 1 2 3 4 Frequency
Monthly weather situation and outlook 16 1 3 3 7 3 2 5 5 5 Annual Seasonal Climate forecast 16 1 4 6 2 2 1 3 7 4 El Niño/La Niña Advisory 80 9 14 32 14 11 8 22 20 15 Tropical Cyclone Warning 72 4 12 27 14 12 5 19 23 15 10 Day Advisory 6 1 4 1 2 2 1 Farm Weather Forecast 4 1 1 2 1 2 Phil Agroclimatic Review and Outlook 2 2 2 Press Release on Significant Events 2 1 1 1 1 Phil Agri-weather Forecast 3 2 1 1 1 1 Climate impact Assessment Bulletin for Agric 3 2 1 1 1 1 Percentage (%)
Monthly weather situation and outlook 19 1 4 4 8 4 2 6 6 6 Annual Seasonal Climate forecast 19 1 5 7 2 2 1 4 8 5 El Niño/La Niña Advisory 94 11 16 38 16 13 9 26 24 18 Tropical Cyclone Warning 85 5 14 32 16 14 6 22 27 18 10 Day Advisory 7 - 1 5 - 1 - 2 2 1 Farm Weather Forecast 5 - 1 1 - 2 - 1 - 2 Phil Agroclimatic Review and Outlook 2 - - - - 2 - - - 2 Press Release on Significant Events 2 - - 1 - 1 - 1 - 1 Phil Agri-weather Forecast 4 - - 2 - 1 - 1 1 1 Climate impact Assessment Bulletin for Agric 4 - - 2 - 1 - 1 1 1 *Usefulness rating: 1-not useful, 2-somewhat useful, 3-useful, 4-highly useful, 5-vital **Reliability rating: 1-unreliable, 2-somewhat reliable, 3-reliable, 4-excellent
3.3.4 Sufficiency, correctness and level of satisfaction on received information. To gauge the value of climate related information being received by farmers, questions on sufficiency and correctness and satisfaction were asked. Fifty five percent (55%) said that the information were sufficient; 72% believed the advisories were accurate and 61% professed their satisfaction with the information.
Although majority answered positively, a significant number of farmers still voiced out
discontent on the sufficiency of information(44%), correctness of content(28%) and level of satisfaction (39%).

15
Table 15. Farmers' perception on climate information received
Response Sufficiency Correctness Satisfaction Frequency % Frequency % Frequency %
Yes 47 55 61 72 52 61 No 37 44 24 28 33 39 No answer 1 1 0 0 0 0 Total 85 100 85 100 85 100 Note: ‘yes’ includes answers like 'it depends' and 'sometimes'
3.3.5 Relevance of climate related information. All interviewed farmers stated that climate related information were relevant to crop production operations. One hundred percent (100%) answered positively with 45% stressing that climate-related information were very relevant.
Table 16. Relevance of climate-related information Response Frequency %
Very relevant 38 45 Relevant 34 40 Moderately relevant 13 15 Not relevant 0 0 Total 85 100
3.3.6 Farmers’ perception on reliability of seasonal rainfall. Thirty percent of the respondents aired uncertainty over the reliability of seasonal rainfall in meeting their cropping needs. Forty percent said that rainfall was reliable, and 21% responded it was somewhat reliable. Still, majority of farmers believed that seasonal rainfall is sufficient to meet crop requirements.
Table 17. Farmers’ perception on reliability of rainfall Response Frequency %
Very reliable 6 7 Reliable 34 40 Somewhat reliable 18 21 Unreliable 18 21 Somewhat unreliable 8 9 No answer 1 1 Total 85 100

16
3.3.7 Frequency of droughts as perceived/experienced by farmers. It is quite alarming that majority of the farmers were experiencing more frequent bouts of prolonged dry spells over the past years. Forty One percent (41%) of the farmers said that drought occurred every two years, while 28% claimed they were experiencing the problem almost yearly.
Table 18. Frequency of droughts as perceived/ recalled by farmers
Response Frequency %
Every 2-3 months 2 2 Every semester 4 5 Yearly 24 28 Every 1 ½ year 1 1 Every 2 years 35 41 Every 3 years 10 12 Every 5 years 3 4 Every 7 years 1 1 Every 10 years 3 4 Every 3 consecutive years 1 1 No pattern 1 1 Total 85 100
3.3.8 Perceived impact of seasonal rainfall on crop production. Majority of farmers validated the significant impact of seasonal rainfall on crop production. Forty Eight percent (48%) stated that the impact was medium in intensity, while 24% claimed it was major or high. Only 21% answered that seasonal rainfall impact was minimal.
Table 19. Impact of seasonal rainfall on crop production
Response Frequency % Major or high 21 24 Medium 41 48 Low impact 5 6 Minimal 18 21 Total 85 100
3.3.9 Attitude towards risk. Majority of the interviewed corn farmers were conservative in their farming activities. Sixty five percent preferred low-but-assured-yield over a high-risk-high-profit alternative. When asked whether they were willing to take risks for higher earnings, most preferred average returns in exchange for lower risks or favorable cropping conditions.

17
Table 20. Risk Averse vs. Risk taker: stand of farmers on taking risks in farm operations
Response Frequency % Risk Averse 55 65 Risk Taker 30 35 Total 85 100
3.4 Key production decisions influenced by climate
3.4.1 Major factors considered by farmers in crop production. Climate information was second only to capital in terms of factors considered by farmers in their crop production operations. Ninety Two percent (92%) replied that capital is their number one concern, with climate information coming in a close second (76%).
The other factors being considered by farmers were cost of inputs (69%), selling price of
produce (69%), corn variety (4%), and activities of other farmers (1%).
Table 21. Major considerations in crop production among farmers Considerations in Crop Production Frequency %
Capital 78 92 Climate information 65 76 Cost of inputs 59 69 Selling price of produce 58 68 Corn variety 3 4 Activity of other farmers 1 1
3.4.2 Key production decisions as influenced by climatic variability and SCF. Farmers were in consensus about the significance of climate variability and seasonal climate advisory in on-farm decision making processes.
The respondents stated that the decisions on the following were affected by climate variability:
capital (66%), type of crop (72%), timing of planting (69%), cost of inputs (28%), and selling price of produce (1%).
On the influence of SCF in general farm production operations, decision-making on the
following were affected: capital (62%), crop to plant (60%), timing of planting (56%), cost of inputs (4%), and selling price of produce (1%).
The influences of SCF specifically on corn production were manifested in farmers’ decisions
on corn variety (78%), levels of inputs applied (62%), capital (4%) and timing of planting (1%). It is important to note that though majority of farmers respectively claimed that time of planting is affected

18
by climate variability (69%) and generally influenced by SCF(56%), for corn production, the timing of planting was not subject to received climate information with only 1% professing such influence.
Table 22. Key production decisions as influenced by climatic factors
Key Decision Affected by
Climate Variability Influenced by
SCF in Farm Prod'n Influenced by
SCF in Corn Prod'nFrequency % Frequency % Frequency %
Level of capital 56 66 53 62 3 4 Cost of inputs 24 28 3 4 - - Selling price of produce 1 1 1 1 - - Corn variety - - - - 66 78 Crop to plant 61 72 51 60 - - Timing of planting 59 69 48 56 1 1 Levels of inputs applied - - - - 53 62
3.5 Climate variability and indigenous knowledge and mitigating measures 3.5.1 Crop losses experienced by farmers. Ninety four percent of the respondents had already experienced losing their crop to climatic variabilities like droughts, floods and typhoons. Only 6% responded otherwise. The numbers highlight the great risks faced by farmers in growing corn.
Table 23. Farmers who had experienced crop failure due to climatic variability
Response Frequency %
Experienced crop failure 80 94 Did not experience crop failure 5 6 Total 85 100
3.5.2 Coping measures in the event of crop failure. Most of the farmers had a resigned attitude when it came to mitigating the adverse effects of climatic abnormalities. Among those who suffered from crop failure, 67% believed that nothing could have been done to prevent the loss but to just accept the fortuitous event. Others tried to cope by replanting the damaged crop (18%) and planting alternate crops like mongo and sweet potato(9%). The rest of the answers included applying chemical sprays (5%), praying to God(2%), and adopting measures like crop insurance and building dikes for floods. A farmer even tried other livelihood options like driving utility vehicles just to get by.

19
Table 24. Coping measures adopted by farmers in case of crop failure
Response Frequency %
No strategy/believes nothing can be done but to accept loss
57 67
Replanting (same crop) 15 18 Plant alternate crops like Mongo, white corn, sweet potato 8 9 Chemical spray 4 5 Prayers 2 2 Do early harvest if still possible 1 1 Establish dike to avoid flooding 1 1 Engage in other livelihood activity like driving 1 1 Feed destroyed crops to livestock 1 1 Get crop insurance 1 1 Action depends on weather 1 1 No answer 1 1
3.5.3 Indigenous/traditional forecasting methods. Interviewed farmers enumerated a long list of indigenous indicators regarding the overall theme of the coming seasons.
To predict the coming of rains, local folks looked for a variety of signs ranging from the
appearance of heavenly bodies (moon,stars,sun,clouds); behavior of local fauna (insects, birds and farm animals); and the performance of local flora (flowering of orchids and grass, fruiting of trees).
Table 25. Indigenous indicators of rainy/dry season Response Frequency %
Signs indicating rains will come: • Moonless night 2 2 • Cloudy and dim sky 6 7 • Dragonflies /play/fly at low altitude 3 4 • Stars are twinkling 1 1 • Two months without rain 1 1 • Presence of potholes in the riverbanks 1 1 • Duck going to the roof of the house and showing their wings 2 2 • Crescent shaped moon is like letter C 7 8 • Earthworm rolling over dust 1 1 • Small birds fly together at low altitude 1 1 • Clouds are like cultivated land 1 1 • Moon’s shape is undesirable 3 4 • Moon is oriented sideways 2 2 • Moderate weather for planting season if it rains on the first day of the
year 1
1 • Warm weather signals rains 1 1 • If stars look too near each other 1 1 • Flowering of talahib grass 2 2 • Few fruits of fruit trees signals excessive rains 1 1

20
Response Frequency % • Pigs playing and poultry nesting early signal typhoon 2 2 • Dogs defecate in the middle of the street 3 4 • Clouds are color orange 2 2 • Thunder is present 1 1 • Ants hoard their food 1 1 • Ants carry eggs and food to a certain direction, there will be floods 3 4 • Earthworms emerge from ground 1 1
Drier conditions are to be expected when:
• Crescent shaped moon is like a container catching dripping water 5 6 • When the earth cracks 1 1 • Moon is oriented center 2 2 • Native orchids flower 1 1 • Fruit harvests are good 1 1 • Bright sun during mornings 1 1 • Moon is unusually bright 1 1
3.5.4 Perceived reliability of traditional forecasting techniques. Interestingly, more farmers believed in the reliability of traditional means of weather/climate forecasting. Only 25% voiced out that the methods were unreliable. The rest found the indigenous means reliable (32%), somewhat reliable (4%) and very reliable (6%).
Table 26. Reliability of traditional forecasting methods as Perceived by farmers
Response Frequency %
Reliable 27 32 Very reliable 5 6 Somewhat reliable 3 3 Unreliable 21 25 Not applicable 18 21 No answer 11 13 Total 85 100
3.5.5 Superstitious beliefs among farmers. More than half (64%) of the interviewed farmers did not believe in good luck/ bad luck when making on-farm decisions. However, 35% still conformed to old sayings and beliefs when it came to planting.
Among those who believed in good luck/bad luck, majority followed a set of preferred dates
and days. Five percent believed that Tuesdays and Fridays were unlucky, 5% thought that number ‘8’was good luck, and 2% thought planting during Sundays, holyweek and ‘Lunes de Hudas’ were unlucky. The rest looked for other favorable signs like the appearance of the moon and presence of insects and practiced special rituals supposedly to make the crop more productive.

21
Though some farmers were still practicing certain cultural peculiarities, majority already followed more modern ways of planting corn. This implies that the group may be open to more technological interventions in the future.
Table 27. Farmers believing in good luck or bad luck when deciding on and commencing farm operations
Description Frequency %
Believes in good luck/bad luck 30 35 Does not believe in good luck/bad luck 54 64 No answer 1 1 Total 85 100
Table 28. Good luck/ Bad luck beliefs and practices among farmers Belief/ Practice Frequency %
Place unbroken comb on seeds so they will grow equally well 1 1
If moon appears, corn will grow well/ fullmoon is lucky 2 2 Nothing will be harvested during new moon 1 1 Numbers 11 and 22 are unlucky dates 1 1 Wednesdays and Saturdays are lucky days to plant 1 1 Tuesdays and Fridays are unlucky 4 5 Never plant on Monday-Lunes de Hudas 2 2 Number 25 on calendar is unlucky 1 1 Cowlick on the sole of carabao's feet is good luck 1 1 When planting, don't look back to avoid replanting 1 1 Good luck to plant first seed with chicken beak 1 1 May 8 is a lucky day to plant/ 8 is good luck 4 5 Broken plow is unlucky 1 1 Numbers 7, 8 and 5 are lucky dates 1 1 Numbers by 5 (5,10,15,20,25,30) are lucky dates 1 1 Number 27 is a lucky date 1 1 Scorpions bring luck 1 1 Bad luck to cultivate during Sunday and holy week 2 2 Bad luck to work during the end of the month 1 1 Bad luck to plant during Fiesta of the patron saint 1 1
3.5.6 Indigenous mitigating measures against drought, floods and typhoons. Farmers enumerated several ways of coping with the destruction brought about by drought, floods and typhoons.
Some of the mentioned indigenous ways of countering drought and floods were planting trees, establishing waterways, and planting on riverbanks and waterways. Prayer was the only resort for many. Most farmers were resigned to the fact that not much intervention could be done when such calamities strike.

22
Modern ways utilized to counter drought included the use of water pump (20%) and
establishment of supplemental irrigation (4%). To control flooding, some farmers used contouring and drainage canals.
The very limited options and interventions aired by farmers indicate openings for development interventions. Appropriate agricultural technologies to counter drought and flooding could be made available to local corn growers.
Table 29. Mitigating measures adopted by farmers against climatic disasters Event
Indigenous Measures Modern Interventions Intervention Frequency % Intervention Frequency %
Drought Plant trees 3 4 Use water pump 17 20
Planting banana,
cassava, mongo 1 1 Establish irrigation 3 4 Manual watering 1 1 Flood Plant trees 2 2 Drainage canals 3 4 Planting on Riverbanks 1 1 Contouring 1 1 Planting on waterways 1 1 Establish waterways 1 1
Typhoons Early preparation 1 1 Planting of trees 1 1
3.6 Farmers’ practices and level of farm productivity 3.6.1 Importance of climate information to farming enterprise. Ninety Eight percent (98%) of farmers used climate/weather information in their planning and decision-making activities. Only 1% mentioned otherwise.
Most of the respondents considered climate/weather information to be significant in their
farming enterprises. Forty Eight percent (48%) claimed moderate significance, while 46% responded high significance. Only 2% viewed such information to have low importance in their agricultural livelihood.

23
Table 30.Use of climate/weather information and significance in farming enterprise
Response Frequency % Use in planning and decision making Yes 83 98 No 1 1 it depends 1 1 Total 85 100
Significance to the farming enterprise High 39 46 Medium 41 48 Low 2 2
3.6.2 Indicators used by farmers when commencing key farm activities. Interviewed farmers used an array of indicators when deciding on key production operations like land preparation, planting and harvesting. Most of those interviewed synchronized the cropping season with the coming of rains. Fifteen percent and 33% respectively commenced land preparation and corn planting when it started raining. Eleven percent of the farmers followed the May-June and October to November planting seasons. Nine percent also conformed to seasonal schedules when doing planting operations.
Some farmers wanted to ensure enough moisture for the growing crop by delaying the planting
schedule until the land was wet enough (7%), and after witnessing several successive rainfalls (5%). Still, others gave more weight to preferred dates of the month/year when starting farm work (2%).
When it came to harvesting, many (24%) followed the 110-120 maturity period of the corn
crop. Others waited for the corn ears to dry-up (6%) and preferred to harvest when the weather is dry/moderate(12%).

24
Table 31. Indicators/signs used by farmers when commencing land preparation, planting and harvesting
Indicators/ Signs Land Preparation Planting Harvesting Freq. % Freq. % Freq. %
When it starts raining 13 15 28 33 0 0 By season or months of April-May-Jun and Oct-Nov 12 14 8 9 6 7 When grasses are already tall/grow a certain length 2 2 0 0 0 0 Favorite/ preferred dates and days 1 1 2 2 0 0 Presence of clouds signaling rains 2 2 2 2 0 0 When land is wet enough and already soft 2 2 7 8 0 0 When other farmers start their operation 2 2 1 1 0 0 When the soil/land is hard 2 2 0 0 0 0 After harvesting 5 6 0 0 0 0 After the second rain of the season 2 2 1 1 0 0 After successive rains/ signifying enough rainfall 1 1 4 5 0 0 3-4 days after rains started 0 0 1 1 0 0 When the Talahib grass flowers 1 1 0 0 0 0 After praying 0 0 1 1 0 0 Presence of crickets 1 1 0 0 0 0 Presence of rainbow 2 2 0 0 0 0 If there is no moon 0 0 1 1 0 0 When there's a bit of sun 1 1 0 0 0 0 When there is moderate weather with no rain 0 0 0 0 10 12 When corn ears are all dried up 0 0 0 0 5 6 After visual assessment 0 0 0 0 1 1 After110-120 days 0 0 0 0 20 24 If it is dry season already 1 1 0 0 1 1 Presence of scorpions 1 1 1 1 1 1 Activities depend on the crop variety 0 0 0 0 2 2
3.6.4 Costs and returns in corn farming. The average net return or gross margin per hectare in corn farming was computed at P 18,072.85. Farmers who availed of credit through local financiers got even less at P12,651.00/ha. Production costs consisted of labor costs for farm activities, tractor rental for land preparation, post harvest expenses like threshing, and material inputs like fertilizer, pesticide, herbicide and seeds. Labor from family and community bayanihan were not included in the
-40,000.00
-20,000.00
0.00
20,000.00
40,000.00
60,000.00
80,000.00
100,000.00
1 7 13 19 25 31 37 43 49 55 61 67 73 79 85GR
OSS
MA
RG
IN (P
hP
GROSS MARGIN FREQUENCY PERCENTAGE(RANGE) (#) (%)
<0 29 34.12 0<1000 2 2.35
1000<2000 - - 2000<3000 1 1.18 3000<4000 2 2.35 4000<5000 3 3.53 5000<6000 1 1.18 6000<7000 2 2.35 7000<8000 4 4.71 8000<9000 - - 9000<10000 3 3.53
10000<11000 2 2.35 11000<12000 1 1.18 12000<13000 1 1.18 13000<14000 2 2.35 14000<15000 - - 15000<16000 - - 16000<20000 4 4.71 20000<25000 3 3.53 25000<30000 8 9.41
>30000 17 20.00 TOTAL 85 100.00
MEAN GROSS MARGIN = PhP 12,191
Gross Margin Distribution
25
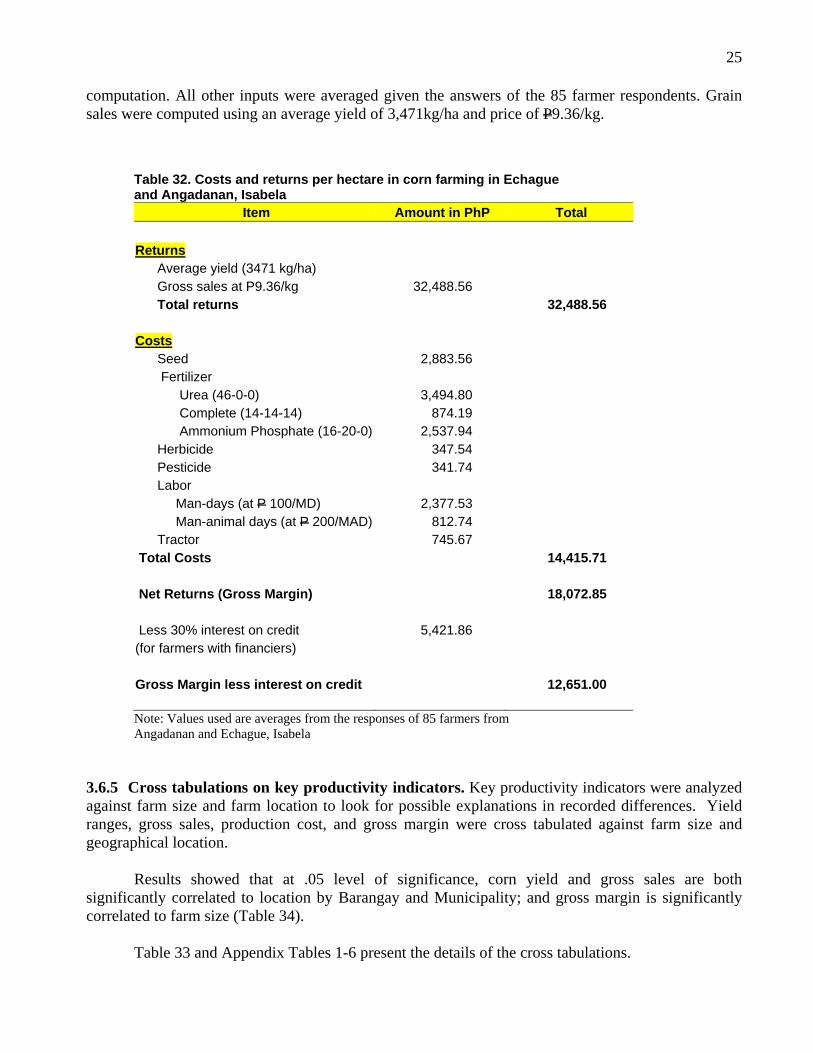
computation. All other inputs were averaged given the answers of the 85 farmer respondents. Grain sales were computed using an average yield of 3,471kg/ha and price of P9.36/kg.
Table 32. Costs and returns per hectare in corn farming in Echague and Angadanan, Isabela
Item Amount in PhP Total
Returns Average yield (3471 kg/ha) Gross sales at P9.36/kg 32,488.56 Total returns 32,488.56 Costs Seed 2,883.56 Fertilizer Urea (46-0-0) 3,494.80 Complete (14-14-14) 874.19 Ammonium Phosphate (16-20-0) 2,537.94 Herbicide 347.54 Pesticide 341.74 Labor Man-days (at P 100/MD) 2,377.53 Man-animal days (at P 200/MAD) 812.74 Tractor 745.67 Total Costs 14,415.71 Net Returns (Gross Margin) 18,072.85 Less 30% interest on credit 5,421.86 (for farmers with financiers) Gross Margin less interest on credit 12,651.00 Note: Values used are averages from the responses of 85 farmers from Angadanan and Echague, Isabela
3.6.5 Cross tabulations on key productivity indicators. Key productivity indicators were analyzed against farm size and farm location to look for possible explanations in recorded differences. Yield ranges, gross sales, production cost, and gross margin were cross tabulated against farm size and geographical location. Results showed that at .05 level of significance, corn yield and gross sales are both significantly correlated to location by Barangay and Municipality; and gross margin is significantly correlated to farm size (Table 34). Table 33 and Appendix Tables 1-6 present the details of the cross tabulations.

26
3.6.5.1 Yield vs location and farm size. Overall, dry season yields averaged at 3.47MT per hectare, ranging from a low of zero to a high of 9900kg. Forty six percent (46%) of the farmers in the two municipalities had yields lower than the 3000kg mark. Forty one percent got yields higher than 3000kg, with 11% getting impressive production of more than 6000MT/ha.
Yields in the upland barangays of La Suerte, Rang-ayan, Narra and Pagasa were lower than yields recorded from the broad and flood plains of Duroc, Pissay, Annafunan and Dugayong. Average yields for the upland barangays ranged from 2.33MT/ha to 3.42MT.ha. Low land barangays had average yield ranges of 3.63MT to 5.48MT.
Numbers were substantially
higher in the Barangays of Echague, Isabela, with more than half(62%) of the farmers registering a yield of more than 3000kg. Only 18% of Echague farmers received yields less than 3000kg, compared to Angadanan farmers where 27% got below average performance. The average yield for Echague was 3.93MT, while Angadanan had 3.07MT.
Yield seemed to have favored farmers with lesser farm sizes. Figures for farms less than 2ha were comparable to those of bigger farms, but the highest average yields were from farms less than 1ha in size. In fact, 8 out of the 11 farmers with yields greater than 6000kg had only less than 3 hectares of farm land. 3.6.5.2 Gross sales vs location and farm size. Gross sales per hectare averaged at P32,490.25, ranging between zero to P90,000.00. Seventy two percent of the farmers had gross sales of less than P50,000.00, while 20% received figures between P20,000-30,000.00 (Appendix Tables 1-6).
Grain sales varied by location with farmers from Echague gaining the upperhand from their
counterparts in Angadanan. Twenty percent (20%) of Echague farmers obtained sales of more than P40,000.00, while only 7% of Angadanan farmers had comparable returns. This may be because gross sale is reflective of the yield level.
Surprisingly, extreme values were recorded for farmers with less than 3 hectares of land. Both
extremely low and extremely high values were given by respondents from this group, with 25% logging sales higher than P30,000.00 and 33% getting much lower returns. None of the farmers with more than 3ha of farmland got sales higher than P60,000.00—the 8% who registered extremely high values all came from the low farm size group. 3.6.5.3 Production cost vs location and farm size. Total cost per hectare averaged at 14,415.71 for all the respondents. Eighty five percent had per hectare production costs of less than P20,000.00.
-
2,000
4,000
6,000
8,000
10,000
12,000
1 6 11 16 21 26 31 36 41 46 51 56 61 66 71 76 81
YIELD RANGE AMONG CORN GROWERSYIELD RANGE FREQUENCY PERCENTAGE
(KG) (#) (%)0 12 14.12
0<1000 10 11.76 1000<2000 12 14.12 2000<3000 17 20.00 3000<4000 10 11.76 4000<5000 9 10.59 5000<6000 6 7.06 6000<7000 1 1.18
>7000 8 9.41 TOTAL 85 100.00
MEAN YIELD: 3,471 kg/ha
Yield Distribution

27
More than half (59%) of the farmers registered production costs of less than P15,000 per hectare, with 39% incurring expenses between P10,000 to P15,000. Twenty six percent said that they spent around 20,000 per hectare, while the remaining 15% claimed to have spent more.
Production costs did not vary much
by location as figures from Echague and Angadanan farmers were comparable. Flood plains and hilly lands have average per hectare costs of around P13,000.00. Broad plains have a higher average cost at P17,524.43/ha, possibly reflective of the more intense corn cultivation in these areas.
In terms of farm size, 10% of the 13% who claimed to have spent more than P20,000/ha on
direct inputs belonged to the group with less than 3 hectares of farmland. Costs ranged from a low of P10,189.21/ha to a high of P23,848.26/ha. 3.6.5.4 Gross margin vs location and farm size. Gross margin proved variable given differences in farm size. Forty one percent (41%) of the respondents had gross margins of more than P15,000. Twenty two percent (22%) recorded an impressive figure of more than P30,000 per hectare (Appendix Table 1-6). The average gross margin for all the interviewed farmers was P13,487.69/ha. Gross margin values per hectare seemed higher for farmers with smaller lands. Twenty eight percent of the respondents, all with less than 3ha of farmland, gave gross margin values of greater than 15,000. Only 10% of the farmers with this gross margin range came from farmers with bigger land holdings (3-10<ha).
On the other hand, 37% of small land holders and 21% of big land owners disclosed gross
margin figures of less than P15,000. Computed average grossmargin for farms less than or equal to .5ha in size was P31,615.82. Values generally decreased as farm size increased, even reaching a negative low of (P1,095.46 net loss) for farms 5-10ha in size. Farms around 3ha in size received a respectable average gross margin of P19,624.13.
In terms of location, Angadanan and Echague registered similar numbers with 19% of the
former and 21% of the latter claiming gross margins of more than P15,000.00 per hectare. Of the 40% high performing farmers, 29% were from the lowland barangays of Duroc, Pissay, Annafunan and Dugayong. The average returns for Echague were a bit higher than figures from Angadanan. Echague had an average gross margin of P15,387/ha, while Angadanan had only P11,717.49/ha. 3.6.5.5 Lowland vs. Upland Farms. Among the covered sites, broad and flood plains comprise the lowland corn producing areas, while rolling and hilly lands make up the upland farms. The villages of Duroc, Pissay, Annafunan and Dugayong are predominantly lowland, while Rang-ayan, La Suerte, Narra and Pagasa are generally upland.
0.00
5,000.00
10,000.00
15,000.00
20,000.00
25,000.00
30,000.00
35,000.00
40,000.00
1 7 13 19 25 31 37 43 49 55 61 67 73 79 85
CO
ST P
ER H
ECTA
RE
(PhP
Cost Distribution

28
Comparative analysis showed that lowland farmers have an edge over their upland counterparts. In all observed productivity indicators, higher figures were recorded among farmers from broad and flood plains, with the former showing the highest figures among all topographical classifications. In terms of yield, of the 41% who got figures above 3MT, 31% were from lowlands while only 10% were from upland farms (Appendix Table 1-6). Broad plains had an average yield of 4.5MT, while flood plain and hillyland had respective yields of 3.7MT and 2.5MT (Table 29). On gross sales, of the 37% who got exceptionally high figures of above P30,000, 29% were from lowlands while 8% were from upland farms. Among those who incurred production costs of more than 15,000 per hectare, 24% were from upland farms, while only 17% were from lowlands. Input costs still seemed higher for upland areas. On average, broad plains had the highest cost per hectar at P17,524.43. The high cost is, however, offset by greater productivity. Considering gross margin, lowland farms still had the edge. Of the 36% who got net returns of more than P15,000 per hectare, 30% were from lowland farms while only 6% came from upland farms. Gross margin was highest in broad plains with an average of P22,536.5/ha. Flood plains had a gross margin average of P17,718.98/ha, while hilly lands had only P5,134.19/ha. 3.6.5.7 Tenurial status vs. productivity indicators. Considering the tenurial status of farmers, the productivity of tenants/shareholders proved higher than those of owners, mortgage owners and renters/lessees. With an average yield of P5,251.00 and average gross margin of P26,811.02, tenants or shareholders bested all others in the productivity race. Yields of farmers classified under other tenure status registered much lower figures. Average yields for these farmers were close to the provincial average of 3.11MT. Land owners had an average yield of 3.3MT, mortgage owners had 3.0MT, and renters/lessees had 3.3MT. Tenants also had lower costs per hectare averaging at P11,414.88. This is much smaller than the figures disclosed by land owners (P14,730.06 ), mortgage owners (18,450.00 ) and renters/lessees(14,694.57).

29
Table 33. Mean values of cross tabulated productivity indicators
ITEM MEAN VALUES
Yield (kg./ha.)
Gross Sales (PhP/ha.)
Cost (PhP/ha.)
Gross Margin (PhP/ha.)
TOPOGRAPHY Flood Plain 3,722 34,842.62 13,103.34 17,718.98 Broad Plain 4,484 41,968.23 17,524.43 22,536.15 Hilly Land 2,539 23,761.22 13,489.47 5,134.19 Total 3,471 32,490.25 14,415.71 13,487.69
BARANGAY Duroc 3,995 37,389.30 12,442.59 20,792.34 La Suerte 2,548 23,853.82 15,377.42 6,488.58 Pissay 3,634 34,018.02 11,452.40 19,473.08 Rang-ayan 2,332 21,824.40 15,156.04 3,030.96 Annafunan 3,706 34,691.41 16,004.69 11,748.44 Dugayong 5,484 51,333.88 18,836.95 32,496.94 Narra 3,420 32,012.07 12,771.52 13,420.18 Pag-asa 2,639 24,697.03 13,207.07 4,080.85 Total 3,471 32,490.25 14,415.71 13,487.69
MUNICIPALITY Angadanan 3,068 28,716.17 13,735.48 11,717.49 Echague 3,934 36,819.35 15,145.70 15,387.42 Total 3,471 32,490.25 14,415.71 13,487.69
FARM SIZE (HA) <0.5 4,466 41,805.03 10,189.21 31,615.82 0.5<0.9 4,968 46,499.79 23,848.26 22,651.53 1 3,588 33,579.00 12,763.08 18,232.92 1.5 3,048 28,530.32 13,964.00 11,713.29 2 3,085 28,877.33 16,550.44 12,326.89 2<2.5 3,961 37,076.00 15,506.06 (675.66) 2.5<3 3,924 36,725.00 13,428.38 19,624.13 3<4 3,958 37,050.00 16,305.44 5,924.56 4<5 2,727 25,527.84 14,178.67 7,702.34 5<10 3,044 28,496.00 14,459.14 8,855.77 >10 1,712 16,026.40 13,115.26 (1,095.46) Total 3,471 32,490.25 14,415.71 13,487.69
TENURE STATUS
Owner 3,272 30,629.27 14,730.06 11,146.39 Mortgage owner 3,000 28,080.00 18,450.00 9,630.00 Renter/Lessee 3,331 31,177.58 14,694.57 14,649.03 Tenant 5,251 49,147.58 11,414.88 26,811.02 Total 3,471 32,490.25 14,415.71 13,487.69
Note: Rang-ayan, La Suerte, Narra and Pagasa and predominantly upland areas, while Duroc, Pissay, Annafunan and Dugayong are broad and flood plains.

30
Table 34. Symmetric Measures of significance
Nominal by Nominal Contingency Coefficient Valid Cases Value Approximate
Significance
Yield vs Municipality 73 0.408 0.024 * Yield vs Barangay 73 0.699 0.005 * Yield vs Farm Size 73 0.668 0.516 Gross Sales vs Municipality 73 0.480 0.005 * Gross Sales vs Barangay 73 0.734 0.007 * Gross Sales vs Farm Size 73 0.759 0.073 Cost vs Municipality 85 0.227 0.594 Cost vs Barangay 85 0.562 0.590 Cost vs Farm Size 85 0.674 0.161 Gross Margin vs Municipality 85 0.260 0.521 Gross Margin vs Barangay 85 0.604 0.479 Gross Margin vs Farm Size 85 0.721 0.039 *
Note: * significant at 0.05 3.7 Planting intentions and receptiveness to intervention. 3.7.1 Planting intention for 2006 cropping. Ninety two percent (92%) of the farmers followed the April to June wet cropping season. Among them, 39% planted on the same month.
Of the 125 parcels planted during the 2005 wet season cropping, 115 parcels were again cultivated/planned to be cultivated during the same period in 2006. The practice validates a fairly fixed cycle of seasonal cropping.
Table 35. Planting Intention for the 2006 wet seasonResponse Wet Season 2005Wet Season 2006
# % # % Date of planting April 11 9 0 0 May 83 66 97 78 June 31 25 18 14 Total 125 100 115 92 Farmers With the Same Cropping Dates # % Same April 0 0 Same May 46 37 Same June 3 2 Total 49 39
3.7.2 Other climate-related information needed by farmers. Interviewed farmers suggested ways to better the present climate/weather forecasting service. Among the specific climate-related information further needed in the field were general information on climate/weather concerns, detailed

31
rainfall forecast (12%), location specific advisories, agriculture-specific advisories(4%), occurrence of El Niño and La Niña(5%), and generally more accurate advisories/forecasts (15%). Only 27% stated that they have nothing else to ask for. Eighteen percent (18%) of the respondents gave no answer.
Table 36. Other specific climate-related information needed by farmers Response Frequency %
About rain, typhoons and floods/anything about the weather 4 5 Accurate information/on time and reliable forecast 13 15 Agriculture related information/ If rain is already enough to plant corn/
Climate for the next cropping season to determine what crop to plant 3 4 Correct amount, start date and frequency of rainfall 10 12 Earlier advisory on dry season 1 1 Explanations on terminologies/details on forecast for easy understanding 3 4 If the weather is normal /moderate 2 2 Information on particular/next season, municipality/barangay-specific
forecast 2 2 Occurrence of drought 2 2 Occurrence of El Niño/La Niña 4 5 Update on forecasts 2 2 No additional information needed 23 27 Not sure what else is needed 1 1 No answer 15 18 Total 85 100
3.8 Existing development programs on corn as enumerated by farmers
Seventy nine percent of the respondents confirmed the presence of government/ non-government programs in aid of corn growers. Only 20% stated that they had never received assistance from outside. Among the development programs cited, seed subsidy was the most common (71%). Twenty-one percent had attended trainings/seminars on corn, while 5% received technological support. Formal credit was scarce with only 5% of the respondents receiving such support.
Table 37. Farmers’ perception on existence of government/ non-government programs on corn
Response Frequency % Yes 67 79 None 17 20 No answer 1 1 Total 85 100
32
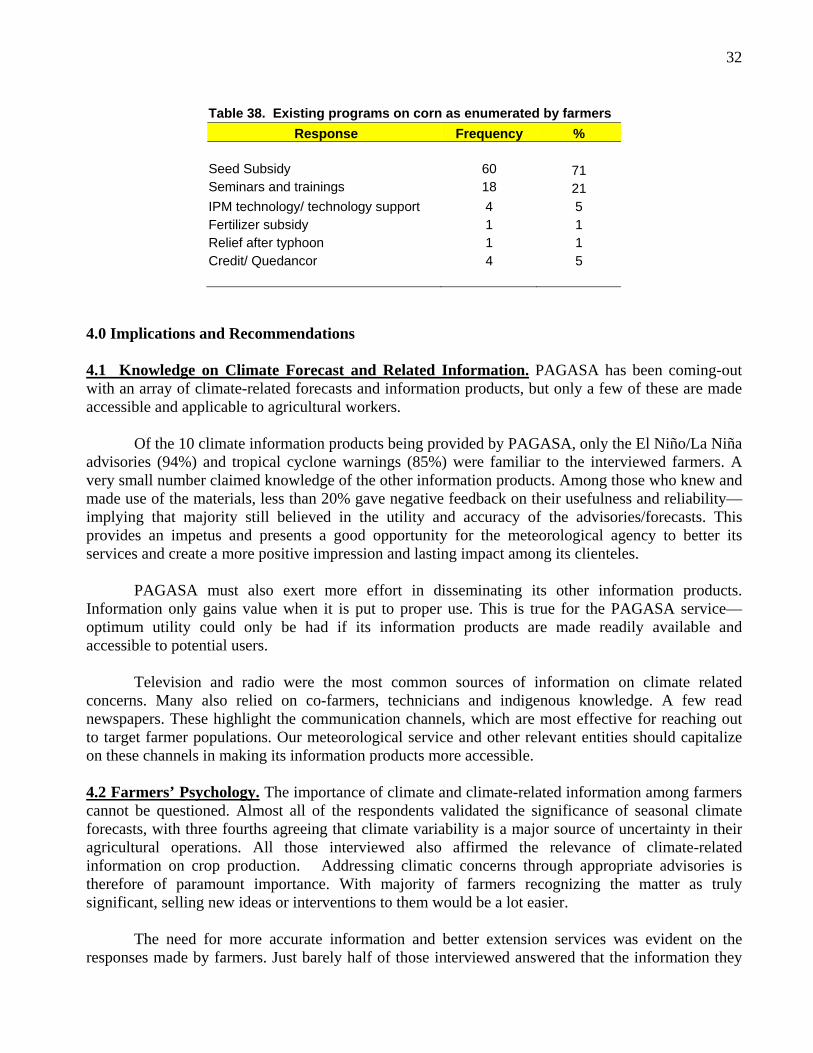
Table 38. Existing programs on corn as enumerated by farmers
Response Frequency % Seed Subsidy 60 71 Seminars and trainings 18 21 IPM technology/ technology support 4 5 Fertilizer subsidy 1 1 Relief after typhoon 1 1 Credit/ Quedancor 4 5
4.0 Implications and Recommendations 4.1 Knowledge on Climate Forecast and Related Information. PAGASA has been coming-out with an array of climate-related forecasts and information products, but only a few of these are made accessible and applicable to agricultural workers.
Of the 10 climate information products being provided by PAGASA, only the El Niño/La Niña advisories (94%) and tropical cyclone warnings (85%) were familiar to the interviewed farmers. A very small number claimed knowledge of the other information products. Among those who knew and made use of the materials, less than 20% gave negative feedback on their usefulness and reliability—implying that majority still believed in the utility and accuracy of the advisories/forecasts. This provides an impetus and presents a good opportunity for the meteorological agency to better its services and create a more positive impression and lasting impact among its clienteles.
PAGASA must also exert more effort in disseminating its other information products. Information only gains value when it is put to proper use. This is true for the PAGASA service—optimum utility could only be had if its information products are made readily available and accessible to potential users.
Television and radio were the most common sources of information on climate related concerns. Many also relied on co-farmers, technicians and indigenous knowledge. A few read newspapers. These highlight the communication channels, which are most effective for reaching out to target farmer populations. Our meteorological service and other relevant entities should capitalize on these channels in making its information products more accessible. 4.2 Farmers’ Psychology. The importance of climate and climate-related information among farmers cannot be questioned. Almost all of the respondents validated the significance of seasonal climate forecasts, with three fourths agreeing that climate variability is a major source of uncertainty in their agricultural operations. All those interviewed also affirmed the relevance of climate-related information on crop production. Addressing climatic concerns through appropriate advisories is therefore of paramount importance. With majority of farmers recognizing the matter as truly significant, selling new ideas or interventions to them would be a lot easier.
The need for more accurate information and better extension services was evident on the responses made by farmers. Just barely half of those interviewed answered that the information they

33
received were sufficient and correct. The same number also expressed satisfaction on climate related information. With so many farmers airing discontent on the amount and accuracy of information they are receiving, the need for improvements seemed very apparent. A satisfaction rating of only 58% also hints on the necessity of climate information tapered to the requirements of local farmers.
The need for credible climate information is further highlighted by the farmers’ perceptions on climatic variabilities. One-third aired uncertainty over the reliability of seasonal rainfall. In addition, about 70% of farmers perceived that dry spells recur as frequently as 1-2 years. The figures are alarming as they add to the psychological insecurity among farmers. If it is true that the occurrence of localized drought is indeed as frequent, then the risks in rainfed farming are greatly multiplied. A thorough study of agroclimatic factors, as they relate to agriculture, should be done to properly adjust crop production operations.
The attitude of farmers towards risk makes them ideal candidates for technological interventions. Most of the respondents only wished for an assured crop harvest. Many preferred a conservative option over a high-risk-high-profit alternative. This implies that farmers will be more than happy to receive accurate seasonal climate advisories. Assuring that there would be sufficient rainfall in a cropping season would provide the farmers a much-needed sense of security. 4.3 Key production decisions. Climate-related concerns and information were claimed to be among the major factors considered by farmers in their decision-making. Next to capital, climate was the number one concern of farmers when it comes to crop production. Both seasonal climate forecasts and climatic variabilities (like excessive rains and drought) were also said to greatly influence decisions on working capital, type of crop to plant, and time of planting. On corn production, SCF helped farmers decide on varieties to use and what levels of production inputs to apply.
When asked about why SCF is important, 96% of the respondents answered that it aids in on-farm decision-making. Specifically, farmers appreciated how SCF allows them to prepare for climatic events. Many also recognized the role of climatic information in deciding when to plant or commence the cropping season. These answers are very close to what researchers and development workers have been advocating. Reliable SCF really could help farmers decide on proper timing of farm operations and prepare for destructive climatic events. This seeming match between the ideals of farmers and change agents may possibly make the campaign on SCF use much easier.
However, a closer scrutiny should be made when interpreting the figures. Regard for SCF may be high, but is this view effectively translated into action? People should be more discerning about what is actually happening in the field.
Overall, the responses made by farmers reinforce the earlier claim on the significance of climate variability and SCF. These are two factors that cannot be overlooked in on-farm decision-making. Affected decisions like the kind of crop to plant, cropping schedule, and inputs to apply, critically determine the level of productivity a farmer can achieve. Climatic considerations and the success of local farming are therefore directly connected. Failure to make the fit will most likely result to an unproductive season. 4.4 Indigenous knowledge. A long list of traditional forecasting methods was gathered from interviewed farmers. The indigenous means, however, were focused more on seasonal onset and day-

34
to-day weather. Projections on seasonal variability like possible occurrence of drought and excessive rains were few.
Indigenous mitigating measures, as well as, modern interventions against droughts and floodings were also found wanting. It seemed that many farmers were resigned to the idea that destruction from these climatic anomalies could not be helped. This sense of “hopelessness” is dangerous as it inculcates a culture of passiveness among farmers.
The situation opens-up avenues for development initiatives and interventions. Proper technological ways of addressing problems caused by climatic variabilities should be extended to local corn growers. The problem on drought could be mitigated with the use of on-farm reservoirs and other small-scale irrigation systems. The harmful effects of excessive rains and flooding could be minimized through proper cultural practices. The use of appropriate crops and proper timing of planting would also help farmers cope-up with climatic challenges. Much could still be done to aid farmers and further improve productivity in the country’s corn producing areas.
With the absence of reliable indigenous climate forecasting means, the role of local weather stations is further highlighted. PAGASA should work on delivering more accurate and timely seasonal forecasts in order to address environmental uncertainties and the needs of the agriculture sector.
One third of the farmers still believed in superstitions when commencing farm activities. Good luck and bad luck beliefs influenced decisions on the timing of and cultural approaches to certain farm operations. Though not with scientific basis, these beliefs and practices are part and parcel of the indigenous make-up of local farmers. Researchers and development workers will have to address these when pushing for the adoption of applicable technological interventions. 4.5 Farmers’ practices and level of farm productivity. The cropping practices of many interviewed farmers were very predictable. Yearly and seasonal cropping routines were pretty much fixed. Most farmers had two croppings of corn commencing at the start of the wet and dry seasons. The former starts from April to June, while the latter commences from October to December.
A bit of inconsistency was observed in the answer of farmers. Though many claimed to refer to SCF when it comes to on-farm decision-making, actual application seemed to be not enough. The start of each cropping season was still principally based on the coming of rains and the usual seasonal schedule. Sustained rainfall usually signaled the commencement of planting operations. Though 56% professed the influence of SCF on general timing of planting in farm operations, only 1% claimed the same effect on the planting schedule for corn. This shortcoming particularly makes farmers susceptible to damages due to climatic variability. This was proven in 2005 when many corn growers had to replant three times due to El Niño/La Niña induced drought and floodings.
Interestingly, corn yields registered higher during the dry season or October to December cropping. This may also be the reason why the farm area planted to corn was higher during this period. Isabela must still be receiving substantial precipitation even during so –called dry months, as the province borders on climate types III and IV (short dry season and even rainfall year-round). Higher solar radiation and lesser occurrences of pests during dry season must have also contributed to better corn productivity and yield.

35
Though far below ideal levels, the overall productivity of corn farms in Isabela was still higher than the national average, which was pegged at only 2.15MT in 2005 (BAS, 2006). With yields in Isabela averaging at 3.11MT, many could claim the advantage. However, this level of productivity was still found wanting by smallholder farmers.
An average net return of just P12,651.00 per hectare for smallholder farmers make this group highly vulnerable. With 28% owning less than 1 hectare and another 23% tilling just up to 2 hectares, the extent of socio-economic inequity among local corn farmers must be great. Well-off growers take advantage of the situation through economics of scale. Bigger land holdings allow them to earn more per season. But for smallholder farmers, the earning potential is limited by small farm sizes. A minor consolation for small land owners is their seemingly higher yield and gross margin per hectare. Average figures on production and monetary returns were a bit higher for farmers with less than 3 hectares. This may be explained by the higher cost of production per hectare for many farmers in this group. A possible explanation is that big landowners may have been scrimping on inputs and extending materials over a wider farm area. In terms of topography, lowland farms proved more productive, surpassing their upland counterparts in terms of yield, gross sales, cost, and gross margin. This observation hints on the potential of the broad and flood plains of Isabela for greater outputs. It also highlights the opportunity to elevate corn productivity in rolling and hilly lands.
Poor level of earnings coupled with large household sizes, translate to widespread poverty among smallholder corn growers. Given low average per hectare returns, two seasons of cropping per year would only give a 5-member household an annual per capita income of around P5,000.00. This level of income would not be sufficient to properly feed, clothe, and educate each member of the farm family.
Many claimed that only a yield of about 6MT could earn for them enough money to pay for the season’s debts and still support a family. If this is true, then everyone concerned should work toward elevating corn productivity to exceptional levels. The target is not impossible, as local farmers have been known to produce as much as 10MT per hectare. The challenge is how to duplicate these small successes and allow more farmers to reap the benefits of modern advances in agriculture. 4.6 Planting intentions and need for more climate information products. The planting schedules of farmers for the past two wet cropping seasons revealed an unmistakable pattern. Many had been following a personal cropping calendar that fall within a general pattern of two croppings per year.
More than 90% of interviewed farmers were practicing a fairly routine planting schedule. The figure hinted on the conservativeness of farmers when it comes to their cropping operations. Even though many suffered crop losses during the same period last year, farmers still stuck to their traditional planting dates.
The planting intentions of farmers further highlighted the importance of seasonal climate advisories. Without reliable forecasts, many would just follow the cropping practices they have been accustomed to for so many years. The crop losses of 2005 could have been minimized if reliable seasonal advisories have been made available early on.

36
The additional climate-related information requested by farmers seemed rational. The call for more information on climate/weather concerns, detailed rainfall forecast, location specific advisories, agriculture-specific advisories, forecasts on El Niño and La Niña, and generally more accurate advisories reflected the major information gaps that needed to be bridged by concerned service institutions. 4.7 Receptiveness to development interventions. In terms of receptiveness to interventions, farmers showed keen interest in receiving outside help. Knowing that 94% of them had at one time experienced crop failure is quite alarming. Worse is the fact that 67% of the farmers thought that such losses were inevitable and would just have to be accepted. Though saddening, this is both an obstacle and an opportunity for development interventions. Change agents must be convincing enough to make farmers realize that they can do more to save their crops and mitigate losses due to climatic variability.
Indeed, things have to be improved, with many smallholder corn farmers confessing that they were not earning enough, and actually incurring more debts every cropping season. If simple advances in agricultural technology could address the socio-economic plight of corn farmers, then not a second should be wasted in delivering these productivity tools.
A positive indicator is that development programs from government and non-government organizations had reached 79% of the farmers. This implies that development machineries are moving and working toward making local farmers more productive. The assistance, however, seemed inadequate as many farmers still fall short of acceptable productivity levels. Though noble in intention, the support being provided under these programs seemed inadequate. Seed subsidy may not be the best solution as many aired doubts on the quality of seeds being dispersed. Seminars, trainings, and technology support should receive more attention as these help in developing the capacity of local farmers. Credit facility is also a good intervention to look at, as farmers have long been exploited by local usurers. The availment of crop insurance is also an attractive option for the corn farming communities of Isabela. 5.0 Conclusions
Climate and climate-related information were undoubtedly among the major factors being considered by farmers in their crop production activities. All aspects explored on the psychology of corn growers points to their significance in local farming operations. The high levels of importance given to climatic conditions and seasonal climate forecasts were evident on the farmers’ perceptions, attitudes, and decision-making processes. With corn farmers in Isabela still thirsting for climate-related information, the delivery of appropriate information and accurate forecasts should be addressed through proper extension and provision of support.
Ranking second only to capital, climate information proved to be a major factor in on-farm decision-making. More than anything, this provides a clear picture of farmers’ psychology on the use of climate information. With critical production decisions founded on climate-related concerns, the provision of proper information and advisories by relevant institutions has the potential of improving over-all farm productivity. Caution should however be exercised in interpreting this finding. The level of significance can only be validated by what could be seen on the field.

37
Though the high regard of farmers on climate forecast and information cannot be questioned, actual application of such information seemed still wanting. Most corn farmers still start the season by “feel”—relying on the coming of rains and usual seasonal cropping schedules when commencing key farm operations. Seasonal climate forecast still has to solidify its role in the decision making process. But before this could happen, the country’s meteorological service must first gain the trust of local growers through more timely and reliable climate information products.
Following a cropping routine is not bad. Two corn cropping in a year must be the most convenient practice for many Isabela growers. But farmers should be pro-active enough to adjust to seasonal climatic abnormalities. This could only happen if they are open to information and outside interventions. The conservativeness of farmers might work two ways—it could either make them resist changes, or allow them to accept the security of appropriate and properly timed information. Many had equated climatic variability with crop failure and poor harvests-- in the same light, appropriate seasonal climate forecasts could be equated to saved crops and better-prepared farmers.
Without doubt, climate/weather information are very much welcome among farmers. The cropping seasons are truly dependent on the coming of rains. However, a significant number of farmers are still questioning the reliability of forecasts being made by our local weather stations. Much has to be done to build-up local confidence on our weather bureau. A conservative group of target clientele would always prefer a secured venture. The psychology of farmers could only be appeased if uncertainties like climate variability could be properly addressed. Reliable seasonal climate forecasts remain the key to answer the riddle of seasonal variability and allow farmers to securely harness the goodness of the changing seasons.
Reliable indigenous knowledge on climate forecasting was scarce. Forecasting seasonal variability is therefore solely in the hands of our weather bureaus. Other support institutions should also do their part in helping farmers cope-up with the destructive effects of drought, excessive rains and floodings. Corn farmers should not only be recipients of information, but also target clienteles for the transfer of appropriate agricultural technologies.
Indeed, much could still be done to improve the productivity of corn farming in Isabela. The local average yield of a little more than 3MT is still quite low compared to the yield potential of present commercial varieties. Ultimately, a holistic approach is necessary to truly elevate the productivity in the country’s corn lands. Only an appropriate combination of technological interventions—from improved varieties, better cultural practices, irrigation support, seasonal climate forecasts and proper information and knowhow—could reverse the tide of poor productivity among local corn growers.

38
6.0 References Bureau of Agricultural Statistics. 2006. Corn Statistics from 1996-2005. Available from
www.bas.gov.ph. Bureau of Soils and Water Management. 1995. Pedo-ecological, Agroclimatic and Corn-Based
Cropping Systems Maps of Isabela and Region II. Diliman, Quezon City. Department of Agriculture. 1999. Tips on Corn Production. Available from www.da.gov.ph. Department of Agriculture. 2006. Report on Rice and Corn Damages. Unpublished. Lansigan F.P., W.L.de los Santos and J.W. Hansen.2004. Delivering Climate Forecast Products to
farmers: Ex Post Assessment of Impacts of Climate Information on Corn Production Systems in Isabela, Philippines. UPLB, Los Baños, Laguna.
Lanosia, Jr.LB, Beltran MM and Salazar AM. 2005. Gabay Sa Produksyon ng Mais (Binagong Edisyon). Institute of Plant Breeding, College of Agriculture, University of the Philippines Los Baños, College, Laguna.
Philippine Council for Agriculture and resources Research (PCARR). 1981. The Philippines recommends for Corn 1981. Los Baños, Laguna.
Philippine Council for Agriculture, Forestry and natural Resources Research and Development (PCARRD). 2002. Philippines Recommends for Corn. Los Baños, Laguna.
Philippine Council for Agriculture, Forestry and natural Resources Research and Development (PCARRD).. 2006. Corn Industry Profile. Available from www.PCARRD.dost.gov.ph

39
ANNEX 1: Appendix Tables
Appendix Table 1. Cross Tabulation of Frequencies (Yield Range/Gross Sales/Cost/Gross Margin) vs. Location (Barangay and Municipal Levels)
Range
Angadanan Echague
TotalDuroc La
Suerte Pissay Rang-ayan Subtotal Annafunan Dugayong Narra Pagasa Subtotal
YIELD(KG) 0<1000 1 3 - 4 8 1 - 1 - 2 10 1000<2000 1 3 1 3 8 - - 1 3 4 12 2000<3000 1 3 2 2 8 2 1 3 3 9 17 3000<4000 3 - 5 - 8 - 1 1 - 2 10 4000<5000 - 1 - - 1 3 3 2 - 8 9 5000<6000 - 2 - 2 2 1 1 4 6 >6000 2 1 - 1 4 - 4 1 - 5 9 TOTAL 8 11 10 10 39 8 10 9 7 34 73
GROSS SALES(PhP) <10000 1 3 - 4 8 1 - 1 - 2 10 10000<20000 1 3 1 3 8 - - 2 3 5 13 20000<30000 1 3 2 2 8 2 2 2 3 9 17 30000<40000 3 1 5 - 9 - - 1 - 1 10 40000<50000 - - 1 - 1 4 4 2 - 10 11 50000<60000 - - 1 - 1 1 1 - 1 3 4 60000<70000 - - - - - - 2 - - 2 2 70000<80000 2 1 - - 3 - - 1 - 1 4 >80000 - - - 1 1 - 1 - - 1 2 TOTAL 8 11 10 10 39 8 10 9 7 34 73
COST (PhP) 0<5000 1 - - - 1 - - - 1 1 2 5000<10000 2 1 5 2 10 1 - 2 2 5 15 10000<15000 3 5 4 4 16 4 5 6 2 17 33 15000<20000 2 5 1 4 12 3 1 2 4 10 22 20000<25000 - - 1 2 3 2 2 1 - 5 8 25000<30000 - - - - - - 1 - 1 2 2 >30000 1 1 - - 2 - 1 - - 1 3 TOTAL 9 12 11 12 44 10 10 11 10 41 85
GROSS MARGIN (PhP) <0 2 4 1 8 15 4 - 3 4 11 26 0<5000 - 2 1 1 4 - 1 1 1 3 7 5000<10000 1 2 1 1 5 1 1 2 4 8 13 10000<15000 - 1 1 1 3 - - 1 - 1 4 15000<20000 2 1 2 - 5 - 1 - - 1 6 20000<25000 - 1 1 - 2 1 - 1 - 2 4 25000<30000 1 - 1 - 2 2 1 1 - 4 6 >30000 3 1 3 1 8 2 6 2 1 11 19 TOTAL 9 12 11 12 44 10 10 11 10 41 85
Note: Rang-ayan, La Suerte, Narra and Pagasa and predominantly upland areas, while Duroc, Pissay, Annafunan and Dugayong are broad and flood plains.

40
Appendix Table 2. Cross Tabulation of Percentages (Yield Range/Gross Sales/Cost/Gross Margin) vs. Location (Barangay and Municipal Levels)
Range
Angadanan Echague
TotalDuroc La
Suerte Pissay Rang-ayan Subtotal Annafunan Dugayong Narra Pagasa Subtotal
YIELD(Kg) 0<1000 1 4 - 5 9 1 - 1 - 2 12 1000<2000 1 4 1 4 9 - - 1 4 5 14 2000<3000 1 4 2 2 9 2 1 4 4 11 20 3000<4000 4 - 6 - 9 - 1 1 - 2 12 4000<5000 - 1 - - 1 4 4 2 - 9 11 5000<6000 - - 2 - 2 2 1 - 1 5 7 >6000 2 1 - 1 5 - 5 1 - 6 11 TOTAL 9 13 12 12 46 9 12 11 8 40 86
GROSS SALES(PhP) <10000 1 4 - 5 9 1 - 1 - 2 12 10000<20000 1 4 1 4 9 - - 2 4 6 15 20000<30000 1 4 2 2 9 2 2 2 4 11 20 30000<40000 4 1 6 - 11 - - 1 - 1 12 40000<50000 - - 1 - 1 5 5 2 - 12 13 50000<60000 - - 1 - 1 1 1 - 1 4 5 60000<70000 - - - - - - 2 - - 2 2 70000<80000 2 1 - - 4 - - 1 - 1 5 >80000 - - - 1 1 - 1 - - 1 2 TOTAL 9 13 12 12 46 9 12 11 8 40 86
COST(PhP) 0<5000 1 - - - 1 - - - 1 1 2 5000<10000 2 1 6 2 12 1 - 2 2 6 18 10000<15000 4 6 5 5 19 5 6 7 2 20 39 15000<20000 2 6 1 5 14 4 1 2 5 12 26 20000<25000 - - 1 2 4 2 2 1 - 6 9 25000<30000 - - - - - - 1 - 1 2 2 >30000 1 1 - - 2 - 1 - - 1 4 TOTAL 11 14 13 14 52 12 12 13 12 48 100
GROSS MARGIN(PhP) <0 2 5 1 9 18 5 - 4 5 13 31 0<5000 - 2 1 1 5 - 1 1 1 4 8 5000<10000 1 2 1 1 6 1 1 2 5 9 15 10000<15000 - 1 1 1 4 - - 1 - 1 5 15000<20000 2 1 2 - 6 - 1 - - 1 7 20000<25000 - 1 1 - 2 1 - 1 - 2 5 25000<30000 1 - 1 - 2 2 1 1 - 5 7 >30000 4 1 4 1 9 2 7 2 1 13 22 TOTAL 11 14 13 14 52 12 12 13 12 48 100
Note: Rang-ayan, La Suerte, Narra and Pagasa and predominantly upland areas, while Duroc, Pissay, Annafunan and Dugayong are broad and flood plains.

41
Appendix Table 3. Comparative performance between flood plains, broad plains and hilly lands (Frequency)
ITEM TOPOGRAPHY (Frequency)
Flood Plain Broad Plain Plain Subtotal
Hilly/Rolling Land Total
YIELD(kg) 0<1,000 2 1 3 7 10 1,000<2,000 1 1 2 10 12 2,000<3,000 7 3 10 7 17 3,000<4,000 6 4 10 - 10 4,000<5,000 - 7 7 2 9 5,000<6,000 5 - 5 1 6 >6,000 2 5 7 2 9 Total 23 21 44 29 73
GROSS SALES(PhP) <10,000 2 1 3 7 10 10,000<20,000 2 1 3 10 13 20,000<30,000 6 4 10 7 17 30,000<40,000 6 4 10 - 10 40,000<50,000 3 6 9 2 11 50,000<60,000 2 1 3 1 4 60,000<70,000 1 1 2 - 2 70,000<80,000 1 2 3 1 4 >80,000 1 1 1 2 Total 23 21 44 29 73
COST(PhP)
<5,000 1 - 1 1 2 5,000<10,000 7 2 9 6 15 10,000<15,000 9 8 17 16 33 15,000<20,000 6 5 11 11 22 20,000<25,000 2 4 6 2 8 25,000<30,000 1 1 1 2 >30,000 1 2 3 - 3 Total 26 22 48 37 85
GROSS MARGIN(PhP) <0 6 2 8 18 26 0<5,000 1 1 2 5 7 5,000<10,000 3 4 7 6 13 10,000<15,000 2 - 2 2 4 15,000<20,000 1 4 5 1 6 20,000<25,000 1 3 4 - 4 25,000<30,000 4 1 5 1 6 >30,000 8 7 15 4 19 Total 26 22 48 37 85

42
Appendix Table 4. Comparative performance between flood plains, broad plains and hilly lands (Percentage)
ITEM
TOPOGRAPHY (percentage)
Flood PlainBroad Plain
Plain Subtotal Hilly/Rolling Land Total
YIELD (kg)
0<1,000 2 1 4 8 12 1,000<2,000 1 1 2 12 14 2,000<3,000 8 4 12 8 20 3,000<4,000 7 5 12 - 12 4,000<5,000 - 8 8 2 11 5,000<6,000 6 - 6 1 7 >6,000 2 6 8 2 11 Total 27 25 52 34 86
GROSS SALES (PhP) <10,000 2 1 4 8 12 10,000<20,000 2 1 4 12 15 20,000<30,000 7 5 12 8 20 30,000<40,000 7 5 12 - 12 40,000<50,000 4 7 11 2 13 50,000<60,000 2 1 4 1 5 60,000<70,000 1 1 2 - 2 70,000<80,000 1 2 4 1 5 >80,000 - 1 1 1 2 Total 27 25 52 34 86
COST(PhP) <5,000 1 - 1 1 2 5,000<10,000 8 2 11 7 18 10,000<15,000 11 9 20 19 39 15,000<20,000 7 6 13 13 26 20,000<25,000 2 5 7 2 9 25,000<30,000 1 1 1 2 >30,000 1 2 4 - 4 Total 31 26 56 44 100
GROSS MARGIN (PhP) <0 7 2 9 21 31 0<5,000 1 1 2 6 8 5,000<10,000 4 5 8 7 15 10,000<15,000 2 - 2 2 5 15,000<20,000 1 5 6 1 7 20,000<25,000 1 4 5 - 5 25,000<30,000 5 1 6 1 7 >30,000 9 8 18 5 22 Total 31 26 56 44 100

43
Appendix Table 5. Cross Tabulation of Frequencies (Yield Range/Gross Sales/Cost/Gross Margin) vs. Farm Size
Range FARM SIZE (Ha)
<0.5 0.5<0.9 1 1.5 2 2<2.5 2.5<3 3<4 4<5 5<10 >10 Total YIELD(Kg)
0<1000 1 - 1 - 1 1 1 - 1 2 2 10 1000<2000 - - 4 3 2 - - - 1 2 - 12 2000<3000 - 1 2 3 4 - 3 1 2 1 - 17 3000<4000 3 1 2 1 - - 1 - - 1 1 10 4000<5000 1 1 1 - - - 2 2 1 1 - 9 5000<6000 - - - 2 1 - 1 - 1 1 - 6 >6000 2 1 2 - 1 1 1 - - 1 - 9 TOTAL 7 4 12 9 9 2 9 3 6 9 3 73
GROSS SALES(PhP) <10000 1 0 1 0 1 1 1 0 1 2 2 10 10000<20000 0 0 4 3 3 0 0 0 1 2 0 13 20000<30000 0 1 2 3 3 0 3 1 2 2 0 17 30000<40000 4 1 2 1 0 0 1 0 0 0 1 10 40000<50000 0 1 1 2 0 0 2 2 2 1 0 11 50000<60000 0 0 0 0 1 0 1 0 0 2 0 4 60000<70000 0 0 1 0 0 1 0 0 0 0 0 2 70000<80000 2 0 0 0 1 0 1 0 0 0 0 4 >80000 0 1 1 0 0 0 0 0 0 0 0 2 TOTAL 7 4 12 9 9 2 9 3 6 9 3 73
COST(PhP) 0<5000 1 - - - - - - - - - 1 2 5000<10000 2 - 4 2 2 1 1 - 1 2 - 15 10000<15000 3 1 5 4 2 2 6 2 3 5 - 33 15000<20000 1 - 3 2 2 1 3 2 3 2 3 22 20000<25000 - 2 1 2 2 - - 1 - - - 8 25000<30000 - - - - - - - - - 2 - 2 >30000 - 1 - - 1 1 - - - - - 3 TOTAL 7 4 13 10 9 5 10 5 7 11 4 85
GROSS MARGIN(PhP) <0 1 - 2 2 3 4 2 2 2 5 3 26 0<5000 - 1 3 1 1 - - - 1 - - 7 5000<10000 - 2 2 1 - - 3 1 2 2 - 13 10000<15000 - - - 1 3 - - - - - - 4 15000<20000 - - 1 3 - - - - - 1 1 6 20000<25000 2 - - - - - - 1 1 - - 4 25000<30000 - - 2 1 - - 2 1 - - - 6 >30000 4 1 3 1 2 1 3 - 1 3 - 19 TOTAL 7 4 13 10 9 5 10 5 7 11 4 85

44
Appendix Table 6. Cross Tabulation of Percentages (Yield Range/Gross Sales/Cost/Gross Margin) vs. Farm Size
RANGE FARM SIZE (Ha)
<0.5 0.5<0.9 1 1.5 2 2<2.5 2.5<3 3<4 4<5 5<10 >10 Total YIELD(Kg)
0<1000 1 - 1 - 1 1 1 - 1 2 2 12 1000<2000 - - 5 4 2 - - - 1 2 - 14 2000<3000 - 1 2 4 5 - 4 1 2 1 - 20 3000<4000 4 1 2 1 - - 1 - - 1 1 12 4000<5000 1 1 1 - - - 2 2 1 1 - 11 5000<6000 - - - 2 1 - 1 - 1 1 - 7 >6000 2 1 2 - 1 1 1 - - 1 - 11 TOTAL 8 5 14 11 11 2 11 4 7 11 4 86
GROSS SALES(PhP) <10000 1 - 1 - 1 1 1 - 1 2 2 12 10000<20000 - - 5 4 4 - - - 1 2 - 15 20000<30000 - 1 2 4 4 - 4 1 2 2 - 20 30000<40000 5 1 2 1 - - 1 - - - 1 12 40000<50000 - 1 1 2 - - 2 2 2 1 - 13 50000<60000 - - - - 1 - 1 - - 2 - 5 60000<70000 - - 1 - - 1 - - - - - 2 70000<80000 2 - - - 1 - 1 - - - - 5 >80000 - 1 1 - - - - - - - - 2 TOTAL 8 5 14 11 11 2 11 4 7 11 4 86
COST(PhP) 0<5000 1 - - - - - - - - - 1 2 5000<10000 2 - 5 2 2 1 1 - 1 2 - 18 10000<15000 4 1 6 5 2 2 7 2 4 6 - 39 15000<20000 1 - 4 2 2 1 4 2 4 2 4 26 20000<25000 - 2 1 2 2 - - 1 - - - 9 25000<30000 - - - - - - - - - 2 - 2 >30000 - 1 - - 1 1 - - - - - 4 TOTAL 8 5 15 12 11 6 12 6 8 13 5 100
GROSS MARGIN(PhP) <0 1 - 2 2 4 5 2 2 2 6 4 31 0<5000 - 1 4 1 1 - - - 1 - - 8 5000<10000 - 2 2 1 - - 4 1 2 2 - 15 10000<15000 - - - 1 4 - - - - - - 5 15000<20000 - - 1 4 - - - - - 1 1 7 20000<25000 2 - - - - - - 1 1 - - 5 25000<30000 - - 2 1 - - 2 1 - - - 7 >30000 5 1 4 1 2 1 4 - 1 4 - 22 TOTAL 8 5 15 12 11 6 12 6 8 13 5 100
45
ANNEX 2: Survey Questionnaires
Bridging the Gap Between Seasonal Climate Forecasts and Decision Makers in Agriculture
FARM AND HOUSEHOLD SURVEY QUESTIONNAIRE
Good morning/afternoon/evening! I am ______________ from the _________________________________, and I am part of a research team conducting a research project on “Bridging the Gap Between Seasonal Climate Forecasts (SCFs) and Decision Makers in Agriculture”, which is funded by the Australian Centre for International Agricultural Research (ACIAR), and jointly implemented in the Philippines by the Philippine Institute for Development Studies (PIDS), Philippine Atmospheric and Geophysical and Astronomical Services Administration (PAGASA), and Leyte State University (LSU). This project will look into and close the gap between the potential and actual value and use of SCFs to agricultural systems and policies in the Philippines and Australia. Specifically, we would like to know about your perception and actual use of seasonal climate information in your crop production management decisions. We would also like to document the farm and household characteristics, key decisions that are influenced by climate, information on corn production for the previous cropping season and planting intention for the following season, indigenous knowledge of climate forecasting, and coping mechanisms on the impact of El Niño/La Niña on production . We would like to assure you that the information that you will reveal in this interview will be used solely for purposes of research, and that your identity as well as your answers will be treated with confidentiality. In answering the questions, please remember that there are no correct or wrong answers. We are just after your honest opinion. PART I. SOCIOECONOMIC BACKGROUND OF RESPONDENT A. Household Profile A1. Name of household head: __________________________________________________________________ (Surname) (First Name) (Middle Name) A2. Age: _________ A3. Sex: [ ] Male [ ] Female A4. Highest educational attainment: _______________ A5. Civil status: [ ] Married [ ] Single [ ] Widow(er) [ ] Separated [ ] Other (specify) _______ A6. No. of household members:_________
Name of Household members Relationship Age as of
last birthday (years)
Educational Attainment
(years) Occupation Monthly
Income
Basic Information: Name of Respondent: __________________________________ Respondent No.:_______ Village/Sitio: _______________________ Barangay: ______________________________ Municipality/City: __________________ Province: _______________________________ Date of Interview: __________________ Interviewer: _____________________________ Time Interview Started: ______________ Time Interview Ended: ____________________

46
A7. How many years have you resided in this barangay? _________ years A8. A8.1. Primary occupation (in terms of time spent) [ ] Farmer [ ] Driver [ ] Livestock raiser [ ] Housewife [ ] Carpenter [ ] Domestic helper [ ] Office worker [ ] Fisherman [ ] Vendor/trader [ ] Local government official [ ] Teacher [ ] Others (specify) ________________________________ A8.2. Secondary occupation (in terms of time spent) [ ] Farmer [ ] Driver [ ] Livestock raiser [ ] Housewife [ ] Carpenter [ ] Domestic helper [ ] Office worker [ ] Fisherman [ ] Vendor/trader [ ] Local government official [ ] Teacher [ ] Others (specify) ________________________________ B. Farm Characteristics, Farming Experience, and Land Use B1. How long have you been farming? ____________ years How long have you been planting corn? _____________ years B2. What is the total size of the land that you farm? ____________ ha B3. Do you own any of the land that you farm? [ ] Yes Go to B4 [ ] No Go to B5 B4. If yes,
B4.1. How much of the land that you farm do you own? ________ ha B4.2. Do you rent out any part of this land to others? [ ] Yes [ ] No B4.3. How much land that you farm is tenanted? _____________ ha
B5. If no, B5.1. How much land that you farm is being leased? ______________ ha
B5.2. How much of the land that you farm is being tenanted? ______________ ha B6. Including the land that you farm, please give details of all the parcels of land that you have (Use additional sheet if necessary) Are there more than 4 parcels of land? [ ] Yes [ ] No
Parcel Description Parcel 1 Parcel 2 Parcel 3 Parcel 4 1. Location: Village/Sitio Barangay City/Municipality 2. Physical Area (ha) 3. % Alienable & Disposable Land 4.1 Tenure status: 1 = fully-owned 2 = tenanted 3 = rented/leased 4 = held under Certificate of Land Transfer
(CLT)/Certificate of Land Ownership Award (CLOA)
5 = owner-like possession other than CLT/CLOA 6 = others (specify)
4.2 If rented/leased, please specify rental arrangement 1 = If share-tenancy, specify sharing
arrangement 2 = If fixed-rent tenancy, specify amount 3 = Without actual rent 4 = Others (specify)

47
5. Land Type 1 = River/flood plain (lower/upper vega) 2 = Broad plain 3 = Hilly/rolling
6. Dominant slope 1 = 0-5% (level to gently sloping) 2 = 6-15% (sloping to rolling) 3 = 16-25% (slightly rolling to moderately
steep) 4 = 26-45% (steep to hilly) 5 ≥ 45% (very steep)
7. Have observed soil erosion? (Y/N) Yes No Yes No Yes No Yes No 7.1 If yes, specify the degree of soil
erosion 1 = Mild 2 = Moderate 3 = Severe
7.2 If yes, have you applied erosion control measures? (Y/N)
If yes, describe type If no, why?
Yes No ____________ ____________ ____________
Yes No ____________ ____________ ____________
Yes No ____________ ____________ ____________
Yes No ____________ ____________ ____________
7.3 If yes, specify source of soil conservation measures
1 = NA; 2 = Self; 3 = ISF (Integrated Social Forestry); 4 = IRRI (International Rice Research Institute); 5 = ICRAF (International Centre for Research in Agroforestry); 6 = Farmer leader;
7 = Other farmers; 8 = Others (specify)
B7. In the preceding 6 months (i.e., previous cropping season), please estimate land use share (%) for each parcel.
Land Use Parcel 1 Parcel 2 Parcel 3 Parcel 4 Corn Lowland rice Upland rice Cassava Sweet potato Vegetable (specify) Fruit trees (specify) Fallow (natural or improved) Pasture/grazing Others (specify)
C. Perception, Awareness and Use of Seasonal Climate Information C1. Do you think that weather/climate is a factor that you take into consideration in your planning and crop production
decision making? [ ] Yes [ ] No If yes, how significant is its value or contribution to your farming enterprise? [ ] low [ ] medium [ ] high If no, why not? ________________________________________________________________________ C2. Do you think advanced information on seasonal climate will aid your production decisions? [ ] Yes [ ] No

48
If yes, how? __________________________________________________________________________ If no, why not? ________________________________________________________________________ C3. What is your source of information about the weather/climate? (Ask respondent to enumerate as many as possible) [ ] Radio [ ] PAGASA station [ ] Television [ ] Local beliefs or indigenous knowledge [ ] Newspapers (broadsheets) [ ] Co-farmer [ ] Newspapers (Tabloid) [ ] Others (specify) ________________________ [ ] Extension worker C4. Are you satisfied with climate-related information provided by your source? [ ] Yes [ ] No C4.1. Do they give adequate information? [ ] Yes [ ] No C4.1.1. What specific climate-related information do you need that your source cannot deliver, if any? __________________________________________________________________________ C4.2. Do they give correct information? [ ] Yes [ ] No If yes, how? _____________________________________________________________ If no, why not? ___________________________________________________________ C5. How relevant are the climate-related information that you get from your source in relation to making decisions
related to farming? [ ] Very relevant [ ] Moderately relevant [ ] Relevant [ ] Slightly relevant [ ] Irrelevant C6. Did you hear about the seasonal climate forecast by PAGASA? [ ] Yes [ ] No If yes, do you feel confident on such forecast? [ ] Yes [ ] No If no, why? ___________________________________________ C7. Are you aware of any of the climate information products and services of the PAGASA?
Product/Service Yes/No Usefulness Rating Reliability Rating Monthly Weather Situation and Outlook Annual Seasonal Climate Forecasts El Nino/La Nina Advisory Tropical Cyclone Warning 10-Day Regional Agri-weather and Advisories Farm Weather Forecasts and Advisories Phil Agroclimatic Review and Outlook Press Release on Significant Weather/Climate Events Phil Agri-weather Forecasts Climate Impact Assessment Bulletin for Agriculture
Usefulness rating: 1 = not useful; 2 = somewhat useful; 3 = useful; 4 = highly useful; 5 = vital Reliability rating: 1 = unreliable; 2 = somewhat reliable; 3 = reliable; 4 = excellent

49
C8. The following statements describe climate, seasonal climate forecast and its usefulness and characteristics. If you agree, disagree or uncertain on each statement, please answer “Yes”, “No”, or “I don’t know”, respectively.
Statement Yes No I don’t know
1. Climate is the average weather condition in a particular area that prevails over a particular period (e.g. season)
2. Climate is a major source of uncertainty in agricultural production 3. Seasonal climate forecasts (SCFs), which refer to forecasts made prior to the start of a
season, would guide farmers’ crop production decision making
4. SCF is an important information for crop production management decision. 5. Accurate SCF has the potential to reduce the uncertainty brought about by climate
variability and risk
6. SCF should not be taken into account when making decisions in crop production. 7. SCF is useful because it allow us to know the amount and onset of rain in the next
season.
8. SCF may help in predicting the likelihood of an impending disaster like mudslide, flood or drought
C9. Farmer’s perceptions on various aspects of climate-related information C9.1. Rainfall reliability
[ ] unreliable (1) [ ] somewhat unreliable (2) [ ] reliable (3) [ ] somewhat reliable (4) [ ] very reliable (5)
C9.2. Frequency of droughts
[ ] drought occurs every 2 years (1) [ ] drought occurs every 5 years (2) [ ] drought occurs every 10 years (3) [ ] drought occurs every 15 years (4) [ ] drought occurs every 20 years (5)
C9.3. Impact of seasonal rainfall on crop production
[ ] minimal (1) [ ] low impact (2) [ ] medium (3) [ ] major or high (4)
Note: Figures in parentheses represent the choices’ codes.
D. Farmers’ Attitudes Toward Risk D1. Based on your knowledge and using 12 pieces of stones, please indicate your prediction about the likelihood of
rainfall event in the coming season by piling them into three groups, where each group represents a particular climate state [above normal (A), normal (N) or below normal (B)]. The number of stones in each group represents your prediction about the likelihood of rainfall event in the coming season this year.
Climate State Prediction (No. of Stones) Probability
Above normal (A) Normal (N) Below normal (B)

50
D2. Please indicate which yield forecast type do you prefer for each season? [ ] A low yield forecast for the coming season but with 100% certainty. [ ] A high yield forecast for the coming season but only a 50/50 chance of obtaining it. D3. The following statements describe farmers’ attitudes toward risk. If you agree, disagree or uncertain on each
statement, please answer “Yes”, “No”, or “I don’t know”, respectively.
Statement Yes No I don’t know
1. I will risk the possibility of crop failure due to seasonal variability for a chance to earn more.
2. I will not gamble with my crop given an unfavorable seasonal forecast. 3. I prefer to have a conservative harvest but with a reliable seasonal forecast.
E. Key Production Decisions Influenced by Climate E1. What influences your crop production decisions? [ ] capital [ ] cost of inputs (seeds, fertilizers, pesticides, etc.) [ ] selling price of produce [ ] climate information [ ] others (specify) ______________________________________ E2. What kind of key decisions in your farm production activities are usually affected by climate variability and
disturbances? [ ] crop to plant [ ] timing of planting [ ] amount of money used for acquisition of certain inputs, etc. [ ] others (specify) ______________________________________
E3. What kind of key decisions in your farm production activities are usually affected by seasonal climate forecast
information? [ ] crop to plant [ ] timing of planting [ ] amount of money used for acquisition of certain inputs, etc. [ ] others (specify) ______________________________________
E4. What key decisions in your corn production are influenced by seasonal climate forecast information? [ ] corn variety to plant [ ] levels of production input applied [ ] others (specify) _______________________________________
E5. In the context of your corn production decisions, please rate the importance of the following seasonal climate
forecast information.
Climate Forecast Information Rank Start date for the rainy season Amount of rainfall in the area End date or duration of the rainy season Estimated number of days of rainfall for the season Others (specify)

51
F. Farmers’ Indigenous Knowledge of Climate Forecasting F1. Do you have any signs if the season is expected to be abnormally dry or wet? [ ] Yes [ ] No If yes, please identify _______________________________________________ _________________________________________________________________ F2. Do you watch out for any special signs when commencing the following farm operations?
Operation Indicators/Signs 1. Land Preparation
2. Planting
3. Harvesting
4. Special activities (i.e., flood or drought mitigation) Please specify _______________________ _______________________ _______________________ _______________________ _______________________ _______________________
F3. Do you have certain beliefs that determine whether it is good luck or bad luck to start land
preparation/planting/harvesting/etc. at a particular time of the season? [ ] Yes [ ] No If yes, please identify ________________________________________________ _________________________________________________________________ F4. How reliable is your traditional method of forecasting seasonal climate condition? [ ] unreliable [ ] reliable [ ] very reliable

52
G. Mitigation Measures and Risk Coping Mechanisms of Farmers G1. Do you have any measures taken or implemented to minimize losses due to weather disturbances such as drought,
flood, and typhoon?
Weather Disturbance
Mitigating Measures Indigenous Modern Technology
Drought
Flood
Typhoon
G2. Have you ever experienced crop failure? [ ] Yes [ ] No If yes, what strategy do you usually practice to cope with the said failure? __________________________________________________________________________ G3. Are there any existing government/non-government programs related to corn? (i.e., technology support, credit, etc.) G4. Do you avail of crop insurance?

53
H. Input Data for Farm/Field Decision Models H1. Actual planting (previous cropping seasons)
H1.1. Please give details of your corn production for the previous cropping seasons. Item Parcel 1 Parcel 2 Parcel 3 Parcel 4
For the last wet (May-July 2005) cropping season: 1. Start of planting 2. Area planted (ha) to corn 3. Corn variety used 4. Date of harvesting 5. Qty. grain harvested (kg) For the previous/dry (Sept.-Dec. 2005) cropping season:
1. Start of planting 2. Area planted (ha) to corn 3. Corn variety used 4. Method of land cultivation a/ 5. Planting method b/ 6. Planting distribution c/ 7. Row spacing (cm) 8. Row direction, degrees from North (optional) 9. Planting depth (cm) 10. Soil Type (optional) 11. Weed control d/ 12.1. Pest/disease problem e/ 12.2 . Control measure applied f/ 13.1. Use inorganic fertilizer? (Y/N) 13.2. If yes, specify kind of fertilizer and method of
application
14.1. Apply animal manure? (Y/N). 14.2. If yes, specify source
15. Apply green manure? (Y/N) 16. Return crop residues? (Y/N) 17. Hired labor/carabao or cattle? (Y/N) 18. Date of harvesting 19. Qty. grain harvested (kg) 19.1. Qty. sold (kg) 19.2. Qty. reserved for seed next cropping 19.3. Qty. stored for home consumption 19.4. Qty. given, if there is any 20. Place of sale g/ 21. Price received for the corn sold (PhP/kg) 22. Cost of transport for qty. sold (PhP) 23. Total receipts/revenues received
a/ 1 = Zero tillage; 2 = Burning; 3 = Clearing; 4 = Up and down plowing; 5 = Straight plowing; 6 = Contour plowing; 7 = Other (specify) b/ 1 = Dry seed; 2 = Nursery; 3 = Pre-germinated seed; 4 = Ratoon; 5 = Transplants; 6 = Other (specify) c/ 1 = Hills; 2 = Rows; 3 = Uniform/broadcast; 4 = Other (specify) d/ 1 = None; 2 = Handweeding; 3 = Hoe; 4 = Plowing; 5 = Other (specify) e/ 1 = None; 2 = Slight; 3 = Moderate; 4 = Severe f/ 1 = None; 2 = Chemical spray; 3 = Botanical control; 4 = Physical control; 5 = Combination; 6 = Other (specify) g/ 1= Barangay; 2 = Town; c = Nearby City (specify)

54
H1.2. Using your largest corn parcel, please estimate the labor utilized in your corn production for the
previous/dry (Sept.-Dec. 2005) cropping season. . (Parcel No.: __________ Area: _________ ha)
Operation Man-Day (MD) Man-Animal-Day (MAD) Animal-Day (AD) FL HL BL FL HL BL
Land preparation • Plowing (Ploughing) • Clearing • Furrowing Corn sowing Fertilizer application at planting Replanting Fertilizer application Interrow weeding Hand weeding Pest control Other crop care (specify) Harvesting of corn Post-harvest processing FL = Family labor; HL = Hired labor; BL = Bayanihan labor
H1.3. Please give details of the wages for each operation for the previous/dry (Sept.-Dec. 2005) cropping season.
Item Wage/Unit How much did you pay for farm labor? (PhP/MD) Please estimate the value of food, cigarettes and other incidentals that are provided to hired labor (PhP/MD)
What wage would you expect to earn working on other farms? (PhP/MD) How much did you pay for a cow or carabao with operator for one day? (PhP/MAD) How much did you pay for a cow or carabao only for one day? (PhP/AD)

H1.4. Using the largest corn parcel, please estimate the cost of inputs for corn production for the previous/dry (Sept.-Dec. 2005) cropping season..
(Parcel No.: __________ Area: _________ ha)
Input Price/Unit
Qty. Used
Total Qty.
Purchased
Month Purchased
Place of Purchased
Total Transport Cost of
Purchasing Inputs
(back and forth)
Total Cost (PhP)
Cash or
Credit
Source of Input
Seed (kg) Urea (46-0-0), kg Complete (14-14-14), kg Ammonium Sulphate(21-0-0), kg Ammonium Phosphate(16-20-0), kg
Solophos (0-18-0), kg Muriate of Potash (0-0-50), kg Animal manure (kg) Other fertilizer, kg (specify) Pesticide, liter (specify) Herbicide, liter (specify) Other inputs (specify)
H2. Planting intention (present/next wet cropping season)
H2.1. Do you intend to plant corn on your farm anytime next cropping season? [ ] Yes [ ] No (Skip this subsection)
H2.2. Corn variety(ies) to be planted and expected date of planting and harvesting: (Use additional sheet if necessary)
Item Parcel 1 Parcel 2 Parcel 3 Parcel 4
1. Corn variety(ies) to be planted 2. Expected date of sowing/planting corn 3. Area to be planted 4. Expected date of harvesting
THANK YOU FOR COOPERATION!!!

56
FARM AND HOUSEHOLD SURVEY QUESTIONNAIRE
Magandang umaga/tanghali/gabi! Ako ay si ________________ mula sa Surian sa mga Pag-aaral Pangkaunlaran ng Pilipinas (Philippine Institute for Development Studies o PIDS) at ako ay bahagi ng pangkat ng mga mananaliksik na kasalukuyang nagsasagawa ng isang pag-aaral tungkol sa kahalagahan ng paggamit ng pana-panahong abiso sa klima (seasonal climate forecast o SCF) sa pagsasaka. Ang proyektong ito ay may titulong “Bridging the gap between seasonal climate forecast and decision makers in agriculture” na isinasakatuparan ng tatlong institusyon sa Pilipinas – ang PIDS, Philippine Atmospheric and Geophysical and Astronomical Services Administration (PAGASA) at Leyte State University (LSU). Ang proyektong ito ay naglalayong sumuri at mag-ugnay sa aktuwal at maaaring halaga ng paggamit ng SCF sa mga pang-agrikulturang sistema at patakaran sa Pilipinas at Australya. Ang mga tiyak na layunin ng proyektong ito ay ang pag-alam sa mga pananaw at aktuwal na paggamit ng SCF ng mga nagtatanim ng mais sa kanilang mga desisyon sa pagsasaka at pagtala ng mga sumusunod na impormasyon: detalye ng kanilang pagsasaka at sambahayan, pangunahing desisyon sa pagsasaka na naaapektuhan ng klima o panahon, mga impormasyon tungkol sa pagsasaka ng mais noong mga nakalipas na taniman at mga balak sa darating o kasalukuyang taniman, mga sinauna at katutubong kaalaman ukol sa abiso sa klima, at mga pamamaraan upang maibsan ang epekto ng El Niño/La Niña. Nais naming tiyakin sa inyo na ang mga impormasyong aming makakalap sa panayam na ito ay gagamitin lamang sa proyektong ito at ang inyong mga kasagutan ay mananatiling lihim/pribado. Sa pagsagot sa mga katanungan, tandaan lamang na walang tama o maling kasagutan Ang nais lamang namin ay ang inyong tapat na opinion sa mga ito. PART I. SOCIOECONOMIC BACKGROUND OF RESPONDENT B. Detalye ng Sambahayan A1. Puno ng sambahayan: __________________________________________________________________ (Apelyido) (Pangalan) (M. I.) A2. Edad: _________ A3. Kasarian: [ ] Lalaki [ ] Babae A4. Pinakamataas na pinag-aralan: _______________ A5. Katayuang sibil: [ ] May asawa [ ] Walang asawa [ ] Balo [ ] Hiwalay A6. Bilang ng kasama sa bahay:_________
Pangalan ng kasama sa bahay Relasyon Edad Pinakamataas na pinag-aralan Trabaho Buwanang
kita
Bridging the Gap Between Seasonal Climate Forecasts and Decision Makers in Agriculture
Pangalan: __________________________________ Bilang:_______ Sitio: _______________________ Barangay: _______________________________ Munisipyo: __________________ Probinsya: _______________________________ Petsa ng Panayam: _______________ Tagapanayam: ____________________________ Simula ng panayam: ______________ Katapusan ng panayam: ____________________

57 A7. Ilang taon na kayong naninirahan sa barangay? _________ taon A8. A8.1. Pangunahing hanapbuhay [ ] Magsasaka [ ] Drayber/namamasada [ ] Tagapag-aalaga ng hayop [ ] Katulong [ ] Karpintero [ ] Empleyado [ ] Mangingisda [ ] Tindero [ ] Opisyal ng gobyerno [ ] Guro [ ] Iba pa ________________________________ A8.2. Iba pang hanapbuhay [ ] Magsasaka [ ] Drayber/namamasada [ ] Tagapag-aalaga ng hayop [ ] Katulong [ ] Karpintero [ ] Empleyado [ ] Mangingisda [ ] Tindero [ ] Opisyal ng gobyerno [ ] Guro [ ] Iba pa ________________________________ B. Detalye/Karanasan sa Pagsasaka at Gamit ng Lupa B1. Ilang taon na kayong nagsasaka? ____________ taon Ilang taon na kayong nagtatanim ng mais? _____________ taon B2. Gaano kalaki ang inyong lupang sinasaka? ____________ ektarya B3. Pag-aari ninyo ba ang lupa? [ ] Oo [ ] Hindi B4. Kung oo,
B4.1. Ilang ektarya ang sarili ninyong pag-aari? ________ ektarya B4.2. Nagpapaupa ba kayo ng lupa sa iba? [ ] Oo [ ] Hindi B4.3. Ilang ektarya ang inuupahan ng iba? _____________ ektarya
B5. Kung hindi, B5.1. Ilang ektarya ang inuupahan? ______________ ektarya
B5.2. Ilang ektarya and kasaka kayo? ______________ ektarya B6. Magbigay ng detalye tungkol sa lupang inyong sinasaka Ilang lote/lupa/parsela ang inyong sinasaka?
Deskripsyon ng Lote/Lupa/Parsela Parsela 1 Parsela 2 Parsela 3 Parsela 4 1. Lugar: Sitio Barangay Munisipyo 2. Laki ng Sakahan (ektarya) 3. % ng lupa na hindi ginagamit 4.1 Estado ng tenure ng lupa: 1 = Pag-aari 2 = Kasaka 3 = Inuupahan 4 = Iba pa
4.2 Kung inuupahan, 1 = Kung kasaka, paano ang hatian sa kita? 2 = Kung inuupahan, magkano ang upa? 3 = Walang upa 4 = Iba pa
5. Katangian ng lupa 1 = River/flood plain (lower/upper vega) 2 = Broad plain 3 = Hilly/rolling
6. Dominanteng katangian ng lupa 1 = 0-5% (level to gently sloping); patag 2 = 6-15% (sloping to rolling); medyo dahilig 3 = 16-25% (slightly rolling to moderately
steep); dahilig 4 = 26-45% (steep to hilly); medyo matarik 5 ≥ 45% (very steep); matarik

587. Nakaranas na ba kayo ng pagka-agnas ng lupa o erosyon? Kung oo, sagutin ang mga sumusunod:
Oo Hindi
Oo Hindi
Oo Hindi
Oo Hindi
7.1 Gaano katindi ang erosyon? 1 = Mahina 2 = Katamtaman 3 = Sobra
7.2 Gumamit na ba kayo ng mga pamamaraan upang makontrol ang erosyon?
Kung oo, anu-ano? Kung hindi, bakit?
Oo Hindi
____________ ____________ ____________
Oo Hindi
____________ ____________ ____________
Oo Hindi
____________ ____________ ____________
Oo Hindi
____________ ____________ ____________
7.3 Saan ninyo natutunan ang mga pamamaraan na nabanggit?
1 = Sarili; 2 = ISF (Integrated Social Forestry); 3 = IRRI (International Rice Research Institute); 4 = ICRAF (International Centre for Research in Agroforestry); 5 = Farmer leader;
6 = Kapwa magsasaka; 7 = Iba pa
B6. Sa nakaraang anim na buwan, ibigay ang porsiyento ng gamit sa lupa.
Gamit sa lupa Parsela 1 Parsela 2 Parsela 3 Parsela 4 Mais Palay Kamoteng kahoy Kamoteng bagin Gulay Prutas Bakante (fallow) Pastulan Iba pa _________________
C. Pananaw, Kaalaman at Paggamit ng Impormasyon sa Pana-panahong Abiso sa Klima C1. Ang lagay ng panahon o klima ba ay isinasaalang-alang ninyo sa pagpa-plano at pagde-desisyon ukol sa pagsasaka? [ ] Oo [ ] Hindi Kung oo, gaano ka-importante ito sa inyong kabuhayan/pagsasaka? [ ] mababa [ ] katamtamam [ ] mataas Kung hindi, bakit? ________________________________________________________________________ C2. Makakatulong ba ang maagang impormasyon sa panahon sa inyong pagde-desisyon? [ ] Oo [ ] Hindi Kung oo, paano? __________________________________________________________________________ Kung hindi, bakit? ________________________________________________________________________ C3. Anu-ano ang inyong pinagkukunan ng impormasyon tungkol sa klima/panahon? [ ] Radyo [ ] Istasyon ng PAGASA [ ] Telebisyon [ ] Mga sinauna at katutubong paniniwala/kaalaman

59 [ ] Pahayagan [ ] Kapwa magsasaka [ ] Technician [ ] Iba pa ________________________ C4. Kuntento ba kayo sa impormasyong natatangap? [ ] Oo [ ] Hindi C4.1. Sapat ba ang ibinibigay nilang impormasyon? [ ] Oo [ ] Hindi C4.1.1. Ano pang impormasyon tungkol sa klima o lagay ng panahon ang kailangan ninyo? __________________________________________________________________________ C4.2. Tama ba ang impormasyong inyong natatanggap? [ ] Oo [ ] Hindi Kung oo, paano? _____________________________________________________________ Kung hindi, bakit? ___________________________________________________________ C5. Gaano kahalaga ang natatanggap ninyong impormasyon sa klima pagdating sa pagde-desisyon sa pagsasaka? [ ] napaka-halaga [ ] medyo mahalaga [ ] mahalaga [ ] konting halaga [ ] hindi mahalaga C6. Narinig ninyo na ba ang abiso ng PAGASA tungkol sa Pana-panahong Abiso sa Klima (SCF) tulad ng El Niño at
La Niña? [ ] Oo [ ] Hindi Kung oo, tiwala ba kayo sa ganitong abiso? [ ] Oo [ ] Hindi Kung hindi, bakit? ___________________________________________ C7. Alam ninyo ba ang mga sumusunod na produkto o serbisyo ng PAGASA?
Produkto/Serbisyo Oo/Hindi Usefulness Rating Reliability Rating Monthly Weather Situation and Outlook Annual Seasonal Climate Forecasts El Nino/La Nina Advisory Tropical Cyclone Warning 10-Day Regional Agri-weather and Advisories Farm Weather Forecasts and Advisories Phil Agroclimatic Review and Outlook Press Release on Significant Weather/Climate Events Phil Agri-weather Forecasts Climate Impact Assessment Bulletin for Agriculture
Usefulness rating: 1 = not useful; 2 = somewhat useful; 3 = useful; 4 = highly useful; 5 = vital Reliability rating: 1 = unreliable; 2 = somewhat reliable; 3 = reliable; 4 = excellent C8. Sagutin kung sang-ayon, hindi sang-ayon o hindi alam ang sumusunod na mga pangungusap.
Pangungusap Oo Hindi Hindi alam
Ang klima ang pangkalahatan at pang-matagalang tema ng panahon sa isang lugar. Ang klima ay sanhi ng di-kasiguraduhan sa pagsasaka. Ang Pana-panahong Abiso sa Klima (SCF) ay maaaring magsilbing gabay sa pagde-desisyon ukol sa pagtatanim at pagsasaka.
Ang Pana-panahong Abiso sa Klima (SCF) ay mahalagang impormasyon para sa mga desisyon ukol sa pangangasiwa ng mga tanim.
Ang tamang abiso sa panahon ay makababawas ng agam-agam dulot ng pabago-bagong lagay panahon.
Hindi dapat isaalang-alang ang abiso sa panahon sa mga desisyon sa pagtatanim/pagsasaka. Ang Pana-panahong Abiso sa Klima (SCF) ay mahalaga dahil ipinaaalam nito kung kailan ang simula at gaano kadami ang darating na ulan sa tag-araw/tag-ulan.

60
Pangungusap Oo Hindi Hindi alam
Ang Pana-panahong Abiso sa Klima (SCF) ay makakatulong upang malaman kung maaaring magkaroon ng sakuna tulad ng pagguho ng lupa, baha o tag-tuyot.
C9. Pananaw ng magsasaka sa impormasyon tungkol sa klima o lagay ng panahon C9.1. Maaasahan ba ang buhos ng ulan noong nakaraang taniman
[ ] di-maaasahan [ ] medyo hindi maasahan [ ] maasahan [ ] medyo maasahan [ ] talagang maaasahan
C9.2. Limit o dalas ng tag-tuyot
[ ] Nagkakaroon ng tag-tuyot tuwing 2 taon [ ] Nagkakaroon ng tag-tuyot tuwing 5 taon [ ] Nagkakaroon ng tag-tuyot tuwing 10 taon [ ] Nagkakaroon ng tag-tuyot tuwing 15 taon [ ] Nagkakaroon ng tag-tuyot tuwing 20 taon
C9.3. Epekto ng panahunang pag-ulan sa pagtatanim
[ ] mahina [ ] medyo mahina [ ] katamtaman [ ] matindi
D. Farmers’ Attitudes Toward Risk D1. Sa inyong kaalaman at tantiya, ano ang magiging tema ng panahon ngayong darating na tag-ulan? Gamit ang 12 na
bato, itaya kung ang limit at dami ng ulan ay magiging normal (N), mababa sa normal (B) o mataas sa normal (A)
Lagay ng Panahon o Klima
Prediksyon (Bilang ng mga bato) Probabilidad
Mataas sa normal (A) Normal (N) Mababa sa normal (B)
D2. Ano ang inyong pipiliin? [ ] Mababa o katamtamang ani pero sigurado. [ ] May posibilidad na malaking ani depende sa lagay ng panahon. D3. Sagutin kung sang-ayon, hindi sang-ayon o hindi alam ang mga sumusunod:
Pangungusap Oo Hindi Hindi alam
Tatanggapin ko ang posibilidad na masira ang pananim dahil sa pabago-bagong panahon kung ang kapalit ay mas malaking kita.
Hindi na ako magtatanim kung hindi maganda ang abiso sa darating na panahon. Mas gusto ko ang konserbatibong o katamtamang ani basta maaasahan ang abiso sa panahon.

61 E. Mga Pangunahing Desisyon sa Pagtatanim/Pagsasaka na Naaapektuhan ng Klima o Lagay ng Panahon E1. Anu-ano ang mga isinasaalang-alang ninyo sa inyong mga desisyon sa pagtatanim? [ ] kapital/pondo [ ] gastos sa binhi, abono at pamatay-peste [ ] presyo ng mais [ ] impormasyon sa klima o lagay ng panahon [ ] iba pa ______________________________________ E2. Anu-ano ang mga pangunahing desisyon sa pagsasaka ang apektado ng pabago-bagong panahon?
[ ] klase ng itatanim [ ] kailan magtatanim [ ] kapital/pondo na ilalaan [ ] iba pa______________________________________
E3. Anu-ano ang mga pangunahing desisyon sa pagsasaka ang apektado ng pana-panahong abiso sa klima?
[ ] klase ng itatanim [ ] kailan magtatanim [ ] kapital/ pondo na ilalaan [ ] iba pa ______________________________________
E4. Anu-ano ang mga pangunahing desisyon sa pagtatanim ng mais ang apektado ng pana-panahong abiso sa klima? [ ] binhi/barayti ng mais na itatanim [ ] dami ng inputs na gagamitin [ ] iba pa _______________________________________
E5. Base sa inyong mga desisyon sa pagtatanim ng mais, pagsunud-sunurin o i-ranggo ang mga sumusunod na
impormasyon sa pana-panahong abiso sa klima ayon sa kanilang importansya o kahalagahan.
Impormasyon sa Pana-panahong Abiso sa Klima Ranggo Umpisang petsa ng tag-ulan Dami ng ulan sa isang lugar Katapusan o haba ng tag-ulan Tantiyang bilang ng araw ng ulan Iba pa
F. Mga Sinauna at Katutubong Kaalaman ng mga Magsasaka Ukol sa Abiso sa Klima F1. Mayroon ba kayong mga palatandaan/hudyat/senyales upang masabi na mas magiging tuyo o maulan ang darating
na panahon? [ ] Oo [ ] Hindi Kung oo, anu-ano ang mga ito? ___________________________________________________________________ _________________________________________________________________ F2. Mayroon ba kayong tinitingnan na palatandaan/hudyat/senyales bago simulan ang mga sumusunod na operasyon sa
pagsasaka?
Operasyon sa Pagsasaka Palatandaan/Hudyat/Senyales 1. Pagbubungkal ng lupa
2. Pagtatanim
3. Pag-aani

62
4. Iba pang mga operasyon _______________________ _______________________ _______________________ _______________________
F3. Mayroon ba kayong mga pamahiin o paniniwala na nagsasabing malas o suwerte na mag-araro, magtanim o mag-
ani? [ ] Oo [ ] Hindi Kung oo, anu-ano ang mga ito? ___________________________________________________________________ _________________________________________________________________ F4. Gaano maaasahan ang inyong tradisyunal na mga paraan ng pagtaya ng panahon? [ ] hindi maaasahan [ ] maaasahan [ ] talagang maaasahan G. Mitigation Measures and Risk Coping Mechanisms of Farmers G1. Mayroon ba kayong ginagawang mga pamamaraan upang maibsan ang masamang epekto ng bagyo, baha at tag-
tuyot?
Kalamidad Mitigating Measures Sinauna at mga Katutubong Kaalaman Makabagong Teknolohiya
Tag-tuyot
Baha
Bagyo
G2. Naranasan na ba ninyo na masiraan ng pananim? [ ] Oo [ ] Hindi Kung oo, ano ang inyong ginawa upang malampasan ito? __________________________________________________________________________ G3. Mayroon bang mga programa ang pamahalaan na tumutulong sa mga nagtatanim ng mais? (i.e., suportang
panteknolohiya, kredit o suportang pinansyal, atbp.) G4. Mayroon ba kayong crop insurance?

63H. Input Data for Farm/Field Decision Models H1. Pagtatanim noong mga nakalipas na taniman
H1.1. Ibigay ang mga detalye tungkol sa inyong pagsasaka ng mais noong mga nakalipas na taniman. Item Parsela 1 Parsela 2 Parsela 3 Parsela 4
Nakalipas na tag-ulan (May-July 2005): 1. Umpisa ng pagtatanim 2. Ektarya ng lupang tinaniman ng mais 3. Binhi/barayti ng mais na ginamit 4. Petsa ng Ani 5. Bilang ng ani (kilo) Nakalipas na taniman o tag-araw (Sept.-Dec.
2005):
1. Umpisa ng pagtatanim 2. Ektarya ng lupang tinaniman ng mais 3. Binhi/barayti ng mais na ginamit 4. Paraan ng pagbungkal ng lupa a/ 5. Paraan ng pagtanim b/ 6. Distribusyon ng pagtatanim c/ 7. Agwat ng mga row (sentimetro) 8. Row direction, degrees from North (opsyunal) 9. Lalim ng tanim (sentimetro) 10. Klase ng lupa (opsyunal) 11. Pagdadamo d/ 12.1. Problema sa peste at sakit e/ 12.2 . Pagkontrol na ginamit f/ 13.1. Gumamit ng inorganic na abono? (Oo/Hindi) 13.2. Kung oo, ano ang uri ng abono at
pamamaraan na ginamit?
14.1. Naglagay ng dumi ng hayop? (Oo/Hindi) 14.2. Kung oo, saan galling?
15. Pag-araro sa lupa ng legumbre? (Oo/Hindi) 16. Ibinabalik ba ang pinaganihan sa lupa?
(Oo/Hindi)
17. Umupa ng patrabaho o hayop? (Oo/Hindi) 18. Petsa ng ani 19. Bilang ng ani (kilo) 19.1. Bilang ng naibenta (kilo) 19.2. Dami ng pangbinhi para sa susunod na
taniman
19.3. Dami ng pangkain 19.4. Dami ng ipinamigay 20. Lugar ng benta g/ 21. Presyo ng ibinentang mais (PhP/kg) 22. Gastos sa pagbiyahe ng produkto (PhP) 23. Kabuuang kita
a/ 1 = Zero tillage (hindi pagbubungkal); 2 = Burning (pagsunog); 3 = Clearing (pagtabas o linis); 4 = Up and down plowing; 5 = Straight plowing; 6 = Contour plowing; 7 = Other (iba pa)
b/ 1 = Dry seed (diretsong tanim); 2 = Nursery (punla); 3 = Pre-germinated seed (pagpapasibol); 4 = Ratoon; 5 = Transplants (lipat-tanim); 6 = Others (iba pa)
c/ 1 = Hills (tudling); 2 = Rows (pagitan ng tudling); 3 = Uniform/broadcast (sabog); 4 = Other (iba pa) d/ 1 = None (wala); 2 = Handweeding (pagbunot ng damo); 3 = Hoe; 4 = Plowing (pag-araro); 5 = Other (iba pa) e/ 1 = None (wala); 2 = Slight (mahina); 3 = Moderate (katamtaman); 4 = Severe (matindi) f/ 1 = None (wala); 2 = Chemical spray (kemikal); 3 = Biological control (bayolohikal/paggamit ng ibang halaman at
insekto); 4 = Physical control (pisikal na pagtanggal); 5 = Combination (kombinasyon); 6 = Others (iba pa) g/ 1= Barangay; 2 = Town (bayan); c = Nearby City (Kalapit na lungsod/siyudad)

64
H1.2. Base sa pinakamalaking lote ng lupa na inyong sinasaka, estimahin ang dami ng patrabaho (labor) na inyong kinailangan sa pagtatanim ng mais.
. (Bilang ng parsela: __________ Ektarya: __________)
Operasyon Man-Day (MD) Man-Animal-Day (MAD) Animal-Day (AD) FL HL BL FL HL BL
Pagbubungkal ng lupa • Plowing (Pag-aararo) • Clearing (Paglilinis) • Harrowing (Pagsuyod) • Furrowing (Pagtutudling) Pagtatanim ng mais Paglalagay ng abono sa pagtatanim Pag-uulit-tanim Paglalagay ng abono Pagasampay Pagdadamo Pagkontrol sa peste Iba pang pangangalaga sa tanim Pag-ani Proseso matapos ang anihan Iba pa __________
FL = Family labor (Pamilya); HL = Hired labor (Patrabaho/upahan); BL = Bayanihan labor (Bayanihan/tulungan) H1.3. Ibigay ang halaga ng ginastos sa patrabaho (labor) noong nakaraang taniman (Sept-Dec 2005).
Item Sahod Magkano ang ibinayad ninyo sa patrabaho sa bukid? (PhP/MD) Magkano ang nagastos sa pagkain, sigarilyo atbp. habang nagpapatrabaho? (PhP/MD) Magkano ang inyong kikitain kung magtatrabaho kayo sa ibang bukid? (PhP/MD) Magkano ang ibinayad ninyo sa kalabaw at operator? (PhP/MAD) Magkano ang ibinayad ninyong renta sa kalabaw/baka? (PhP/AD)

H1.4. Gamit ang pinakamalaking lote ng lupang inyong sinasaka, estimahin ang iba pang mga gastusin sa pagtatanim ng mais.
(Bilang ng parsela: __________ Ektarya: __________)
Abono/Pestisidyo/ Iba pa
Presyo bawat unit
Dami
ng na-
gamit
Kabuuang bilang ng
binili
Buwan ng
pagbili
Lugar na pinag-bilhan
Kabuuang gastos sa transpo-
rtasyon sa pagbili ng mga inputs (balikan)
Kabuuang gastos
Cash or
Credit
Pinag-mulan
ng input
Binhi (kilo) Urea (46-0-0), kg Complete (14-14-14), kg
Ammonium Sulphate (21-0-0), kg
Ammonium Phosphate (16-20-0), kg
Solophos (0-18-0), kg
Muriate of Potash (0-0-50), kg
Dumi ng hayop (kilo)
Iba pang abono (kilo)
Pesticide/ Pamatay peste (litro)
Herbicide/Pamatay sa damo (litro)
Iba pa _______________________
H2. Balak sa darating o kasalukuyang taniman
H2.1. Magtatanim ba kayo ng mais sa darating na tag-ulan? [ ] Oo [ ] Hindi
H2.2. Klase ng binhi na itatanim at panahon ng pagtatanim at pag-aani.
Item Parsela 1 Parsela 2 Parsela 3 Parsela 4 1. Binhi na itatanim 2. Kailan magtatanim 3. Laki ng lupa na tataniman 4. Kailan mag-aani
Maraming salamat sa inyong kooperasyon!