Climate - · PDF fileclimate type is represented by a two‐to four‐letter symbol. ......
65
Climate
Transcript of Climate - · PDF fileclimate type is represented by a two‐to four‐letter symbol. ......
Climate
Content
• Climate• Parameters used for the measurement and recording of weather phenomena
• The Psychrometric Chart
Climate
• Climate is a measure of the average pattern of variation in temperature, humidity, atmospheric pressure, wind, precipitation, atmospheric particle count and other meteorological variables in a given region over long periods of time. The standard averaging period is 30 years.
• Climate is different from weather, in that weather only describes the short‐term conditions of these variables in a given region.
• Because the slopes of the earth’s axis takes on his tour of the sun does not go from pole to pole, but is tilted relative to the poles. One side will be farther from the sun (in winter), while the opposite pole will be closer and more directly oriented towards the sun (in summer).
• In cold climate zones, winter sunshine will be for less time, and the beams will fall much inclined to the ground

Climate

Climate
Northern‐winter‐solsticeNorthern‐summer‐solstice

Latitudinal variations in the annual incoming solar radiation (insolation) density and distance to the surface.
Source:Introduction to Tropical Meteorology, 2ed. COMET Program

Climate
Climate
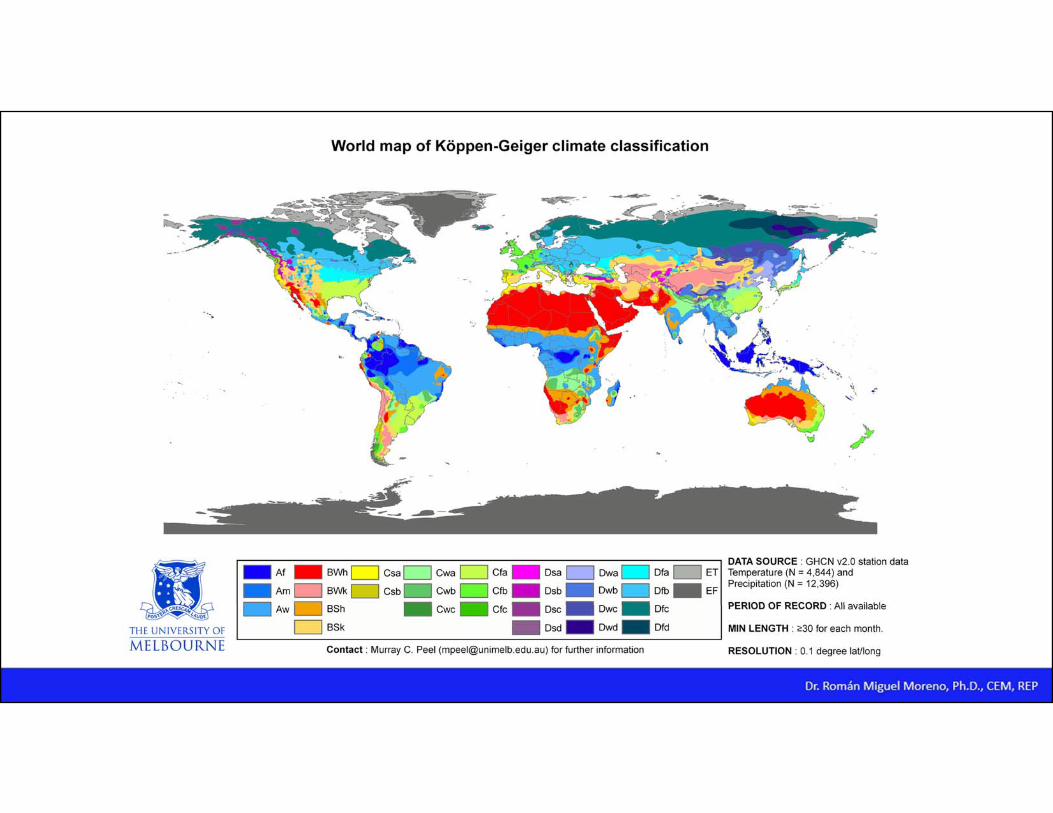
The Köppen climate classification scheme divides climates into five main groups, each having several types and subtypes. Each particular climate type is represented by a two‐ to four‐letter symbol.
• GROUP A: Tropical/megathermal climates• Tropical climates are characterized by constant high temperatures (at sea level and low elevations) — all 12 months of the year have average temperatures of 18 °C or higher.
• GROUP B: Dry (arid and semiarid) climates• These climates are characterized by actual precipitation less than a threshold value set equal to the potential evapotranspiration.
• GROUP C: Temperate/mesothermal climates• These climates have an average temperature above 10 °C (50 °F) in their warmest months (April to September in northern hemisphere), and a coldest month average between −3 and 18 °C.
Climate
• GROUP D: Continental/microthermal climates• These climates have an average temperature above 10 °C in their warmest months, and a coldest month average below −3 °C (or 0 °C in some versions, as noted previously). These usually occur in the interiors of continents and on their upper east coasts, normally north of 40°N. In the Southern Hemisphere, group D climates are extremely rare due to the smaller land masses in the middle latitudes and the almost complete absence of land at 40–60°S, existing only in some highland locations.
• GROUP E: Polar and alpine climates• These climates are characterized by average temperatures below 10 °C in all 12 months of the year.

Climate
• Macroclimate: refers to an entire region, as the region of the great forest or deserts.
• Mesoclimate: refers to a smaller area, such as caused by proximity to the mountains or the ocean.
• Microclimate: refers to that takes place in a smaller area, like the one provoked by the shadow of the trees.

Schematic of the components of the global climate system (bold), their processes and interactions (thin arrows) and some aspects that may change (bold arrows). From IPCC, 2001.

The Bretherton diagram, illustrating the components of the climate system and the interactions among them. (‘ = on timescale of hours to days; * = on timescale of months to seasons; = flux; n = concentration; SST is sea surface temperature)

Global annual mean energy balance for March 2000 to May 2004 (W m‐2).
Source:Introduction to Tropical Meteorology, 2ed. COMET Program


(a) Schematic of the temperature gradient between the warm tropics and the cold poles and the resulting pressure gradient force (at the top of the atmosphere) and atmospheric motion.
(b) Cross‐section showing the meridional circulation between the tropics and subtropics driven by heating in the equatorial regions and upward transport by deep convection in the tropics and sinking motion in the subtropics. Adapted from Simpson (1992)
Source:Introduction to Tropical Meteorology, 2ed. COMET Program

Satellite IR image at 1200 UTC on 18 Aug. 2001; the yellow line outlines the region of deep convection cloud systems responsible for most of the upward vertical transport of energy in the tropical atmosphere.
Source:Introduction to Tropical Meteorology, 2ed. COMET Program

The Tropics defined by solar declination angle. Source:Introduction to Tropical Meteorology, 2ed. COMET Program
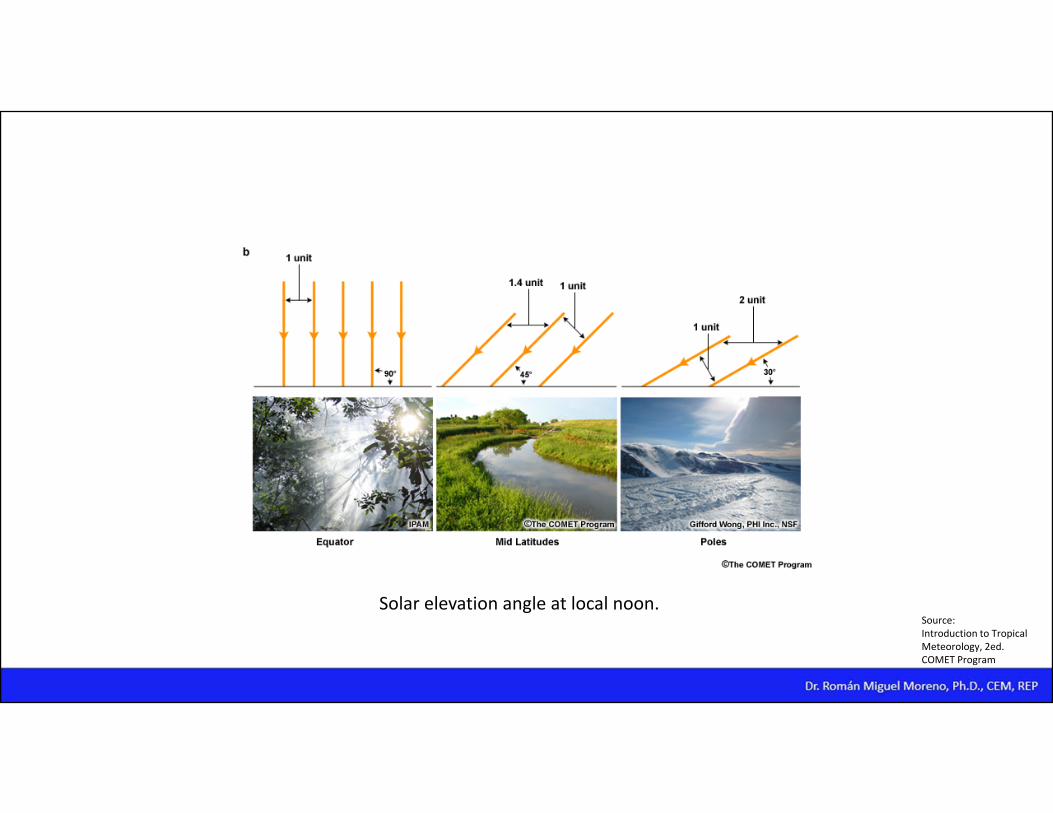
Solar elevation angle at local noon.Source:Introduction to Tropical Meteorology, 2ed. COMET Program

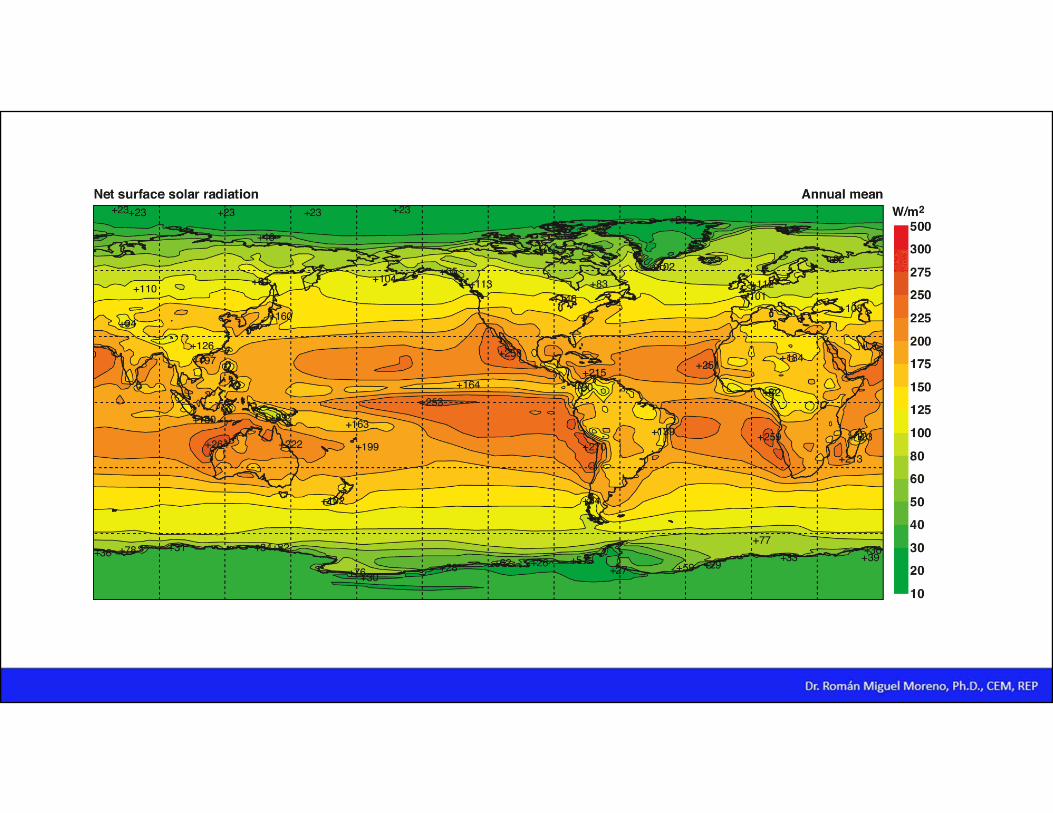
The tropics defined by net gain in radiation compared with deficits at the poles.
Source:Introduction to Tropical Meteorology, 2ed. COMET Program
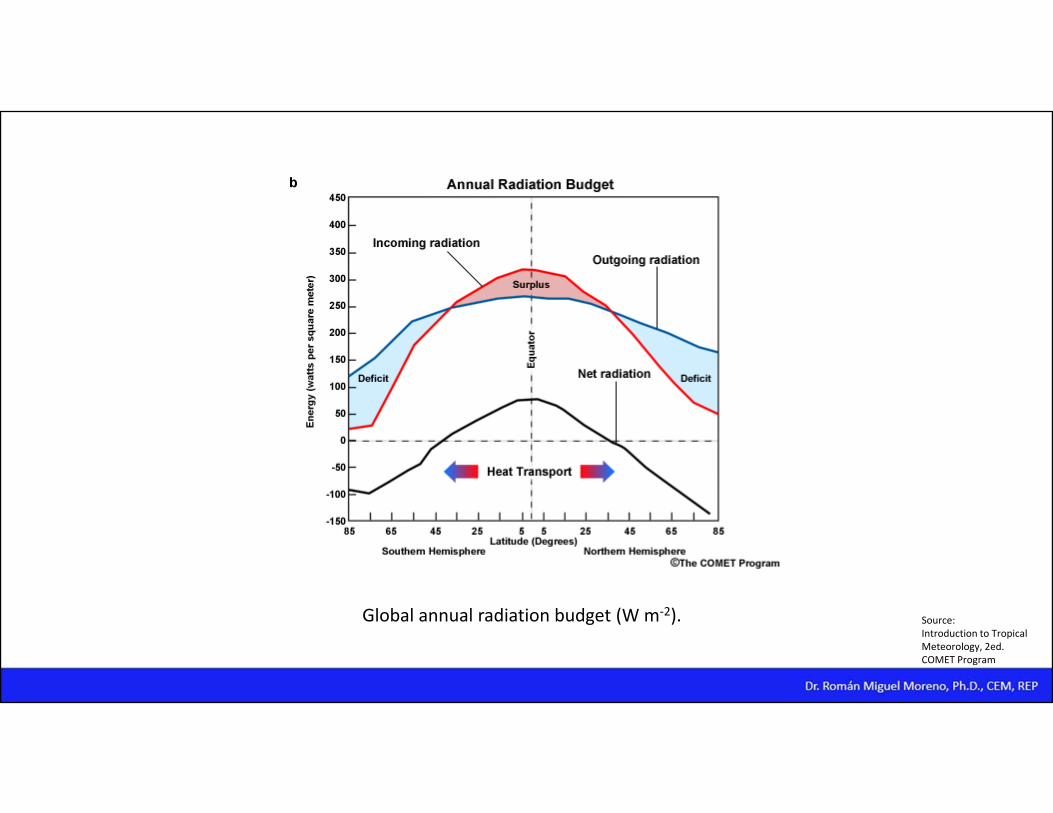
Global annual radiation budget (W m‐2). Source:Introduction to Tropical Meteorology, 2ed. COMET Program

The Tropics defined by upward motion, low pressure, surface winds, and net surface heating.
Source:Introduction to Tropical Meteorology, 2ed. COMET Program

(a) Conceptual model relating net diabatic heating and large‐scale atmospheric dynamics and(b) Simplified conceptual model relating energy, density, and large‐scale ocean dynamics.
Source:Introduction to Tropical Meteorology, 2ed. COMET Program

Source:Introduction to Tropical Meteorology, 2ed. COMET Program

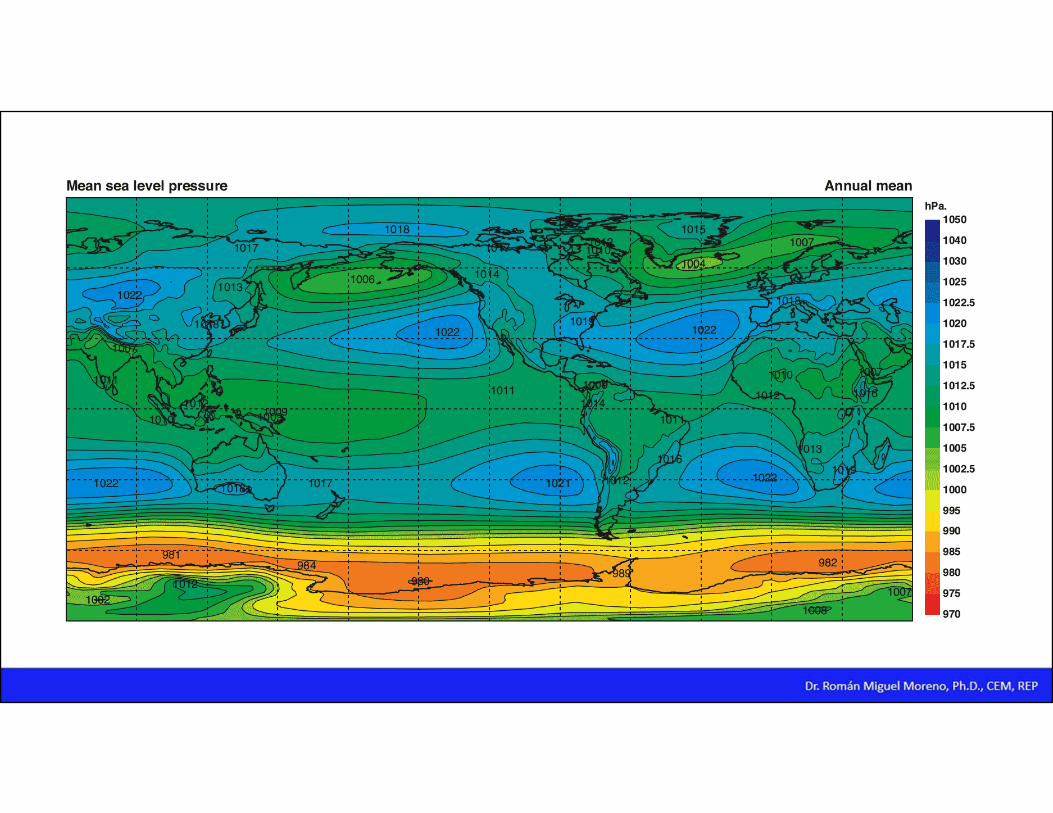
Schematic of mean sea level pressure and air flow and its relationship to stability in the troposphere for the tropical north Atlantic.
Source:Introduction to Tropical Meteorology, 2ed. COMET Program
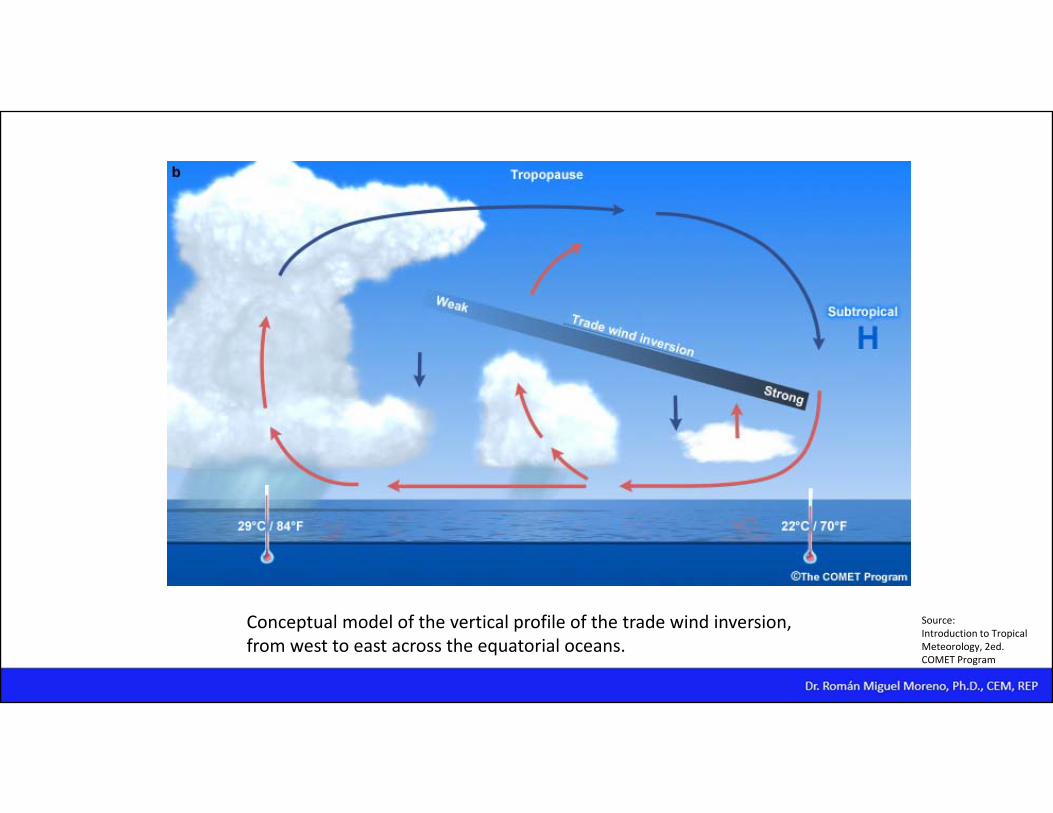
Conceptual model of the vertical profile of the trade wind inversion, from west to east across the equatorial oceans.
Source:Introduction to Tropical Meteorology, 2ed. COMET Program

(a) The distribution of surface water vapor percentage by latitude and(b) Annual mean water vapor content (specific humidity) profile. Data in (b) from Oort (1983) Source:
Introduction to Tropical Meteorology, 2ed. COMET Program

Schematic of the typical diurnal cycle of surface temperature (red) and the net energy rate due to incoming solar (black) and outgoing longwave radiation (blue).
Source:Introduction to Tropical Meteorology, 2ed. COMET Program

Temperature
• Like the annual temperature range, the diurnal temperature range varies with length of daylight hours.
• The midlatitude and the poles generally have a larger amplitude range than the tropics.
• The mean diurnal temperature range is also affected by:• Humidity. Temperature variation is more moderate in humid environments because water vapor is a good absorber and emitter of longwave radiation.
• Cloudiness. Clouds are good absorbers and emitters of long‐wave radiation and good reflectors of sunlight (shortwave radiation) therefore cloudiness leads to cooler days and warmer nights and a smaller diurnal temperature range.
• Wind speed. During windy conditions air with different temperatures is more easily mixed and helps to moderate the temperature range.
Source:Introduction to Tropical Meteorology, 2ed. COMET Program
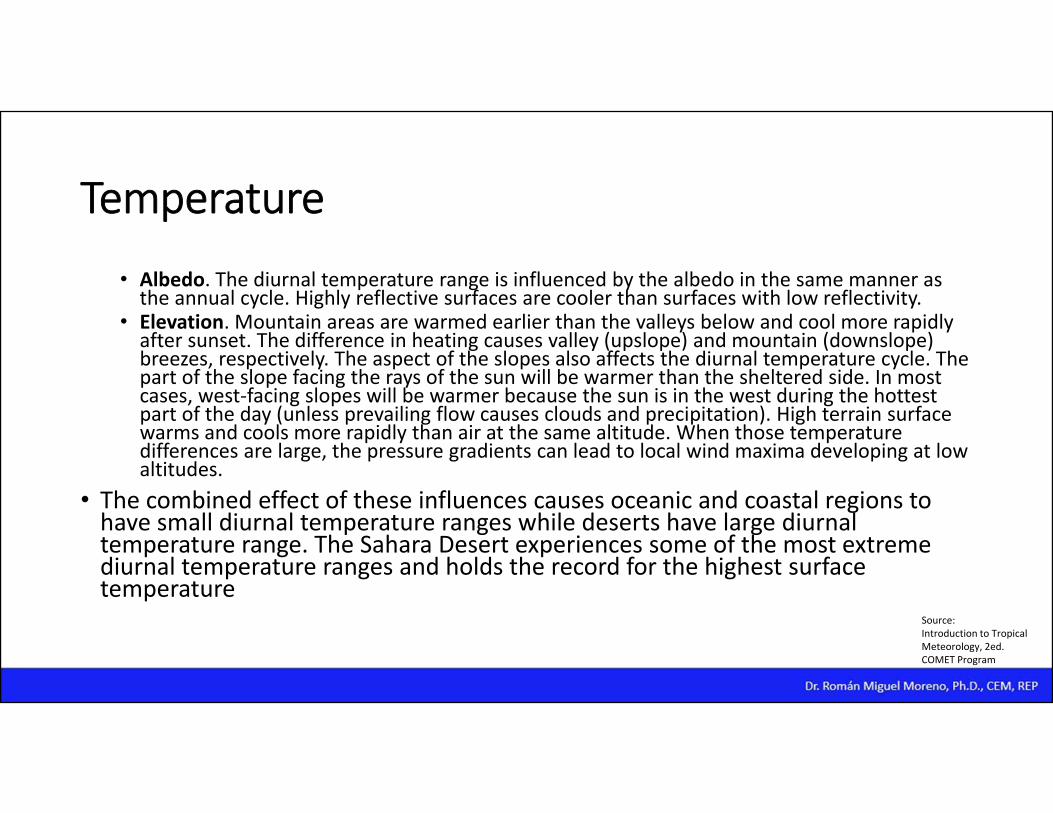
Temperature• Albedo. The diurnal temperature range is influenced by the albedo in the same manner as the annual cycle. Highly reflective surfaces are cooler than surfaces with low reflectivity.
• Elevation. Mountain areas are warmed earlier than the valleys below and cool more rapidly after sunset. The difference in heating causes valley (upslope) and mountain (downslope) breezes, respectively. The aspect of the slopes also affects the diurnal temperature cycle. The part of the slope facing the rays of the sun will be warmer than the sheltered side. In most cases, west‐facing slopes will be warmer because the sun is in the west during the hottest part of the day (unless prevailing flow causes clouds and precipitation). High terrain surface warms and cools more rapidly than air at the same altitude. When those temperature differences are large, the pressure gradients can lead to local wind maxima developing at low altitudes.
• The combined effect of these influences causes oceanic and coastal regions to have small diurnal temperature ranges while deserts have large diurnal temperature range. The Sahara Desert experiences some of the most extreme diurnal temperature ranges and holds the record for the highest surface temperature
Source:Introduction to Tropical Meteorology, 2ed. COMET Program
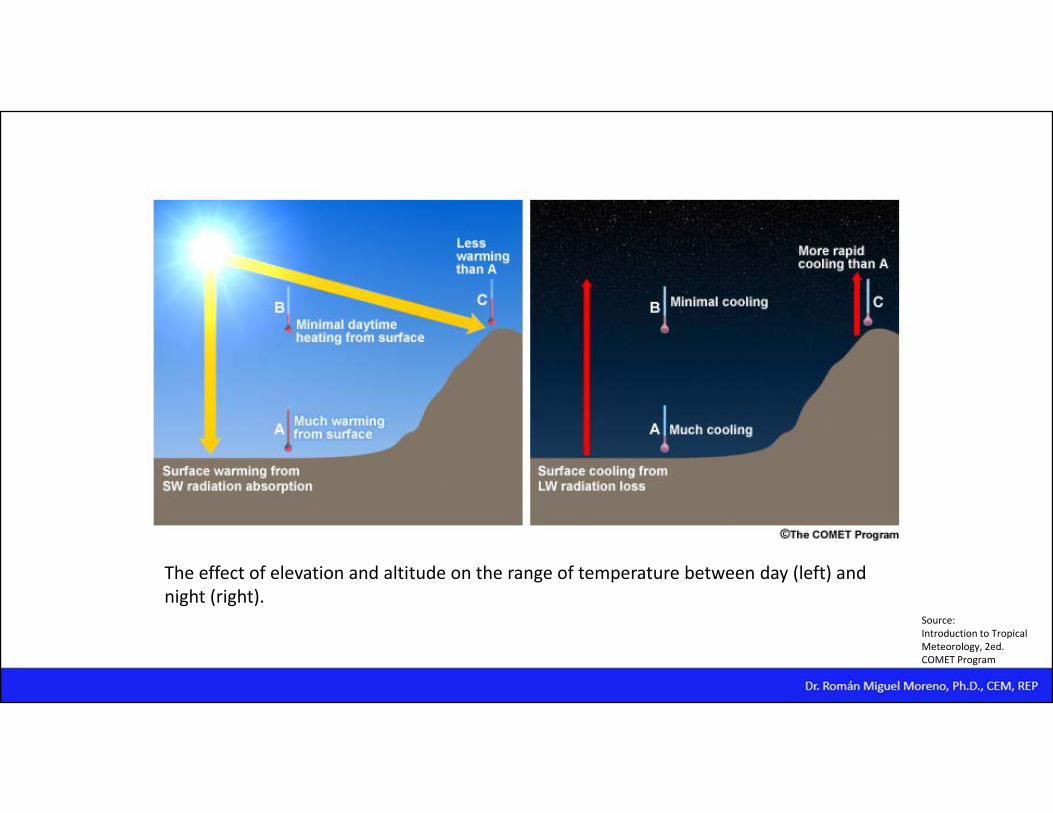
The effect of elevation and altitude on the range of temperature between day (left) and night (right).
Source:Introduction to Tropical Meteorology, 2ed. COMET Program

Moisture and Precipitation
Source:Introduction to Tropical Meteorology, 2ed. COMET Program

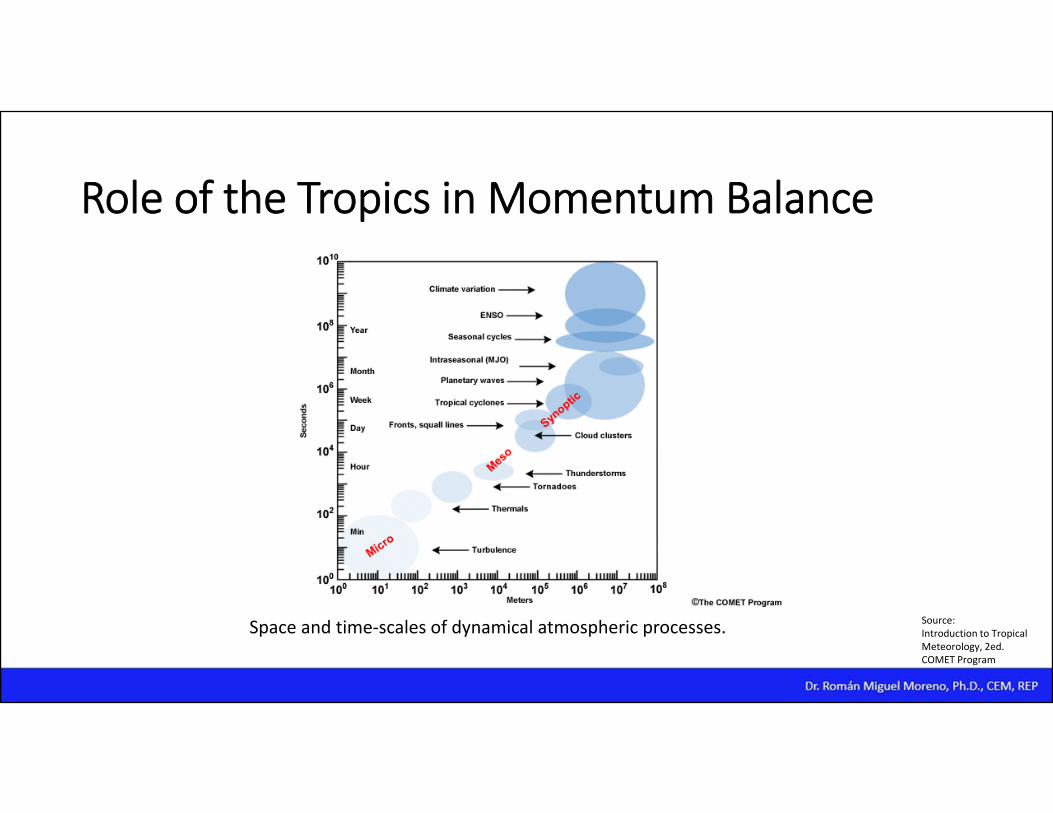
Role of the Tropics in Momentum Balance
Conceptual model of the angular momentum balance maintained by transport in the tropics and midlatitudes.
Source:Introduction to Tropical Meteorology, 2ed. COMET Program
Role of the Tropics in Momentum Balance
Source:Introduction to Tropical Meteorology, 2ed. COMET Program
Space and time‐scales of dynamical atmospheric processes.

Parameters used for the measurement and recording of weather phenomena
• Temperature• Humidity• Precipitation• Atmospheric Pressure• Wind• Insolation
Parameters used for the measurement and recording of weather phenomena
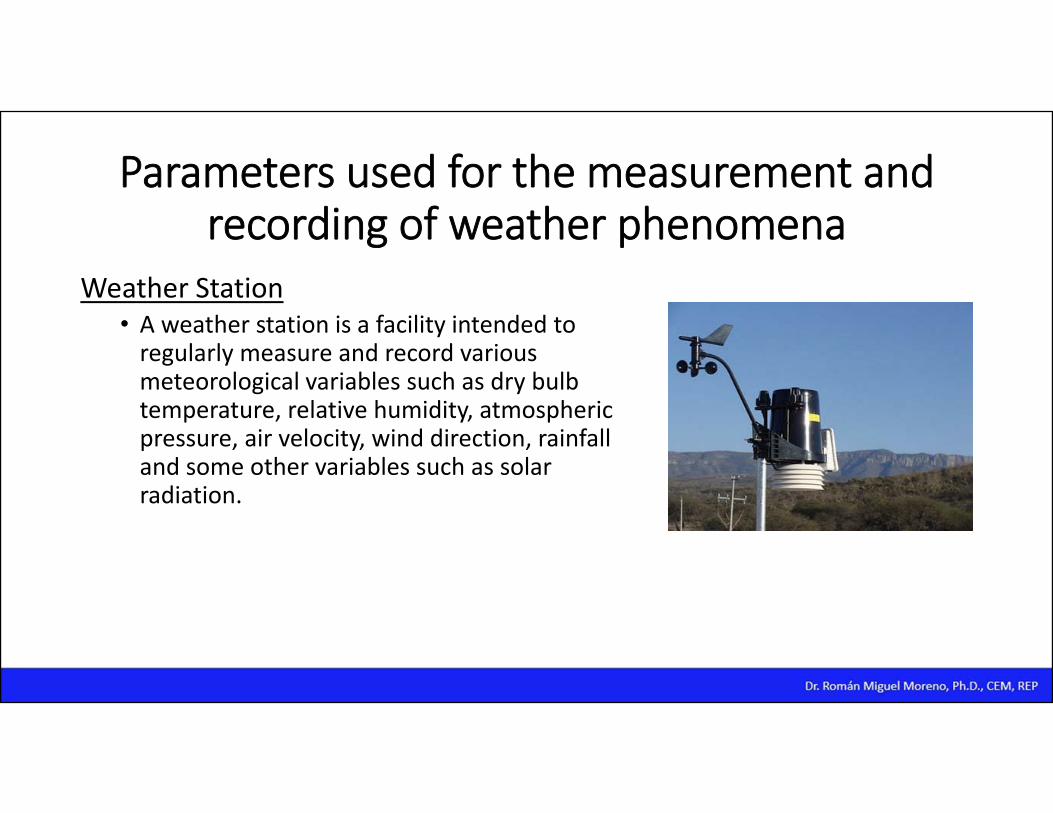
Weather Station• A weather station is a facility intended to regularly measure and record various meteorological variables such as dry bulb temperature, relative humidity, atmospheric pressure, air velocity, wind direction, rainfall and some other variables such as solar radiation.
Parameters used for the measurement and recording of weather phenomena
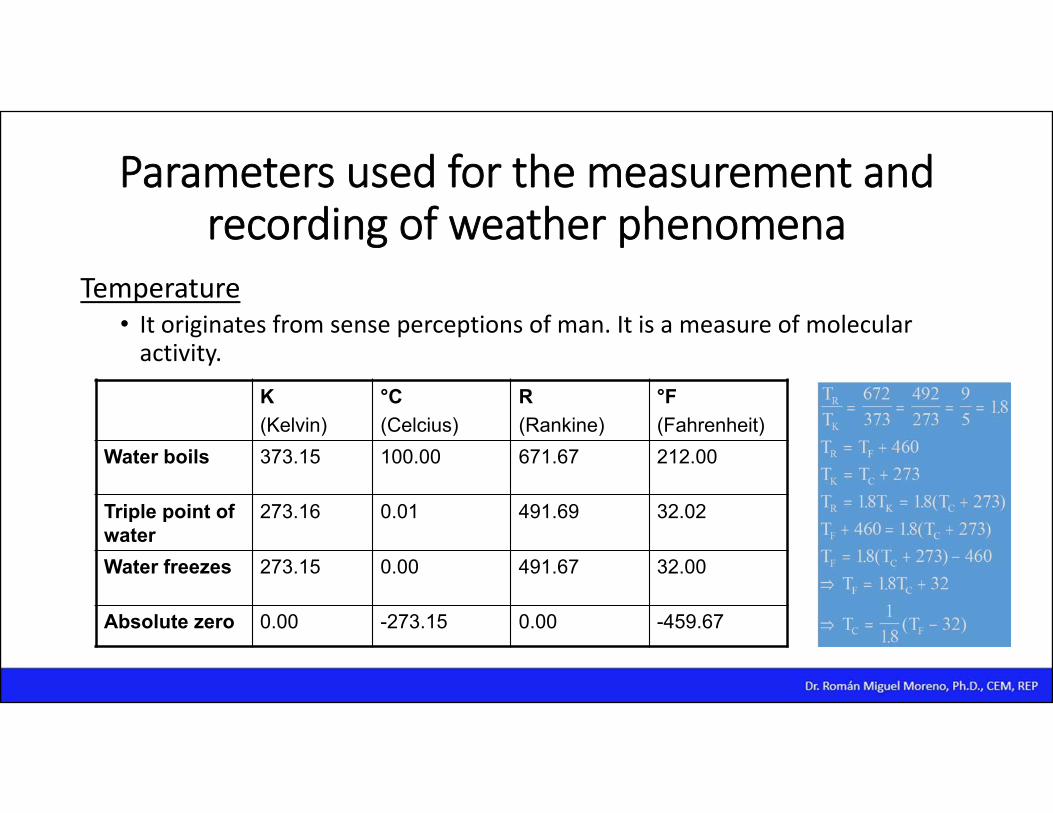
Temperature• It originates from sense perceptions of man. It is a measure of molecular activity.
K(Kelvin)
°C(Celcius)
R(Rankine)
°F(Fahrenheit)
Water boils 373.15 100.00 671.67 212.00
Triple point of water
273.16 0.01 491.69 32.02
Water freezes 273.15 0.00 491.67 32.00
Absolute zero 0.00 -273.15 0.00 -459.67

Parameters used for the measurement and recording of weather phenomena
• Temperatures:• Dry Bulb Temperature• Wet Bulb Temperature• Dew Point Temperature
Parameters used for the measurement and recording of weather phenomena
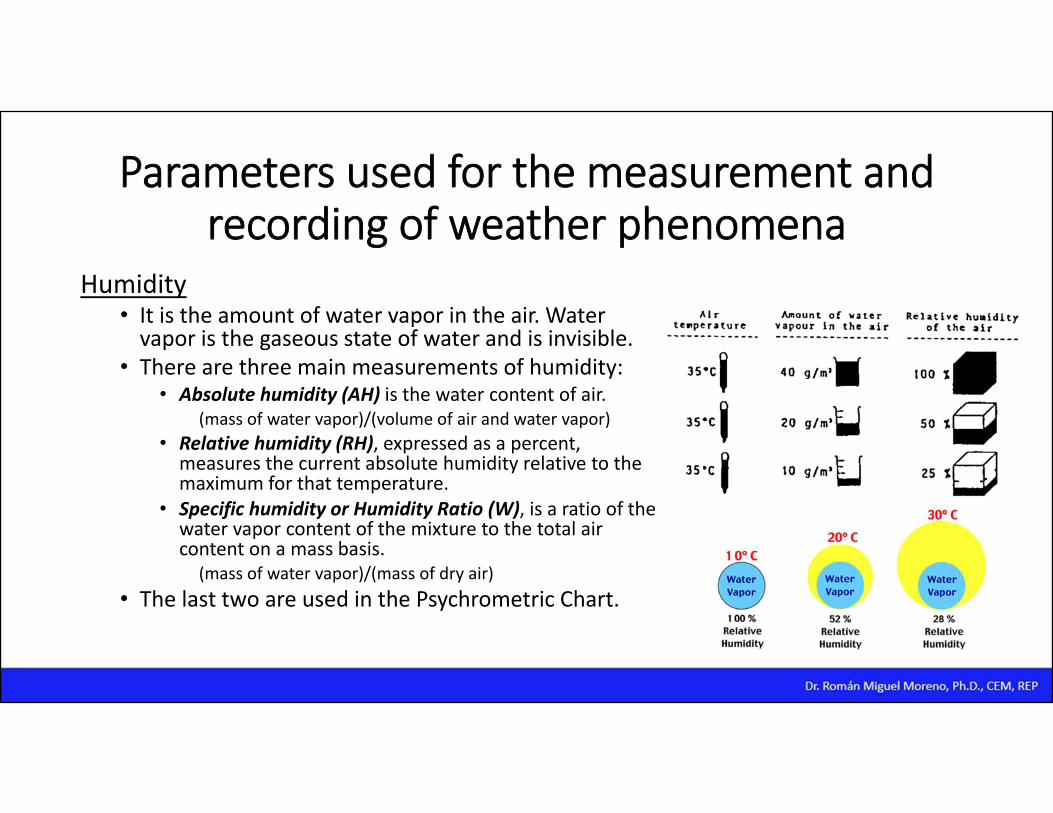
Humidity• It is the amount of water vapor in the air. Water vapor is the gaseous state of water and is invisible.
• There are three main measurements of humidity:• Absolute humidity (AH) is the water content of air.
(mass of water vapor)/(volume of air and water vapor)• Relative humidity (RH), expressed as a percent, measures the current absolute humidity relative to the maximum for that temperature.
• Specific humidity or Humidity Ratio (W), is a ratio of the water vapor content of the mixture to the total air content on a mass basis.
(mass of water vapor)/(mass of dry air)• The last two are used in the Psychrometric Chart.
Parameters used for the measurement and recording of weather phenomena
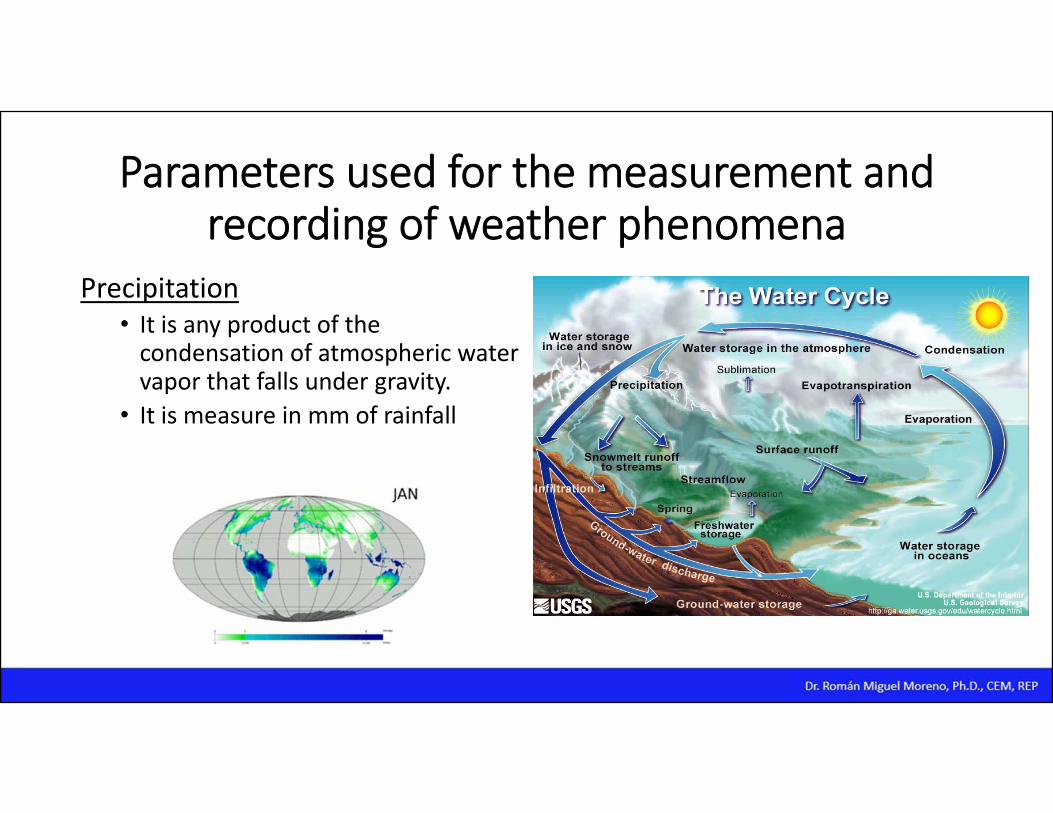
Precipitation• It is any product of the condensation of atmospheric water vapor that falls under gravity.
• It is measure in mm of rainfall
Parameters used for the measurement and recording of weather phenomena
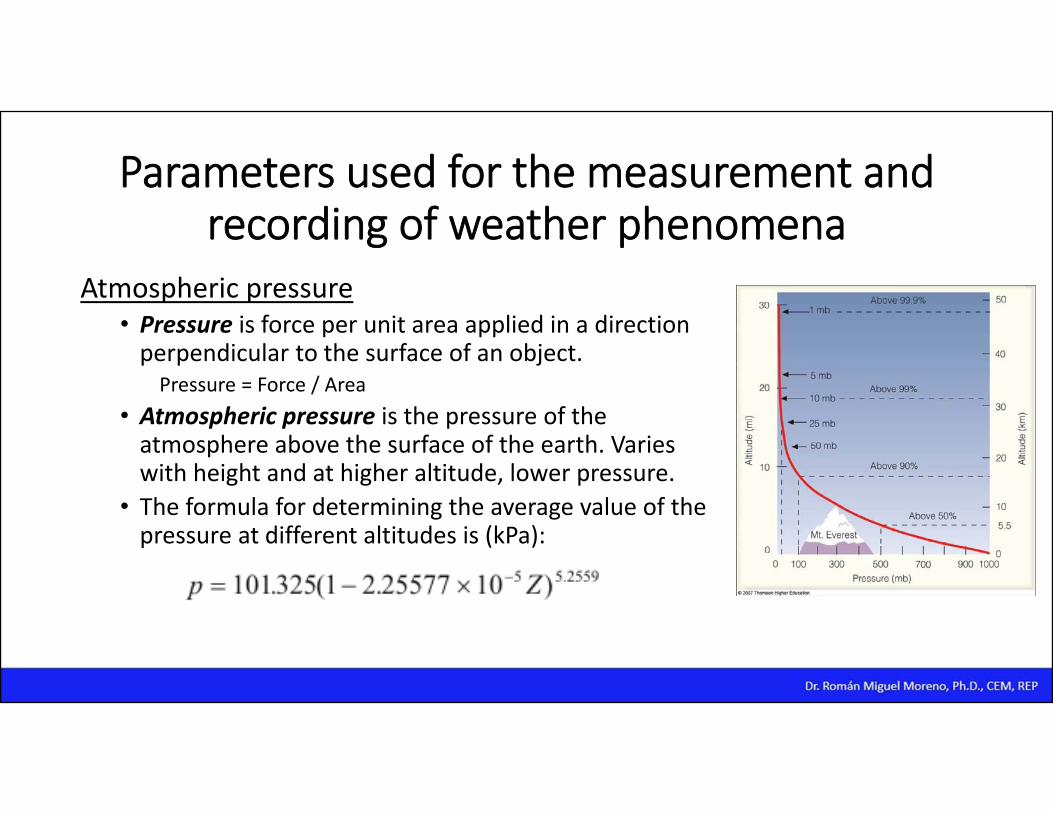
Atmospheric pressure• Pressure is force per unit area applied in a direction perpendicular to the surface of an object.Pressure = Force / Area
• Atmospheric pressure is the pressure of the atmosphere above the surface of the earth. Varies with height and at higher altitude, lower pressure.
• The formula for determining the average value of the pressure at different altitudes is (kPa):
Parameters used for the measurement and recording of weather phenomena
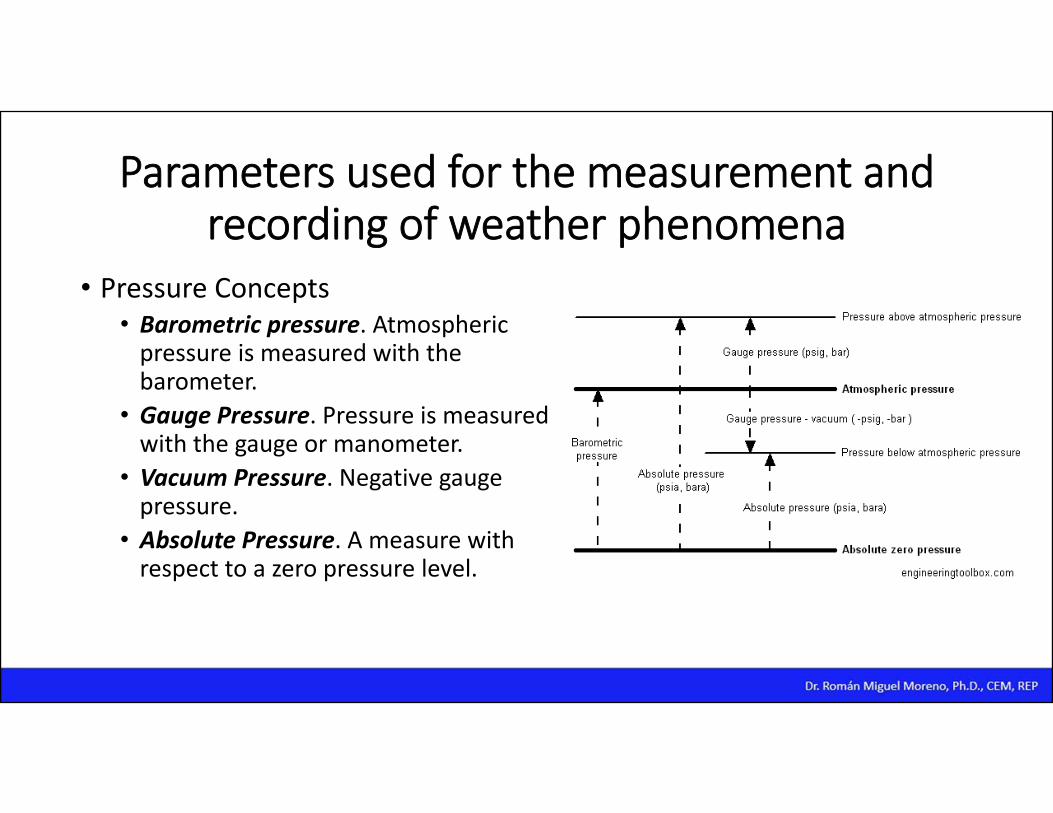
• Pressure Concepts• Barometric pressure. Atmospheric pressure is measured with the barometer.
• Gauge Pressure. Pressure is measured with the gauge or manometer.
• Vacuum Pressure. Negative gauge pressure.
• Absolute Pressure. A measure with respect to a zero pressure level.
Parameters used for the measurement and recording of weather phenomena
• Values of Average Sea Level Pressure (0°C)• 1 atm (atmosphere)• 14.696 pounds per square inch (lbf/in2)• 760 millimeters of mercury (mmHg)• 29.92 inches of mercury ("Hg) or (inHg)• 1.01325 x 10⁵ N/m2
• 1.01325 x 10⁵ Pascal (Pa)• 1.01325 bar• 1013.25 millibars (mb)

Parameters used for the measurement and recording of weather phenomena
Wind• The instruments used to measure winds are:
• Wind Speed ‐ Anemometer• Wind direction ‐ vane

Parameters used for the measurement and recording of weather phenomena
Insolation• It is the total amount of solar radiation energy received on a given surface area during a given time.
• It is also called solar irradiation and expressed as “hourly irradiation” if recorded during an hour or “daily irradiation” if recorded during a day.
• Instruments to measure solar radiation are:
Total radiation(pyranometer)
Direct radiation(pyrheliometer)
Diffuse radiation(Interruptingpath of the Sunon a pyranometer)

The Psychrometric Chart
• Dry Air• Dry air is a gas mixture having a typical volumetric analysis of 20.99% O2, 78.03% N2, 0.94% Ar, 0.03% CO2,and 0.01% H2.
• For engineering purposes, it is sufficiently accurate to consider dry air with 21% O2 and 79% inert gases taken as N2.
• The humidity in the ambient air varies according to content of water vapor in the vapor‐dry air mixture.
The Psychrometric Chart
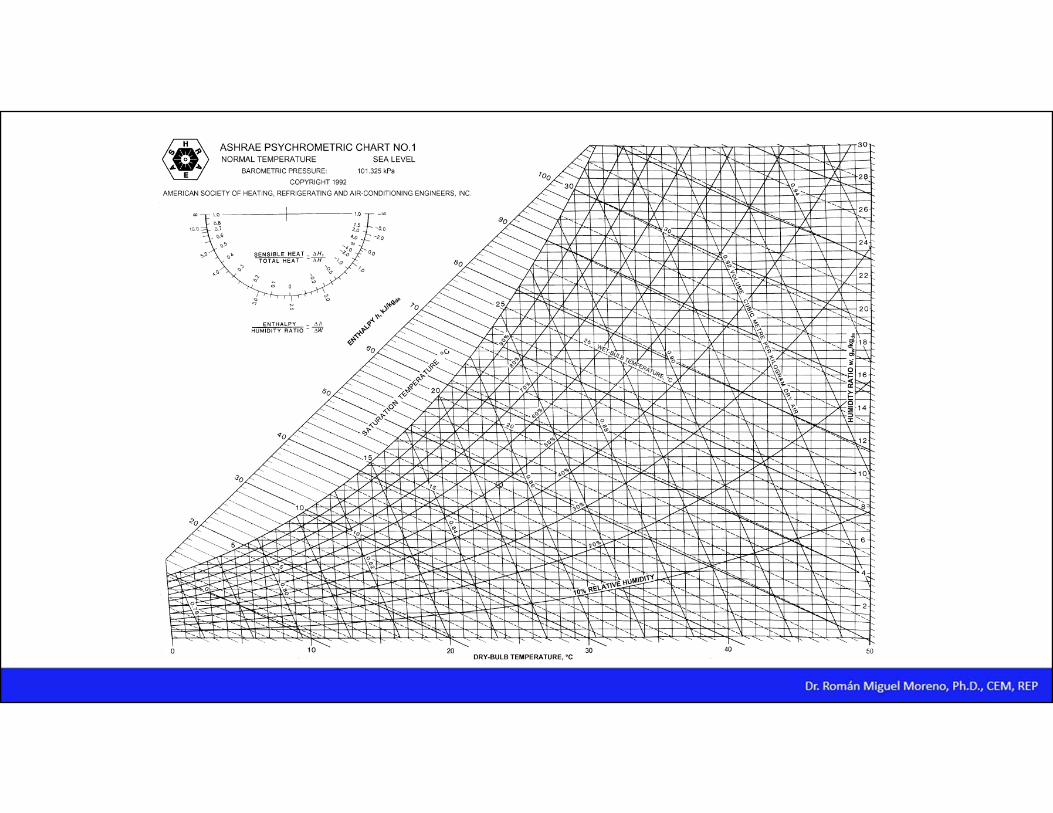
• The Psychrometric Chart • The Psychrometric Chart graphically represents the steam tables for moisture in air at conditions we encounter in HVAC work.
• The Psychrometric Chart allows complex problems to be worked out easily, and provides a feel for common HVAC processes that we are interested in.
• The standard ASHRAE Psychrometric Chart has a horizontal axis for dry bulb temperature, and a vertical axis for humidity ratio in kg of moisture per kg of dry air.
• Other parameters on the chart are: relative humidity, wet bulb temperature, enthalpy, specific volume, and saturation temperature.

The Psychrometric Chart
• Psychrometric properties:• Dry‐bulb temperature (Tdb). The dry‐bulb temperature is the temperature indicated by a thermometer exposed to the air in a place sheltered from direct solar radiation. (°C)
• Wet‐bulb temperature (Twb). The wet‐bulb temperature represents the temperature of the moisture in the air (humidity). (°C)
• Dew point temperature(Tdp). The dew point temperature is defined as the temperature at which the vapor changes into liquid (condensation). (°C)
• Relative humidity (RH). Relative humidity is the ratio of the partial pressure of water vapor in an air‐water mixture to the saturated vapor pressure of water at a prescribed temperature. (%)
• Specific Humidity or Humidity Ratio (W). Specific humidity is defined as the proportion of the mass of water vapor per unit mass of the moist air sample (dry air plus the water vapor). (ghumidity/kgdry air)

The Psychrometric Chart
• Psychrometric properties (cont.):• Specific volume (v). It is the total volume of both the dry air and water vapor per kilogram of dry air. (m3/kgda)
• Air Density (). It is the inverse of the specific volume. (kgda/m3)• Specific Enthalpy (h). It is the sum of the internal (heat) energy of the moist air in question, including the heat of the air and water vapor within. Also called heat content per unit mass. (kJ/kg)


Example
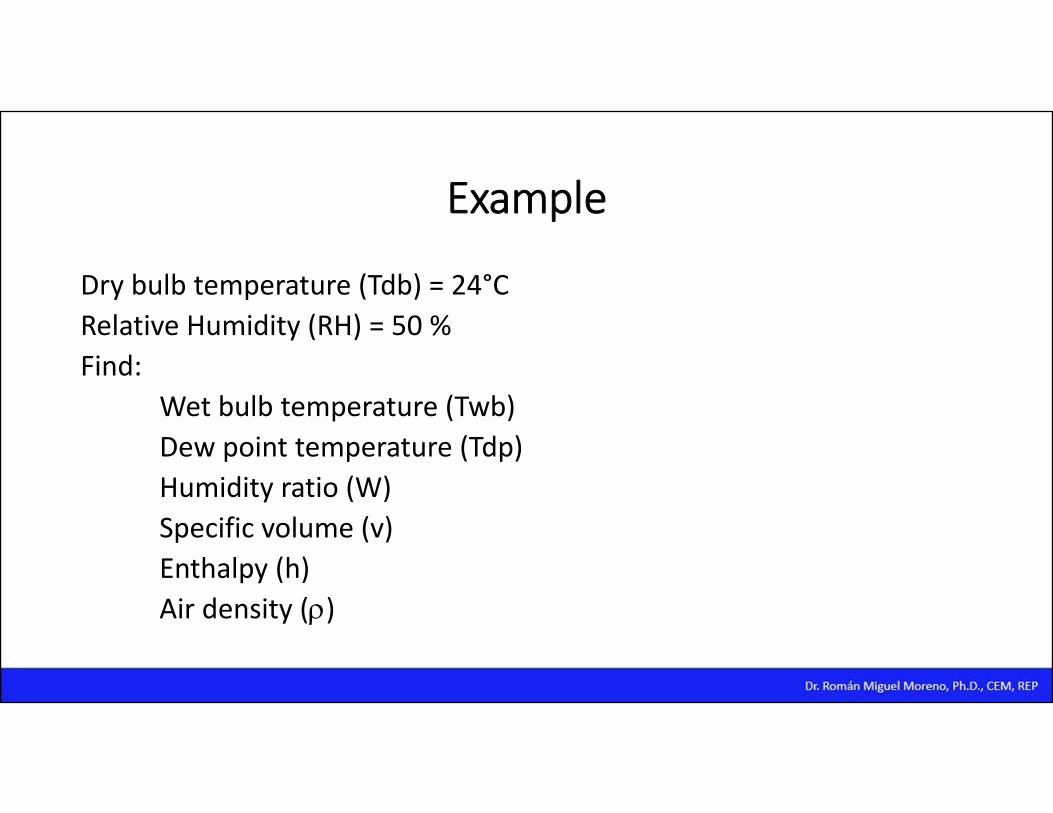
Dry bulb temperature (Tdb) = 24°CRelative Humidity (RH) = 50 %Find:
Wet bulb temperature (Twb)Dew point temperature (Tdp)Humidity ratio (W)Specific volume (v)Enthalpy (h)Air density ()

Tdb = 24°C
RH = 50 %
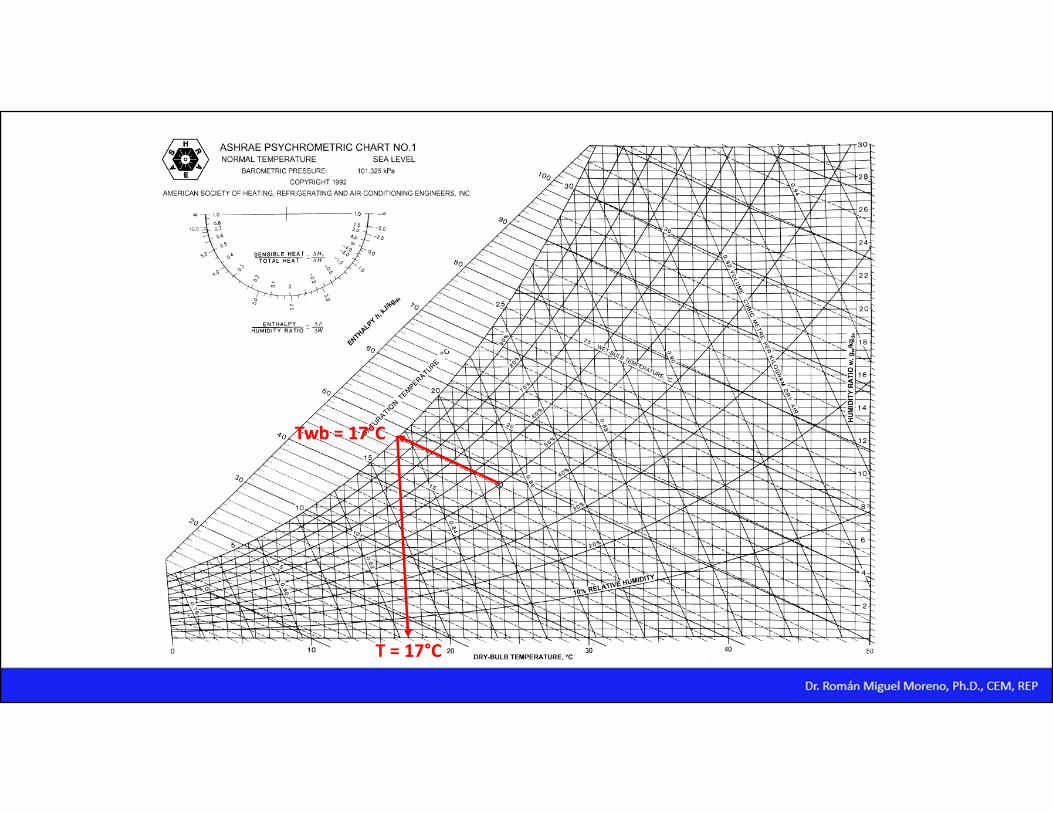
Twb = 17°C
T = 17°C
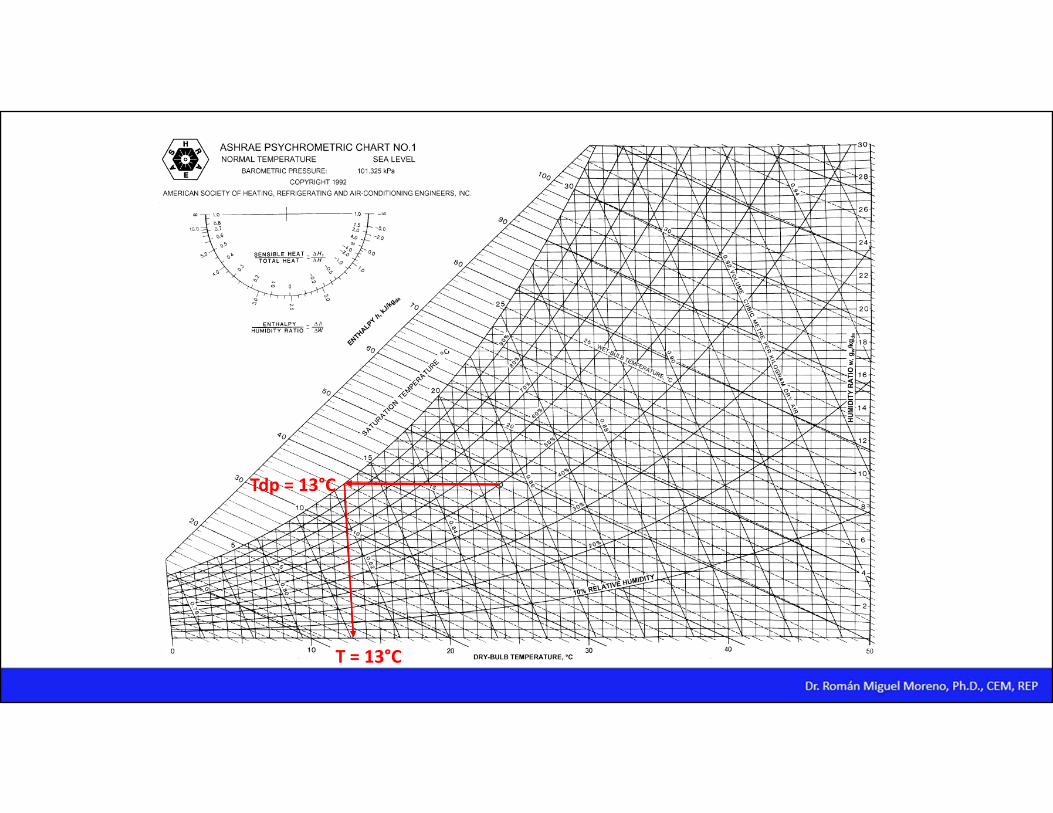
Tdp = 13°C
T = 13°C
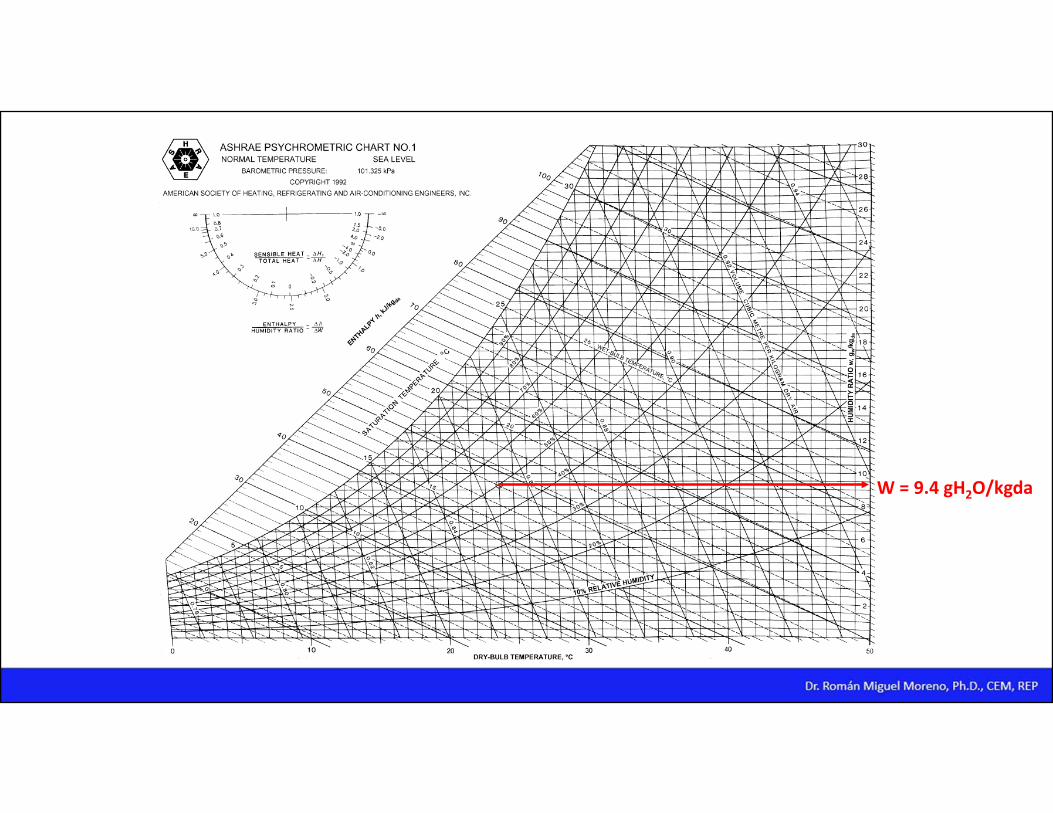
W = 9.4 gH2O/kgda

v = 0.86 m3/kg
v = 0.85 m3/kg
v = 0.854 m3/kg
1
10.854m3/kg
. /

h = 48 kJ/kg
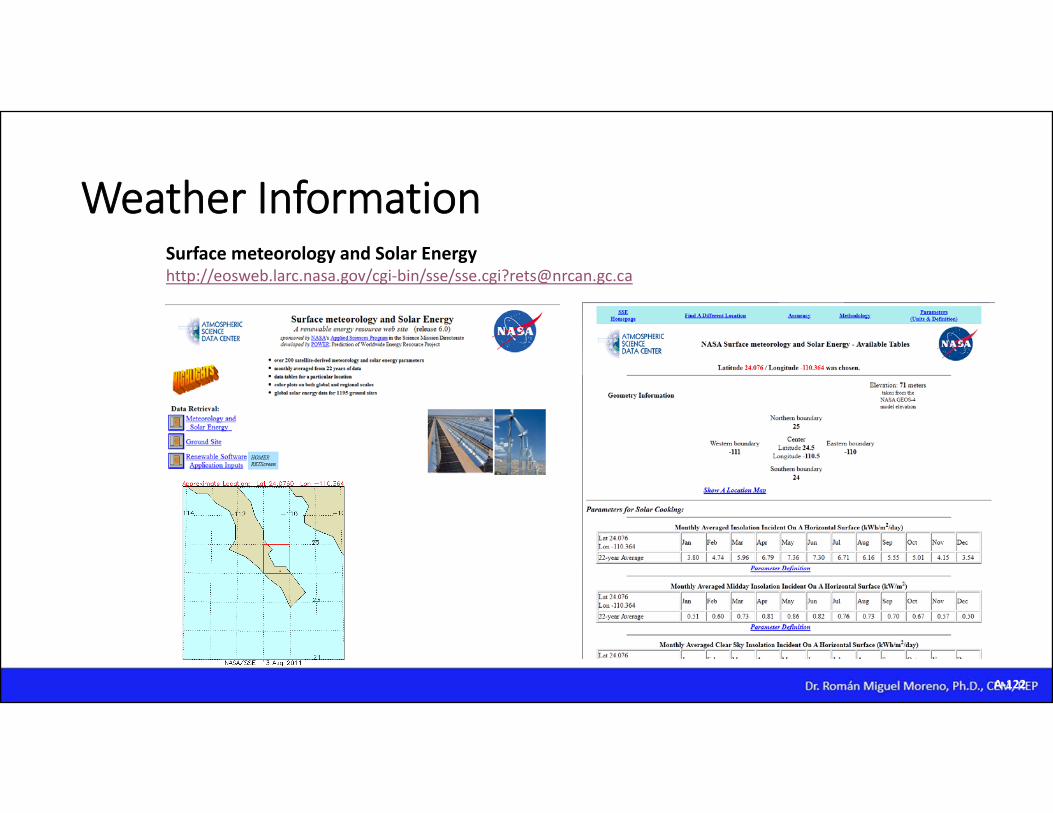
Surface meteorology and Solar Energyhttp://eosweb.larc.nasa.gov/cgi‐bin/sse/[email protected]
Weather Information
A‐122

Climate