Climate Shocks and Economic Growth in Bangladesh · PDF fileCLIMATE SHOCKS AND ECONOMIC GROWTH...
20
PRELIMINARY DRAFT – NOT FOR CITATION CLIMATE SHOCKS AND ECONOMIC GROWTH IN BANGLADESH S. Amer Ahmed 1 and Angel Aguiar 2 April 30, 2012 Presented at the 15 th Annual Conference on Global Economic Analysis, Geneva Abstract The Government of Bangladesh has made it a policy goal for the country to reach Middle-Income Country status by 2021, and projections that do not account for climate change effects, estimates that the Bangladesh’s economy will expand by 90 percent over the decade. However, this growth can be severely eroded by climate shocks, especially major floods, which are expected to occur more frequently in the future. Skilled labor demand growth is found to be more robust to climate shocks than unskilled labor, with climate change decreasing low-skilled labor demand growth more than skilled labor demand growth. The agriculture sector could grow by about 44 percent over the decade absent climate change effects, but climate shocks could reduce this growth within the range of 3 to 10 percentage points. The services sector is resilient, with climate shocks reducing its decadal growth by only 1 to 3 percentage points. Climate change and climate shocks to the rest of the global economy are thus only weakly transmitted to Bangladesh. They have little to no impact on Bangladesh’s GDP, although they can have a negative impact on export growth, and a positive impact on import growth. Key words: Bangladesh, growth, climate, MIC Acknowledgements: The authors are grateful to Zahid Hussain, Sanjay Kathuria, Lalita Moorty, Emmanuel Skoufias, Anna Strutt, Terrie Walmsley, Winston Yu, and the participants of a World Bank workshop organized in Dhaka in February 23, 2012 for many helpful comments. The authors are also grateful to Nadeem Rizwan for sharing World Bank growth projections for Bangladesh, and to James Thurlow for sharing climate and crop response projections. 1 Consultant, World Bank, Washington DC. Contact: [email protected] 2 Research Economist, Purdue University, Indiana
Transcript of Climate Shocks and Economic Growth in Bangladesh · PDF fileCLIMATE SHOCKS AND ECONOMIC GROWTH...
PRELIMINARY DRAFT – NOT FOR CITATION
CLIMATE SHOCKS AND ECONOMIC GROWTH IN BANGLADESH
S. Amer Ahmed1 and Angel Aguiar2
April 30, 2012
Presented at the 15th Annual Conference on Global Economic Analysis, Geneva
Abstract
The Government of Bangladesh has made it a policy goal for the country to reach Middle-Income Country status by 2021, and projections that do not account for climate change effects, estimates that the Bangladesh’s economy will expand by 90 percent over the decade. However, this growth can be severely eroded by climate shocks, especially major floods, which are expected to occur more frequently in the future. Skilled labor demand growth is found to be more robust to climate shocks than unskilled labor, with climate change decreasing low-skilled labor demand growth more than skilled labor demand growth. The agriculture sector could grow by about 44 percent over the decade absent climate change effects, but climate shocks could reduce this growth within the range of 3 to 10 percentage points. The services sector is resilient, with climate shocks reducing its decadal growth by only 1 to 3 percentage points. Climate change and climate shocks to the rest of the global economy are thus only weakly transmitted to Bangladesh. They have little to no impact on Bangladesh’s GDP, although they can have a negative impact on export growth, and a positive impact on import growth.
Key words: Bangladesh, growth, climate, MIC Acknowledgements: The authors are grateful to Zahid Hussain, Sanjay Kathuria, Lalita Moorty, Emmanuel Skoufias, Anna Strutt, Terrie Walmsley, Winston Yu, and the participants of a World Bank workshop organized in Dhaka in February 23, 2012 for many helpful comments. The authors are also grateful to Nadeem Rizwan for sharing World Bank growth projections for Bangladesh, and to James Thurlow for sharing climate and crop response projections.
1 Consultant, World Bank, Washington DC. Contact: [email protected]
2 Research Economist, Purdue University, Indiana
April 30, 2012 Draft
1
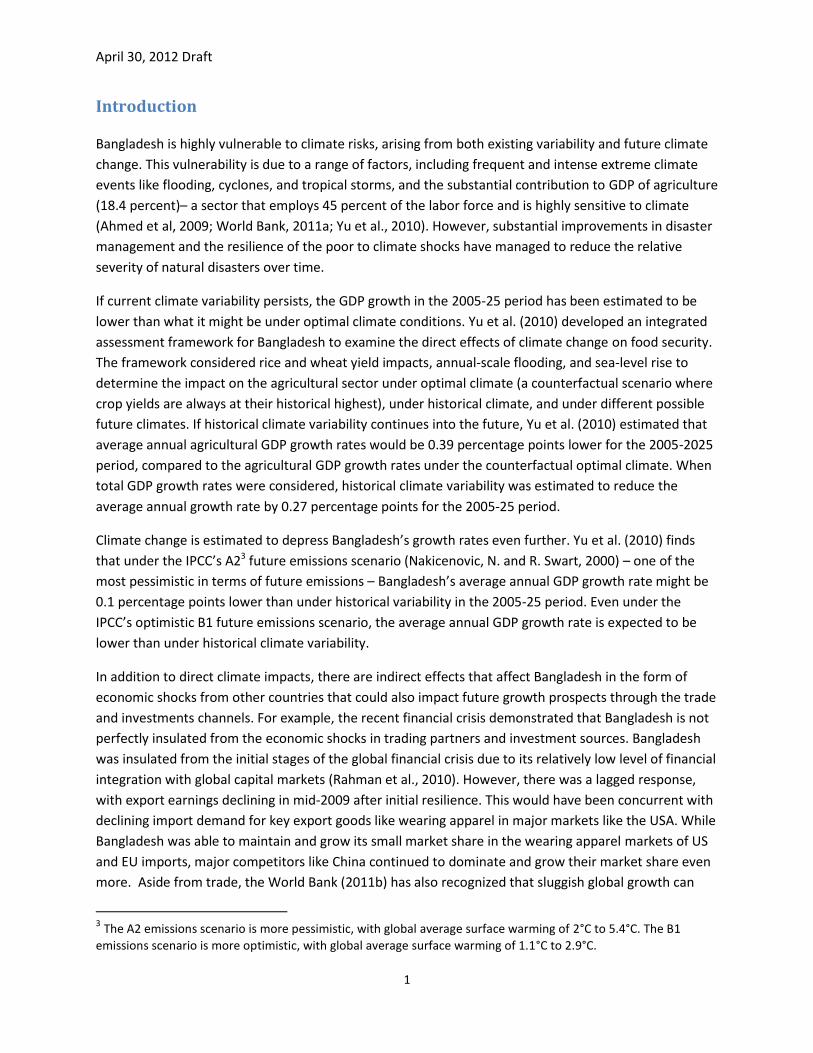
Introduction
Bangladesh is highly vulnerable to climate risks, arising from both existing variability and future climate
change. This vulnerability is due to a range of factors, including frequent and intense extreme climate
events like flooding, cyclones, and tropical storms, and the substantial contribution to GDP of agriculture
(18.4 percent)– a sector that employs 45 percent of the labor force and is highly sensitive to climate
(Ahmed et al, 2009; World Bank, 2011a; Yu et al., 2010). However, substantial improvements in disaster
management and the resilience of the poor to climate shocks have managed to reduce the relative
severity of natural disasters over time.
If current climate variability persists, the GDP growth in the 2005-25 period has been estimated to be
lower than what it might be under optimal climate conditions. Yu et al. (2010) developed an integrated
assessment framework for Bangladesh to examine the direct effects of climate change on food security.
The framework considered rice and wheat yield impacts, annual-scale flooding, and sea-level rise to
determine the impact on the agricultural sector under optimal climate (a counterfactual scenario where
crop yields are always at their historical highest), under historical climate, and under different possible
future climates. If historical climate variability continues into the future, Yu et al. (2010) estimated that
average annual agricultural GDP growth rates would be 0.39 percentage points lower for the 2005-2025
period, compared to the agricultural GDP growth rates under the counterfactual optimal climate. When
total GDP growth rates were considered, historical climate variability was estimated to reduce the
average annual growth rate by 0.27 percentage points for the 2005-25 period.
Climate change is estimated to depress Bangladesh’s growth rates even further. Yu et al. (2010) finds
that under the IPCC’s A23 future emissions scenario (Nakicenovic, N. and R. Swart, 2000) – one of the
most pessimistic in terms of future emissions – Bangladesh’s average annual GDP growth rate might be
0.1 percentage points lower than under historical variability in the 2005-25 period. Even under the
IPCC’s optimistic B1 future emissions scenario, the average annual GDP growth rate is expected to be
lower than under historical climate variability.
In addition to direct climate impacts, there are indirect effects that affect Bangladesh in the form of
economic shocks from other countries that could also impact future growth prospects through the trade
and investments channels. For example, the recent financial crisis demonstrated that Bangladesh is not
perfectly insulated from the economic shocks in trading partners and investment sources. Bangladesh
was insulated from the initial stages of the global financial crisis due to its relatively low level of financial
integration with global capital markets (Rahman et al., 2010). However, there was a lagged response,
with export earnings declining in mid-2009 after initial resilience. This would have been concurrent with
declining import demand for key export goods like wearing apparel in major markets like the USA. While
Bangladesh was able to maintain and grow its small market share in the wearing apparel markets of US
and EU imports, major competitors like China continued to dominate and grow their market share even
more. Aside from trade, the World Bank (2011b) has also recognized that sluggish global growth can
3 The A2 emissions scenario is more pessimistic, with global average surface warming of 2°C to 5.4°C. The B1
emissions scenario is more optimistic, with global average surface warming of 1.1°C to 2.9°C.

April 30, 2012 Draft
2
threaten Bangladesh through the official development assistance and remittances channels. For
example, a slowdown in remittances in fiscal year 2011 was held responsible for a slowdown in GNI
growth of 0.6 percentage points from the previous year.
Climate extremes, like natural disasters, can slow down growth in other countries, and could thus affect
Bangladesh’s growth through shocks to trade and investment. There is evidence that climate extremes
can detrimentally impact a country’s trade by affecting relative prices, production costs, and demand for
imports and exports (Gassebner et al., 2006). Considering that India and China are Bangladesh’s main
sources of capital goods and textiles – two imports with the largest import value shares – climate
extremes in these countries leading to contractions in their exports could detrimentally affect
Bangladesh’s output. Historically, these countries have experienced significantly intense climate
extremes. Given that climate extremes such as these are expected to become more frequent and more
intense in many countries (IPCC, 2007, 2012; Ahmed et al., 2009), the potential for climate change
impacts being transmitted to Bangladesh through the trade and investment channels can be expected to
be higher in the future.
This paper uses a simulation approach to estimate the sensitivity of Bangladesh’s growth to climate
shocks in the 2011 to 2021 period. The Government of Bangladesh has made it an objective to reach
Middle-Income Country status by 2021, a goal that has the support international development
institutions like the World Bank (World Bank, 2010b) and UNDP (UNDP, 2011). Focusing on the 2011-
2021 timeframe and on Bangladesh illustrates how global climate shocks can threaten even a careful
economic growth plan, while also identifying potential areas of policy intervention. The shorter time
horizon also sharpens the focus – which is often on the long run effects of climate change - to impacts
that will be experienced very soon, highlighting the immediacy of the development challenges posed by
the climate, with the results being less subject to the uncertainties and challenges of a longer-run
analysis.
Methodology
The analysis uses the GDyn model of Ianchovichina and McDougall (2012) with data from a range of
sources, including the Economist Intelligence Unit, the ILO, the FAO, and the World Bank. The analysis
also relies heavily on original climate impact analyses documented in Yu et al. (2010). That study
undertook extensive hydrological and crop production modeling that examined how flooding, sea-levels,
and rice crop production in Bangladesh might be affected by climate change. It also used a single-
country dynamic simulation model with sub-national detail to examine the economic impacts of the
climate change effects estimated in earlier chapters.
The approach has three stages. In the first stage, a baseline of Bangladesh’s growth in the decade is
determined absent any economic impacts from climate change. In the second stage, the impacts of
climate change are simulated in addition to the baseline economic growth effects. These effects include
sea-level rise, changes in rice yields (the most important crop from both agricultural income and
consumption perspectives), and more frequent major floods. This allows for an examination of the
direct economic effects of these climate change effects. The final stage considers additional scenarios
where climate extremes in the rest of the world are simulated in addition to the baseline economic

April 30, 2012 Draft
3
growth and the direct climate change effects on Bangladesh’s economy. This final stage allows for an
examination of the indirect economic effects, in other words, how the economic impacts of climate
extremes – expected to become more intense and frequent – in other countries might affect
Bangladesh’s growth.
The analysis conducted in this paper builds on the Yu et al. (2010) study, and complements its economic
analysis, using the same hydrological and crop production modeling estimates of climate change impacts
on Bangladesh for consistency. The economic model used in Yu et al. (2010) was a single-country model
with sub-national detail, reflecting its strength of simulating climate effects at the subnational scale, and
estimating economic impacts at the district level.
The GDyn-based approach provides additional insight through two ways. First, it models bilateral
international trade and investment linkages, and is able to capture indirect climate change effects that
may be transmitted to Bangladesh. Second, since the GDyn-based analysis focuses on economic
variables at the national-scale, it is able to take advantage of high-quality economic and population
projections for the establishment of its baseline scenario. For example, since the economic model used
in Yu et al. (2010) has subnational detail, it must provide estimates of labor force growth specific to
individual districts. However, the population and labor force projections estimated by the ILO are
provided at the national scale, and it is not possible to apply the detailed projections to a sub-national
model without making additional assumptions about how the location of the labor force growth. The
GDyn-based approach, since it does not have to distribute labor spatially within an individual country, is
able to take advantage of the high-precision national labor force growth projections.
It should be noted that despite using different economic models and focusing on different issues, the
national-scale impacts of direct climate change effects on Bangladesh do not differ much between the
Yu et al. (2010) study and the GDyn-based approach. When focusing on Bangladesh’s annual average
GDP growth rate in the 2005-2025 period, Yu et al. (2010) finds that the rate will decline by 0.1
percentage points due to climate change. In the GDyn-based analysis, median-case climate change could
reduce average annual GDP growth in the 2011 to 2021 period by 0.1 to 0.3 percentage points,
depending on the frequency of major floods.
The followings sections describe the GDyn model, and the design of the simulations.
MODEL
The GDyn model is a recursive-dynamic model based on the comparative-static GTAP CGE model of
Hertel (1997). By being dynamic-recursive, it assumes that agents make decisions within a given period
based only on current period variables. As will be seen later, it is able to capture adaptive expectations
in investment demand, but does not extend this adaptive behavior to other components of the
economy. For example, the distribution of the labor force across sectors depends only on shocks that
occur in a given period, with the new labor force distribution appearing at the beginning of the next
period. Workers in the agricultural sector would thus only move out of agriculture once an agriculture-
specific shock detrimentally affects the sector, and not before.
April 30, 2012 Draft
4
It is a multi-region, multi-sector model that assumes constant returns to scale and perfection
competition. Production in each of the sectors of the model assumes multi-nested Constant Elasticity of
Substitution (CES) function that combines the factors of production with intermediate inputs, both
imported and domestically produced. Consumption and savings decisions are determined by the solving
the representative regional household’s utility maximization problem through per capita private
consumption, per capita government expenditure (or consumption) and per capita savings. The regional
household’s utility function is a multi-nested Cobb-Douglas function with the private household demand
system nest having a Constant Difference of Elasticity (CDE) functional form (Hanoch, 1975; McDougall,
2003). The Cobb-Douglas specification forces budget shares to remain constant, and allows for the
assumption of the household’s constant marginal propensity.
There are five factors of production: land, natural resources, capital, unskilled and skilled labor. Land can
only be used for agricultural purposes, although it is sluggishly mobile across uses within agriculture. For
example, it can be used for rice production in one year, and for wheat production another year.
However, it would never be used for construction, since land is not an input in that sector in the national
input-output tables that underlie the supporting database. Labor are perfectly mobile across sectors
within a country. So, unskilled labor used in rice production one year, can move to working in
construction in another year. The two types of labor are substitutable with each other with the degree
of substitutability depending on the specific sector. Labor is assumed to be immobile across countries,
i.e. international migration is not possible.
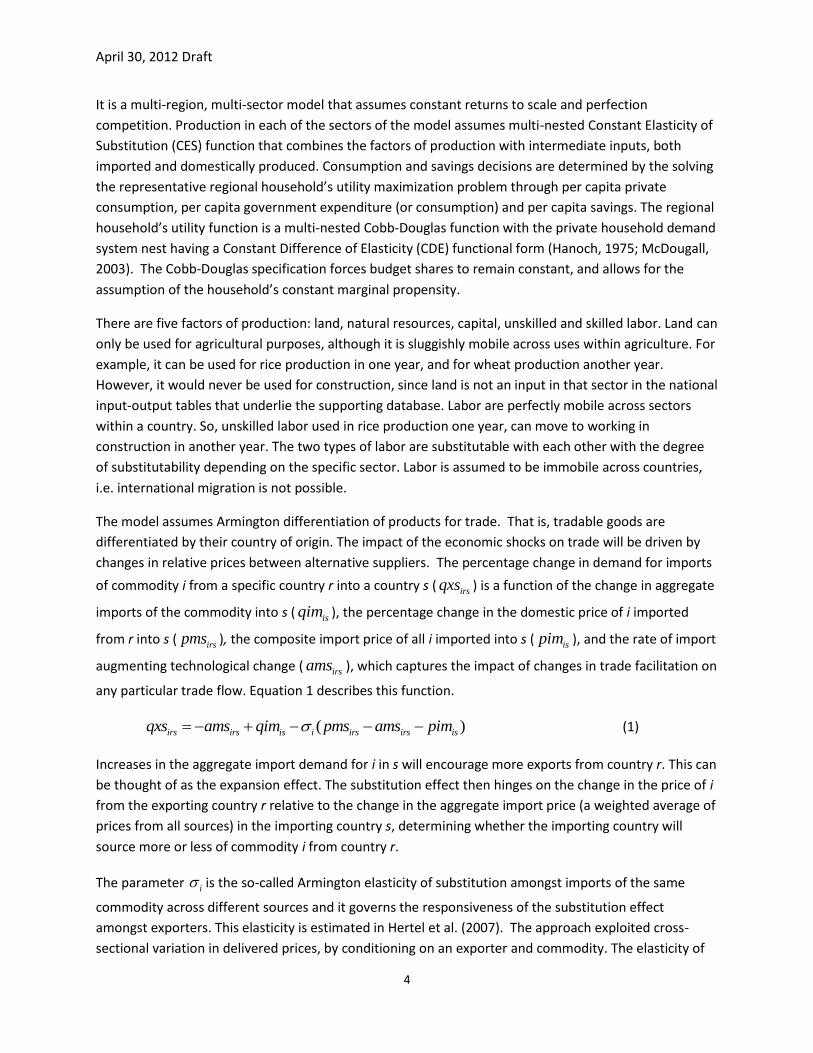
The model assumes Armington differentiation of products for trade. That is, tradable goods are
differentiated by their country of origin. The impact of the economic shocks on trade will be driven by
changes in relative prices between alternative suppliers. The percentage change in demand for imports
of commodity i from a specific country r into a country s ( irsqxs ) is a function of the change in aggregate
imports of the commodity into s ( isqim ), the percentage change in the domestic price of i imported
from r into s ( irspms ), the composite import price of all i imported into s ( ispim ), and the rate of import
augmenting technological change ( irsams ), which captures the impact of changes in trade facilitation on
any particular trade flow. Equation 1 describes this function.
( )irs irs is i irs irs isqxs ams qim pms ams pim (1)
Increases in the aggregate import demand for i in s will encourage more exports from country r. This can
be thought of as the expansion effect. The substitution effect then hinges on the change in the price of i
from the exporting country r relative to the change in the aggregate import price (a weighted average of
prices from all sources) in the importing country s, determining whether the importing country will
source more or less of commodity i from country r.
The parameter i is the so-called Armington elasticity of substitution amongst imports of the same
commodity across different sources and it governs the responsiveness of the substitution effect
amongst exporters. This elasticity is estimated in Hertel et al. (2007). The approach exploited cross-
sectional variation in delivered prices, by conditioning on an exporter and commodity. The elasticity of

April 30, 2012 Draft
5
substitution was then identified from variation over importers in delivered prices which arose from
bilateral variation in ad-valorem trade costs.
The GDyn model allows for international capital mobility, capital accumulation, and adaptive
expectations based investment decisions. Economic theory states that if capital is freely mobile across
regions, it will flow to those countries where investments provide the highest rate of return. This flow of
capital will stop only when rates of return have equalized across regions. However, in reality, national
statistics reports often show very low rates of return associated with high investment (Ianchovichina
and McDougall, 2001). To better reflect the real world, GDyn takes a disequilibrium approach that
allows for investors to have errors in their expectations on rates of returns, making their investment
decisions based on expected rates of return as opposed to actual rates of return. Since investors are
assumed to behave adaptively, these errors are eliminated over time, with the expected rate of return
on investments converging towards the observed rates of return.
The model is used with the Dynamic GTAP Database Version 7 (Narayanan and Walmsley, 2008). The
database describes production, consumption, and trade in 113 economies and 57 sectors, which are
aggregated 20 economies and 36 sectors for computational expediency, and are listed in Tables A1 and
A2. The global database has the advantage of reconciling the global input-output and trade data from a
range of sources, and benchmarking them to a single representative year. The reconciled data may thus
not be perfectly consistent with other data sources for any specific variable but provide the global
consistency necessary for analytical modeling.
SIMULATION DESIGN
The global economy is first simulated for ten years, from 2011 to 2021, explicitly excluding any climate
shocks like deviations in crop yield due to climate change and sea-level rise. Extreme events like flooding
– whose frequency and intensity is expected to increase under climate change – are also not considered
in this initial simulation. This simulation provides the “baseline” against which alternative projections
accounting for climate effects will be considered. The effect of the climate shocks – additional to that of
the baseline – can thus be clearly identified.
The scientific literature on climate change and its impacts often focuses on a long time horizon. Many of
the analyses documented in the Fourth Assessment Report of the Intergovernmental Panel on Climate
Change (IPCC, 2007) discuss the impact of climate change in future time periods that are decades in the
future, from the 2030s to the 2080s, and even as far as 2100. The practical reason for such a long time
horizon is that the major global impacts of climate change have yet to be felt. Recognizing this, many
studies have focused on analyzing the economic impacts of climate change at similarly distant future
points in time (e.g. Stern (2007) and Nordhaus and Boyer (2000) for global impacts, Garnaut (2008) on
Australia, inter alia) Yu et al. (2010) focused on Bangladesh, and examined the economic impacts of
climate risks from 2005 to 2050. The study found that economic damages from climate change steadily
increased, from discounted losses of $ 13 billion (2005 USD) in 2005-25 to $ 72 billion (2005 USD) in
2040-2050.
April 30, 2012 Draft
6
A long-run perspective, while appropriate for a complete analysis of the long run impacts of the climate,
due to climate change, is sometimes difficult to incorporate into policy discussions which often focus on
shorter-run objectives. At the same time, even the most sophisticated analyses have to deal with
potentially large uncertainty in the various climate predictions, with the uncertainty compounded by the
potential economic impacts being influenced by unaccounted interventions, such as adaptation and
technological improvements. Indeed, many economic analyses are unable to capture the fiscal
implications of investments for adaptation, which can represent substantial amounts of funding. The
World Bank (2011b) recently found that the cost to totally adapt Bangladesh to inland monsoon floods
and storms would require USD 5.7 billion by 2050.
There are five case study scenario simulations that are considered. Two of these scenarios characterize
the direct effects on Bangladesh through sea-level rise, impacts on rice yields, and flooding. The
remaining three simulations characterize the effects of climate extremes in the rest of the world, and
allow for an examination of how Bangladesh’s growth might be indirectly affected through trade and
investment channels.
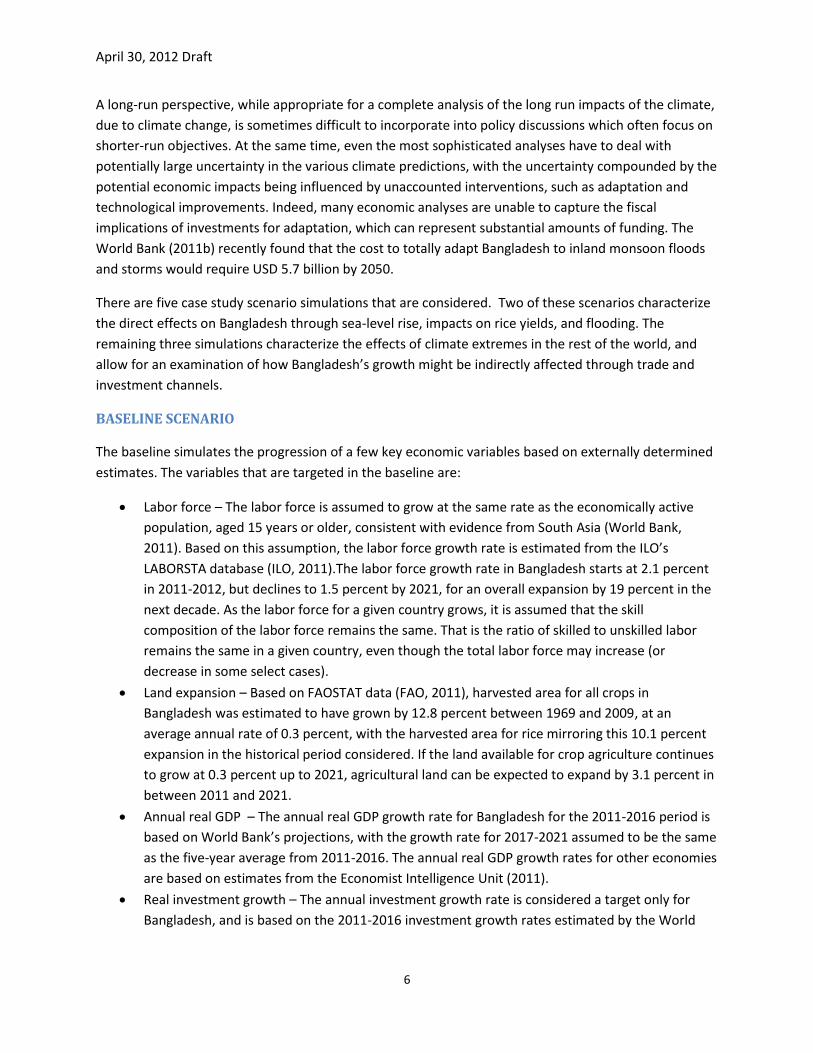
BASELINE SCENARIO
The baseline simulates the progression of a few key economic variables based on externally determined
estimates. The variables that are targeted in the baseline are:
Labor force – The labor force is assumed to grow at the same rate as the economically active
population, aged 15 years or older, consistent with evidence from South Asia (World Bank,
2011). Based on this assumption, the labor force growth rate is estimated from the ILO’s
LABORSTA database (ILO, 2011).The labor force growth rate in Bangladesh starts at 2.1 percent
in 2011-2012, but declines to 1.5 percent by 2021, for an overall expansion by 19 percent in the
next decade. As the labor force for a given country grows, it is assumed that the skill
composition of the labor force remains the same. That is the ratio of skilled to unskilled labor
remains the same in a given country, even though the total labor force may increase (or
decrease in some select cases).
Land expansion – Based on FAOSTAT data (FAO, 2011), harvested area for all crops in
Bangladesh was estimated to have grown by 12.8 percent between 1969 and 2009, at an
average annual rate of 0.3 percent, with the harvested area for rice mirroring this 10.1 percent
expansion in the historical period considered. If the land available for crop agriculture continues
to grow at 0.3 percent up to 2021, agricultural land can be expected to expand by 3.1 percent in
between 2011 and 2021.
Annual real GDP – The annual real GDP growth rate for Bangladesh for the 2011-2016 period is
based on World Bank’s projections, with the growth rate for 2017-2021 assumed to be the same
as the five-year average from 2011-2016. The annual real GDP growth rates for other economies
are based on estimates from the Economist Intelligence Unit (2011).
Real investment growth – The annual investment growth rate is considered a target only for
Bangladesh, and is based on the 2011-2016 investment growth rates estimated by the World

April 30, 2012 Draft
7
Bank. The investment growth rate for Bangladesh in the 2016-2021 period is determined from
the simulation model and is found to vary between 9.7 percent and 10.8 percent.
Additionally, the analysis focuses on the sensitivity of the baseline growth trajectory of the Bangladeshi
economy between 2011 and 2021 to a very specific set of climate shocks. So, the sensitivity of
Bangladesh’s economy to these shocks will be accurately measured as long as the same comparator
baseline is used.
SIMULATING CLIMATE SHOCKS
The direct climate effects of climate on Bangladesh are based on the comprehensive analyses conducted
in Yu et al. (2010). Following the approach of the economic analysis in that study, this study considers
three channels through which the climate directly affects Bangladesh: sea-level rise, rice yield impacts,
and major flooding.
The first channel of climate impact is sea-level rise. The sea-level is estimated to rise by 15cm by the
2030s (Yu et al. 2010). Assuming a constant rate of increase and that the increase of 15 cm occurs by
2030, the total land loss for Bangladesh is 0.9 percent at a rate of 0.04 percent of total land lost per
year. The second channel of climate impact is that of changing rice yields. Yu et al. (2010) estimated
yields of aman, aus, and boro rice4 under eleven climates - historical climate and under 10 alternative
future climate scenarios going out to the 2050s. These estimates were made considering both the
presence and absence of flooding. The ten alternative scenarios are based on the SRES A2 and B1
emissions scenarios, and five General Circulation Models (GCMs):
GFDL 2.1 from the Geophyiscal Fluid Dynamics Laboratory
MIROC 3.2 from the Center for Climate System Research, University of Tokyo
ECHAM5 from the Max Planck Institute for Meteorology
CCSM3 from the University Corporation for Atmospheric Research
HADCM3 from the Hadley Centre for Climate Prediction
When only CO2 fertilization (higher atmospheric CO2 levels), temperature, and precipitation changes are
considered, median aus and aman production might increase in the future. However, when flooding is
considered, production of all rice crops is estimated to decline. Since potential flooding is another
variable that could influence rice production, there are thus 20 alternative future climate scenarios – 10
GCM-SRES emissions scenario combinations with flooding, and 10 scenarios without flooding. Using the
yield estimates for the 2011-2021 period, pooled across the different GCM-SRES emissions scenario
combinations, deviations of future yields from the historical trend are estimated. From these data, the
median rice yield deviations from the historical trend are estimated.
4 Bangladesh grows three types of rice in various parts of the year. The largest harvest is aman, occurring in
November and December and accounting for the largest shares of annual production. The aus harvest is involving traditional strains and is harvested during the summer. Boro is irrigated rice, grown during the traditionally dry season from October to March.

April 30, 2012 Draft
8
The third channel of climate impact is flooding. Between 1970 and 1999, there were six major floods
recorded, and the frequency of flooding may possible increase under future climate change. However,
major floods are low-probability but high-impact events, whose frequency may double in the future.
National scale flooding is assumed to freeze agricultural land expansion for the year that flooding
occurs, and with the capital depreciation rate doubling for that year, following the assumed impacts of
flooding modeled in Yu et al. (2010). These capture the unavailability of land due to inundation and the
damage to fixed assets and infrastructure. Estimated rice yields are also adjusted due to flooding in the
years that a flood is assume to occur.
The land loss from sea-level rise and the median5 rice yield changes are then considered with simulated
flooding. Two scenarios are considered where flooding occurs in randomly selected years. In the first,
flooding occurs in years that are randomly drawn from the historical probability distribution of a flood
occurring. In the draw considered here, floods occur in 2015 and 2016. The second scenario is identical
to the first second scenario, but with an additional draw from the historical flooding probability
distribution, to illustrate what would happen if the probability of flooding doubled. In this scenario,
flooding occurs in 2013, 2015, and 2016.
The two case study scenarios are then:
Scenario 1 (Median Climate Change Impacts with Two Floods) – the baseline scenario with sea
level rise, median rice yield impacts, and flooding in 2015 and 2016.
Scenario 2 ((Median Climate Change Impacts with Three Floods) – the baseline scenario with sea
level rise, median rice yield impacts, and flooding in 2013, 2015 and 2016.
Economic damages from droughts, extreme heat, floods, and storms are estimated (Table 1) as shares of
real GDP in a given year for the period 1989-2009, using data from the EM-DAT database of natural
disasters. In some cases, these damages can be substantial. For example, the economic damages that
the USA sustained in 2005 (primarily due to Hurricane Katrina) was equivalent to more than a percent of
real GDP, while China experienced economic damages equivalent to about 3 percent of GDP in 1994 and
1998 from severe flooding.
The time series of historical estimated economic damages as a share of GDP can be used to characterize
distributions of potential damages to these economies due to droughts, floods, extreme heat, and
storms. From these historical distributions, the historical (1989-2009) median, 75th percentile, and 25th
percentile economic damages as GDP shares are estimated (Table 1).
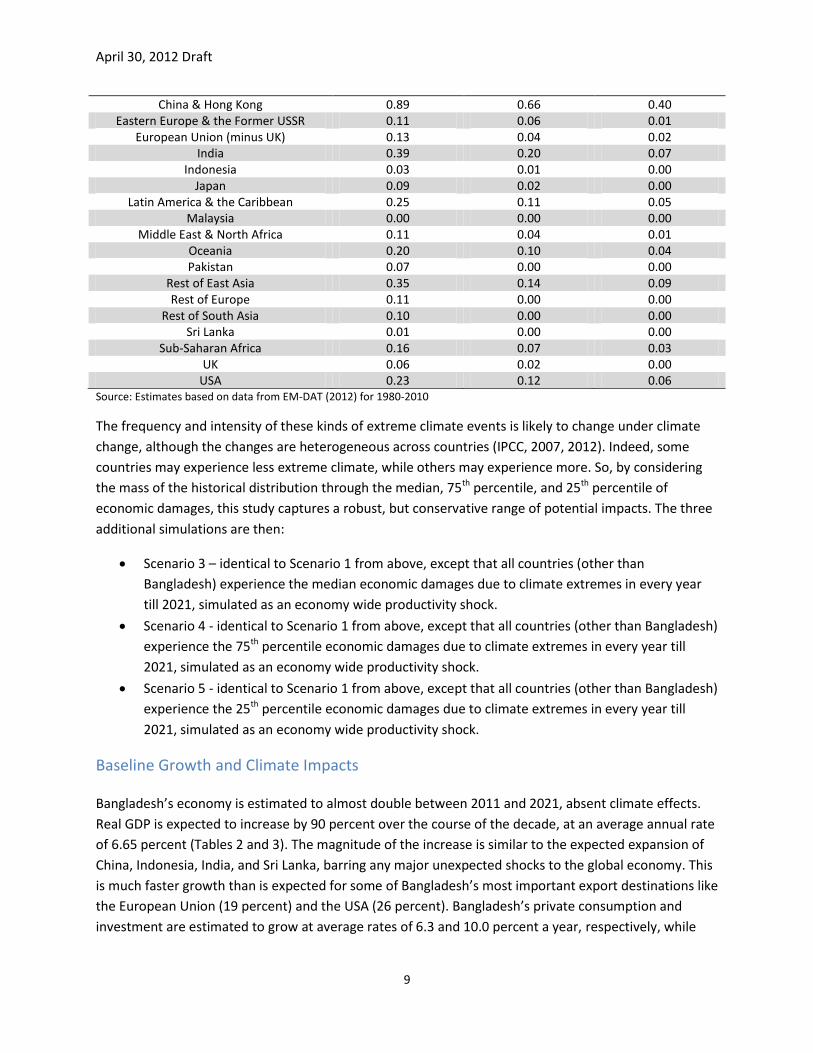
Table 1: Historical Economic Damages as Share of GDP due to Droughts, Extreme Heat, Floods, and Storms by Economy – Median, 25th Percentile, and 75th Percentile (%)
Economy High Global Damage
(75th percentile) Median Low Global Damage
(25th percentile)
5 The minimum and maximum case rice yield effects were also considered as part of a sensitivity analysis.
However, the differences in results as a result of picking a rice yield scenario had only extreme small impact on the magnitude of the results, with no substantive change in the overall economy.
April 30, 2012 Draft
9
China & Hong Kong 0.89 0.66 0.40 Eastern Europe & the Former USSR 0.11 0.06 0.01
European Union (minus UK) 0.13 0.04 0.02 India 0.39 0.20 0.07
Indonesia 0.03 0.01 0.00 Japan 0.09 0.02 0.00
Latin America & the Caribbean 0.25 0.11 0.05 Malaysia 0.00 0.00 0.00
Middle East & North Africa 0.11 0.04 0.01 Oceania 0.20 0.10 0.04 Pakistan 0.07 0.00 0.00
Rest of East Asia 0.35 0.14 0.09 Rest of Europe 0.11 0.00 0.00
Rest of South Asia 0.10 0.00 0.00 Sri Lanka 0.01 0.00 0.00
Sub-Saharan Africa 0.16 0.07 0.03 UK 0.06 0.02 0.00
USA 0.23 0.12 0.06 Source: Estimates based on data from EM-DAT (2012) for 1980-2010
The frequency and intensity of these kinds of extreme climate events is likely to change under climate
change, although the changes are heterogeneous across countries (IPCC, 2007, 2012). Indeed, some
countries may experience less extreme climate, while others may experience more. So, by considering
the mass of the historical distribution through the median, 75th percentile, and 25th percentile of
economic damages, this study captures a robust, but conservative range of potential impacts. The three
additional simulations are then:
Scenario 3 – identical to Scenario 1 from above, except that all countries (other than
Bangladesh) experience the median economic damages due to climate extremes in every year
till 2021, simulated as an economy wide productivity shock.
Scenario 4 - identical to Scenario 1 from above, except that all countries (other than Bangladesh)
experience the 75th percentile economic damages due to climate extremes in every year till
2021, simulated as an economy wide productivity shock.
Scenario 5 - identical to Scenario 1 from above, except that all countries (other than Bangladesh)
experience the 25th percentile economic damages due to climate extremes in every year till
2021, simulated as an economy wide productivity shock.
Baseline Growth and Climate Impacts
Bangladesh’s economy is estimated to almost double between 2011 and 2021, absent climate effects.
Real GDP is expected to increase by 90 percent over the course of the decade, at an average annual rate
of 6.65 percent (Tables 2 and 3). The magnitude of the increase is similar to the expected expansion of
China, Indonesia, India, and Sri Lanka, barring any major unexpected shocks to the global economy. This
is much faster growth than is expected for some of Bangladesh’s most important export destinations like
the European Union (19 percent) and the USA (26 percent). Bangladesh’s private consumption and
investment are estimated to grow at average rates of 6.3 and 10.0 percent a year, respectively, while
April 30, 2012 Draft
10
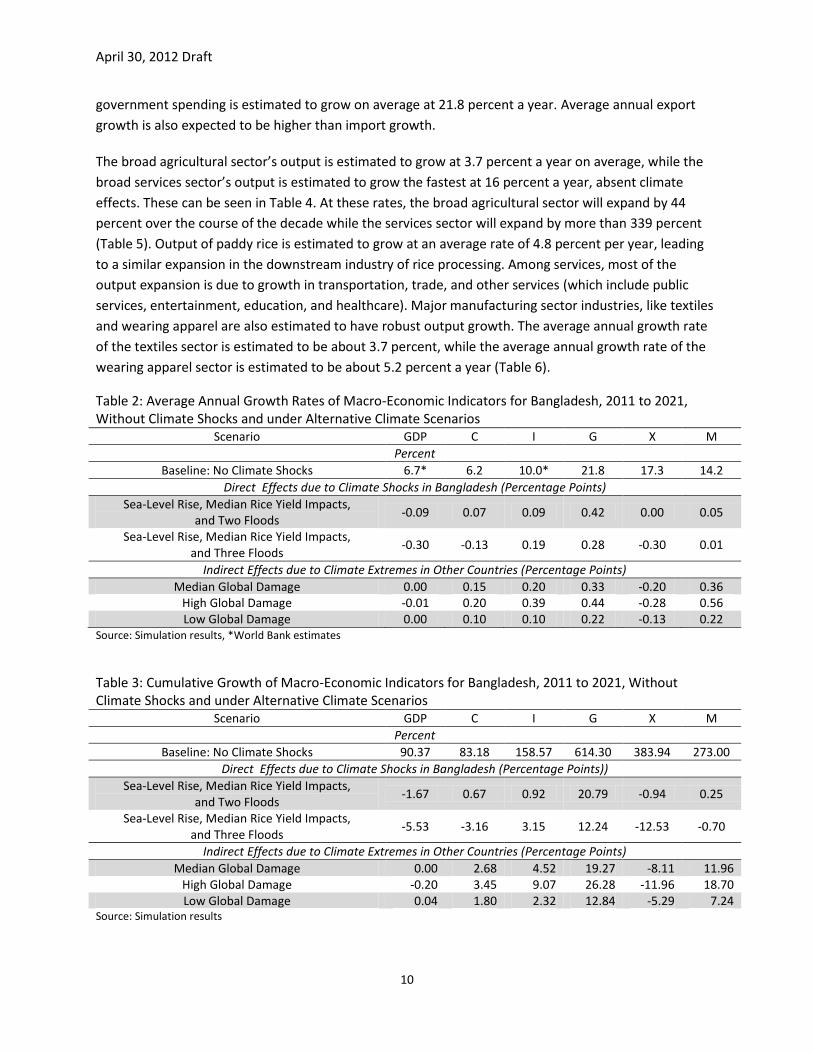
government spending is estimated to grow on average at 21.8 percent a year. Average annual export
growth is also expected to be higher than import growth.
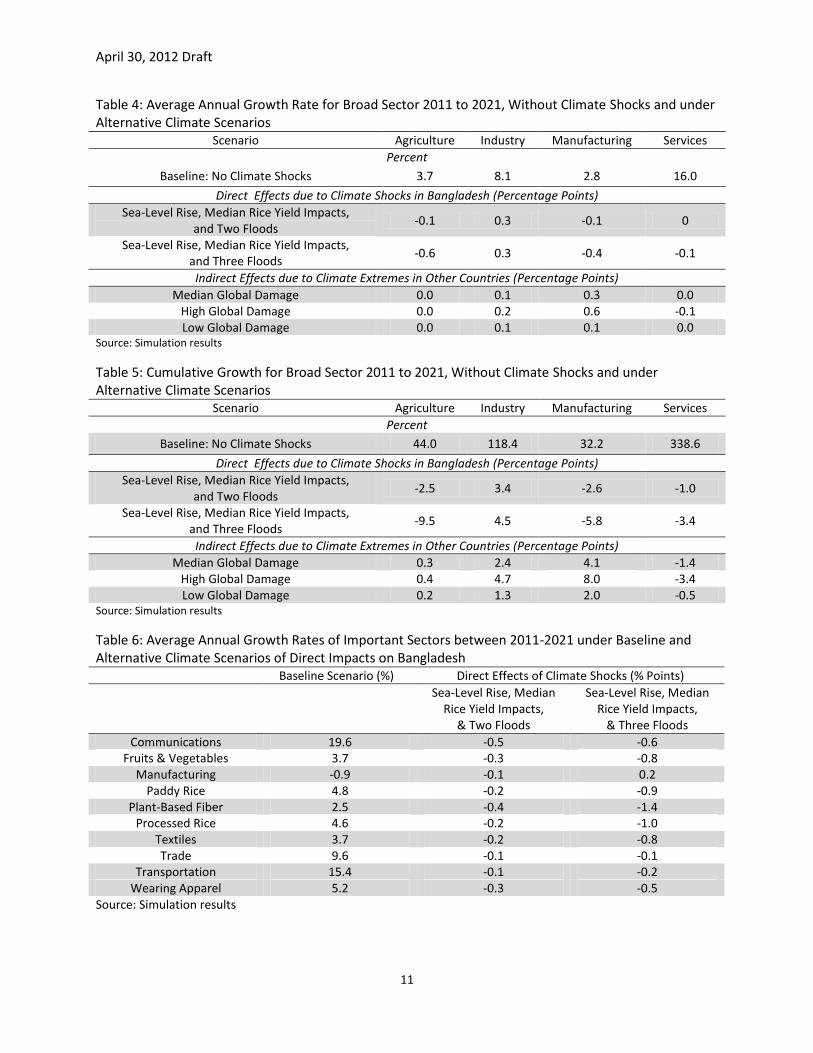
The broad agricultural sector’s output is estimated to grow at 3.7 percent a year on average, while the
broad services sector’s output is estimated to grow the fastest at 16 percent a year, absent climate
effects. These can be seen in Table 4. At these rates, the broad agricultural sector will expand by 44
percent over the course of the decade while the services sector will expand by more than 339 percent
(Table 5). Output of paddy rice is estimated to grow at an average rate of 4.8 percent per year, leading
to a similar expansion in the downstream industry of rice processing. Among services, most of the
output expansion is due to growth in transportation, trade, and other services (which include public
services, entertainment, education, and healthcare). Major manufacturing sector industries, like textiles
and wearing apparel are also estimated to have robust output growth. The average annual growth rate
of the textiles sector is estimated to be about 3.7 percent, while the average annual growth rate of the
wearing apparel sector is estimated to be about 5.2 percent a year (Table 6).
Table 2: Average Annual Growth Rates of Macro-Economic Indicators for Bangladesh, 2011 to 2021, Without Climate Shocks and under Alternative Climate Scenarios
Scenario GDP C I G X M
Percent
Baseline: No Climate Shocks 6.7* 6.2 10.0* 21.8 17.3 14.2
Direct Effects due to Climate Shocks in Bangladesh (Percentage Points)
Sea-Level Rise, Median Rice Yield Impacts, and Two Floods
-0.09 0.07 0.09 0.42 0.00 0.05
Sea-Level Rise, Median Rice Yield Impacts, and Three Floods
-0.30 -0.13 0.19 0.28 -0.30 0.01
Indirect Effects due to Climate Extremes in Other Countries (Percentage Points)
Median Global Damage 0.00 0.15 0.20 0.33 -0.20 0.36 High Global Damage -0.01 0.20 0.39 0.44 -0.28 0.56 Low Global Damage 0.00 0.10 0.10 0.22 -0.13 0.22
Source: Simulation results, *World Bank estimates
Table 3: Cumulative Growth of Macro-Economic Indicators for Bangladesh, 2011 to 2021, Without Climate Shocks and under Alternative Climate Scenarios
Scenario GDP C I G X M
Percent
Baseline: No Climate Shocks 90.37 83.18 158.57 614.30 383.94 273.00
Direct Effects due to Climate Shocks in Bangladesh (Percentage Points))
Sea-Level Rise, Median Rice Yield Impacts, and Two Floods
-1.67 0.67 0.92 20.79 -0.94 0.25
Sea-Level Rise, Median Rice Yield Impacts, and Three Floods
-5.53 -3.16 3.15 12.24 -12.53 -0.70
Indirect Effects due to Climate Extremes in Other Countries (Percentage Points)
Median Global Damage 0.00 2.68 4.52 19.27 -8.11 11.96 High Global Damage -0.20 3.45 9.07 26.28 -11.96 18.70 Low Global Damage 0.04 1.80 2.32 12.84 -5.29 7.24
Source: Simulation results
April 30, 2012 Draft
11
Table 4: Average Annual Growth Rate for Broad Sector 2011 to 2021, Without Climate Shocks and under Alternative Climate Scenarios
Scenario Agriculture Industry Manufacturing Services
Percent
Baseline: No Climate Shocks 3.7 8.1 2.8 16.0
Direct Effects due to Climate Shocks in Bangladesh (Percentage Points)
Sea-Level Rise, Median Rice Yield Impacts, and Two Floods
-0.1 0.3 -0.1 0
Sea-Level Rise, Median Rice Yield Impacts, and Three Floods
-0.6 0.3 -0.4 -0.1
Indirect Effects due to Climate Extremes in Other Countries (Percentage Points)
Median Global Damage 0.0 0.1 0.3 0.0 High Global Damage 0.0 0.2 0.6 -0.1 Low Global Damage 0.0 0.1 0.1 0.0
Source: Simulation results
Table 5: Cumulative Growth for Broad Sector 2011 to 2021, Without Climate Shocks and under Alternative Climate Scenarios
Scenario Agriculture Industry Manufacturing Services
Percent
Baseline: No Climate Shocks 44.0 118.4 32.2 338.6
Direct Effects due to Climate Shocks in Bangladesh (Percentage Points)
Sea-Level Rise, Median Rice Yield Impacts, and Two Floods
-2.5 3.4 -2.6 -1.0
Sea-Level Rise, Median Rice Yield Impacts, and Three Floods
-9.5 4.5 -5.8 -3.4
Indirect Effects due to Climate Extremes in Other Countries (Percentage Points)
Median Global Damage 0.3 2.4 4.1 -1.4 High Global Damage 0.4 4.7 8.0 -3.4 Low Global Damage 0.2 1.3 2.0 -0.5
Source: Simulation results
Table 6: Average Annual Growth Rates of Important Sectors between 2011-2021 under Baseline and Alternative Climate Scenarios of Direct Impacts on Bangladesh
Baseline Scenario (%) Direct Effects of Climate Shocks (% Points)
Sea-Level Rise, Median
Rice Yield Impacts, & Two Floods
Sea-Level Rise, Median Rice Yield Impacts,
& Three Floods
Communications 19.6 -0.5 -0.6 Fruits & Vegetables 3.7 -0.3 -0.8
Manufacturing -0.9 -0.1 0.2 Paddy Rice 4.8 -0.2 -0.9
Plant-Based Fiber 2.5 -0.4 -1.4 Processed Rice 4.6 -0.2 -1.0
Textiles 3.7 -0.2 -0.8 Trade 9.6 -0.1 -0.1
Transportation 15.4 -0.1 -0.2 Wearing Apparel 5.2 -0.3 -0.5
Source: Simulation results

April 30, 2012 Draft
12
Table 7 Cumulative Growth of Select Sectors between 2011-2021 under Baseline and Alternative Climate Scenarios of Direct Impacts on Bangladesh
Baseline Scenario (%) Direct Effects of Climate Shocks (% Points)
Sea-Level Rise, Median
Rice Yield Impacts, & Two Floods
Sea-Level Rise, Median Rice Yield Impacts,
& Three Floods
Communications 476.1 -21.8 -25.0 Fruits & Vegetables 43.3 -7.6 -11.9
Manufacturing -10.2 -2.2 -1.6 Paddy Rice 59.7 -14.7 -14.7
Plant-Based Fiber 28.1 -11.6 -18.4 Processed Rice 56.9 -9.8 -16.2
Textiles 43.3 -5.6 -10.9 Trade 150.3 -1.7 -2.5
Transportation 312.5 -5.8 -8.9 Wearing Apparel 65.3 -6.6 -9.3
Source: Simulation results
A range of sectors, including rice and textiles, benefit from Bangladesh’s rapid labor force growth,
whose rate is faster than that of many other economies. The number of people in Bangladesh aged 15
years or older is expected to grow at an average rate of 1.75 percent a year over the 2011-2021 period,
and is a reasonable proxy for the employment growth rate (ILO, 2011; World Bank, 2011c). The labor
intensive agriculture and food related sectors thus benefit from the additional low-skilled labor that is
made available. Industries like textiles, transportation, trade (retail as well as wholesale), and other
services are also labor intensive and major employers, and will similarly benefit from the abundant labor
entering the market and keeping wages internationally competitive. For example, low-skilled labor
accounts for about half of the transportation sector’s value added, employing about a fifth (in value
terms) of all low-skilled labor in the economy. As the transportation sector expands due to investment
and productivity growth, its demand for inputs expands, and it benefits from the abundant, relatively
low-cost labor.
The labor force is estimated to expand by about 19 percent by 2021, with this labor expansion
comparable to the growth experienced by other countries in the region. This expansion will be smaller
than what is expected for Pakistan and Sub-Saharan Africa (in excess of 30 percent), but greater than the
17-18 percent that India, Indonesia, and Malaysia are expected to experience. In contrast, some of
Bangladesh’s major trading partners have sluggish or negative growth. For example, the average labor
force growth rate is 0.71 percent a year in the USA, 0.17 percent a year in China, and negative 0.2
percent for the EU. The EU and Japanese labor forces are expected to contract by two to five percent by
2021.
Impacts of Climate Effects
Direct Impacts
When direct climate effects are considered Bangladesh’s average annual GDP growth rate in the 2011-
2021 period is estimated to be lower than in the baseline case by 0.1 to 0.3 percentage points,
depending on the number of major floods it experiences. This means that the Bangladeshi economy will

April 30, 2012 Draft
13
grow by 2 to 6 percentage lower than in the baseline case, where there was 90 percent decadal growth
(Tables 2 and 3). Sea-level rise permanently removes agricultural land from production, while changing
temperature, precipitation, and atmospheric CO2 levels affect rice yields. The impact of a flood in the
analysis is to reduce land expansion, temporarily reduce land available for agriculture, damage rice
yields, and double the depreciation rate of capital in all sectors of the economy. Two scenarios were
considered to illustrate this. In the first scenario, the probability of floods occurring was assumed to
occur at the same frequency as in the 1970-1999 historical period. This case study scenario then
considers floods occurring in 2015 and 2016, randomly drawing from the historical probability
distribution for major floods. In the second scenario, the probability of floods occurring was assumed to
be double in frequency, due to climate change. In this case study scenario, the 2015 and 2016 floods
were preceded by another flood in 2013.
Paddy rice is the most important contributor to the overall reduction in agricultural output growth. Rice
production is affected by slower land supply expansion due to sea-level rise, and by damage to capital
stock and lower productivity due to water-logging when floods occur. When the scenario with two
floods is considered, the average annual rice yield growth rate in the 2011-2021 period is found to be
negative 1.1 percent. When the scenario case with three floods is considered, the average annual yield
growth rate is found to be negative 2.4 percent. The lower rice yields in turn lead to lower processed
rice production – the major downstream industry. The average annual growth rate in the processed rice
sector is found to be lower by 0.2 to 1.0 percentage points, relative to the baseline (Table 6). In the
baseline case of no climate effects, the average annual inflation rate for paddy rice and processed rice
prices was 1.2 percent. However, in the scenario with climate change and two floods, the average paddy
rice price inflation rate rises by a further 4.3 percentage points, while the inflation rate of processed rice
price rises by 3.1 percentage points.
Climate impacts are also estimated to depress the growth in manufacturing and services. The lower
growth (Tables 3 and 4) is primarily due to the damage to capital stocks from floods. Capital, which
depreciate at a faster rate in a flood-year, account for a substantial share of value added costs in the
production of manufactured goods and services.
While some sectors experience lower output due to the direct impacts of lower yield, less land, and
damage to capital stock, other sectors have to reduce output due to the transmission of effects through
the intermediate inputs markets. In the agriculture sector, the contraction in processed rice production
due to lower paddy rice output is the most obvious, as discussed earlier. However, other sectors like
that of plant-based fibers also depend substantially on domestic sources of input crops. When the
production of these input crops decline under climate shocks, contracting their supply in the
intermediate inputs markets, the production of plant-based fibers also declines. In the baseline, this
sector grew at by 52 percent over the decade. However, when the climate scenario with two floods was
considered, sectoral growth was 8 percentage points lower (Table 7).
Another example would be that of the wearing apparel sector, which experiences lower supply of key
inputs like textiles, which accounts for a quarter of the former sector’s intermediate input costs. Since
the textiles sector experiences sluggish growth, the supply of this input to the wearing apparel sector

April 30, 2012 Draft
14
also suffers. As a result, growth in the wearing apparel sector is 6.6 to 9.3 percentage points lower when
climate shocks are considered, relative to the baseline case which had 65 percent decadal growth (Table
7). The services sectors’ intermediate inputs are mostly other services, so they experience sluggish
growth primarily due to the faster capital depreciation, but are more resilient to effects transmitted
through the markets for intermediate inputs (Table 3).
Climate shocks also had direct impacts on export and import growth, and an indirect impact on
investment growth. Due to the indirect effects of climate shocks on the factor and intermediate input
markets, major export sectors (e.g. textiles and wearing apparel) have sluggish output growth and
greater price inflation. These lead to a slower export growth rate and a slightly more rapid import
growth rate through substitution towards imported goods and services.
Climate also reduces the labor demand growth, with the demand for unskilled workers being more
adversely affected than skilled workers, and with the effects becoming more severe with more frequent
floods. In the baseline case, the average sectoral demand for skilled labor rises by 30 percent over the
course of the decade, while the demand for less skilled labor rises by 45 percent. In the climate shock
scenario with two floods, the demand for skilled labor is estimated to decline by 0.36 percentage points
while the demand for low skilled labor is expected to decline by 0.42 percentage points. These
estimated declines in demand are greater when the three-flood scenario is considered, with skilled labor
demand declining by 2.4 percentage points and low skilled labor demand declining by 4.3 percentage
points. The lower demands for labor due to floods reflect the lower output of most sectors due to the
damage to capital stocks, or dampened land supply, in the case of agricultural production.
These estimates assume that the unemployment rate represents the structural unemployment rate and
therefore it does not change over the course of the decade. Sensitivity analysis was conducted to
examine the robustness of the growth impacts to a flexible employment rate. There is little to no change
in the average annual growth impact of climate shocks under alternative assumptions about the labor
market. However, when focusing on individual years, the growth rate can be much lower in a flood year,
relative to the baseline if flexible employment is assumed. For example, when a flood was simulated in
2015, the growth rate was 7 percent in the baseline case, 4 percent in the climate shock case with a
fixed unemployment rate, and 3 percent in the climate shock case with a flexible unemployment rate.
The cumulative effects of direct climate shocks on the economy can be substantial, as seen by how the
damages to Bangladesh’s future growth increase non-linearly with the number of floods. Comparing the
macro-economic or sectoral impacts of climate shocks across the two-flood and three-flood scenarios
(Tables 2-7), it can be seen that the average damage per flood is greater in the three-flood scenario. For
example, in Table 2, the average annual GDP growth rate is 0.1 percentage point lower than in the
baseline when the two-flood scenario is considered, but 0.3 percentage points lower when the three-
flood scenario is considered. Another example would be the damage to agricultural output growth over
the decade (Table 4). In the baseline case, agricultural output grows by 44 percent over the decade. This
growth is 2.5 percentage points when the two-flood climate shock scenario is considered, and 9.5
percentage points when the three-flood scenario is taken into account. As additional climate shocks
occur, the impacts become greater.
April 30, 2012 Draft
15
Indirect Impacts through International Linkages
The estimated impact of climate extremes in the rest of the world on Bangladesh’s growth are based on
three scenarios – a low global damage scenario, a median scenario, and a high global damage scenario.
As illustrated in Table 1, the historical economic damages due to climate extremes are estimated for the
rest of the world. The low global damage scenario describes a scenario where the other countries of the
world only experience climate extremes that would have fallen in the 25th percentile of their historic
damages. The median scenario describes a scenario where the other countries experience climate
extremes that would have occurred 50 percent of the time, while the high damage global scenario
describes damages that would have occurred in the 75th percentile of their historic damages. For
example, for a given year, China’s economic damage was estimated to be equivalent to 0.7 percent of
GDP in the low-damage (25th percentile) scenario, 0.4 percent in the median scenario, and 0.9 percent in
the high-damage (75th percentile) scenario. In contrast, major importers of Bangladeshi products, like
the USA and EU, seem to be more resilient to damages due to climate extremes.
Climate extremes in the rest of the world are estimated to most likely have only a small impact on
Bangladesh’s GDP growth. If the other countries of the world are assumed to experience the 25th
percentile and median probability extremes, based on historic probability distributions of economic
damages due to the climate, then there is almost no discernable impact on Bangladesh’s overall GDP
growth rate (Table 2). It is only under the high-damage scenario that Bangladesh’s GDP growth rate
experiences a minor slowdown of 0.01 percentage points.
At the same time, damages to other countries through climate extremes have clear effects on
Bangladesh’s export and import growth. Under the global climate extreme scenarios, Bangladesh’s
average annual export growth rate is dampened by between 0.13 and 0.28 percentage points, while the
import growth rate rises by between 0.22 and 0.56 percentage points (Table 7).
Some of Bangladesh’s major exports become more competitive due to changes in terms of relative
international prices. Textiles and wearing apparel are two exports that become more competitive. Their
average export growth rates of textiles and wearing apparel are higher by a full percentage point in the
high-damage scenario (Table 8). At the same time, exports of most other products and services are
lower due to contracting international demand. The lower global demand would also depresses world
prices, and facing lower prices, Bangladesh can demand more imports. The resulting disparity in the
export and import growth rates may exacerbate Bangladesh’s balance of payments challenges.
While, consumption and government expenditure growth remain robust when considering climate in
the rest of the world, the lower export growth rate and the higher import growth rate may lead to
future balance of payment complications. The faster import growth helps maintain the vigorous growth
in private consumption. However, given the lower export growth, investment growth has to remain
slightly higher to maintain balance of payments equilibrium.
Table 8: Average Annual Export Growth Rates for Select Goods and Services, 2011 to 2021, under Baseline and Additional Effects of Climate Extremes in the Rest of the World
Baseline
Scenario (%) Additional Effects
due to Climate Extremes

April 30, 2012 Draft
16
(% Points)
Median-Damage
High-Damage Low-Damage
Communications 36.1 0.30 1.02 0.13 Plant-Based Fibers 7.5 -1.72 -3.54 -0.79 Financial Services 27.8 -0.19 -0.09 -0.15
Forestry -53.4 -0.98 -1.72 -0.61 Fisheries -26.6 -2.41 -4.12 -1.34 Leather -11.7 -0.94 -0.96 -0.86
Livestock 0.8 -4.06 -5.67 -1.80 Lumber & Paper -21.8 -0.37 -0.58 -0.22
Manufactures -17.7 0.41 0.72 0.23 Other Business Services 26.9 0.07 0.32 0.00
Textiles 0.9 0.49 1.08 0.22 Transportation 44.6 0.03 0.22 -0.01
Trade 13.4 -1.05 -1.97 -0.61 Wearing Apparel 5.0 0.45 0.80 0.23
Source: Simulation results
Conclusions and Policy Considerations
Bangladesh can undertake a few “no regrets” policies to help make growth robust to climate shocks.
These policies would be no-regrets in that they would be beneficial under various climate shock
scenarios as well under the no-climate-shock baseline. Two policy considerations that arise from the
estimates are as follows:
First, the skill share of the labor force needs to be developed to take advantage of the more climate
resilient sectors. Output growth of the agriculture and manufacturing sectors were found to be sensitive
to damages from floods, which can be expected to become more frequent and intense under climate
change. The services sector, in contrast, was found to be much less sensitive. Skilled labor demand is
thus less adversely affected by extreme climate shocks than the demand for less skilled labor. This
paper assumed that the unskilled to skilled labor ratio remains constant as the labor force grows, with
the resulting pattern of labor force growth potentially benefitting agriculture and some manufacturing
sectors (like textiles) that are intensive in low and unskilled workers. However, they will not help in the
expansion of sectors like heavy and light manufacturing, communications, transportation services, other
business services, or even public services.
Bangladesh is currently in a position when it can reap a demographic dividend, having a large labor force
and relatively low dependency ratio (World Bank, 2011c). This demographic dividend can be maximized
by investing in education to transform the mostly low-skilled labor force used in labor intensive low-
value sectors into a higher skilled labor force that can benefit industries higher up the value chain. Even
if the full benefits of this investment are not reaped within the 2011-2021 timeframe, it would place
Bangladesh in a better position in the post-2011 future, when climate impacts will become more
noticeable and when the labor forces of many trading partners will be declining or leveling off.
Second, trade facilitation policies that enhance export growth would also help with the potential current
account deficit problems. Hertel and Mirza (2009) estimates that for South Asian countries, the

April 30, 2012 Draft
17
magnitude of the elasticity of trade with respect to tariff liberalization was smaller than with respect to
trade facilitation. Trade facilitation is thus a more effective way of enhancing intra-regional trade. Hertel
and Mirza (2009) also finds that border reforms and trade facilitation improvements would also improve
Bangladesh’s exchange rate, returns to skilled labor, and welfare gains.
References Ahmed, S.A., N.S. Diffenbaugh, and T.W. Hertel (2009) “Climate Volatility Deepens Poverty Vulnerability
in Developing Countries,” Environmental Research Letters, 4 (2009).
Economist Intelligence Unit (2011) EIU Country Data, Available: https://eiu.bvdep.com (Accessed
October 1, 2011)
EM-DAT (2011) EM-DAT: The OFDA/CRED International Disaster Database, Université Catholique de Louvain, Brussels. Available: www.emdat.be (Accessed: December 1, 2011)
FAO (2011) FAOSTAT Database, Food and Agricultural Organization, Rome.
Gassebner, M., A. Keck, and R. Teh (2006) “The Impacts of Disasters on International Trade,” Staff Working Paper ERSD-2006-04, Economic Research and Statistics Division, World Trade Organization, Geneva.
Garnaut, R. (2008) The Garnaut Climate Change Review: Final Report, Cambridge University Press,
Melbourne.
Hanoch, G. (1975) "Production and Demand Models with Direct or Indirect Implicit Additivity,"
Econometrica 43:395419
Hertel, T.W. (ed) (1997) Global Trade Analysis: Models and Applications, Cambridge University Press.
Hertel, T.W., D. Hummels, M. Ivanic, and R. Keeney, “How Confident can we be of CGE-Based
Assessments of Free Trade Agreements?” Economic Modelling, 24 (2007): 611–635.
Hertel, T.W. and T. Mirza (2009) “The Role of Trade Facilitation in South Asian Economic Integration”, Chapter 2 in Asian Development Bank, Study on Intraregional Trade and Investment in South Asia, ADB Report, Manila.
Ianchovichina, E. and T.L. Walmsley (eds) (2012) Global Economic Analysis: Dynamic Modeling and Applications, Center for Global Trade Analysis, Purdue University.
ILO (2011) “Economically Active Population Estimates and Projections, Table 5A”, LABORSTA Labor Statistics Database, International Labor Organization, Geneva.
IPCC (2007) “Climate Change 2007: The Physical Science Basis. Contribution of Working Group I,” in S. Solomon, D. Qin, M. Manning, Z. Chen, M. Marquis, K.B. Averyt, M. Tignor, and H.L. Miller (eds.), Fourth Assessment Report of the Intergovernmental Panel on Climate Change. Cambridge and New York: Cambridge University Press, 2007.
IPCC (2012) “Summary for Policymakers: Managing the Risks of Extreme Events and Disasters to
Advance Climate Change Adaptation” in Field, C.B., V. Barros, T.F. Stocker, D. Qin, D.J. Dokken,
April 30, 2012 Draft
18
K.L. Ebi, M.D. Mastrandrea, K.J. Mach, G.-K. Plattner, S.K. Allen, M. Tignor, and P.M. Midgley
(eds.) A Special Report of Working Groups I and II of the Intergovernmental Panel on Climate
Change, Cambridge University Press, Cambridge, UK, and New York, NY, USA, pp. 1-19.
McDougall, R.M. (2003) “A New Regional Household Demand System for GTAP,” GTAP Technical Paper
No. 20, Center for Global Trade Analysis, Purdue University, West Lafayette, Indiana.
Mirza, M.M.Q (2003) “Three Recent Extreme Floods in Bangladesh: A Hydro-Meteorological Analysis”,
Natural Hazards, Vol. 28, pp35-64.
MoEF (2009) Bangladesh Climate Change Strategy and Action Plan 2009. Ministry of Environment and
Forests, Government of the People’s Republic of Bangladesh, Dhaka, Bangladesh.
Nakicenovic, N. and R. Swart (Eds.) (2000) Special Report on Emissions Scenarios. Cambridge: Cambridge University Press.
Narayanan, B., and T.L. Walmsley (eds) (2008) Global Trade, Assistance, and Production: The GTAP 7 Data Base, Center for Global Trade Analysis, Purdue University.
Nordhaus, W., and J. Boyer (2000) Warming the World: Economic Models of Climate Change. Cambridge,
MA: MIT Press.
Rahman, M., D. Bhattacharya, W.B. Shadat and U. Deb (2008) “Recent Inflation in Bangladesh: Trends,
Determinants and Impact on Poverty”, Dhaka: Center for Policy Dialogue (CPD).
Rahman, M., M.A. Iqbal, T.I. Khan, and S. Dasgupta (2010) “Paper 12: Bangladesh Phase 2”, Global Financial Crisis Discussion Series, Overseas Development Institute, London.
Stern, N. (2007) The Economics of Climate Change: The Stern Review. Cambridge, UK: Cambridge
University Press.
UNDP (2011) UNDP Country Programme for Bangladesh 2012-2016, United Nations Development
Programme, New York.
World Bank (2008). Poverty Assessment for Bangladesh: Creating Opportunities and Bridging the East-
West Divide. Report No. 44321-BD. Washington DC.
World Bank (2010a) World Development Report 2010: Development and Climate Change, The World Bank, Washington DC.
World Bank (2010b) Bangladesh Country Assistance Strategy FY 2011-2014, Bangladesh Country Management Unit, South Asia Region, World Bank, Washington DC
World Bank (2011a) “The Cost of Adapting to Extreme Weather Events in a Changing Climate”,
Bangladesh Development Series, Paper No. 28, The World Bank, Washington DC.
World Bank (2011b) Bangladesh Economic Update – September 2011, PREM-South Asia, The World Bank, Washington DC.
April 30, 2012 Draft
19
World Bank (2011c) More and Better Jobs in South Asia, The World Bank, Washington DC.
Yu, W., J. Thurlow, M. Alam, A. Hassan, A.S. Khan, A. Ruane, and C. Rosenzweig (2010) Climate Change Risks and Food Security in Bangladesh. London: Earthscan.