Climate of the Carpathian Region. A JRC tender for high ...
19
Climate of the Carpathian Region. A JRC tender for high resolution gridded database Sandor Szalai Szent Istvan University [email protected]
Transcript of Climate of the Carpathian Region. A JRC tender for high ...

Climate of the Carpathian Region. A JRC tender for high resolution
gridded database
Sandor Szalai
Szent Istvan University

Content
• State of the art
• Background of the project
• Objectives
• Structure
• Timetable
• Expected outcomes
Problems of the climate data availibility
• Atmosphere is the fastest part of the climate system
• WMO and taxpayers’ money
• Difference between US and Europe
• Clear tendency of enlargement of freely available data(bases)
• Regional Climate Centres: on Climate Data in De Bilt(NL): eca.knmi.nl/

Solutions (?) Gridded databases
• ERA databases (40, Interim, Clim, 65), backcasting, model calculations
• EUMETGRID, European-wide
• EEA-ECMWF co-operation
Raw data
• RCC
• Subregional databases
• European Climate Atlas (ECSN)
• Economical troubles (expensive network)

National/international needs
• The problem is larger at smaller countries with complex topography
• Near border problems
• Different instruments
• Different data management tools
• Comparability is requested (harmonisation)

Background of the project
• Hungarian initiative in the Environmental Committee at the European Parliament in 2008
• Accepted by the Economical Committee and the Plenary in 2008
• Preparation of the tender by DG Environment and JRC Ispra in 2009
• Call in June 2010

Countries and participants • Bulgaria, Czech Republic, Croatia, Hungary,
Moldova, Poland, Romania, Serbia, Slovakia, and Ukraine
• (Hydro)meteorological institutes and services of Czech Republic, Slovakia, Austria, Poland, Ukraine, Serbia, Hungary, and the National Research and Development Institute of Environmental Protection of Romania and the Szent Istvan University from Hungary. The Croatian Hydrometeorological Service takes part in the project as well. Slovenia supports the initiative

Territory
• For the production of the digital climate atlas, the resulting climatological grids should cover the area between latitudes 50°N and 44°N, and longitudes 17°E and 27°E, approximately.

Map

Structure
• Module 1: Improve the availability and accessibility of a homogeneous and spatially representative time series of climatological data for the Carpathian Region through data rescue, quality control, and data homogenisation.
• Module 2: Ensure Carpathian countries data harmonisation with special emphasis on across-country harmonisation and production of gridded climatologies per country.
• Module 3: Develop a Climate Atlas as a basis for climate assessment and further applied climatological studies, create publicly accessible dedicated web site of the Climate Atlas, including a web map server and data download/access infrastructure, freely available gridded climatological datasets and searchable metadata catalogue for the Climate Atlas.

Timetable

Set of meteorological variables in daily temporal resolution to be provided (1)
Variable Description Units
Ta 2 m mean daily air temperature °K
Tmin Minimum air temperature from
18:00 to 06:00
°K
Tmax Maximum air temperature from
06:00 to 18:00
°K
p Accumulated total precipitation
from 06:00 to 06:00
mm
DD 10 m wind direction 0°-360°
VV 10 m horizontal wind speed m/s
Sunshine Sunshine duration hours
cc Cloud cover octas

Set of meteorological variables in daily temporal resolution to be provided (2)
Variable Description Units
Rglobal Global radiation MJ/m2/day
RH Relative humidity %
pvapour Surface vapour pressure hPa
pair Surface air pressure hPa
Snow depth Snow depth mm

Minimum set of variables and indicators to be provided for the Digital Climate
Atlas of the Carpathian Region No Variable/Indicator Description Units Frequency
1 T Average air temperature (2 m) °K Daily
2 T Average mean air temperature (2 m) °K Monthly, yearly
3 Tmin Minimum air temperature from 18:00 to 06:00 °K Daily
4 Tmin Average minimum air temperature °K Monthly, yearly
5 Tmax Maximum air temperature from 06:00 to 18:00 °K Daily
6 Tmax Average maximum air temperature °K Monthly, yearly
7 Precipitation Accumulated total precipitation from 06:00 to 06:00 mm Daily
8 Precipitation Accumulated total precipitation mm Monthly, yearly
9 u_10m_max Maximum 10 m horizontal wind speed m/s Daily
10 u_10m Average 10 m horizontal wind speed m/s Daily, monthly
11 u_2m Average 2 m horizontal wind speed m/s Daily, monthly
12 Sunshine Sunshine duration hours Daily, monthly, yearly
13 Cloud cover Average cloud cover octas Daily, monthly
14 Radiation Measured global radiation MJ m-2 day-1 Daily, monthly
15 R.H. Average relative humidity % Daily, monthly
16 p_vap Mean vapour pressure hPa Daily, monthly
17 p_air Mean surface air pressure hPa Daily, monthly
18 Snow depth Snow depth mm Daily, monthly
19 Snow water Snow water equivalent mm Daily, monthly
20 Frost days Number of frost days - Monthly, yearly
21 Summer days Number of days with Tmax above 25 °C - Monthly, yearly
22 Hot days Number of days with Tmax above 30 °C - Monthly, yearly
23 PAI Palfai Drought Index - Yearly
24 SPI -3 Standardized Precipitation Index averaged over a three-months period - Monthly
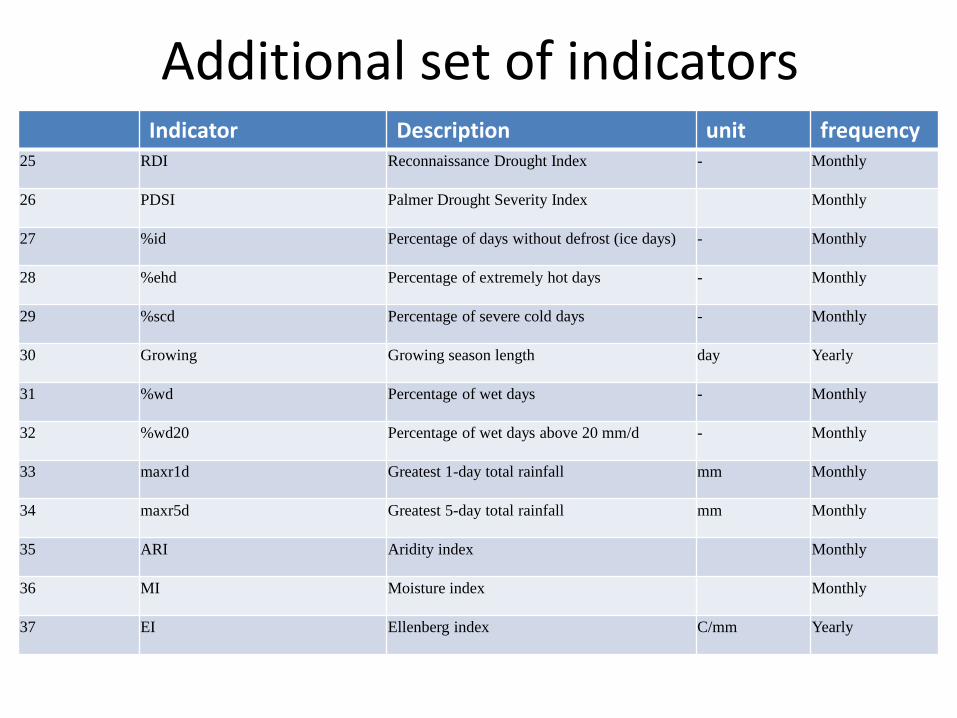
Additional set of indicators Indicator Description unit frequency
25 RDI Reconnaissance Drought Index - Monthly
26 PDSI Palmer Drought Severity Index Monthly
27 %id Percentage of days without defrost (ice days) - Monthly
28 %ehd Percentage of extremely hot days - Monthly
29 %scd Percentage of severe cold days - Monthly
30 Growing Growing season length day Yearly
31 %wd Percentage of wet days - Monthly
32 %wd20 Percentage of wet days above 20 mm/d - Monthly
33 maxr1d Greatest 1-day total rainfall mm Monthly
34 maxr5d Greatest 5-day total rainfall mm Monthly
35 ARI Aridity index Monthly
36 MI Moisture index Monthly
37 EI Ellenberg index C/mm Yearly

Outcomes
• High-resolution (10 km*10 km) freely available databases
• Data availability on monthly and daily level
Benefits
• Development possibilities in the agriculture, hydrology and forestry
• Modelling possibilities for spatial distribution of species
• Strong development in the applied sciences
• Damage estimation, crop-yield forecast
• Development of early warning systems
• More accurate determination of crop sites

Acknowledgement
• Author thanks to European Comission, Joint Research Centre, Institute for Environment and Sustainability, Ispra, Italy for Contract Notice OJEU 2010/S 110-166082 dated 9 June 2010

Thank you for your attention!