Climate Models
24
Climate Models The Changing Climate ATS 320 Lecture 14 November 2, 201 5
-
Upload
andreas-schmittner -
Category
Education
-
view
23 -
download
0
Transcript of Climate Models

Climate Models
The Changing Climate ATS 320
Lecture 14 November 2, 2015

RecapNathan Van Cleave
Miguel Velasco

ThisLecture
3
Ryan Watts Leo Williamson

Climate Models
Equations based on conservation of
• mass
• momentum
• energy
• water
• carbon
• ...

Components Included• Atmosphere
• Ocean
• Sea Ice
• Land Surface (sometimes with interactive vegetation)
• Ocean Biology and Chemistry (e.g. Carbon, Nutrient, and Oxygen Cycles)
• (Ice Sheets, usually prescribed)
Models that include biogeochemistry are also often called Earth System Models

Hierarchy of Climate Models
• 0D Energy Balance Model (EBM)
• 1D EBM
• 1D Radiative-Convective Models
• Intermediate Complexity Models (e.g. 2D EBMs)
• 3D General Circulation Models (GCMs)
Increasing Com
plexity

Energy Gain:Absorbed solar
(shortwave) radiationFSW=(1-a)S
Energy Loss:Emitted terrestrial
(longwave) radiationFLW
0D Energy Balance Model:
C∂T/∂t = FSW - FLW
T
Heat CapacityTemperature
change with time

C∂T(φ)/∂t = FSW - FLW + Fin - Fout
T(φ)
φ
Transport
Fout
Fin
1D Energy Balance Modelsolves energy balance separately in
different latitude (φ) bands, includes (meridional) heat transport between the bands.
Only one single vertical layer is considered.
Earth receives less solar energy per square meter at poles than
at the equator

C∂T(φ,λ)/∂t = FSW - FLW + Fin - Fout
φ
Transport
2D Energy Balance Model
λ
solves energy balance separately in each grid box on a latitude-longitude (φ,λ) grid
with transport between the boxes
T(φ,λ)
Only one single vertical layer is considered.

1D Radiative Convective Models
height z
Surface
shortwaveradiation
longwaveradiation
• Temperature
• Temperature
• Temperature
• Temperature
C∂T(z)/∂t = FSW,in - FSW,out + FLW,in - FLW,out + Convection
• Temperature
Radiative fluxes are calculated similarly as in MOTRANConvection occurs if the stratification becomes unstable. In this case lapse rate is set to the moist adiabatic (6.5 K/km).

Three-Dimensional General Circulation Models (GCMs)
Equations based on conservation of
• mass
• momentum
• energy
• water
• carbon
• ...
Typically global climate models have about 20-30 layers in the atmosphere and about the same amount in the ocean. The horizontal grid box size varies from about 5 degrees (500 km) to about 1 degree (100 km) or less. Models with smaller grid box sizes resolve more details (higher resolution), but they are also more computationally expensive to run.

Parameterizations
• Processes that cannot be resolved (smaller than grid box size need to be expressed in terms of resolved quantities; often empirical formulas)
• Examples are clouds, convection (atmosphere), and mixing (ocean)

Forcings
• Models are driven by boundary conditions, e.g. incident shortwave radiation at the top-of-the-atmosphere, surface properties (albedo)
• Interior is solved without the use of observations

http://www.image.ucar.edu/~nychka/Animations/BTSCAMT340.mp4http://www.image.ucar.edu/~nychka/talks.html
http://vets.ucar.edu/vg/T341/
High-Resolution Climate Model1024x512 grid points (30 km)
Water vapor

Model Evaluation
Models are tested by comparing results to observations.

IPCC 2013, Fig. 9.2
Surface (2 m) Air Temperature
30-40 different climate models from 10-20 different research institutions have participated in the 2013 IPCC. The multi model mean is the average of all models. The right panel shows the differences between the models and observations.

SeasonalityDecember-January-February minus June-July-August
Models overestimate seasonality over land and underestimate it over the ocean.
IPCC 2013, Fig. 9.3

Precipitation
Models do less well in simulating precipitation.
Why?
Because precipitation is very intermittent and depends strongly on the simulation of clouds
and convection, which are parameterized.
IPCC 2013, Fig. 9.4
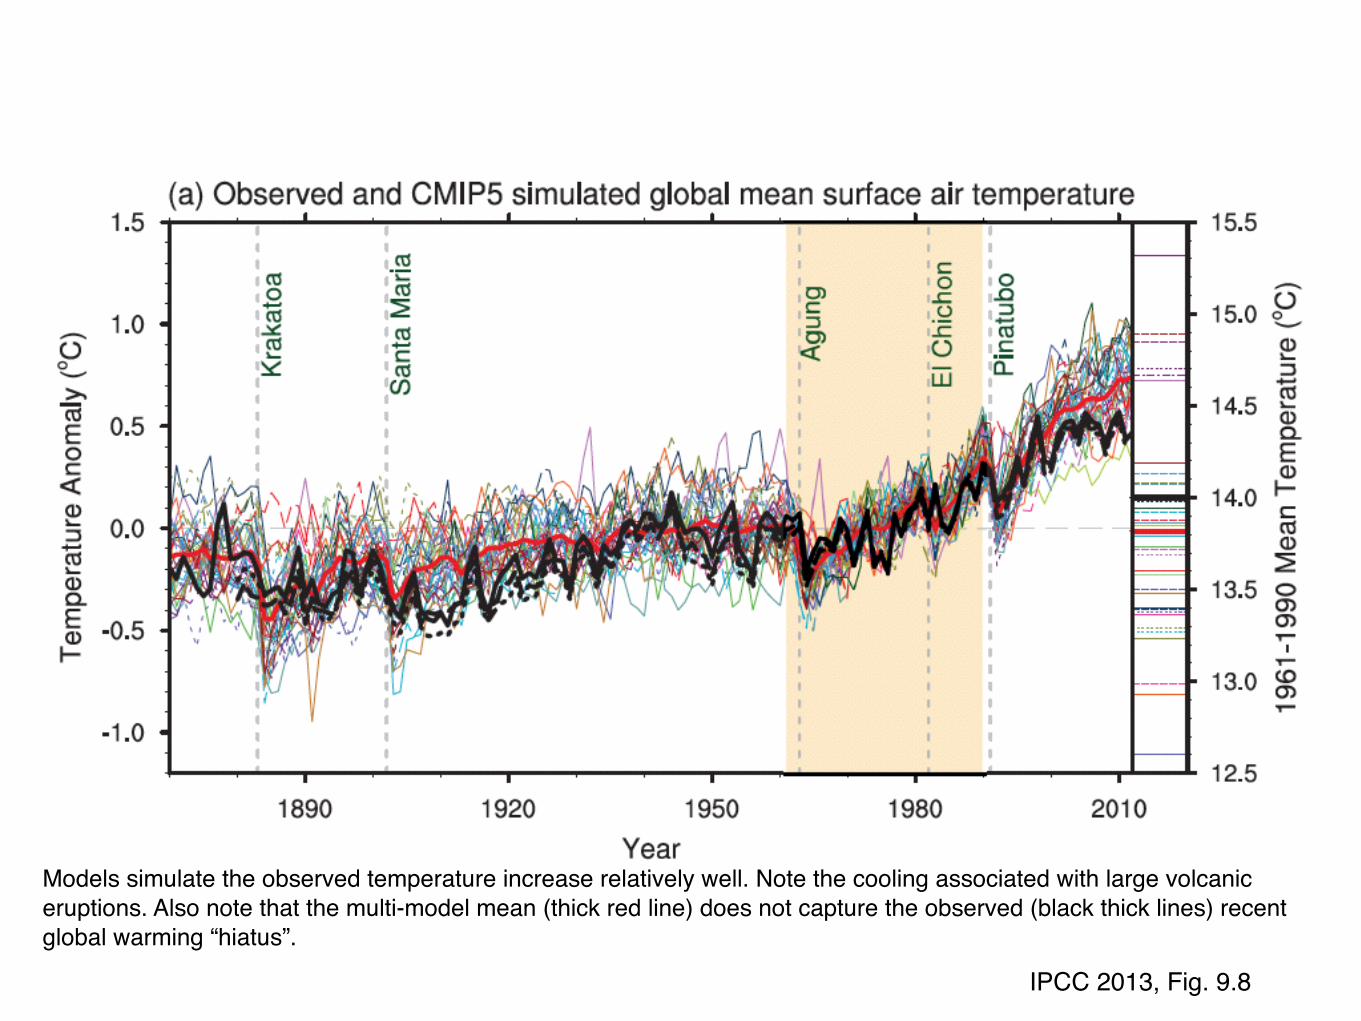
Models simulate the observed temperature increase relatively well. Note the cooling associated with large volcaniceruptions. Also note that the multi-model mean (thick red line) does not capture the observed (black thick lines) recent global warming “hiatus”.
IPCC 2013, Fig. 9.8

Ocean Temperatures & Salinities
Black: Mean Values from Observations; Color: Multi Model Mean Bias (difference from observations)
IPCC 2013, Fig. 9.13

Black=Observations, Red=Multi Model Mean, Others: Individual Models

What are climate models used for?
• Paleoclimate Studies
• Detection and Attribution
Is climate changing significantly and if so why?
• Projections
How may climate change in the future?

Detection and Attribution of Climate Change
IPCC 2013 FAQ 10.1

Summary• Climate models are tools in climate research
• They range from simple (0D-EBMs) to complex (3D-GCMs)
• They work by solving conservation equations in boxes
• They are evaluated by comparison to observations
• Applications are: detection and attribution, projections, paleoclimate studies