CLIMATE MODELLING AT VINEYARD SCALE IN A CLIMATE …
41
Page | 1 CLIMATE MODELLING AT VINEYARD SCALE IN A CLIMATE CHANGE CONTEXT
Transcript of CLIMATE MODELLING AT VINEYARD SCALE IN A CLIMATE …

Page | 1
CLIMATE MODELLING AT VINEYARD
SCALE IN A CLIMATE CHANGE CONTEXT

Page | 2

Page | 3
CLIMATE MODELLING AT VINEYARD SCALE IN A
CLIMATE CHANGE CONTEXT
COORDINATORS
Kees van Leeeuwen1
Laure de Rességuier1
Valérie Bonnardot2
Hervé Quénol2
AUTHORS
Renan Le Roux2
Etienne Neethling3
Théo Petitjean1
Liviu Irimia4
Cristi Valeriu Patriche4,5
1UMR1287 EGFV, Bordeaux Science Agro/INRA, ISVV, 210 Chemin de Leysotte, F-33883 Villenave d'Ornon (France) 2UMR6554 LETG-Rennes, CNRS, Université Rennes 2, Place du recteur Henri le Moal, 35043 Rennes (France) 3UR-GRAPPE, ESA, 55 rue Rabelais, 49007 Angers (France) 4 University of Agricultural Sciences and Veterinary Medicine, Iași, (Romania) 5 Romanian Academy, Iaşi Branch, Geography Group, (Romania)
With the collaboration of G. Santesteban (UPN), S. Roger (ESA), M. Hofmann (HGU), M. Stoll (HGU), C. Foss (PC), C. Cortiula (PC)
http://www.adviclim.eu/ Copyright © LIFE ADVICLIM
With the contribution of the LIFE financial instrument of the European Union
Under the contract number: LIFE13 ENVFR/001512

Page | 4

Page | 5
Table of contents FOREWORD INTRODUCTION Part 1: General understanding of climate change modelling at vineyard scale
Climate Change Scenarios modelling
Climate change modelling: from global to local scale
Climate change modelling and viticulture
Methodology developed in the ADVICLIM project
Bibliography
Part 2: Shifts in climate suitability for wine production as a result of climate change in wine regions of LIFE-ADVICLIM project
Part 3: Regional approach of climate change modelling
Part 4: Climate modelling at vineyards scale in a climate change context
Huglin and Winkler indices
Grapevine Flowering Veraison model (GFV)
7 9 11
12
13
14
16
17
19
24
27
28
34

Page | 6

Page | 7
FOREWORD Across the earth, there is growing evidence that a global climate change is taking place. Observed regional changes include rising temperatures and shifts in rainfall patterns and extreme weather events. Over the next century, climate changes are expected to continue and have important consequences on viticulture. They vary from short-term impacts on wine quality and style, to long-term issues such as varietal suitability and the economic sustainability of traditional wine producing areas. As a result, the wine industry is facing many challenges, which includes adapting to these potential impacts, as well as reducing greenhouse gas emissions related to their activities. In response to these challenges, the LIFE-ADVICLIM project has the objective to evaluate and develop local climate change
adaptation and mitigation strategies. The measurement network and web platform of this project seeks to inform and assist winegrowers on climate change impacts, on rational adaptation scenarios and on greenhouse gas emissions related to their practices at the scale of their vineyard plots. These technologies are evaluated in many European wine growing regions (Figure 1), namely Bordeaux and Loire Valley (France), Sussex (England), Rheingau (Germany) and Cotnari (Romania). The region of Navarra (Ausejo and Carbonera vineyards) in Spain is a non-official study area. These six regions represent the climatic diversity of European wine, ranging from the Mediterranean to Oceanic and Continental climates. For more information on this project, visit www.adviclim.eu
Figure 1: Position of the six European wine growing regions that are studied in the LIFE-ADVICLIM project.

Page | 8

Page | 9
INTRODUCTION
For most wine growing regions, significant trends in regional climates have been observed.
At the same time, important changes in grapevine phenology and grape composition have
occurred, with the latter leading to altered alcohol levels and sensory profiles. Although
changes in grapevine behaviour are partly attributed to evolving practices, recent climate
changes, in particular increasing temperatures, have been major causal factors. As a result,
future climate changes are very likely to have key effects on wine quality and style, which
over the long term may cause geographical shifts in suitable grapevine varieties and
production areas. A changing climate is therefore one of the major environmental and socio-
economic issues facing sustainable viticultural development and production over the next
century.
Various studies on vine’s climate adaptability under different climate change scenarios show
that we can expect major upheavals at global level, with the disappearance of some wine-
growing regions by 2100. These studies, based specifically on climate simulation, propose
fairly “brutal” methods to adapt to climate change, for instance moving wine-growing
regions or changing varietals. Studies on the impact of climate change only cover major
global wine regions, however, without taking into account the spatial variability of climate
on finer scales. However, atmospheric parameters at the level of the boundary layer depend
on surface conditions (surface roughness and type), and these can cause significant spatial
variability in relatively small areas (from a few square metres to a few square kilometres). A
wine’s specific features are determined by these fine-scale variations (e.g. slope, exposure,
type of soil, etc.), and it is at the scale of the plot that winemakers manage their estate and
adapt to the climate, notably by agricultural practices (tillage, work on the vine, etc.). The
spatial variability of climate at local scale should therefore be taken into account when
defining a rational climate change adaptation policy (Quénol et al, 2014).

Page | 10
The manual is divided into four parts:
The first part provides a general introduction to climate change modelling in viticulture sector. The objective is to present the methodology developed to build agro-climatic models adapted to the scale of the LIFE-ADVICLIM project vineyards. The second part aims to present climate change over the past 60 years in the regions of each pilot site. The calculation of specific indicators for vines and wine has enabled the recent climate change at the level of European vineyards of the LIFE-ADVICLIM project to be analysed. This part provides the modelling of bioclimatic indices from the outputs of regional climate change models (EuroCordex data). These maps were produced for the future periods 2031-2050 and 2081-2100 in comparison with a 1986-2005 reference period for RCP4.5 and RCP8.5. The fourth part aims to present a fine-scale mapping of projected bioclimatic indices and phenological modelling according to climatic change scenarios (RCP4.5 a,d RCP8.5) by 2031-2050 and 2081-2100 at the scale of each LIFE-ADVICLIM pilot site.
PART 1:
PART 2:
PART 3:
PART 4:

Page | 11
PART 1: CLIMATE CHANGE MODELLING IN
VITICULTURE SECTOR
Climate Change Scenarios modelling
Since climate change and its effects are already perceptible, climate projections are needed
to understand the expected impacts and help inform adaptation planning and policy. To
perceive future climate changes, projections of greenhouse gas emissions vary over a wide
range, depending on both socio-economic development and climate policies. The
Intergovernmental Panel on Climate Change (IPCC) assessed the future evolution of variables
controlling climatic conditions; especially the evolution of the greenhouse gases due to
human activities according to different socio-economic scenarios. These studies showed
different climate evolution for Earth.
The latest scenarios on greenhouse gases are the RCP (Representative Concentration
Pathways) and replace the SRES (Special Report on Emission Scenarios). These scenarios are
issued from an international project gathering 30 climatic centres: the CMIP-5 (Coupled
Model Inter comparison Project) aiming to assess Atmosphere-Ocean General Circulation
Models (AOGCMs) for the next decades. Four main scenarios were kept (IPCC, 2014) (figure
1):
Figure 1. Framework and projections of future climate models. source: Moss et al, 2010 and IPCC, 2013

Page | 12
Climate change modelling: from global to local scale
The adaptation of viticulture to climate change is crucial and should be based on simulations
of future climate. Different types of model exist to represent climate on Earth at various
scales. At the global scale, General Circulation Models (GCMs) are mainly used as the basis to
build climate change scenarii that estimate trends in climate variables like temperature,
rainfall and wind globally, at low spatial resolution (~300 km). Obviously, these kinds of
models are not suitable for considering temperature variability at vineyard scale. The global
climate models do not have a fine enough resolution for wine-growing region or vineyard
scale impact studies. This is why many studies are attempting to create models able to
disaggregate the overall climate signal at regional scales. Regional circulation models of the
atmosphere, or mesoscale models, can represent finer resolutions than global models, of the
order of a kilometer or even a few hundred meters (Table 1).
Table 1. The spatial and time scales and areas of application of climate models (Cautenet and Bonnardot, 2014 ; Quénol et al. 2017).
Climate models
Spatial resolution
Temporal resolution
Scale Application
Global Circulation
Models (GCM)
From 5° to 0.5°
(500 to 50 km)
From 10 years to several hundred
years
Global
Modeling of atmospheric general circulation
Modeling of global warming
Global with varying
resolution
(VRGCM)
From 1° to 10-12 km
More than 10
years to several hundred years
Global and
regional
Weather forecast
Modeling of global warming
Regional Circulation
Models (RCM)
From 50 km to 200 m
(imbricated grids)
Hourly to
several days
Regional and local
Weather forecast
Meso-scale climate modeling
• RCP 8.5: This RCP is consistent with a future with no policy changes to reduce emissions. It was developed by the International Institute for Applied System Analysis in Austria and is characterised by increasing greenhouse gas emissions that lead to high greenhouse gas concentrations over time.
• RCP 6.0: There is a raise of greenhouse gases emissions until the 2080’s followed by a decrease.
• RCP 4.5: same as RCP 6.0 but the decrease starts around the 2040’s.
• RCP 2.5: This RCP is consistent with a future with policy changes to reduce emissions and is characterised by decreasing greenhouse gas emissions that lead to limit the warming to 2°C by 2100.
REPRESENTATIVE CONCENTRATION PATHWAYS

Page | 13
The use of Regional Circulation Models allows a scalar disaggregation of spatial patterns
obtained from global models, but the need for significant computing capacity makes it
difficult to achieve satisfactory results at a very fine scale. The interweaving of various
atmospheric phenomena in terms of the overlapping of scales (from local to synoptic) makes
this type of modelling impracticable at a very detailed level. To overcome these limitations,
advanced statistical methods (e.g. non-linear regression Support Vector Regression) are used
to perform spatial interpolation of climate data obtained at fine scales. These methods are
based on establishing the relationship between surface characteristics (e.g. landscape
morphology and land use) and weather variables. In this type of study, the existence of a link
between climate elements and topographic characteristics is then evaluated spatially across
a study site. Spatial interpolation using multiple regression has the advantage of being
adapted to local scales.
Figure 2. Local-scale climate modelling approach, based on measurements from a climate sensors network established to reflect local factors
Fine scale climate analysis based on measurement and modelling cannot estimate the future
climate. However, integrating local climate variability (validated by measuring actual data)
into regional and local climate change models reduces uncertainties for climate impact
studies in the context of climate change. This approach in adapted to viticulture. Changes in
atmospheric parameters are very important over relatively small areas (of the order of a few
kilometres to a few meters) and the quality of grapes and wine is often related to these local
characteristics (slope, soil, etc.).
Climate change modelling and viticulture
The provision of regionalized climate data from climate models (Coupled Model
Intercomparison Project, CMIP 4 and 5), has allowed to map climate variability in connection
with the evolution of the potential viticulture areas (past, present and future). Climate

Page | 14
change modelling at winegrowing regions are based on calculations of bioclimatic indexes
according to scenarios of climate change. Bioclimatic indices are a useful zoning tool,
defining a region’s ability to produce grapes, varietal suitability, etc.
Table 2. Winkler index classes (from Winkler et al., 1974)
Table 3. Huglin index classes (from Huglin, 1978, Tonietto, 1999)
Class Values (°C) General ripening capability and wine style
Region Ia 850–1111 Only very early ripening varieties achieve high quality, mostly hybrid grape varieties and some V. vinifera.
Region Ib 1111–1389 Only early ripening varieties achieve high quality, some hybrid grape varieties but mostly V. vinifera.
Region II 1389–1667 Early and mid-season table wine varieties will produce good quality wines.
Region III 1668–1944 Favorable for high production of standard to good quality table wines.
Region IV 1945–2222 Favorable for high production, but acceptable table wine quality at best.
Region V 2223–2700 Typically only suitable for extremely high production,
fair quality table wine or table grape varieties destined for early season consumption are grown.
Climate class Abreviation Values (°C)
Very cool HI-3 ≤ 1500
Cool HI-2 > 1500 ≤ 1800
Temperate HI-1 > 1800 ≤ 2100
Temperate-warm HI+1 > 2100 ≤ 2400
Warm HI+2 > 2400 ≤ 3000
Very warm HI+3 > 3000
The two main indices used in viticulture are the Winkler and Huglin Indices (table 2 and 3). The former refers to the concept of growing degree-days, which is calculated as the sum of daily mean temperatures above 10°C for the period of April to October in the Northern Hemisphere. The base temperature of 10°C refers to the minimum temperature necessary for grapevine physiological activity. The interest in using the Winkler Index is that the cumulated heat is strongly correlated with grapevine phenology. The Huglin Index differs, as it is the sum of the mean and maximum temperature above 10°C from April to September in the Northern Hemisphere. It gives greater weight to daytime temperatures, when most vine development takes place and is therefore strongly correlated with berry composition at harvest.
BIOCLIMATIC INDEX AND PHENOLOCIAL MODEL

Page | 15
Methodology developed in the ADVICLIM project
• Climate modelling at vineyards scale in the present climate change context
Climate change is causing important shifts in the suitability of regions for wine production.
Fine scale mapping of these shifts helps us to understand the evolution of vineyard climates,
and to find solutions through viticultural adaptation. The aim of this study is to identify and
map the structural and spatial shifts that occurred in the climatic suitability for wine
production of European regions of the LIFE-ADVICLIM project between 1951 and 2013.
Discontinuities in trends of temperature were identified, and the averages and trends of 13
climatic parameters for the 1951 to 1990 and 1991 to 2013 time periods were analysed.
Using the averages of these climatic parameters, climate suitability for wine production was
calculated at a resolution of 30 m and mapped for each time period, and the changes
analysed (Irimia et al., 2018).
• Climate modelling at vineyards scale according to climate change future scenarios
At regional scale, climate (temperature and precipitation) data were collected from
automatic weather station from national networks for present years. Climate change model
data are available from EuroCordex project (0.11° resolution) for all new IPCC scenarios (RCP
as described above). These data can be used to map bioclimatic indices (Winkler, Huglin) at
regional scale according to the RCP scenarios. Moreover, for all sites, a network of data
loggers has been established to collect air temperature inside the grapevine canopy. Data
loggers were evenly distributed with regard to slope, elevation and aspect to take into
account local parameters impacting the local temperature distribution. A statistical
modelling with daily temperatures as dependent variables and topographic parameters as
predictor was used to model temperature and create accurate fine scale maps of daily
temperature (Le Roux et al, 2017). To assess local scale for climate change projection, a
downscaling method based on weather pattern detection was created. A first step consisted
of detecting the days presenting similar climatic parameters to weather station data for fine
scale measurements period based on wind speed, precipitation and temperature. The
pattern recognition algorithm adopted in this study was based on Self-Organizing Maps
(SOM), it is an unsupervised learning using artificial neural network (Kohonen, 2012). Then
fine scale daily maps were associated to these nodes. For each day of the future scenarios,
the same regional patterns were identified and associated with the corresponding fine scale
maps, creating fine scale maps for each day of the period 2005 – 2100 for RCP 8.5 (Figure 3).
Average growing degree-days (April 1st to March 31th), and Huglin index was computed at
midterm (2031-2050) and long term (2081-2100).

Page | 16
Figure 3: Workflow used to produce fine scale maps for historical and future period (Le Roux et al., 2018)
Bibliography
■ Bonnardot V., Cautenet S., Cautenet G., Déqué M., Quénol H. (2014) : Modélisation méso-échelle du changement climatique : le cas des vignobles français. In Changement climatique et terroirs viticoles, Lavoisier Tec&doc, 327-332.
■ Hannah L. et al., 2013: Climate change, wine, and conservation, PNAS, 2013, 110, 17, 6907-6912.
■ Huglin P. (1978): Nouveau mode d’évaluation des possibilités héliothermiques d’un milieu viticole. Comptes rendus des séances de l’Académie d’agriculture de France, 64, 1 117-1 126.
■ IPCC (2014): Climate Change 2014: synthesis report. Contribution of Working Groups I, II and III to the Fifth Assessment Report of the Intergovernmental Panel on Climate Change. Core Writing Team, Pachauri RK, Meyer LA (eds.), IPCC, Geneva, Switzerland.
■ Irimia L. M., Patriche C. V., Quénol H., Sfîcă L., & Foss C. (2018): Shifts in climate suitability for wine production as a result of climate change in a temperate climate wine region of Romania. Theoretical and Applied Climatology, 1-13.DOI 10.1007/s00704-017-2033-9
■ Kohonen T. (2012): Self-organization and associative memory. Springer Science & Business Media, 312p.
■ Le Roux R., de Rességuier L., Corpetti T., Jégou N., Madelin M., Van Leeuwen C., & Quénol H. (2017): Comparison of two fine scale spatial models for mapping temperatures inside winegrowing areas. Agricultural and Forest Meteorology, 247, 159-169. https://doi.org/10.1016/j.agrformet.2017.07.020
■ Le Roux R., Van Leeuwen C., de Rességuier L., Neethling E., Irimia L., Patriche C., Santesteban G., Stoll M., Hoffman M., Foss C., Bonnardot V., Planchon O. and Quénol H., 2018: Climate modeling at vineyards scale in a climate change context. XII Terroir Congress, Zaragoza, 18th-22nd of June 2018.
■ Parker A. et al., 2013: Classification of varieties for their timing of flowering and veraison using a modeling approach. A case study for the grapevine species Vitis vinifera., Agricultural Forest Meteorology, 180, 249-264.
■ Parker, A.K., de Cortazar-Atauri, I.G., van Leeuwen, C., Chuine, I., 2011: General phenological model to characterize the timing of flowering and veraison of Vitis vinifera L. Aust. J. Grape Wine Res. 17 (2), 206–216.

Page | 17
■ Quénol H. (2014): Changement climatique et terroirs viticoles. Lavoisier Editions Tec & Doc, Paris.
■ Quénol H. (2017): Viticulture – experimentation or adaptation? In Adaptating to Climate Change. Thiebault S., Laville B. and Euzen A., ediSens, 333-340.
■ Tonietto J. (1999): Les macroclimats viticoles mondiaux et l’influence du méso climat sur la typicité de la syrah et du muscat de Hambourg dans le sud de la France : méthodologie de caractérisation. Thèse doctorat, Ecole nationale supérieure agronomique, Montpellier.
■ Van Leeuwen C., et al., 2013: Why climate change will not dramatically decrease viticultural suitability in main wine-producing areas by 2050, PNAS, vol. 110,n° 33, E3051-E3052.
■ Winkler A., Cook J., Kliewer W., Lider L. (1974): General Viticulture. University of California Press, Berkeley.

Page | 18
PART 2: SHIFTS IN CLIMATE SUITABILITY FOR
WINE PRODUCTION AS A RESULT OF CLIMATE
CHANGE IN WINE REGIONS OF LIFE-ADVICLIM
PROJECT
Following the results of the analysis on climate evolution in the Cotnari pilot site (Romania),
where observed climatic change between 1961-2010 brought climate suitability for the red
wine production (https://link.springer.com/article/10.1007%2Fs00704-017-2033-9), LIFE-
ADVICLIM researches revealed similar evolutions, with climatic trends favourable to
increasing quality of wines in all the other pilot sites of the project. The assessment of the
impact of climate change on suitability for the wine production was based on the analysis of
the Huglin index values over 2 periods; I.e. 1951-1990 and 1991-2013 (before and after a
identified statistical breakpoint in the times series) using daily data of national weather
station networks. As mentioned in Part 1, Huglin index (HI) is a viticulture index revealing
climate suitability for the cultivation of various cultivars and implicitly the production of
certain types of wine production (Huglin, 1978). Its values vary between less than 1500 and
more than 3000, framing into 6 classes characterizing different climate suitability's (Table 3
of Part1).
Using the mean Huglin values (HI) and its difference between the 1991-2013 period and the
1951-2013 period, results of ADVICLIM showed an increase of 216 units on average for the 6
pilot sites, with a minimum of +165 units in the Cotnari pilot site (Romania) under
continental conditions and a maximum of 286 units in the Saint Emilion pilot site (France)
under warm maritime conditions. In most of the pilot sites, the difference between the two
periods showed a shift in the higher class of climate suitability for the wine production. In
Spain, at Ausejo, suitability conditions shifted from the temperate to the warm temperate
class suitable for the Grenache, Mourvèdre and Carignan Mediterranean varieties. Higher
altitudes such as Carbonera (850 m asl) contributed to enlarge climate suitability in this
region. Similar pattern were identified in the Saint Emillion pilot site, shifting from the
temperate to the warm temperate class, suitable also for the Mediterranean wine grape
varieties Grenache, Mourvèdre, Carignan. The Coteaux du Layon and Saumur Champigny
regions in the Loire Valley as well as Cotnari pilot site in Roumania shifted from the cool class
to the temperate class, suitable for Cabernet Sauvignon and Syrah red varieties. Rudesheim
in Germany shifted from the very cool class (not recommended for cultivation), to cool class,
suitable also for Pinot noir, Merlot or Cabernet franc. At last, with a 135-unit increase,
Plumpton pilot site moved to the upper level of the very cool class (not recommended for
cultivation) getting closer to shift into the upper cool climate class.

Page | 19
The HI distribution was further analysed using the percentage of membership in the
different classes between 1950 and 2013 (rather than in average as indicated above) to
better describe and quantify the shift in climate suitability for viticulture: in Ausejo, where
98.25% of the area was characterized between 1951-1990 by the HI temperate class, 100%
of the surface is at present (1991-2013) characterized by the warm temperate class;
Carbonera at higher altitude passed from 34% of very cool to 35% of temperate and a
difference of 64% cool between both time periods; in Saint Emilion, the temperate class
which in the past characterized 100% of the area is currently limited at 6.78%, giving way at
93.2% to temperate-warm class. In the Coteaux de Layon and Saumur Champigny pilot sites,
about 45% of the surface is currently characterized by the temperate class, while before the
90’s its entire surface was characterized by the cool class. Regarding the Rudesheim pilot
site, the very cool class which represented in the past 68% of the area has totaly
disappeared over the 1991-2013 period and the entire area is now characterized by the cool
class.
Our data indicate that these developments are taking place amid the increase in the average
temperature of the growing season by 0.97 °C between 1951-2013 at the level of all pilot
sites, with a maximum increase of 1.3 °C in Saint Emilion (France) and a minimum increase of
0.8°C in Plumpton (UK) and Cotnari (Romania). At the same time, different precipitation
patterns are observed, generally suitable for the wine growing. A decrease or stability in
rainfall was observed in the cooler areas of Plumpton, Rudesheim and Cotnari (-16.7 ... + 3.8
mm), while a slight increase was observed in the warmer areas of Ausejo, Carbonera,
Bordeaux and the Loire Valley (+ 16.7 ... + 50 mm). Please, see below figures 4ab to 10ab.

Page | 20
Figure 4: Coteau du Layon (France) - Huglin Index for 1951-1990 (a) and 1991-2010 (b)
Figure 5: Saumur Champigny (France) - Huglin Index for 1951-1990 (a) and 1991-2010 (b)
Figure 6: Pomerol/Saint Emilion (France) - Huglin Index for 1951-1990 (a) and 1991-2010 (b)
a
a
a
b
b
b

Page | 21
Figure 7: Rheingau (Germany) - Huglin Index for 1951-1990 (a) and 1991-2010 (b)
Figure 8: Navarra/Rioja (Spain) - Huglin Index for 1951-1990 (a) and 1991-2010 (b)
Figure 9: Sussex (United Kingdom) - Huglin Index for 1951-1990 (a) and 1991-2010 (b)
a
a
a
b
b
b

Page | 22
Figure 10 : Cotnari (Romania) - Huglin Index for 1951-1990 (a) and 1991-2010 (b)
a b

Page | 23
PART 3: REGIONAL APPROACH OF CLIMATE
CHANGE MODELLING
As part of the deliverable of Action A1 was a compilation of maps of the projected
temperature (bioclimatic indices) by 2050 and 2100, using the fine-scale geostatistical model
in order to downscale the future climate projections (provided by EuroCordex at 10km-
resolution) at the 5 pilot sites. The range of possible future temperature trends at regional
scale according to two IPCC climatic change scenarios (RCP4.5 and RCP8.5) by 2050 and 2100
at the scale of each site was shown. The spatial distribution of the Winkler and Huglin indices
is given as an example of results (Figure 11 et 12).
a

Page | 24
Figure 11: (a) Mapping of the Huglin Index in ADVICLIM wine growing regions for the period 1986 to 2005 and (b) the changes expected in the Huglin Index for the period 2031 to 2050 and 2081 to 2100 according to the climate scenarios of RCP4.5 and RCP8.5. The red numbers surimposed on the maps highlight the mean increase in degree-days compared to a reference period (1986-2005). (Data source: EURO-CORDEX, R. Vautard).
Figure 12: Winkler Index for the period 2031 to 2050 (top graphs) and 2081 to 2100 (bottom graphs according to the climate scenarios of RCP4.5 (left graphs) and RCP8.5 (right graphs). Data source: EURO-CORDEX, R. Vautard).
b

Page | 25
Average growing degree-days (figure 12) and Huglin index (figures 11 a and b) mapping show
a spatial and temporal evolution of different classes. Relative to the recent past (1986-2005),
the projected increases in the near (2031-2050) and far future (2081-2100) are illustrated in
Figure 11b and 12. For Huglin index, considering the optimistic (RCP4.5) and pessimistic
scenario (RCP 8.5), an increase of 200 to 500 degree-days can be calculated respectively on
average by 2050 compared to the reference period (1986-2005). This means that all the sites
will move upwards into warmer climatic classes or to the upper level of their present class.
For instance, the Loire Valley and Cotnari will likely shift from the "cold" climate class to the
"temperate" class; Bordeaux region from the "temperate" class to the "warm temperate"
class; and Navarra from the "warm temperate" class to the "warm" class. Rüdesheim will
likely shift from the "very cold" class to the "cold/temperate" class. Rock Lodge East Sussex
will likely move to the upper level of the "very cold" class. By 2100 period, the increase in
degree-days compared to the reference period is amplified and is projected to reach
between 500 and 1000 units depending on the site. As a result, according to the pessimistic
RCP8.5 scenario, all ADVICLIM wine regions will likely fall in the "warm" and “very warm”
classes; except Rock Lodge East Sussex, the northernmost pilot site, which will likely fall in
the "temperate" climate class (comparable to Bordeaux current climate).
Regional atmospheric modelling using EuroCordex data was performed in order to integrate
high resolution geostatistical modelling based on both field observations and outputs from
atmospheric models. The results of the testing showed that Regional and local climate
models using statistical downscaling do reproduce the local variability of temperatures in
climate change context

Page | 26
PART 4: CLIMATE MODELLING AT VINEYARDS
SCALE IN A CLIMATE CHANGE CONTEXT
To integrate the local temperature variability at vineyard scale, daily fine scale temperature
maps were produced using the downscaling method previously described (part 1). Then
bioclimatic indices (Huglin and Winkler indices) and the Grapevine Flowering Véraison index
(GFV) were mapped at vineyard scale for RCP scenarios.
Modelling of bioclimatic indices demonstrated, in accordance with the regional scale
approach, an increase in the growing degree-days over the investigated period. But, the
integration of local scale in climate change projections gave more details and highlighted a
great temperature range within each studied site. For example, a difference of more than
300 degrees-days was observed between plots within the Rheingau or in Coteaux du Layon
pilot sites. Given this wide spatial temperature range, maturity could be delayed by three
weeks in the latest ripening parcels, compared to earliest ripening parcels.
To assess this spatial variability of temperatures at local scale, the downscaling method
(presented in Part1) was applied to the Grapevine Flowering Veraison model (GFV).
"Phenological models, which are based on responses of the plant to temperature, are useful
tools to predict grapevine phenology in various climate conditions" (Parker et al., 2011). This
model is based on an extensive dataset (over 4,000 phenology observations collected in 123
sites) and advanced modelling techniques (PMP modelling platform, Chuine et al., 2003). It
allows precise prediction of the timing of major phenological stages (flowering and veraion)
for approximately one hundred cultivars of Vitis vinifera (Parker et al., 2013). This model was
validated at a regional scale. In the ADVIDCLIM project, the GFV model was tested at a very
fined scale in each pilot site.
Combined with regional climate scenarios, analyzing the spatial variability of local climate
(bioclimatic index and phenologic modelling) makes it possible to refine the models’ spatial
resolution and to propose rational adaptation methods at the vineyard scale rather than at
the level of major wine regions. And it is likely that growers will have to change grapevine
varieties in the future due to changing climatic conditions (Hannah et al, 2013; van Leeuwen
et al.,2013). The phenology maps, coupled to established heat requirements for grapevine
varieties, will allow growers to optimize the adjustment of varieties to local climatic
conditions.

Page | 27
MODELLING OF BIOCLIMATIC INDICES AT VINEYARDS SCALE
UNDER FUTURE CLIMATE CONDITIONS The main results of this work are that the spatial variability of climate within the pilot sites is
similar to, if not higher than the rise in temperature (sums of degree/day) between the
current period and future periods (2050 and 2100). Considering the short term, i.e. by 2050,
the trend in the Huglin and Winkler indices is similar whatever the scenario (RCP4.5 or
RCP8.5) under consideration. Considering the long term, by 2100, the results are very
different according to the RCP scenario under consideration. The integration of spatial
variability of local climate into regional climate change models has made it possible to set up
specific adaptation scenarios for the winegrower.
By 2031-2050, as shown in figure 13, the Huglin index is projected to increase by 100 to 400
GDD depending on the region compared to the reference period (1950-2005) while there is a
increase of 100 GDD to 300 GDD within each pilot site. This difference corresponds to 1
climate class. For example, the Huglin index would shift from "Temperate" to "Warm
temperate" classes in Pomerol/Saint Emilion. However, within the pilot site, the northern
part would still be in the "Temperate" class while the other part of the area would be in the
"Warm Temperate" class. On the other hand, by 2081-2100, the Huglin index sharp increase
i.e. between 300 and 500 GDD and between 600 and 1000 GDD for RCP4.5 and RCP8.5
respectively, would lead to a spectacular shift by 2 or 3 climate classes in all pilot sites.
Climate variability within the pilot sites is projected to remain very high. For example, the
Coteaux du Layon would fall under the Huglin index classes ranging from the "Cold" to the
"Warm" classes according to RCP8.5 (in comparison with the reference period). Within the
pilot site, the coldest parts (valley bottom and slopes facing north) would fall under the
"warm temperate" class, while the warmest parts (mid-slope facing south) would fall in the
"warm climate" class (figure 14).
Simulations of the Winkler bioclimatic index show similar results. The Winkler index
combines "climate region types" with general maturation capacity and wine style (table 2).
The results also highlight a change in climate classes with high intra-site variability. The best
climatic conditions for a quality wine (for the current grape varieties) correspond to Regions
II and III. By 2031-2050 (for both scenarios), all pilot sites would correspond to the climate
of classes "region II and III" (except in Sussex vineyard). Intra-site climate variability would
also be very important. For the northern regions, even if the conditions are more favourable
for better grape maturity, the coolest parts of the sites would likely still be in "Region I"
climate types (lower parts of vineyard or slopes facing north in the Loire Valley vineyards and
the highest parts of the vineyard in Geisenheim) (figure 15). By 2081-2100, the results are
very different according to the two scenarios: Under the RCP4.5 conditions, the
northernmost vineyards would have favourable conditions with optimal ripening conditions.

Page | 28
This is the case for Loire Valley, Geisenheim, Cotnari but also for Rioja. The conditions are
unfavourable for Saint Emilion, which would move to Region IV class (over-maturity not
favourable for the production of quality wine for the current grape varieties). However, the
strong spatial variability within the site at Saint Emilion would lead to favourable conditions
in the coolest parts of the site, i.e. the northern part of the appellation. The very high spatial
variability of the climate due to local effects would totally redistribute the sectors that are
more or less favourable for quality viticulture. Under the RCP8.5 scenario, climatic conditions
would be less favourable for the pilot sites of Saint Emilion, La Rioja, Loire Valley and
Cotnari. The Winkler index would be higher for the Geinsenheim and Plumpton pilot sites
(climate classes II and III). Within the pilot sites, classes II and III of Winkler index were
modelled over the entire Geisenheim and Plumpton pilot sites; in the coldest parts of the
Coteaux du Layon (lowest part of the vineyard and slopes facing north), Saumur Champigny
(lowest part of the vineyard) and Cotnari (lowest part of the vineyard). The entire vineyard
of Pomerol/Saint Emilion and Rioja would fall in climatic classes IV and V (table 2; figure 16).

Page | 29
Figure 13: Huglin Index modeling at local scale with RCP4.5 and RCP8.5 (2031-2050)
3000 DD
2400
2100
1800
1500
Climate class Huglin index
Values (°C)
Very cool ≤ 1500
Cool > 1500 ≤ 1800
Temperate > 1800 ≤ 2100
Temperate-warm > 2100 ≤ 2400
Warm > 2400 ≤ 3000
Very warm > 3000

Page | 30
Figure 14: Huglin Index modeling at local scale with RCP4.5 and RCP8.5 (2081-2100)
3000 DD
2400
2100
1800
1500
Climate class Huglin index
Values (°C)
Very cool ≤ 1500
Cool > 1500 ≤ 1800
Temperate > 1800 ≤ 2100
Temperate-warm > 2100 ≤ 2400
Warm > 2400 ≤ 3000
Very warm > 3000

Page | 31
Figure 15: Winkler Index modeling at local scale with RCP4.5 and RCP8.5 (2031-2050)
2600 DD
2300
1900
1700
1400 900
Class Values (°C)
Region Ia 850–1111
Region Ib 1111–1389
Region II 1389–1667
Region III 1668–1944
Region IV 1945–2222
Region V 2223–2700

Page | 32
Figure 16: Winkler Index modeling at local scale with RCP4.5 and RCP8.5 (2081-2100)
2600 DD
2300
1900
1700
1400 900
Class Values (°C)
Region Ia 850–1111
Region Ib 1111–1389
Region II 1389–1667
Region III 1668–1944
Region IV 1945–2222
Region V 2223–2700
Page | 33
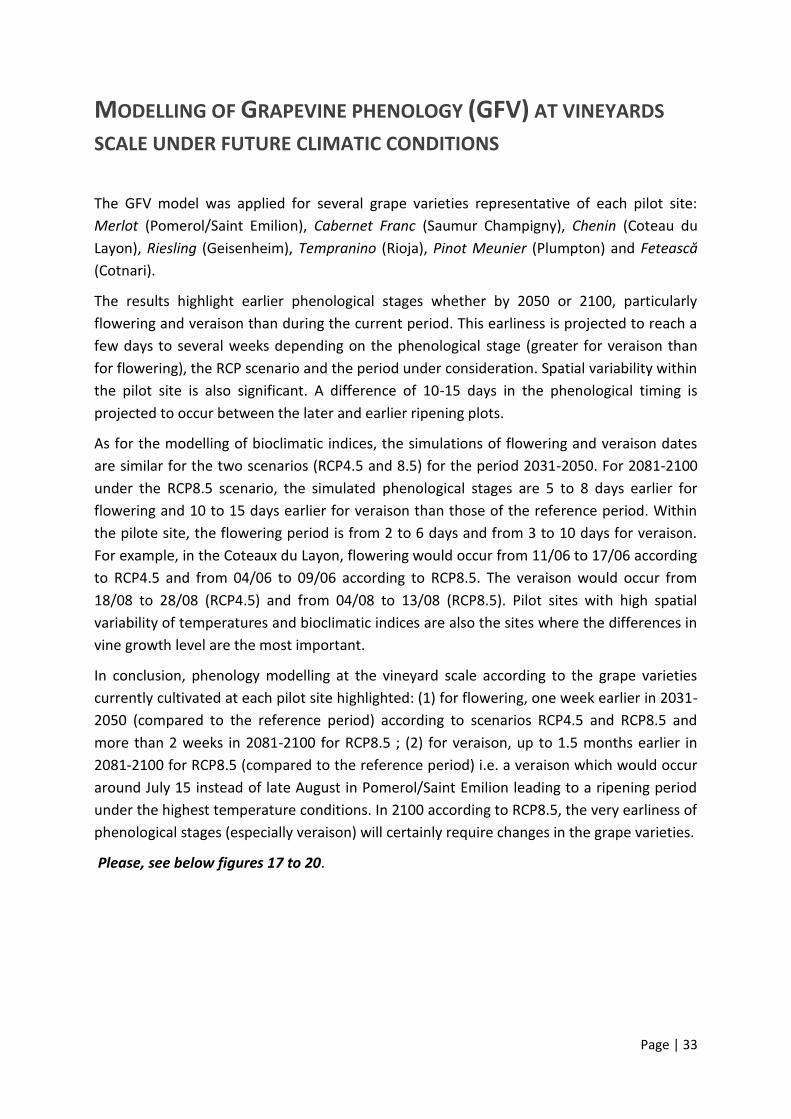
MODELLING OF GRAPEVINE PHENOLOGY (GFV) AT VINEYARDS
SCALE UNDER FUTURE CLIMATIC CONDITIONS
The GFV model was applied for several grape varieties representative of each pilot site:
Merlot (Pomerol/Saint Emilion), Cabernet Franc (Saumur Champigny), Chenin (Coteau du
Layon), Riesling (Geisenheim), Tempranino (Rioja), Pinot Meunier (Plumpton) and Fetească
(Cotnari).
The results highlight earlier phenological stages whether by 2050 or 2100, particularly
flowering and veraison than during the current period. This earliness is projected to reach a
few days to several weeks depending on the phenological stage (greater for veraison than
for flowering), the RCP scenario and the period under consideration. Spatial variability within
the pilot site is also significant. A difference of 10-15 days in the phenological timing is
projected to occur between the later and earlier ripening plots.
As for the modelling of bioclimatic indices, the simulations of flowering and veraison dates
are similar for the two scenarios (RCP4.5 and 8.5) for the period 2031-2050. For 2081-2100
under the RCP8.5 scenario, the simulated phenological stages are 5 to 8 days earlier for
flowering and 10 to 15 days earlier for veraison than those of the reference period. Within
the pilote site, the flowering period is from 2 to 6 days and from 3 to 10 days for veraison.
For example, in the Coteaux du Layon, flowering would occur from 11/06 to 17/06 according
to RCP4.5 and from 04/06 to 09/06 according to RCP8.5. The veraison would occur from
18/08 to 28/08 (RCP4.5) and from 04/08 to 13/08 (RCP8.5). Pilot sites with high spatial
variability of temperatures and bioclimatic indices are also the sites where the differences in
vine growth level are the most important.
In conclusion, phenology modelling at the vineyard scale according to the grape varieties
currently cultivated at each pilot site highlighted: (1) for flowering, one week earlier in 2031-
2050 (compared to the reference period) according to scenarios RCP4.5 and RCP8.5 and
more than 2 weeks in 2081-2100 for RCP8.5 ; (2) for veraison, up to 1.5 months earlier in
2081-2100 for RCP8.5 (compared to the reference period) i.e. a veraison which would occur
around July 15 instead of late August in Pomerol/Saint Emilion leading to a ripening period
under the highest temperature conditions. In 2100 according to RCP8.5, the very earliness of
phenological stages (especially veraison) will certainly require changes in the grape varieties.
Please, see below figures 17 to 20.

Page | 34
Figure 17: GFV modeling in Pomerol/Saint Emilion at local scale (res. 25m) for mid-flowering and mid-veraison in 2031-2050 and 2081-2100 with RCP4.5 and RCP8.5

Page | 35
Figure 18: GFV modeling in Cotnari at local scale (res. 25m) for mid-flowering and mid-veraison in 2031-2050 and 2081-2100 with RCP4.5 and RCP8.5

Page | 36
Figure 19: GFV modeling in Geisenheim at local scale (res. 25m) for mid-flowering and mid-veraison in 2031-2050 and 2081-2100 with RCP4.5 and RCP8.5

Page | 37
Figure 19: GFV modeling in Coteau du Layon at local scale (res. 25m) for mid-flowering and mid-veraison in 2031-2050 and 2081-2100 with RCP4.5 and RCP8.5

Page | 38
Figure 20: GFV modeling in Saumur Champigny at local scale (res. 25m) for mid-flowering and mid-veraison in 2031-2050 and 2081-2100 with RCP4.5 and RCP8.5

Page | 39
Figure 20: GFV modeling in Rioja at local scale (res. 25m) for mid-flowering and mid-veraison in 2031-2050 and 2081-2100 with RCP4.5 and RCP8.5

Page | 40
CONCLUSION
According to the latest climate projections published by the IPCC in 2013, current climate
change will continue and intensify in the future. Continued warming in the 21st century is
expected to lead to significant advances in phenological stages, as has been observed in
recent decades. This very probable advance of the phenology of the grapevine raises many
questions: in the short term, it is likely to have important consequences on grape
composition; the latter being linked to higher temperatures and an earlier maturity period,
where the grapes ripen in warmer conditions. The future change of grape quality inevitably
means changes in the quality and style of produced wines. Although the adaptation of
annual practices is already underway, wine growers must rethink their practices and
strategies in the medium and long term in order to respond to the expected effects of
climate changes (please see "Adapting viticulture to climate change: guidance manual to
support winegrowers' decision-making"1).
The integration of local climate variability (bioclimatic indices and phenological modelling)
into regionalized climate change simulations provides an assessment of the impacts of
climate change for European viticulture at the vineyard scale.
The knowledge gained using this methodology is the increasing horizontal resolution that
better suits the winegrowers concerns. Overall conclusion highlights the fact that thermal
differences within each site are similar to the thermal differences simulated by the climate
model between 1986-2005 and 2031-2050 (increase of 200-500 GDD). Hence, these results
give the local winegrowers/stakeholders information necessary to understand the current
functioning as well as historical and future viticulture trends at the scale of their site that
may facilitate decisions about future strategies. These results will allow suggesting
adaptation methods (Action B1) and mitigation methods (Action B2) based on the use of
plant material and viticultural management strategies. By 2081-2100 under the RCP8.5
scenario, the thermal increase is greater (500-1000 GDD) and will certainly involve other
adaptation methods such as changing grape varieties. However, knowledge of local climate
variability will make it possible to optimise adaptation scenarios according to the specific
characteristics of the vineyard.
1 http://www.adviclim.eu/wp-content/uploads/2015/06/B1-deliverable.pdf

Page | 41
With the contribution of the LIFE financial instrument of the European Union
http://www.adviclim.eu/