
Climate Insights: Bite Size. External credits and...
25
Climate Insights: Bite Size. Exter Credit: Mic Credit: Ste Wikipedia Retrieved http://en.w Retrieved: Credit: Pac base image https://ww % ; contact knowledge identifiable was: Elizab Business M Credit: Rob Retrieved http://ww Retrieved: Source: Ad Working G Intergover 7.3. Cambr Retrieved Retrieved: rnal credits and sources. February 15, 2012 crosoft Office Image ephen Hudson, Concordia Station (Dome C), 29 Janu from: wikipedia.org/wiki/File:ConcordiaFromTower.jpg#fi : 3 February 2021 cific Institute for Climate Solutions, 2011 ge from ww.meted.ucar.edu/sign_in.php?go_back_to=http% ted Comet and was informed that because material e and enough changes have been made that make it le as a COMET original graphic it can be credited to P beth Lessard; [email protected] ; Manager, Boulder, CO, Tel: 303-497-8475; Fax: 303-4 bert Rohde, Global Warming Art from: ww.globalwarmingart.com/wiki/File:Solar_Cycle_Var : January, 2011 dapted from Climate Change 2007: The Physical Scie Group I Contribution to the Fourth Assessment Repo rnmental Panel on Climate Change, Figure 7.3; Chap ridge University Press. from: http://www.ipcc.ch/graphics/ar4-wg1/jpg/fig : June 2, 2011 uary, 2005, ile %253A%252F is common t easily PICS (contact 497-8491). riations_png ence Basis. ort of the pter 7; Section g-7-3.jpg
Transcript of Climate Insights: Bite Size. External credits and...

Climate Insights: Bite Size. External credits and sources. February 15, 2012
Credit: Microsoft Office Image
Credit: Stephen Wikipedia
Retrieved from: http://en.wikipedia.org/wiki/File:ConcordiaFromTower.jpg#file
Retrieved: 3 February 2021
Credit: Pacific Institute for Climate Solutions, 2011 base image from https://ww%; contacted Comet and was informed that because material is common knowledge and enough changes have been made that make it easily identifiable as a COMET original graphic it can be credited to PICS (cwas: Elizabeth Lessard;Business Manager, Boulder, CO, Tel: 303
Credit: Robert Rohde, Global Warming Art Retrieved from: http://www.globalwarmingart.com/wiki/File:Solar_Cycle_Variations_png Retrieved: January, 2011
Source: Adapted from Climate Change 2007: The Physical Science Basis. Working Group I Contribution to the Fourth Assessment Report of the Intergovernmental Panel on Climate Change, Figure7.3. Cambridge University Press. Retrieved from: Retrieved: June 2, 2011
Climate Insights: Bite Size. External credits and sources. February 15, 2012
Credit: Microsoft Office Image
Credit: Stephen Hudson, Concordia Station (Dome C), 29 January, 2005,
Retrieved from: http://en.wikipedia.org/wiki/File:ConcordiaFromTower.jpg#file
Retrieved: 3 February 2021 Credit: Pacific Institute for Climate Solutions, 2011
base image from https://www.meted.ucar.edu/sign_in.php?go_back_to=http%253A%252F
; contacted Comet and was informed that because material is common knowledge and enough changes have been made that make it easily identifiable as a COMET original graphic it can be credited to PICS (c
Elizabeth Lessard; [email protected]; Business Manager, Boulder, CO, Tel: 303-497-8475; Fax: 303-497
Credit: Robert Rohde, Global Warming Art
Retrieved from: http://www.globalwarmingart.com/wiki/File:Solar_Cycle_Variations_png
Retrieved: January, 2011
Source: Adapted from Climate Change 2007: The Physical Science Basis. Working Group I Contribution to the Fourth Assessment Report of the Intergovernmental Panel on Climate Change, Figure 7.3; Chapter 7; Section 7.3. Cambridge University Press.
Retrieved from: http://www.ipcc.ch/graphics/ar4-wg1/jpg/fig
Retrieved: June 2, 2011
Hudson, Concordia Station (Dome C), 29 January, 2005,
http://en.wikipedia.org/wiki/File:ConcordiaFromTower.jpg#file
w.meted.ucar.edu/sign_in.php?go_back_to=http%253A%252F; contacted Comet and was informed that because material is common
knowledge and enough changes have been made that make it easily identifiable as a COMET original graphic it can be credited to PICS (contact
497-8491).
http://www.globalwarmingart.com/wiki/File:Solar_Cycle_Variations_png
Source: Adapted from Climate Change 2007: The Physical Science Basis. Working Group I Contribution to the Fourth Assessment Report of the
7.3; Chapter 7; Section
wg1/jpg/fig-7-3.jpg

Climate Insights: Bite Size. External credits and sources. February 15, 2012
Credit: M.J. Beedle 1978 Photo: ImageI_11467 Courtesy of Royal BC Museum Retrieved from: columbia/repeat Retrieved: November 29, 2011
Credit: Sea Ice Yearly Minimum, 1979Center Scientific Visualization Studio. Thanks to Rob providing the data. Retrieved from: http://svs.gsfc.nasa.gov/vis/a000000/a003400/a003464/index.html Retrieved:
Credit: Microsoft Office
Credit: Globe and Mail, 2009
Credit: Daily Mail (UK), 2010
Credit: Express (UK), 2011
Source: plot uses data from the NASA GISTEMP data set “TemperatureANOM.01 C, 1880 Retrieved from: http://data.giss.nasa.gov/gistemp/tabledata/GLB.Ts+dSST.txt Retrieved: November 30, 2010
Credit: Department of Atmospheric and Oceanic Sciences. University of Colorado, Boulder Retrieved from: Retrieved: February 7,
Credit: Environment CanadaAnalysis (CCCma) Retrieved fromhttp://www.cccma.ec.gc.ca/diagnostics/cgcm4/movies/tas_Amon_CanESM2_historical_1986_2005_ac_glb.gif
Climate Insights: Bite Size. External credits and sources. February 15, 2012
Credit: M.J. Beedle
1978 Photo: ImageI_11467 Courtesy of Royal BC Museum
Retrieved from: http://glacierchange.org/scrapbook/bear-glaciercolumbia/repeat-photography
Retrieved: November 29, 2011
Credit: Sea Ice Yearly Minimum, 1979-2007, NASA/Goddard Space Flight Center Scientific Visualization Studio. Thanks to Rob Gerston (GSFC) for providing the data.
Retrieved from: http://svs.gsfc.nasa.gov/vis/a000000/a003400/a003464/index.html
Retrieved: February 14, 2012
Credit: Microsoft Office Image
Globe and Mail, 2009
Daily Mail (UK), 2010
Express (UK), 2011 Source: plot uses data from the NASA GISTEMP data set “GHCN V2 TemperatureANOM (C) CR 1200KM, GLOBAL Temperature Anomalies in .01 C, 1880-present, base period: 1951-1980”
Retrieved from: http://data.giss.nasa.gov/gistemp/tabledata/GLB.Ts+dSST.txt
Retrieved: November 30, 2010
Credit: Department of Atmospheric and Oceanic Sciences. University of Colorado, Boulder
Retrieved from: http://paos.colorado.edu/~dcn/ATOC7500/
Retrieved: February 7, 2012
Credit: Environment Canada- Canadian Centre for Climate Modelling and Analysis (CCCma)
Retrieved from: http://www.cccma.ec.gc.ca/diagnostics/cgcm4/movies/tas_Amon_CanESM2_historical_1986_2005_ac_glb.gif
glacier-british-
NASA/Goddard Space Flight Gerston (GSFC) for
http://svs.gsfc.nasa.gov/vis/a000000/a003400/a003464/index.html
GHCN V2 (C) CR 1200KM, GLOBAL Temperature Anomalies in
http://data.giss.nasa.gov/gistemp/tabledata/GLB.Ts+dSST.txt
Credit: Department of Atmospheric and Oceanic Sciences. University of
Canadian Centre for Climate Modelling and
http://www.cccma.ec.gc.ca/diagnostics/cgcm4/movies/tas_Amon_CanES

Climate Insights: Bite Size. External credits and sources. February 15, 2012
Retrieved: February 1, 2012
Source: Climate Change 2001: The Scientific Basis. Working Group I Contribution to the Third Assessment Report of the IntergoPanel on Climate Change, Summary for policy makers; Figure 5.a. Cambridge University Press. Retrieved from: Retrieved: 31 January,
Source: Climate Change 2001: The Scientific Basis. Working Group I Contribution to the Third Assessment Report of the Intergovernmental Panel on Climate Change, Summary for policy makers; Figure 5Cambridge University Press. Retrieved from: Retrieved: 31 January, 2012 Credit: Lonely Planet Images, http://www.lonelyplangranted from July 2011 to July 2013.
Credit: http://www.arthursclipart.org/http://www.arthursclipart.org/silhouettes/people.htm
Credit: NASA Retrieved from: Retrieved: February 14, 2012
Source: NASA, Goddard Institute for Space Studies (GISS) Retrieved from: Retrieved: May 31, 2011 Credit: individual Microsoft Office images
Climate Insights: Bite Size. External credits and sources. February 15, 2012
Retrieved: February 1, 2012 Source: Climate Change 2001: The Scientific Basis. Working Group I Contribution to the Third Assessment Report of the Intergovernmental Panel on Climate Change, Summary for policy makers; Figure 5.a. Cambridge University Press.
Retrieved from: http://www.grida.no/publications/other/ipcc_tar/
Retrieved: 31 January, 2012
Source: Climate Change 2001: The Scientific Basis. Working Group I Contribution to the Third Assessment Report of the Intergovernmental Panel on Climate Change, Summary for policy makers; Figure 5Cambridge University Press.
Retrieved from: http://www.grida.no/publications/other/ipcc_tar/
Retrieved: 31 January, 2012
Credit: Lonely Planet Images, http://www.lonelyplanetimages.com/images/186446, permission for use granted from July 2011 to July 2013.
http://www.arthursclipart.org/ (question marks); http://www.arthursclipart.org/silhouettes/people.htm (silhouettes)
Credit: NASA
Retrieved from: http://history.nasa.gov/ap11ann/kippsphoto/6667.jpg
Retrieved: February 14, 2012 Source: NASA, Goddard Institute for Space Studies (GISS)
Retrieved from: http://data.giss.nasa.gov/gistemp/graphs/
Retrieved: May 31, 2011
Credit: individual Microsoft Office images
Source: Climate Change 2001: The Scientific Basis. Working Group I vernmental
Panel on Climate Change, Summary for policy makers; Figure 5.a.
http://www.grida.no/publications/other/ipcc_tar/
Source: Climate Change 2001: The Scientific Basis. Working Group I Contribution to the Third Assessment Report of the Intergovernmental Panel on Climate Change, Summary for policy makers; Figure 5.b.
http://www.grida.no/publications/other/ipcc_tar/
, permission for use
(silhouettes)
http://history.nasa.gov/ap11ann/kippsphoto/6667.jpg

Climate Insights: Bite Size. External credits and sources. February 15, 2012
Credit: Scripps Institute of Oceanography, University of California San Diego Retrieved from: Retrieved: June 2, 2011
Source: Mauna Loa Observatory, Hawaii, monthly average carbon dioxide concentration from SCRIPPS CO Retrieved from: http://scrippsco2.ucsd.edu/images/graphics_gallery/original/mlo_record.pdf Retrieved: March, 2011 Credit: NOAA/Earth System Research Laboratory (ESRL) Retrieved from:http://www.sahfos.ac.uk/climate encyclopaedia/co2.html Retrieved: February 3, 2012
Credit: Microsoft Office Image
Credit: Microsoft Office Image
Credit: Microsoft Office Image
Credit: Microsoft Office Image
Climate Insights: Bite Size. External credits and sources. February 15, 2012
Credit: Scripps Institute of Oceanography, University of California San
Retrieved from: http://sio.ucsd.edu/keeling/
Retrieved: June 2, 2011
Source: Mauna Loa Observatory, Hawaii, monthly average carbon dioxide concentration from SCRIPPS CO2 program last updated March 2011.
Retrieved from: http://scrippsco2.ucsd.edu/images/graphics_gallery/original/mlo_record.
Retrieved: March, 2011
: NOAA/Earth System Research Laboratory (ESRL)
Retrieved from: http://www.sahfos.ac.uk/climate encyclopaedia/co2.html
Retrieved: February 3, 2012
Credit: Microsoft Office Image
Credit: Microsoft Office Image
Credit: Microsoft Office Image
Credit: Microsoft Office Image
Credit: Scripps Institute of Oceanography, University of California San
Source: Mauna Loa Observatory, Hawaii, monthly average carbon dioxide program last updated March 2011.
http://scrippsco2.ucsd.edu/images/graphics_gallery/original/mlo_record.

Climate Insights: Bite Size. External credits and sources. February 15, 2012
Credit: Microsoft Office
Credit: Microsoft Office Image
Credit: Microsoft Office Image
Credit: Microsoft Office Image
Credit: Microsoft Office Image
Credit: NASA Retrieved from: nasa/2009/17jul_discoveringearth/ Retrieved: February 14, 2012
Credit: Microsoft Office Image
Climate Insights: Bite Size. External credits and sources. February 15, 2012
Credit: Microsoft Office Image
Credit: Microsoft Office Image
Credit: Microsoft Office Image
Credit: Microsoft Office Image
Credit: Microsoft Office Image
Credit: NASA
Retrieved from: http://science.nasa.gov/science-news/sciencenasa/2009/17jul_discoveringearth/
Retrieved: February 14, 2012
Credit: Microsoft Office Image
news/science-at-

Climate Insights: Bite Size. External credits and sources. February 15, 2012
Credit: Mic
Credit: Microsoft Office Image
Credit: Microsoft Office Image
Credit: NASA Retrieved from:http://www.nasa.gov/vision/earth/lookingatearth/ozone_record.html Retrieved:
Credit: Microsoft Office Image
Source: IPCC Credit: Chart created by Dr Tom Pedersen, Pacific Institute for Climate Solutions, 2011
Credit: www.easlyelements.com Retrieved from
Climate Insights: Bite Size. External credits and sources. February 15, 2012
Credit: Microsoft Office Image
Credit: Microsoft Office Image
Credit: Microsoft Office Image
Credit: NASA
Retrieved from: http://www.nasa.gov/vision/earth/lookingatearth/ozone_record.html
Retrieved: February 9, 2012 Credit: Microsoft Office Image
Source: IPCC 4th Assessment, 2007
Credit: Chart created by Dr Tom Pedersen, Pacific Institute for Climate Solutions, 2011
Credit: www.easlyelements.com
Retrieved from http://www.easyelements.com/snowflake-brushes.html
http://www.nasa.gov/vision/earth/lookingatearth/ozone_record.html
Credit: Chart created by Dr Tom Pedersen, Pacific Institute for Climate
brushes.html
Climate Insights: Bite Size. External credits and sources. February 15, 2012
Credit: Dr. Lonnie Thompson, Ohio State University, Byrd Polar Research Center Retrieved from: http://researchnews.osu.edu/archive/ lonthmppics.htm Retrieved: May 11, 2011.
Credit: Peter RejcekLaboratory Retrieved from: http://nicl Retrieved: May 31, 2011
Source: Skeptical Science Retrieved from: http://www.skepticalscience.com/ graphics/CO2_history_1024.jpg Retrieved: June 2, 2011.
Credit: Todd Sowers, Lamont Doherty Earth Observatory (LDEO), Columbia University, Palisades, New York. Retrieved from: http://en.wikipedia.org/wiki/File:Wostok Retrieved: May 31, 2011
Source: NASA Retrieved from: http://en.wikipedia.org/wiki/File:LakeVostok Retrieved: May 31, 2011 Credit: Christina Riesselman for the Ice Stories project, © 2007 Exploratorium
Retrieved from: Noncommercial
Retrieved: May 11, 2011
Climate Insights: Bite Size. External credits and sources. February 15, 2012
Credit: Dr. Lonnie Thompson, Ohio State University, Byrd Polar Research
Retrieved from: http://researchnews.osu.edu/archive/ lonthmppics.htm
Retrieved: May 11, 2011.
Credit: Peter Rejcek in In-Depth Newsletter of the National Ice Core Laboratory – Science Management Office Vol. 5 Issue 2. Fall 2010.
Retrieved from: http://nicl-smo.unh.edu/
Retrieved: May 31, 2011
Source: Skeptical Science
Retrieved from: http://www.skepticalscience.com/ graphics/CO2_history_1024.jpg
Retrieved: June 2, 2011. Credit: Todd Sowers, Lamont Doherty Earth Observatory (LDEO), Columbia University, Palisades, New York.
Retrieved from: http://en.wikipedia.org/wiki/File:Wostok-Station_core32.jpg
Retrieved: May 31, 2011
Source: NASA
Retrieved from: http://en.wikipedia.org/wiki/File:LakeVostok
Retrieved: May 31, 2011
Christina Riesselman for the Ice Stories project, © 2007 Exploratorium
Retrieved from: 2007 Exploratorium, Creative Commons AttributionNoncommercial-Share Alike 3.0 United States License
Retrieved: May 11, 2011
Credit: Dr. Lonnie Thompson, Ohio State University, Byrd Polar Research
Depth Newsletter of the National Ice Core Science Management Office Vol. 5 Issue 2. Fall 2010.
http://www.skepticalscience.com/ graphics/CO2_history_1024.jpg
Credit: Todd Sowers, Lamont Doherty Earth Observatory (LDEO),
Station_core32.jpg
Retrieved from: http://en.wikipedia.org/wiki/File:LakeVostok-Location.jpg
Christina Riesselman for the Ice Stories project, © 2007
Creative Commons Attribution-

Climate Insights: Bite Size. External credits and sources. February 15, 2012
Credit: Zoe Courville for the Retrieved from: Noncommercial
Retrieved: May 31, 2011
Credit: Dr. Julie Palais/ National Science Foundation Retrieved http://www.icedrill.org/graphics/pics/home_coresinnet_lg.jpg Retrieved: May 11, 2011
Credit: Peter Rejcek in InLaboratory Retrieved from: Retrieved: May 31, 2011
Credit: Peter RejcekLaboratory Retrieved from: Retrieved: May 31, 2011
Credit: www.easyelements.com Retrieved from
Data sources for EPICA data: Jouzel, J., et al. 2007.EPICA Dome C Ice Core 800KYr Deuterium Data and Temperature Data Center for Paleoclimatology Data Contribution Series # 2007091.NOAA/NCDC Paleoclimatology Program, Boulder CO, USA. Data sources for Vostok data: Petit, J.R., et al., 2001, Vostok Ice Core Data for 420,000 Years, IGBP PAGData Contribution Series #2001Program, Boulder CO, USA. Original reference (1) for Vostok data: Petit J.R., Jouzel J., Raynaud D., Barkov N.I., Barnola J.M., Basile I., Bender M.,Delaygue G., Delmotte M., Kotlyakov V.M., Legrand M., Lipenkov V., Lorius C., Pépin L., Ritz C., Saltzman E., Stievenard M. 1999. Climate and Atmospheric History of the Past 420,000 years from the Vostok Ice Core,
Climate Insights: Bite Size. External credits and sources. February 15, 2012
Credit: Zoe Courville for the Ice Stories project, © 2009 Exploratorium
Retrieved from: 2009 Exploratorium, Creative Commons AttributionNoncommercial-Share Alike 3.0 United States License
Retrieved: May 31, 2011
Credit: Dr. Julie Palais/ National Science Foundation
Retrieved from: http://www.icedrill.org/graphics/pics/home_coresinnet_lg.jpg
Retrieved: May 11, 2011
Credit: Peter Rejcek in In-Depth Newsletter of the National IceLaboratory – Science Management Office Vol. 5 Issue 2. Fall 2010.
Retrieved from: http://nicl-smo.unh.edu/
Retrieved: May 31, 2011 Credit: Peter Rejcek in In-Depth Newsletter of the National Ice Core Laboratory – Science Management Office Vol. 5 Issue 2. Fall 2010.
Retrieved from: http://nicl-smo.unh.edu/
Retrieved: May 31, 2011
Credit: www.easyelements.com
Retrieved from http://www.easyelements.com/snowflake-brushes.html
Data sources for EPICA data: Jouzel, J., et al. 2007.EPICA Dome C Ice Core 800KYr Deuterium Data and Temperature Estimates. IGBP PAGES/World Data Center for Paleoclimatology Data Contribution Series # 2007091.NOAA/NCDC Paleoclimatology Program, Boulder CO, USA.
Data sources for Vostok data: Petit, J.R., et al., 2001, Vostok Ice Core Data for 420,000 Years, IGBP PAGES/World Data Center for Paleoclimatology Data Contribution Series #2001-076. NOAA/NGDC Paleoclimatology Program, Boulder CO, USA.
Original reference (1) for Vostok data: Petit J.R., Jouzel J., Raynaud D., Barkov N.I., Barnola J.M., Basile I., Bender M., Chappellaz J., Davis J., Delaygue G., Delmotte M., Kotlyakov V.M., Legrand M., Lipenkov V., Lorius C., Pépin L., Ritz C., Saltzman E., Stievenard M. 1999. Climate and Atmospheric History of the Past 420,000 years from the Vostok Ice Core,
Exploratorium
Creative Commons Attribution-
http://www.icedrill.org/graphics/pics/home_coresinnet_lg.jpg on
Ice Core Science Management Office Vol. 5 Issue 2. Fall 2010.
Depth Newsletter of the National Ice Core Science Management Office Vol. 5 Issue 2. Fall 2010.
brushes.html
Data sources for EPICA data: Jouzel, J., et al. 2007.EPICA Dome C Ice Core Estimates. IGBP PAGES/World
Data Center for Paleoclimatology Data Contribution Series # 2007-091.NOAA/NCDC Paleoclimatology Program, Boulder CO, USA.
Data sources for Vostok data: Petit, J.R., et al., 2001, Vostok Ice Core Data ES/World Data Center for Paleoclimatology
076. NOAA/NGDC Paleoclimatology
Original reference (1) for Vostok data: Petit J.R., Jouzel J., Raynaud D., Chappellaz J., Davis J.,
Delaygue G., Delmotte M., Kotlyakov V.M., Legrand M., Lipenkov V., Lorius C., Pépin L., Ritz C., Saltzman E., Stievenard M. 1999. Climate and Atmospheric History of the Past 420,000 years from the Vostok Ice Core,

Climate Insights: Bite Size. External credits and sources. February 15, 2012
Antarctica. Nature. 399: 429-436. Original reference (2) for Vostok data: Jouzel, J., V. Masson-Delmotte, O. Cattani, G. Dreyfus, S. Falourd, G. Hoffmann, B. Minster, J. Nouet, J.M. Barnola, J. Chappellaz, H. Fischer, J.C. Gallet, S. Johnsen, M. Leuenberger, L. Loulergue, D. Luethi, H. Oerter, F. Parrenin, G. Raisbeck, D. Raynaud, A. Schilt, J. Schwander, E. Selmo, R. Souchez, R. Spahni, B. Stauffer, J.P. Steffensen, B. Stenni, T.F. Stocker, J.L. Tison, M. Werner, and E.W. Wolff. 2007. Orbital and Millennial Antarctic Climate Variability over the Past 800,000 Years. Science. 317: 793-797. Data sources for Ice Volume data: Waelbroeck, C., et al. 2010. Sea-level and Deep Water Temperature 430KYr Reconstructions. IGBP PAGES/World Data Center for Paleoclimatology Data Contribution Series # 2010-126. NOAA/NCDC Paleoclimatology Program, Boulder CO, USA. Original reference (1) for Ice Volume data: Waelbroeck, C., L. Labeyrie, E. Michel, J.C. Duplessy, J. McManus, K. Lambeck, E. Balbon, and M. Labracherie. 2002. Sea-level and deep water temperature changes derived from benthic foraminifera isotopic records. Quaternary Science Reviews. 21: 295-305. Credit: Diedrich F, Blick auf die Kohnenstation - Dronning Maud Land, Ostantarktika, 75Sued 0 Ost, selbst aufgenommen am 24.11.2005, Wikipedia Retrieved from: http://en.wikipedia.org/wiki/File:KohnenStation.JPG Retrieved: May 2, 2011
Credit: Kendrick Taylor, DRI, University of Nevada-Reno, NOAA Paleoclimatology Retrieved from: http://www.ncdc.noaa.gov/paleo/slides/slideset/15/15_283_slide.html Retrieved: May 2, 2011
Credit: Kendrick Taylor, DRI, University of Nevada-Reno, NOAA Paleoclimatology Retrieved from: http://www.ncdc.noaa.gov/paleo/slides/slideset/15/15_279_slide.html Retrieved: May 2, 2011

Climate Insights: Bite Size. External credits and sources. February 15, 2012
Credit: Luis Alberto 9919, Wikipedia; original copyright expired Retrieved from: Retrieved: May 31, 2011
Credit: Climate and Time in Their Geological Relations. openlibrary.org Retrieved from: http://www.archive.org/stream/climateandtimei00crolgoog#page/n10/mode/2up Retrieved: December 14, 2011
Credit: None listed; original copyright expired Retrieved from: Milankovic/13703433741 Retrieved: May, 2011
Credit: None listed; original copyright expired Retrieved from: http://en.wikipedia.org/wiki/File:Johann
Retrieved: May, 2011
Source: Laskar, J., Robutel, P., Joutel, F., Gastineau, M., Correia, A. C. M., Levard, B. 2004. quantities of the Earth.
Credit: NASA/SVS Retrieved from:http://www.nasa.gov/vision/earth/environment/ice_sheets.html Retrieved: May 11, 2011
Climate Insights: Bite Size. External credits and sources. February 15, 2012
Credit: Luis Alberto 9919, Wikipedia; original copyright expired
Retrieved from: http://en.wikipedia.org/wiki/File:James_Croll.jpg
Retrieved: May 31, 2011
Credit: Climate and Time in Their Geological Relations. openlibrary.org
Retrieved from: http://www.archive.org/stream/climateandtimei00crolgoog#page/n10/m
Retrieved: December 14, 2011
Credit: None listed; original copyright expired
Retrieved from: http://www.facebook.com/pages/Milutin-Milankovic/13703433741
Retrieved: May, 2011
Credit: None listed; original copyright expired
Retrieved from: http://en.wikipedia.org/wiki/File:Johannes_Kepler_1610.jpg
Retrieved: May, 2011
Laskar, J., Robutel, P., Joutel, F., Gastineau, M., Correia, A. C. M., Levard, B. 2004. A long term numerical solution for the insolation quantities of the Earth. Astronomy and Astrophysics. 428: 261
Credit: NASA/SVS
Retrieved from: http://www.nasa.gov/vision/earth/environment/ice_sheets.html
Retrieved: May 11, 2011
Credit: Luis Alberto 9919, Wikipedia; original copyright expired
pedia.org/wiki/File:James_Croll.jpg
Credit: Climate and Time in Their Geological Relations. openlibrary.org
http://www.archive.org/stream/climateandtimei00crolgoog#page/n10/m
Laskar, J., Robutel, P., Joutel, F., Gastineau, M., Correia, A. C. M., A long term numerical solution for the insolation
. 428: 261-285.
http://www.nasa.gov/vision/earth/environment/ice_sheets.html

Climate Insights: Bite Size. External credits and sources. February 15, 2012
Credit: W. Berner/ University of Bern
Retrieved core-extends
Retrieved: June 2, 2011Credit: Zoe Courville for the Retrieved from: Noncommercial Retrieved: May 31, 2011
Original reference COD., Barkov N.I., Barnola J.M., Basile I., Bender M., Chappellaz J., Davis J., Delaygue G., Delmotte M., C., Pépin L., Ritz C., Saltzman E., Stievenard M. 1999. Climate and Atmospheric History of the Past 420,000 years from the Vostok Ice Core, Antarctica. Original reference for VostokDelmotte, O. Cattani, G. Dreyfus, S. Falourd, G. Hoffmann, B. Minster, J. Nouet, J.M. Barnola, J. Chappellaz, H. Fischer, J.C. Gallet, S. Johnsen, M. Leuenberger, L. Loulergue, D. Luethi, H. Oerter, F. Parrenin, G. Raynaud, A. Schilt, J. Schwander, E. Selmo, R. Souchez, R. Spahni, B. Stauffer, J.P. Steffensen, B. Stenni, T.F. Stocker, J.L. Tison, M. Werner, and E.W. Wolff. 2007. Orbital and Millennial Antarctic Climate Variability over the Past 800,000
Credit: H. Fischer/ Alfred Wegener Institute; http://www.awi.de/en/news/images_video_audio/terms_of_use/ Retrieved from: Retrieved: May, 2011
Credit: T Alipalo/UNEP/Topham
Retrieved from: apps.org/resources/publications/MountainWatch_Bishkek/presspack/photos.htm
Retrieved: May 31, 2011
Climate Insights: Bite Size. External credits and sources. February 15, 2012
Credit: W. Berner/ University of Bern
Retrieved from: http://www.scientificamerican.com/article.cfm?id=iceextends-climate
Retrieved: June 2, 2011 Credit: Zoe Courville for the Ice Stories project, © 2009 Exploratorium
Retrieved from: 2009 Exploratorium, Creative Commons AttributionNoncommercial-Share Alike 3.0 United States License
Retrieved: May 31, 2011
Original reference CO2 data for Vostok data: Petit J.R., Jouzel J., Raynaud D., Barkov N.I., Barnola J.M., Basile I., Bender M., Chappellaz J., Davis J., Delaygue G., Delmotte M., Kotlyakov V.M., Legrand M., Lipenkov V., Lorius C., Pépin L., Ritz C., Saltzman E., Stievenard M. 1999. Climate and Atmospheric History of the Past 420,000 years from the Vostok Ice Core, Antarctica. Nature. 399: 429-436.
Original reference for Vostok Temperature Data: Jouzel, J., V. MassonDelmotte, O. Cattani, G. Dreyfus, S. Falourd, G. Hoffmann, B. Minster, J. Nouet, J.M. Barnola, J. Chappellaz, H. Fischer, J.C. Gallet, S. Johnsen, M. Leuenberger, L. Loulergue, D. Luethi, H. Oerter, F. Parrenin, G. Raynaud, A. Schilt, J. Schwander, E. Selmo, R. Souchez, R. Spahni, B. Stauffer, J.P. Steffensen, B. Stenni, T.F. Stocker, J.L. Tison, M. Werner, and E.W. Wolff. 2007. Orbital and Millennial Antarctic Climate Variability over the Past 800,000 Years. Science. 317: 793-797.
Credit: H. Fischer/ Alfred Wegener Institute; http://www.awi.de/en/news/images_video_audio/terms_of_use/
Retrieved from: http://www.awi.de/People/show?hufische
Retrieved: May, 2011
Credit: T Alipalo/UNEP/Topham
Retrieved from: http://www.unep-wcmc-apps.org/resources/publications/MountainWatch_Bishkek/presspack/pho
Retrieved: May 31, 2011
http://www.scientificamerican.com/article.cfm?id=ice-
Exploratorium
Creative Commons Attribution-
data for Vostok data: Petit J.R., Jouzel J., Raynaud D., Barkov N.I., Barnola J.M., Basile I., Bender M., Chappellaz J., Davis J.,
Kotlyakov V.M., Legrand M., Lipenkov V., Lorius C., Pépin L., Ritz C., Saltzman E., Stievenard M. 1999. Climate and Atmospheric History of the Past 420,000 years from the Vostok Ice Core,
Temperature Data: Jouzel, J., V. Masson-Delmotte, O. Cattani, G. Dreyfus, S. Falourd, G. Hoffmann, B. Minster, J. Nouet, J.M. Barnola, J. Chappellaz, H. Fischer, J.C. Gallet, S. Johnsen, M. Leuenberger, L. Loulergue, D. Luethi, H. Oerter, F. Parrenin, G. Raisbeck, D. Raynaud, A. Schilt, J. Schwander, E. Selmo, R. Souchez, R. Spahni, B. Stauffer, J.P. Steffensen, B. Stenni, T.F. Stocker, J.L. Tison, M. Werner, and E.W. Wolff. 2007. Orbital and Millennial Antarctic Climate Variability over
http://www.awi.de/en/news/images_video_audio/terms_of_use/
apps.org/resources/publications/MountainWatch_Bishkek/presspack/pho

Climate Insights: Bite Size. External credits and sources. February 15, 2012
Credit: NASA/ESA/SOHO satellite Retrieved from: http://science.nationalgeographic.com/science/photos/sungallery/#/trico_1261_600x450.jpg
Retrieved: June 20, 2011
Credit: NASA, Goddard Institute Retrieved from: Retrieved: July 11, 2011
Credit: NASA/MODIS Rapid Response Team Retrieved from: http://www.giss.nasa.gov/research/features/201004_aerosols/ Retrieved: June 28
Credit: The June 12, 1991 eruption of Mount Pinatubo taken from the east side of Clark Air Base. U.S. Geological Survey Photograph taken on June 12, 1991, 08:51 hours by Dave Harlow. Retrieved from:http://vulcan.wr.usgs.gov/Volcanoes/Philippines/Pinatubo/images.html
Retrieved: January 30, 2012
Credit: Eruption of Mt St. Helens 18 May 1980, Austin Post, U. S. Geological Survey (USGS) Retrieved from:http://vulcan.wr.usgs.gov/Volcanoes/MSH/May18/description_may18_1980.html
Retrieved: May 31, 2011Credit: Henrik Thorburn. Eruption at Eyjafjallajokul Volcano, Fimmvorduhals, Iceland Retrieved from: valid.File:Fimmvorduhals
Climate Insights: Bite Size. External credits and sources. February 15, 2012
Credit: NASA/ESA/SOHO satellite
Retrieved from: http://science.nationalgeographic.com/science/photos/sungallery/#/trico_1261_600x450.jpg
Retrieved: June 20, 2011 Credit: NASA, Goddard Institute for Space Studies (GISS)
Retrieved from: http://www.oerrecommender.org/visits/109909
Retrieved: July 11, 2011
Credit: NASA/MODIS Rapid Response Team
Retrieved from: http://www.giss.nasa.gov/research/features/201004_aerosols/
Retrieved: June 28, 2011
Credit: The June 12, 1991 eruption of Mount Pinatubo taken from the east side of Clark Air Base. U.S. Geological Survey Photograph taken on June 12, 1991, 08:51 hours by Dave Harlow.
Retrieved from: http://vulcan.wr.usgs.gov/Volcanoes/Philippines/Pinatubo/images.html
Retrieved: January 30, 2012 Credit: Eruption of Mt St. Helens 18 May 1980, Austin Post, U. S. Geological Survey (USGS)
Retrieved from: http://vulcan.wr.usgs.gov/Volcanoes/MSH/May18/description_may18_19
Retrieved: May 31, 2011 Credit: Henrik Thorburn. Eruption at Eyjafjallajokul Volcano,
rduhals, Iceland at dusk 27 March 2010,
Retrieved from: Error! Hyperlink reference not File:Fimmvorduhals
http://science.nationalgeographic.com/science/photos/sungallery/#/trico
http://www.oerrecommender.org/visits/109909
http://www.giss.nasa.gov/research/features/201004_aerosols/
Credit: The June 12, 1991 eruption of Mount Pinatubo taken from the east side of Clark Air Base. U.S. Geological Survey Photograph taken on June 12,
http://vulcan.wr.usgs.gov/Volcanoes/Philippines/Pinatubo/images.html
Credit: Eruption of Mt St. Helens 18 May 1980, Austin Post, U. S.
http://vulcan.wr.usgs.gov/Volcanoes/MSH/May18/description_may18_19
Climate Insights: Bite Size. External credits and sources. February 15, 2012
_2010_03_27_dawn.jpg Retrieved: May 31, 2011
Credit: Sunspot, SOHO spacecraft, NASA. Retrieved from:http://science.nasa.gov/science-news/science-at-nasa/2006/15aug_backwards/ Retrieved: May 4, 2011
Credit: Microsoft Office Image
Credit: Microsoft Office Image
Credit: Microsoft Office Image
Credit: Microsoft Office Image
Credit: Microsoft Office Image
Credit: Screen capture of computer screen with You Tube logo added in; Ludlamconsulting
Credit: Microsoft Office Image

Climate Insights: Bite Size. External credits and sources. February 15, 2012
Credit: Microsoft Office Image
Credit: with permission from THE CANADIAN PRESS/ Jonathan Hayward Retrieved from: http://www.vancouversun.com/business/Photos+Legislature+opens+with+pomp+ceremony/4285976/story.html Retrieved: June 2, 2011
Source: Temperature Anomalies July 2009 (with respect to a 1961-1990 base period), National Climatic Data Centre (NCDC)/ NESDIS/NOAA Retrieved from: image - http://www.ncdc.noaa.gov/sotc/service/global/map-land-sfc-mntp/200907.gif, more information on image - http://www.ncdc.noaa.gov/sotc/global/2009/7 Retrieved: July 2009
Source: Temperature Anomalies September 2009 (with respect to a 1961-1990 base period), National Climatic Data Centre (NCDC)/ NESDIS/NOAA Retrieved from: image - http://www.ncdc.noaa.gov/sotc/service/global/map-land-sfc-mntp/200909.gif, more information on image - http://www.ncdc.noaa.gov/sotc/global/2009/9 Retrieved: September 2009
Source: Figure 1. Time series of yearly ocean heat content (1022J) for the 0–700 m layer. In Levitus, S., Antonov, J. I., Boyer, T. P., Locarnini, R. A., Garcia, H. E, Mishonov, A. V. 2009. Global ocean heat content 1955–2008 in light of recently revealed instrumentation problems. Retrieved from: ftp://ftp.nodc.noaa.gov/pub/data.nodc/woa/PUBLICATIONS/grlheat08.pdf Retrieved: February 14, 2012
Source: Climate Change 2001: The Scientific Basis. Working Group I Contribution to the Third Assessment Report of the Intergovernmental Panel on Climate Change, Summary for policy makers; Figure 5. Cambridge University Press. Retrieved from:

Climate Insights: Bite Size. External credits and sources. February 15, 2012
http://www.ipcc.ch/publications_and_data/publications_and_data_reports.shtml Retrieved: February 14, 2012 Credit: Figure 9. Warren Glacier in 1912 (top; W.J. Gray), 1928 (middle; BC Archives I-67560), and 2001 (bottom; J. Koch). In Koch, J., Menounos, B., & Clague, J. J. 2009. Glacier change in Garibaldi Provincial Park, southern Coast Mountains, British Columbia, since the Little Ice Age. Global and Planetary Change. 66: 161–178. Retrieved from: http://www.sfu.ca/~jkoch/gpc_2009.pdf Retrieved: May 2, 2011
Source: Bolch, T., Menounos, B., & Wheate, R. (2010). Landsat-based inventory of glaciers in western Canada, 1985–2005. Remote Sensing of Environment. 114: 127–137. Retrieved from: http://web.unbc.ca/~menounos/www/Bolch_et_al_2010.pdf Retrieved: June 8, 2011
Credit: WAC Bennett Dam, Photo is used courtesy of BC Hydro. All rights reserved. Retrieved from: http://www.bchydro.com/community/recreation_areas/w_a_c_bennett_dam_visitor_centre.html Retrieved: May 2, 2011
Credit: WAC Bennett Dam at night, Photo is used courtesy of BC Hydro. All rights reserved. Retrieved from: http://www.bchydro.com/news/press_centre/image_library/image_library_facilities.html#wac_bennett Retrieved: May 2, 2011
Climate Insights: Bite Size. External credits and sources. February 15, 2012
Credit: Sabrina Speich, Argo Program ( Retrieved from: http://earthobservatory.nasa.gov/Features/OceanCooling/ Retrieved: June 1, 2011.
Credit: Reto Stöckli Retrieved from:http://earthobservatory.nasa.gov/Features/OrbitsManeuver/ Retrieved: May 25, 2011
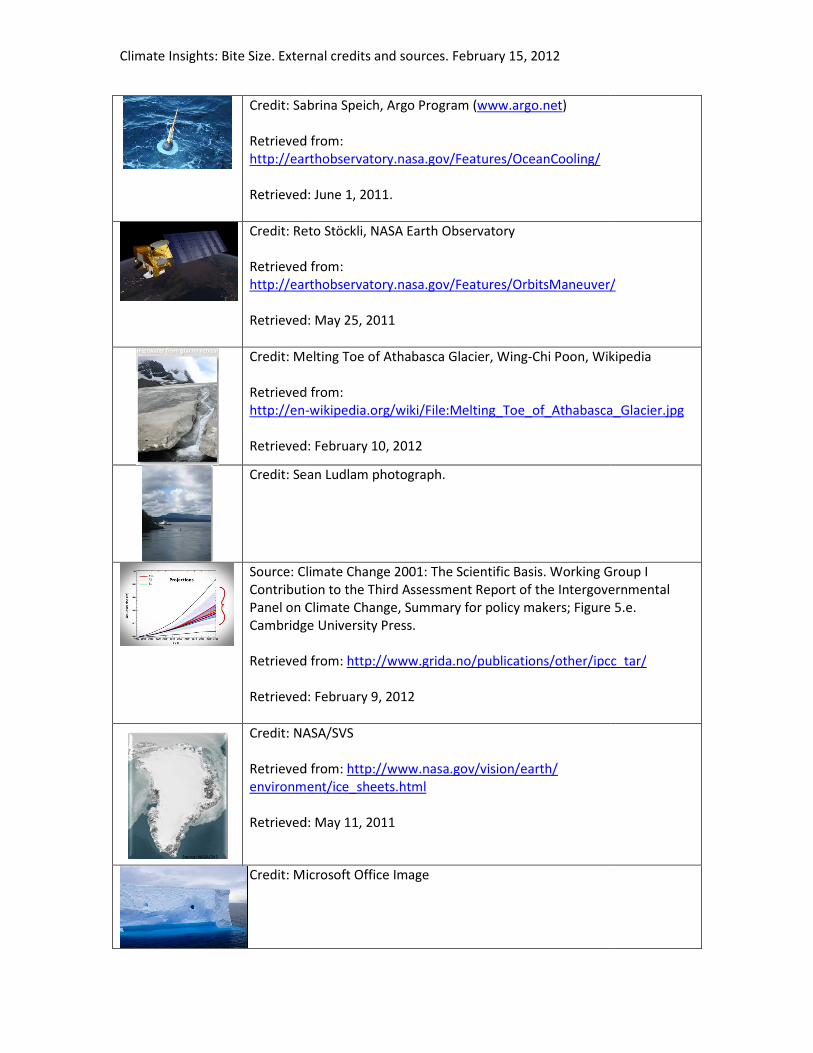
Credit: Melting Toe of Athabasca Glacier, Wing Retrieved from:http://en- Retrieved: February 10, 2012
Credit: Sean Ludlam photograph.
Source: Climate Change 2001: The Scientific Basis. Working Group I Contribution to the Third Assessment Report of Panel on Climate Change, Summary for policy makers; Figure 5.e. Cambridge University Press. Retrieved from: Retrieved: F
Credit: NASA/SVS Retrieved from: environment/ice_sheets.html Retrieved: May 11, 2011
Credit: Microsoft Office I
Climate Insights: Bite Size. External credits and sources. February 15, 2012
Credit: Sabrina Speich, Argo Program (www.argo.net)
Retrieved from: http://earthobservatory.nasa.gov/Features/OceanCooling/
Retrieved: June 1, 2011.
Reto Stöckli, NASA Earth Observatory
Retrieved from: http://earthobservatory.nasa.gov/Features/OrbitsManeuver/
Retrieved: May 25, 2011
Credit: Melting Toe of Athabasca Glacier, Wing-Chi Poon, Wikipedia
Retrieved from: -wikipedia.org/wiki/File:Melting_Toe_of_Athabasca_Glacier.jpg
Retrieved: February 10, 2012
Credit: Sean Ludlam photograph.
Source: Climate Change 2001: The Scientific Basis. Working Group I Contribution to the Third Assessment Report of the Intergovernmental Panel on Climate Change, Summary for policy makers; Figure 5.e. Cambridge University Press.
Retrieved from: http://www.grida.no/publications/other/ipcc_tar/
Retrieved: February 9, 2012
Credit: NASA/SVS
Retrieved from: http://www.nasa.gov/vision/earth/ environment/ice_sheets.html
Retrieved: May 11, 2011
Microsoft Office Image
http://earthobservatory.nasa.gov/Features/OrbitsManeuver/
Chi Poon, Wikipedia
wikipedia.org/wiki/File:Melting_Toe_of_Athabasca_Glacier.jpg
Source: Climate Change 2001: The Scientific Basis. Working Group I the Intergovernmental
Panel on Climate Change, Summary for policy makers; Figure 5.e.
http://www.grida.no/publications/other/ipcc_tar/

Climate Insights: Bite Size. External credits and sources. February 15, 2012
Credit: Microsoft Office I
Credit: Microsoft Office I
Credit: Microsoft Office I
Credit: Microsoft Office I
Credit: Microsoft Office I
Credit: Microsoft Office I
Credit: Microsoft Office I
Credit: Microsoft Office I
Climate Insights: Bite Size. External credits and sources. February 15, 2012
Microsoft Office Image
Microsoft Office Image
Microsoft Office Image
Microsoft Office Image
Microsoft Office Image
Microsoft Office Image
Microsoft Office Image
Microsoft Office Image

Climate Insights: Bite Size. External credits and sources. February 15, 2012
Credit: Microsoft Office Image
Credit: Microsoft Office Image
Source: Figure 2. Time series of (top) atmospheric CO2 and surface ocean pCO2 and (bottom) surface ocean pH at the atmospheric Mauna Loa Observatory (MLO) on the island of Hawai‘i and Station ALOHA in the subtropical North Pacific north of Hawai‘i, 1988–2008. [Adapted from J. E. Dore, R. Lukas, D. W. Sadler, M. J. Church, D. M. Karl. 2009. Physical and biogeochemical modulation of ocean acidification in the central North Pacific. Proceedings of the National Academy of Sciencs of the United States of America 106: 12235] in Doney, S. C. 2010. The Growing Human Footprint on Coastal and Open-Ocean Biogeochemistry. Science. 328: 1512-1516. Retrieved from: http://www.sciencemag.org/content/328/5985/1512.full#ref-26 Retrieved: January, 2011
Credit: The HOT (Hawai’i Ocean Timeseries) bathymetry map, Retrieved from: http://www.soest.hawaii.edu/HOT_WOCE/bath_HOT_terrain.html Retrieved: May 2, 2011
Credit: Image courtesy of HOT (Hawaiian Ocean Timeseries)/ SOEST (School of Ocean, Earth Science and Technology (SOEST) at the University of Hawaii at Manoa) Retrieved from: http://www.soest.hawaii.edu/soest_web/2009_news_PDFs/PNAS_Ocean_Acidification_release.pdf Retrieved: May 2, 2011

Climate Insights: Bite Size. External credits and sources. February 15, 2012
Credit: Microsoft Office Image
Credit: Microsoft Office Image
Credit: Microsoft Office Image
Credit: Microsoft Office
Credit: Microsoft Office Image
Source: Environment CanadaAnalysis (CCC
Credit: Courtesy of Greg Flato, Canadian Centre for Climate Modelling and Analysis (CCC Retrieved from: Greg Retrieved: January 2011
Credit: ESA/ NASA/ SOHO Retrieved from: http://sohowww.nascom.nasa.gov/gallery/bestofsoho.html Retrieved: May 31, 2011
Climate Insights: Bite Size. External credits and sources. February 15, 2012
Credit: Microsoft Office Image
Credit: Microsoft Office Image
Credit: Microsoft Office Image
Credit: Microsoft Office Image
Credit: Microsoft Office Image
Source: Environment Canada- Canadian Centre for Climate Modelling and CCCma)
Credit: Courtesy of Greg Flato, Canadian Centre for Climate Modelling and CCCma)
Retrieved from: Greg Flato
Retrieved: January 2011
Credit: ESA/ NASA/ SOHO
Retrieved from: http://sohowww.nascom.nasa.gov/gallery/bestofsoho.html
Retrieved: May 31, 2011
Canadian Centre for Climate Modelling and
Credit: Courtesy of Greg Flato, Canadian Centre for Climate Modelling and
Climate Insights: Bite Size. External credits and sources. February 15, 2012
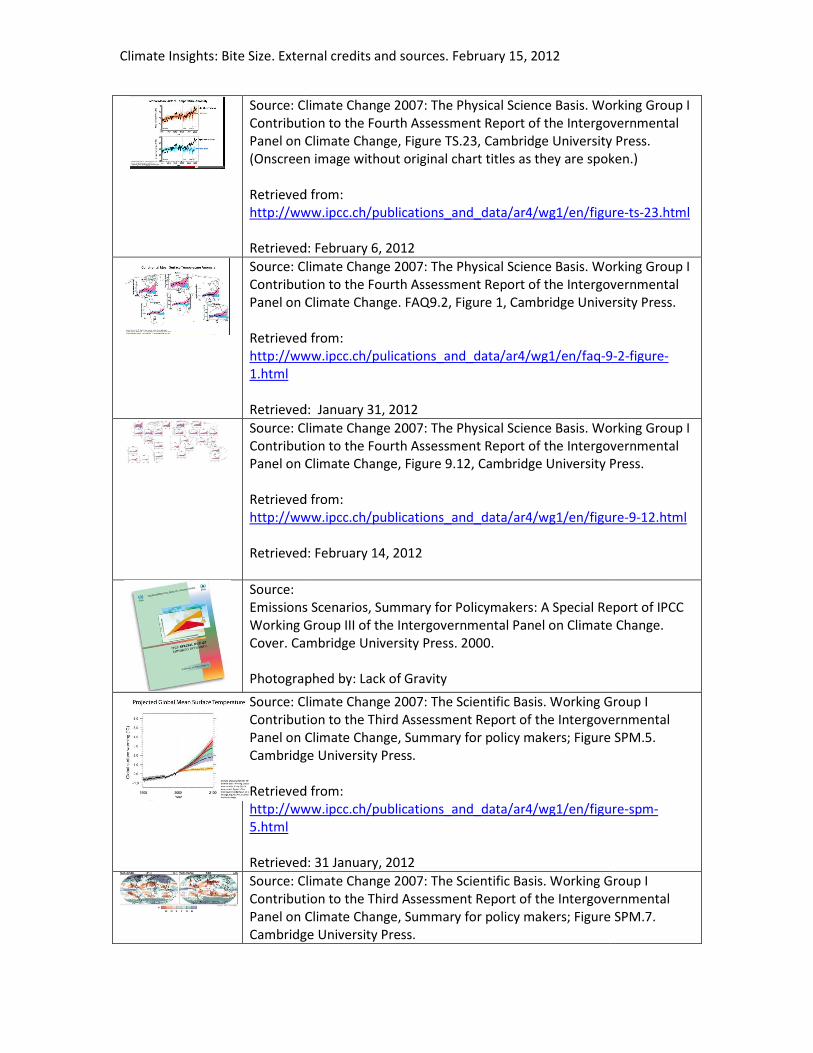
Source: Climate Contribution to the Fourth Assessment Report of the Intergovernmental Panel on Climate Change, Figure TS.23, Cambridge University Press.(Onscreen image without original chart titles as they are spok Retrieved from: http://www.ipcc.ch/publications_and_data/ar4/wg1/en/figure Retrieved: February 6, 2012
Source: Climate Change 2007: The Physical SciencContribution to the Fourth Assessment Report of the Intergovernmental Panel on Climate Change. FAQ9.2, Figure 1, Retrieved from:http://www.ipcc.ch/pulications_and_data/ar4/wg1/en/faq1.html Retrieved: January 31, 2012
Source: Climate Change 2007: The Physical Science Basis. Working Group I Contribution to the Fourth Assessment Report of the Panel on Climate Change, Figure Retrieved from:http://www.ipcc.ch/publications_and_data/ar4/wg1/en/figure Retrieved:
Source: Emissions Scenarios, Summary for Policymakers: A Special Report of IPCC Working Group III of the Intergovernmental Panel on Climate Change. Cover. Cambridge University Press. 2000. Photographed by: Lack of Gravity
Source: Climate Change 2007: The Scientific Basis. Working Group I Contribution to the Third Assessment Report of the Intergovernmental Panel on Climate Change, Summary for policy makers; Figure SPM.5. Cambridge University Press. Retrieved from:http://www.ipcc.ch/publications_and_data/ar4/wg1/en/figure5.html Retrieved: 31 January, 2012
Source: Climate Change 2007: The Scientific Basis. Working Group I Contribution to the Third Assessment Report of the Intergovernmental Panel on Climate Change, Summary for policy makers; Figure SPM.7. Cambridge University Press.
Climate Insights: Bite Size. External credits and sources. February 15, 2012
Source: Climate Change 2007: The Physical Science Basis. Working Group I Contribution to the Fourth Assessment Report of the Intergovernmental Panel on Climate Change, Figure TS.23, Cambridge University Press.(Onscreen image without original chart titles as they are spok
Retrieved from: http://www.ipcc.ch/publications_and_data/ar4/wg1/en/figure
Retrieved: February 6, 2012 Source: Climate Change 2007: The Physical Science Basis. Working Group I Contribution to the Fourth Assessment Report of the Intergovernmental Panel on Climate Change. FAQ9.2, Figure 1, Cambridge University Press.
Retrieved from: http://www.ipcc.ch/pulications_and_data/ar4/wg1/en/faq-9
Retrieved: January 31, 2012 Source: Climate Change 2007: The Physical Science Basis. Working Group I Contribution to the Fourth Assessment Report of the Intergovernmental Panel on Climate Change, Figure 9.12, Cambridge University Press.
Retrieved from: http://www.ipcc.ch/publications_and_data/ar4/wg1/en/figure
trieved: February 14, 2012
Emissions Scenarios, Summary for Policymakers: A Special Report of IPCC Working Group III of the Intergovernmental Panel on Climate Change. Cover. Cambridge University Press. 2000.
Photographed by: Lack of Gravity
Source: Climate Change 2007: The Scientific Basis. Working Group I Contribution to the Third Assessment Report of the Intergovernmental Panel on Climate Change, Summary for policy makers; Figure SPM.5. Cambridge University Press.
Retrieved from: http://www.ipcc.ch/publications_and_data/ar4/wg1/en/figure
Retrieved: 31 January, 2012 Source: Climate Change 2007: The Scientific Basis. Working Group I Contribution to the Third Assessment Report of the Intergovernmental Panel on Climate Change, Summary for policy makers; Figure SPM.7. Cambridge University Press.
Change 2007: The Physical Science Basis. Working Group I Contribution to the Fourth Assessment Report of the Intergovernmental Panel on Climate Change, Figure TS.23, Cambridge University Press. (Onscreen image without original chart titles as they are spoken.)
http://www.ipcc.ch/publications_and_data/ar4/wg1/en/figure-ts-23.html
e Basis. Working Group I Contribution to the Fourth Assessment Report of the Intergovernmental
Cambridge University Press.
9-2-figure-
Source: Climate Change 2007: The Physical Science Basis. Working Group I Intergovernmental
, Cambridge University Press.
http://www.ipcc.ch/publications_and_data/ar4/wg1/en/figure-9-12.html
Emissions Scenarios, Summary for Policymakers: A Special Report of IPCC Working Group III of the Intergovernmental Panel on Climate Change.
Source: Climate Change 2007: The Scientific Basis. Working Group I Contribution to the Third Assessment Report of the Intergovernmental Panel on Climate Change, Summary for policy makers; Figure SPM.5.
http://www.ipcc.ch/publications_and_data/ar4/wg1/en/figure-spm-
Source: Climate Change 2007: The Scientific Basis. Working Group I Contribution to the Third Assessment Report of the Intergovernmental Panel on Climate Change, Summary for policy makers; Figure SPM.7.

Climate Insights: Bite Size. External credits and sources. February 15, 2012
Retrieved from: http://www.ipcc.ch/publications_and_data/ar4/wg1/en/figure7.html Retrieved: 31 January, 2012
Credit: Pacific Climate Impacts Consortium, 2012
Source: Courtesy of Analysis (CCC Retrieved from: Greg Flato Retrieved: January 2011
Credit: View of the Columbia River from Cape Horn Trail, facing east toward Beacon Rock (in distance on left), 2009, author: etliebe Retrieved from:http://en.wikipedia.org/wiki/File:ColumbiaGorge_CapeHorn.jpg Retrieved: June, 2011
Credit: Microsoft Office Image
Credit: Microsoft Office Image
Credit: Microsoft Office
Credit: Microsoft Office Image
Climate Insights: Bite Size. External credits and sources. February 15, 2012
Retrieved from: http://www.ipcc.ch/publications_and_data/ar4/wg1/en/figure
Retrieved: 31 January, 2012
Credit: Pacific Climate Impacts Consortium, 2012
Courtesy of V. Kharin, Canadian Centre for Climate Modelling and CCCma)
Retrieved from: Greg Flato
Retrieved: January 2011
View of the Columbia River from Cape Horn Trail, facing east toward Beacon Rock (in distance on left), 2009, author: etliebe
Retrieved from: http://en.wikipedia.org/wiki/File:ColumbiaGorge_CapeHorn.jpg
Retrieved: June, 2011
Credit: Microsoft Office Image
Credit: Microsoft Office Image
Credit: Microsoft Office Image
Credit: Microsoft Office Image
http://www.ipcc.ch/publications_and_data/ar4/wg1/en/figure-spm-
, Canadian Centre for Climate Modelling and
View of the Columbia River from Cape Horn Trail, facing east toward Beacon Rock (in distance on left), 2009, author: etliebe
http://en.wikipedia.org/wiki/File:ColumbiaGorge_CapeHorn.jpg

Climate Insights: Bite Size. External credits and sources. February 15, 2012
Source: Figure 4.3.3 degree days (GDD) that are greater than 5oC using PRISM climatology. Source: PRISM data. In Murdock, T.Q., Bronaugh, D. revised 2009. climate impacts in British ColumbiaUniversity of Victoria, Victoria BC, 132 pp. Retrieved from: http://pacificclimate.org/sites/default/files/publications/Rodenhuis.ClimateOverview.Mar2009.pdf Retrieved:
Source: Figure 4.3.4 revised 2009 climate projection of mean annual growing degree days using downscaled temperature with PRISM climatology delta method with CGCM3 following A2 emissions scenario. Source: LLNL (IPCC AR4) data, Rodenhuis, D.R., Bennett, K.E., Werner, A.T., Murdock, T.Q., Bronaugh, D. revised 2009. Columbia. Pacific Climate Impacts Consortium, University of Victoria, Victoria BC, 132 pp. Retrieved from: http://pacificclimate.org/sites/default/files/publications/Rodenhuis.ClimateOverview.Mar2009.pdf Retrieved:
Credit: pk Retrieved from: http://pk- Retrieved: 6 February, 2012
Climate Insights: Bite Size. External credits and sources. February 15, 2012
Figure 4.3.3 – 1961 – 1990 climatology of mean annual growing degree days (GDD) that are greater than 5oC using PRISM climatology. Source: PRISM data. In Rodenhuis, D.R., Bennett, K.E., Werner, A.T.,
ck, T.Q., Bronaugh, D. revised 2009. Hydro-climatology and future climate impacts in British Columbia. Pacific Climate Impacts Consortium, University of Victoria, Victoria BC, 132 pp.
Retrieved from: http://pacificclimate.org/sites/default/files/publications/Rodenhuis.ClimateOverview.Mar2009.pdf
Retrieved: February 14, 2012 Figure 4.3.4 revised 2009 – 2050s (2041- 2070) high-resolution
climate projection of mean annual growing degree days using downscaled temperature with PRISM climatology delta method with CGCM3 following A2 emissions scenario. Source: LLNL (IPCC AR4) data, ClimateBC. In Rodenhuis, D.R., Bennett, K.E., Werner, A.T., Murdock, T.Q., Bronaugh, D. revised 2009. Hydro-climatology and future climate impacts in British
. Pacific Climate Impacts Consortium, University of Victoria, Victoria BC, 132 pp.
ved from: http://pacificclimate.org/sites/default/files/publications/Rodenhuis.ClimateOverview.Mar2009.pdf
Retrieved: February 14, 2012
Credit: pk-photography.blogspot
Retrieved from: -photography.blogspot.com/2009/03/canola.html
Retrieved: 6 February, 2012
1990 climatology of mean annual growing degree days (GDD) that are greater than 5oC using PRISM climatology.
Rodenhuis, D.R., Bennett, K.E., Werner, A.T., climatology and future
. Pacific Climate Impacts Consortium,
http://pacificclimate.org/sites/default/files/publications/Rodenhuis.Climat
resolution climate projection of mean annual growing degree days using downscaled temperature with PRISM climatology delta method with CGCM3 following
ClimateBC. In Rodenhuis, D.R., Bennett, K.E., Werner, A.T., Murdock, T.Q., Bronaugh, D.
climatology and future climate impacts in British . Pacific Climate Impacts Consortium, University of Victoria,
http://pacificclimate.org/sites/default/files/publications/Rodenhuis.Climat
Climate Insights: Clear the Air. External credits and sources. February 15, 2012
Credit: http://www.arthursclipart.org/silhouettes/people.htm
Credit: ESA/ Retrieved from: http://sohowww.nascom.nasa.gov/gallery/bestofsoho.html Retrieved:
Credit: Robert Rohde, Global Warming Art Retrieved from: http://www.globalwarmingart.com/wiki/File:Solar_Cycle_Variations_png Retrieved:
Credit: ESA/ NASA/ SOHO Retrieved from: http://sohowww.nascom.nasa.gov/gallery/bestofsoho.html Retrieved: May 31, 2011
Credit: T Alipalo/UNEP/Topham
Retrieved from: apps.org/resources/publications/MountainWatch_Bishkek/presspack/photos.htm
Retrieved: May 31, 2011
Credit: NASA, Goddard Institute for Space Studies (GISS) Retrieved from: Retrieved: July 11, 2011
Source: plot uses data from the NASA GISTEMP data set “TemperatureANOM.01 C, 1880 Retrieved from: http://data.giss.nasa.gov/gistemp/tabledata/GLB.Ts+dSST.txt
Climate Insights: Clear the Air. External credits and sources. February 15, 2012
Credit: http://www.arthursclipart.org/ (question marks); http://www.arthursclipart.org/silhouettes/people.htm (silhouettes)
Credit: ESA/ NASA/ SOHO
Retrieved from: http://sohowww.nascom.nasa.gov/gallery/bestofsoho.html
Retrieved: December 12, 2011
Credit: Robert Rohde, Global Warming Art
Retrieved from: http://www.globalwarmingart.com/wiki/File:Solar_Cycle_Variations_pn
Retrieved: December 13, 2011
Credit: ESA/ NASA/ SOHO
Retrieved from: http://sohowww.nascom.nasa.gov/gallery/bestofsoho.html
Retrieved: May 31, 2011
Credit: T Alipalo/UNEP/Topham
Retrieved from: http://www.unep-wcmc-apps.org/resources/publications/MountainWatch_Bishkek/presspack/photos.htm
Retrieved: May 31, 2011
Credit: NASA, Goddard Institute for Space Studies (GISS)
Retrieved from: http://www.oerrecommender.org/visits/109909
Retrieved: July 11, 2011
Source: plot uses data from the NASA GISTEMP data set “GHCN V2 TemperatureANOM (C) CR 1200KM, GLOBAL Temperature Anomalies in .01 C, 1880-present, base period: 1951-1980”
Retrieved from: http://data.giss.nasa.gov/gistemp/tabledata/GLB.Ts+dSST.txt
(silhouettes)
http://sohowww.nascom.nasa.gov/gallery/bestofsoho.html
http://www.globalwarmingart.com/wiki/File:Solar_Cycle_Variations_pn
http://sohowww.nascom.nasa.gov/gallery/bestofsoho.html
apps.org/resources/publications/MountainWatch_Bishkek/presspack/p
http://www.oerrecommender.org/visits/109909
GHCN V2 (C) CR 1200KM, GLOBAL Temperature Anomalies in
http://data.giss.nasa.gov/gistemp/tabledata/GLB.Ts+dSST.txt

Climate Insights: Clear the Air. External credits and sources. February 15, 2012
Retrieved
Credit: Stephen Wikipedia
Retrieved from: http://en.wikipedia.org/wiki/File:ConcordiaFromTower.jpg#file
Retrieved: 3 February 2021
Credit: www.easlyelements.com Retrieved from
Credit: H. Fischer/ Alfred Wegener Institute; http://www.awi.de/en/news/images_video_audio/terms_of_use/ Retrieved from: Retrieved: May, 2011
Original reference CORaynaud D., Barkov N.I., Barnola J.M., Basile I., Bender M., Chappellaz J., Davis J., Delaygue G., Delmotte M., Kotlyakov V.M., Lipenkov V., Lorius C., Pépin L., Ritz C., Saltzman E., Stievenard M. 1999. Climate and Atmospheric History of the Past 420,000 years from the Vostok Ice Core, Antarctica. Original reference for Vostok Temperature Data: JDelmotte, O. Cattani, G. Dreyfus, S. Falourd, G. Hoffmann, B. Minster, J. Nouet, J.M. Barnola, J. Chappellaz, H. Fischer, J.C. Gallet, S. Johnsen, M. Leuenberger, L. Loulergue, D. Luethi, H. Oerter, F. Parrenin, G. Raisbeck, D. RaynaudStauffer, J.P. Steffensen, B. Stenni, T.F. Stocker, J.L. Tison, M. Werner, and E.W. Wolff. 2007. Orbital and Millennial Antarctic Climate Variability over the Past 800,000 Years.
Source: Adapted from Climate Change 2007: The Physical Science Basis. Working Group I Contribution to the Fourth Assessment Report of the Intergovernmental Panel on Climate Change, FigureSection 7.3. Cambridge University Press. Retrieved from: Retrieved: June 2, 2011
Climate Insights: Clear the Air. External credits and sources. February 15, 2012
Retrieved: November 30, 2010
Credit: Stephen Hudson, Concordia Station (Dome C), 29 January, 2005, Wikipedia
Retrieved from: http://en.wikipedia.org/wiki/File:ConcordiaFromTower.jpg#file
Retrieved: 3 February 2021
Credit: www.easlyelements.com
Retrieved from http://www.easyelements.com/snowflake
Credit: H. Fischer/ Alfred Wegener Institute; http://www.awi.de/en/news/images_video_audio/terms_of_use/
Retrieved from: http://www.awi.de/People/show?hufische
Retrieved: May, 2011
Original reference CO2 data for Vostok data: Petit J.R., Jouzel J., Raynaud D., Barkov N.I., Barnola J.M., Basile I., Bender M., Chappellaz J., Davis J., Delaygue G., Delmotte M., Kotlyakov V.M., Legrand M., Lipenkov V., Lorius C., Pépin L., Ritz C., Saltzman E., Stievenard M. 1999. Climate and Atmospheric History of the Past 420,000 years from the Vostok Ice Core, Antarctica. Nature. 399: 429-436.
Original reference for Vostok Temperature Data: Jouzel, J., V. MassonDelmotte, O. Cattani, G. Dreyfus, S. Falourd, G. Hoffmann, B. Minster, J. Nouet, J.M. Barnola, J. Chappellaz, H. Fischer, J.C. Gallet, S. Johnsen, M. Leuenberger, L. Loulergue, D. Luethi, H. Oerter, F. Parrenin, G. Raisbeck, D. Raynaud, A. Schilt, J. Schwander, E. Selmo, R. Souchez, R. Spahni, B. Stauffer, J.P. Steffensen, B. Stenni, T.F. Stocker, J.L. Tison, M. Werner, and E.W. Wolff. 2007. Orbital and Millennial Antarctic Climate Variability over the Past 800,000 Years. Science. 317: 793-797.
Source: Adapted from Climate Change 2007: The Physical Science Basis. Working Group I Contribution to the Fourth Assessment Report of the Intergovernmental Panel on Climate Change, Figure 7.3; Chapter 7;Section 7.3. Cambridge University Press.
Retrieved from: http://www.ipcc.ch/graphics/ar4-wg1/jpg/fig
Retrieved: June 2, 2011
Hudson, Concordia Station (Dome C), 29 January, 2005,
http://en.wikipedia.org/wiki/File:ConcordiaFromTower.jpg#file
http://www.easyelements.com/snowflake-brushes.html
http://www.awi.de/en/news/images_video_audio/terms_of_use/
/www.awi.de/People/show?hufische
data for Vostok data: Petit J.R., Jouzel J., Raynaud D., Barkov N.I., Barnola J.M., Basile I., Bender M., Chappellaz
Legrand M., Lipenkov V., Lorius C., Pépin L., Ritz C., Saltzman E., Stievenard M. 1999. Climate and Atmospheric History of the Past 420,000 years from the
ouzel, J., V. Masson-Delmotte, O. Cattani, G. Dreyfus, S. Falourd, G. Hoffmann, B. Minster, J. Nouet, J.M. Barnola, J. Chappellaz, H. Fischer, J.C. Gallet, S. Johnsen, M. Leuenberger, L. Loulergue, D. Luethi, H. Oerter, F. Parrenin, G. Raisbeck,
, A. Schilt, J. Schwander, E. Selmo, R. Souchez, R. Spahni, B. Stauffer, J.P. Steffensen, B. Stenni, T.F. Stocker, J.L. Tison, M. Werner, and E.W. Wolff. 2007. Orbital and Millennial Antarctic Climate
797.
Source: Adapted from Climate Change 2007: The Physical Science Basis. Working Group I Contribution to the Fourth Assessment Report of the
7.3; Chapter 7;
wg1/jpg/fig-7-3.jpg

Climate Insights: Clear the Air. External credits and sources. February 15, 2012
Source: Doran, P. & Kendall, M. (2009). Examining consensus on climate change. Retrieved from: Retrieved: June 8, 2011
Climate Insights: Clear the Air. External credits and sources. February 15, 2012
Source: Doran, P. & Kendall, M. (2009). Examining the scientific consensus on climate change. Climate Change. 90(3): 21-22.
Retrieved from: http://tigger.uic.edu/~pdoran/012009_Doran_final.pdf
Retrieved: June 8, 2011
the scientific 22.
http://tigger.uic.edu/~pdoran/012009_Doran_final.pdf


