Climate Changes Projection for Land and Forest … Sulistianingsih, M Kiftiah, D Rosadi et al....
9
This content has been downloaded from IOPscience. Please scroll down to see the full text. Download details: IP Address: 118.97.73.93 This content was downloaded on 24/05/2017 at 07:59 Please note that terms and conditions apply. Climate Changes Projection for Land and Forest Fire Risk Assessment in West Kalimantan View the table of contents for this issue, or go to the journal homepage for more 2017 IOP Conf. Ser.: Earth Environ. Sci. 58 012030 (http://iopscience.iop.org/1755-1315/58/1/012030) Home Search Collections Journals About Contact us My IOPscience You may also be interested in: Analysis of Palm Oil Production, Export, and Government Consumption to Gross Domestic Product of Five Districts in West Kalimantan by Panel Regression E Sulistianingsih, M Kiftiah, D Rosadi et al. Looking at potential agricultural adaptation: Uncertainty in climate change projections Miroslav Trnka, M Svoboda, M Hayes et al. Rising floodwaters: mapping impacts and perceptions of flooding in Indonesian Borneo Jessie A Wells, Kerrie A Wilson, Nicola K Abram et al. Condensation trails in the regional climate model CCLM Andrew Ferrone, P Marbaix, B Matthews et al. Regional air quality impacts of future fire emissions in Sumatra and Kalimantan Miriam E Marlier, Ruth S DeFries, Patrick S Kim et al. A composite analysis of the Mesoscale Convective Complexes (MCCs) development over the Central Kalimantan and its relation with the propagation of the rainfall systems Trismidianto, E Yulihastin, H Satyawardhana et al. RAINFALL AT MOUNT HAMILTON (1880-91) Biomass burning drives atmospheric nutrient redistribution within forested peatlands in Borneo Alexandra G Ponette-González, Lisa M Curran, Alice M Pittman et al. Rainfall forecast in the Upper Mahaweli basin in Sri Lanka using RegCM model K M Muhammadh, M M M Mafas and S B Weerakoon
Transcript of Climate Changes Projection for Land and Forest … Sulistianingsih, M Kiftiah, D Rosadi et al....
This content has been downloaded from IOPscience. Please scroll down to see the full text.
Download details:
IP Address: 118.97.73.93
This content was downloaded on 24/05/2017 at 07:59
Please note that terms and conditions apply.
Climate Changes Projection for Land and Forest Fire Risk Assessment in West Kalimantan
View the table of contents for this issue, or go to the journal homepage for more
2017 IOP Conf. Ser.: Earth Environ. Sci. 58 012030
(http://iopscience.iop.org/1755-1315/58/1/012030)
Home Search Collections Journals About Contact us My IOPscience
You may also be interested in:
Analysis of Palm Oil Production, Export, and Government Consumption to Gross Domestic Product of
Five Districts in West Kalimantan by Panel Regression
E Sulistianingsih, M Kiftiah, D Rosadi et al.
Looking at potential agricultural adaptation: Uncertainty in climate change projections
Miroslav Trnka, M Svoboda, M Hayes et al.
Rising floodwaters: mapping impacts and perceptions of flooding in Indonesian Borneo
Jessie A Wells, Kerrie A Wilson, Nicola K Abram et al.
Condensation trails in the regional climate model CCLM
Andrew Ferrone, P Marbaix, B Matthews et al.
Regional air quality impacts of future fire emissions in Sumatra and Kalimantan
Miriam E Marlier, Ruth S DeFries, Patrick S Kim et al.
A composite analysis of the Mesoscale Convective Complexes (MCCs) development over the Central
Kalimantan and its relation with the propagation of the rainfall systems
Trismidianto, E Yulihastin, H Satyawardhana et al.
RAINFALL AT MOUNT HAMILTON (1880-91)
Biomass burning drives atmospheric nutrient redistribution within forested peatlands in Borneo
Alexandra G Ponette-González, Lisa M Curran, Alice M Pittman et al.
Rainfall forecast in the Upper Mahaweli basin in Sri Lanka using RegCM model
K M Muhammadh, M M M Mafas and S B Weerakoon

Climate Changes Projection for Land and Forest Fire Risk
Assessment in West Kalimantan
S D Jadmiko1*, D Murdiyarso
2, 3 and A Faqih
1, 3
1 Center for Climate Risk and Opportunity Management in Southeast Asia and Pacific
(CCROM-SEAP), Bogor Agricultural University, Bogor-Indonesia. 2 Center for International Forestry Research (CIFOR), Bogor-Indonesia.
3 Department of Geophysics and Meteorology, Bogor Agricultural University, Bogor-
Indonesia.
E-mail: [email protected]
Abstract. Risk analysis is a method used to determine the probability of disaster in the current
and future. This research analyse of fire risk in West Kalimantan by using extreme climate and
vulnerability analysis. Extreme climate was calculated based on the extreme dry rainfall from
regional climate model RegCM4.4 outputs. Vulnerability analysis was conducted by using a
composite mapping analysis used hotspot data and eleven indicators of vulnerability. We found
that very high level of extreme dry rainfall located in the southern region and the western coast
area of West Kalimantan. This condition was influenced by environment factors such as
topography and land use. Extreme dry rainfall also associated with the pattern of annual rainfall
in West Kalimantan which ranges between 1753-4861 mm. Modelling of the vulnerability of
land and forest fires in West Kalimantan showed that the land use has impact 24% on the
vulnerability model. The results of the vulnerability model analysis shows that the plantations
areas and secondary swamp forests are highly vulnerable, particularly on the peat area with
depth about 50-200 cm. The analysis of land and forest fires risk found that the vulnerable
areas have high risk which is largely unmanaged plantation areas and peatlands.
1. Introduction
Forest and land fires have become the annual disaster phenomena in Indonesia, especially in Sumatra
and Kalimantan. In the last two decades, the massive event of land and forest fires occurred during the
El-Niño year at 1982/83, 1987, 1991, 1994 and 1997/98 [1]. El-Niño affects the drought and this
condition cause the flammable areas [2-3]. The fires of 1997/1998 had become the largest land and
forest fire event in Indonesia and caused large losses [4]. The main impact of forest and land fires is
the haze, which is not only impacted of human health, but also socio-economic activities. Forest and
land fire also caused land degradation and changes of forest function [5]
Forest and land fire is influenced by climates, fuels, ignition agents and human activities [6].
However, climates and human activities have become the dominant factor in Indonesia [5]. Climate
(especially rainfall) will be affected the land drought. Strongly drought relates to fires event in
Indonesia. For example, forest and land fire in 1997/1998 in Indonesia caused drought due to El-Niño
events [7].
Climate change has impacts on rainfall changes which is can be changes the pattern of future
droughts and the fires risk. Risk is a tools to assess the probability impact of disaster likes fires [8].
The level of risk can be determined by a probability of disaster (e.g. extremes climate) and that impact.
1
ISS IOP PublishingIOP Conf. Series: Earth and Environmental Science 58 (2017) 012030 doi:10.1088/1755-1315/58/1/012030
International Conference on Recent Trends in Physics 2016 (ICRTP2016) IOP PublishingJournal of Physics: Conference Series 755 (2016) 011001 doi:10.1088/1742-6596/755/1/011001
Content from this work may be used under the terms of the Creative Commons Attribution 3.0 licence. Any further distributionof this work must maintain attribution to the author(s) and the title of the work, journal citation and DOI.
Published under licence by IOP Publishing Ltd

The impact caused by a disaster is determined by the level of vulnerability. Therefore, the risk can be
calculated based on the relationship between probabilities of the hazard event and the level of
vulnerability (risk = hazard x vulnerability) [9]. The concept of risk is widely used to assess in the
current condition and the future due to climate changes. Understanding of fires risk would be minimize
the potential impact of land and forest fires.
The objective of this research is to analyse the forest and land fires risk in West Kalimantan
Province by using extreme climate and vulnerability analysis. Extreme climate was calculated based
on the extreme dry rainfall with threshold value using 5th
and 10th percentile. The extreme climate
analysis, historical climate data information and projections were obtained through dynamical
downscaling by using regional climate model RegCM4.4. Vulnerability analysis was conducted by
using a composite mapping analysis used hotspot data and eleven indicators of vulnerability.
2. Fire Risk Analysis
Assessment of fire risk based on a matrix of risk that combines vulnerability analysis and the extreme
dry rainfall (Table 1).
Table 1. Matrix of Fire Risk with five level (Very Low;
VL, Low; L, Medium; M, High; H, Very High; VH).
Category of monthly extreme dry rainfall: (1) 0-40 mm,
(2) 41-80 mm, (3) 81-120 mm, (4) 121-160 mm dan (5)
161-200 mm.
Vulnerability
Level
Category of Extreme Dry Rainfall
5 4 3 2 1
VL VL VL L L M
L VL L L M H
M L L M H H
H L M H H VH
VH M H H VH VH
The vulnerability level could be calculated based on statistical approach of scores and weights of
vulnerability indicators. We used the composite mapping analysis (CMA) to calculate of scores and
weight of the level of vulnerability. This method was widely used in spatial analysis, not only in
determining fires vulnerability but also can be used in other spatial vulnerability [10-11]. Scores for
each indicator was calculated by using formula:
Xi= [Oi
Ei
] ×100
∑Oi
Ei
ni=1
(1)
Ei= [T×F
100] (2)
With the Xi as Actual score for each indicator, Oi as number of hotspots at each classes of indicator
(observed hotspot), Ei as expected hotspot for each indicator, T as total of number of hotspot for each
indicator, F as percentage of areas (Ha) for each classes of indicator and i as classes of indicator. The
rescaling scores was created with scale about 10-100 following the formula:
Score Rout= [(ScoreEinput-ScoreEmin
ScoreEmax-ScoreEmin
) ×(ScoreRmax-ScoreRmin)] +ScoreRmin (3)
2
ISS IOP PublishingIOP Conf. Series: Earth and Environmental Science 58 (2017) 012030 doi:10.1088/1755-1315/58/1/012030
With the Score Rout as rescaling score, Score Einput as estimate score input, ScoreEmin as minimum
estimated scores, ScoreEmax as maximum estimated scores, ScoreRmax as maximum of rescaling scores
(100) and ScoreRmin as minimum of rescaling scores (10). The level of vulnerability used in this
analysis included 5 levels (very low, low, medium, high and very high).
Analysis of extreme climate is more emphasized on rainfall due to its significant impacts on
drought condition. There are several ways to define the climate extremes. Chu et al. [12] suggested
three common approaches in defining extreme based on, i.e. i) actual rainfall values, ii) data
probability distributions exceeding 95th
or 99th
percentile and less than 10th
or 5th percentile, and iii)
return periods of maximum annual rainfall. In this study, we used the probability analysis for
analyzing the extreme dry rainfall with threshold 10th and 5
th percentile. Extreme dry rainfall calculated
for dry season at June-July-August (JJA).
The climate data for calculated the extreme dry rainfall generated by the dynamical downscaling
analysis using model RegCM4.4. Simulations of RegCM4.4 conducted to obtain the climate
information with high resolution. The outputs of simulations validated by using observations data in
West Kalimantan. Simulation model RegCM4.4 intended to projection of climate in the future based
on RCP-4.5 climate scenarios [13]. Projections of climate made for the 2016-2040 with the baseline
year at the 1981-2005.
3. Result
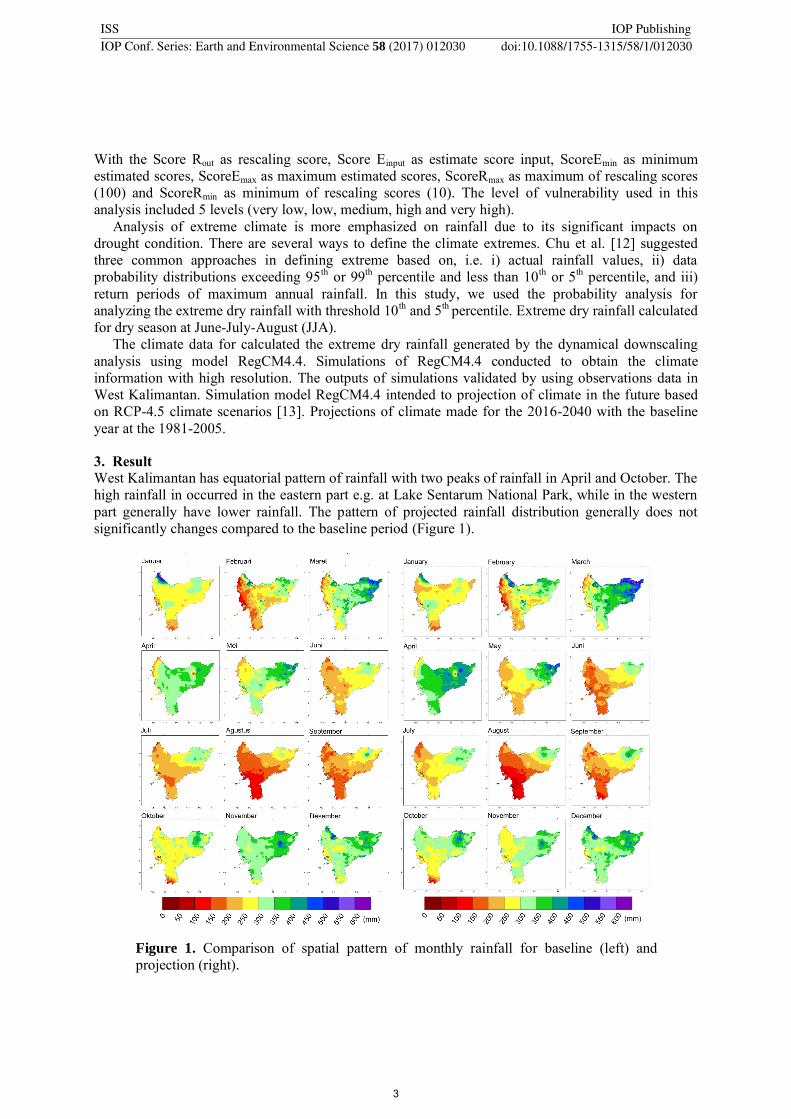
West Kalimantan has equatorial pattern of rainfall with two peaks of rainfall in April and October. The
high rainfall in occurred in the eastern part e.g. at Lake Sentarum National Park, while in the western
part generally have lower rainfall. The pattern of projected rainfall distribution generally does not
significantly changes compared to the baseline period (Figure 1).
Figure 1. Comparison of spatial pattern of monthly rainfall for baseline (left) and
projection (right).
3
ISS IOP PublishingIOP Conf. Series: Earth and Environmental Science 58 (2017) 012030 doi:10.1088/1755-1315/58/1/012030

Figure 2. Projected monthly rainfall changes (%) at
2016-2040 relative to 981-2005 for West Kalimantan.
The results of the rainfall changes analysis indicate decreased in January, May, June and November
and increased in other months. The highest decrease rainfall occurs in November, which reached 7.8%
compared with the baseline period, while the highest increase occurred in February, which reached
11.1% (Figure 2). Based on the pattern of these changes, the changes of rainfall (both increases and
decreases) can occur in wet or dry season. The condition is certainly interesting to see how the impact
of this change on extreme climate in the future.
Figure 3. Pattern of baseline extreme dry rainfall at June-July-August (JJA) based on threshold by
5th
percentile (left) and 10th percentile (right). The very extreme dry conditions generally occur in
the southern part of West Kalimantan.
Analysis of extreme dry rainfall shows that areas of dry conditions due to low rainfall in the
baseline period occurred in southern and western parts. Northern area has a lower levels of dry
extreme rainfall than in other regions. The dry season (JJA) rainfall at the northern part generally
above 100 mm. The pattern of extreme dry condition above happen to the threshold with 5th
and 10th
percentile (Figure 3).
Projected of extreme dry rainfall projection shows that an increase in the area of extreme drought.
With the 5th
percentile, the very extreme dry rainfall areas becomes more widespread until the middle
part of West Kalimantan. Similarly, in the 10th
percentile value where most of the southern part of
4
ISS IOP PublishingIOP Conf. Series: Earth and Environmental Science 58 (2017) 012030 doi:10.1088/1755-1315/58/1/012030
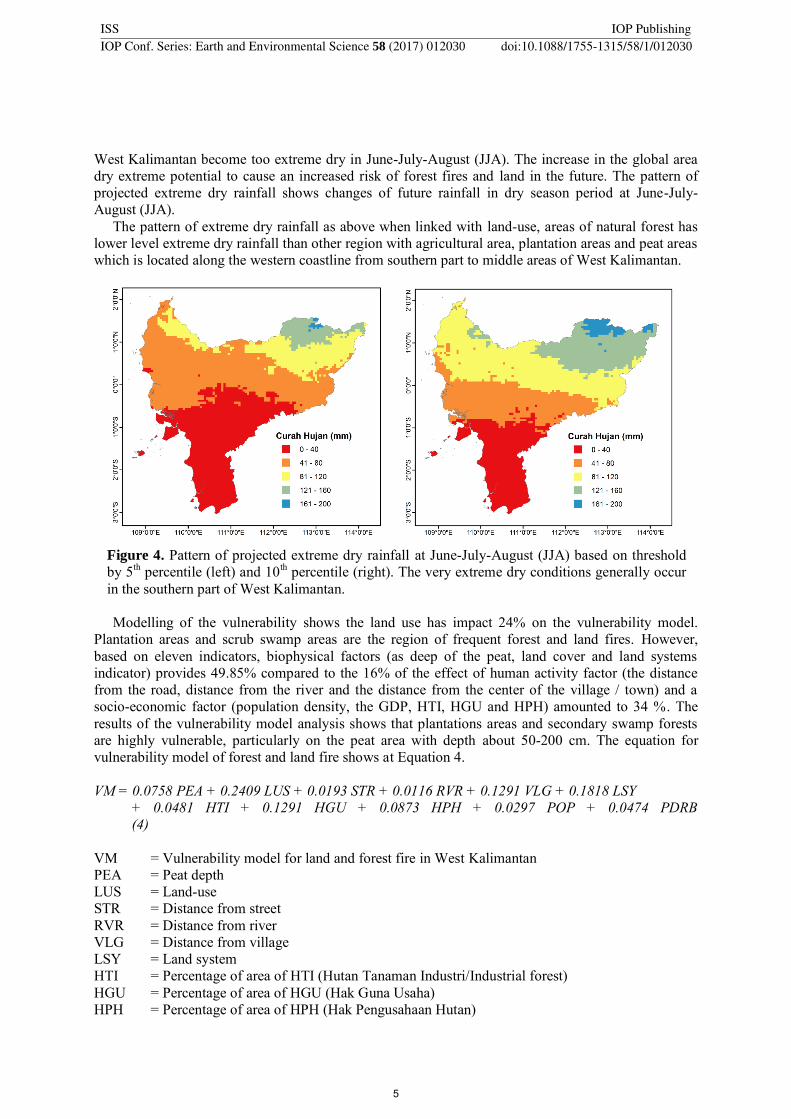
West Kalimantan become too extreme dry in June-July-August (JJA). The increase in the global area
dry extreme potential to cause an increased risk of forest fires and land in the future. The pattern of
projected extreme dry rainfall shows changes of future rainfall in dry season period at June-July-
August (JJA).
The pattern of extreme dry rainfall as above when linked with land-use, areas of natural forest has
lower level extreme dry rainfall than other region with agricultural area, plantation areas and peat areas
which is located along the western coastline from southern part to middle areas of West Kalimantan.
Figure 4. Pattern of projected extreme dry rainfall at June-July-August (JJA) based on threshold
by 5th percentile (left) and 10
th percentile (right). The very extreme dry conditions generally occur
in the southern part of West Kalimantan.
Modelling of the vulnerability shows the land use has impact 24% on the vulnerability model.
Plantation areas and scrub swamp areas are the region of frequent forest and land fires. However,
based on eleven indicators, biophysical factors (as deep of the peat, land cover and land systems
indicator) provides 49.85% compared to the 16% of the effect of human activity factor (the distance
from the road, distance from the river and the distance from the center of the village / town) and a
socio-economic factor (population density, the GDP, HTI, HGU and HPH) amounted to 34 %. The
results of the vulnerability model analysis shows that plantations areas and secondary swamp forests
are highly vulnerable, particularly on the peat area with depth about 50-200 cm. The equation for
vulnerability model of forest and land fire shows at Equation 4.
VM = 0.0758 PEA + 0.2409 LUS + 0.0193 STR + 0.0116 RVR + 0.1291 VLG + 0.1818 LSY
+ 0.0481 HTI + 0.1291 HGU + 0.0873 HPH + 0.0297 POP + 0.0474 PDRB
(4)
VM = Vulnerability model for land and forest fire in West Kalimantan
PEA = Peat depth
LUS = Land-use
STR = Distance from street
RVR = Distance from river
VLG = Distance from village
LSY = Land system
HTI = Percentage of area of HTI (Hutan Tanaman Industri/Industrial forest)
HGU = Percentage of area of HGU (Hak Guna Usaha)
HPH = Percentage of area of HPH (Hak Pengusahaan Hutan)
5
ISS IOP PublishingIOP Conf. Series: Earth and Environmental Science 58 (2017) 012030 doi:10.1088/1755-1315/58/1/012030
POP = Population density
PDRB = Produk Domestik Regional Bruto (Gross Regional Domestic Bruto)
Spatial planning needs to consider the condition of land use in view of the condition that affects the
vulnerability of land and forest fires. Changes in land-use will affect the vulnerability of forest and
land fires. If the type of land-use changes with the area which has a strong correlation with the
presence of hotspots, then most likely will increase the level of vulnerability. Conversely, when the
land-use be returned in their original function, the vulnerability of land and forest fires will likely
decrease.
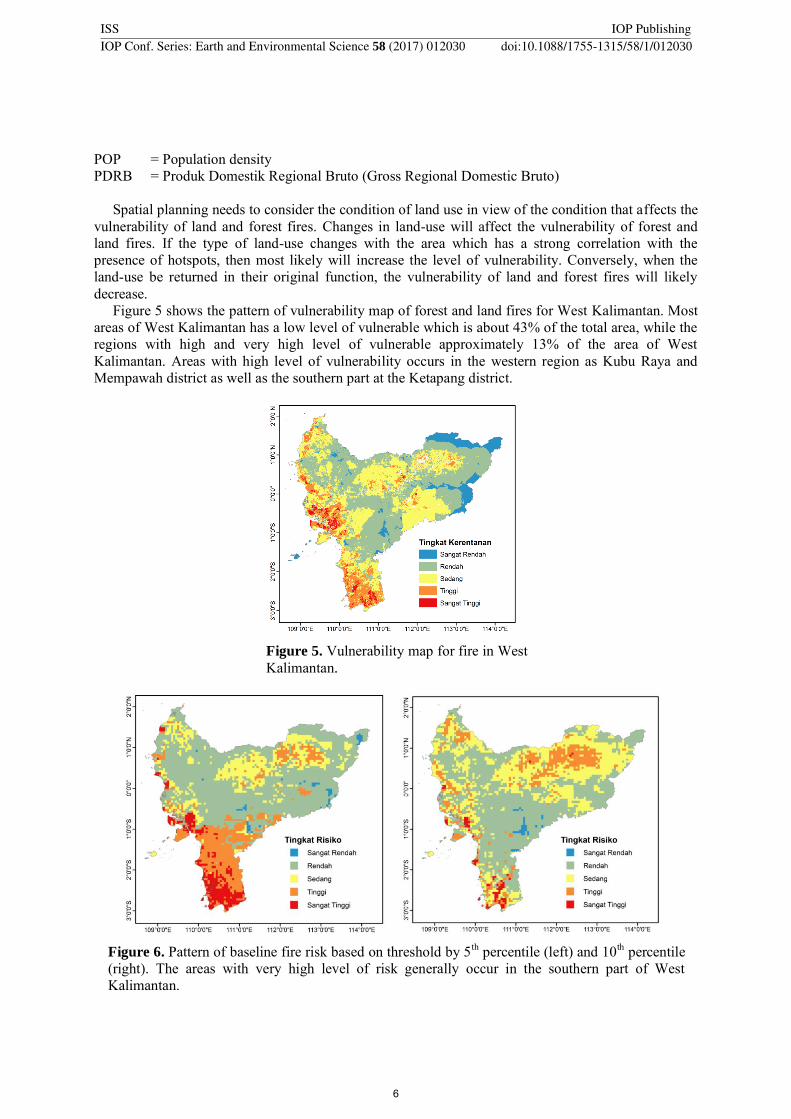
Figure 5 shows the pattern of vulnerability map of forest and land fires for West Kalimantan. Most
areas of West Kalimantan has a low level of vulnerable which is about 43% of the total area, while the
regions with high and very high level of vulnerable approximately 13% of the area of West
Kalimantan. Areas with high level of vulnerability occurs in the western region as Kubu Raya and
Mempawah district as well as the southern part at the Ketapang district.
Figure 5. Vulnerability map for fire in West
Kalimantan.
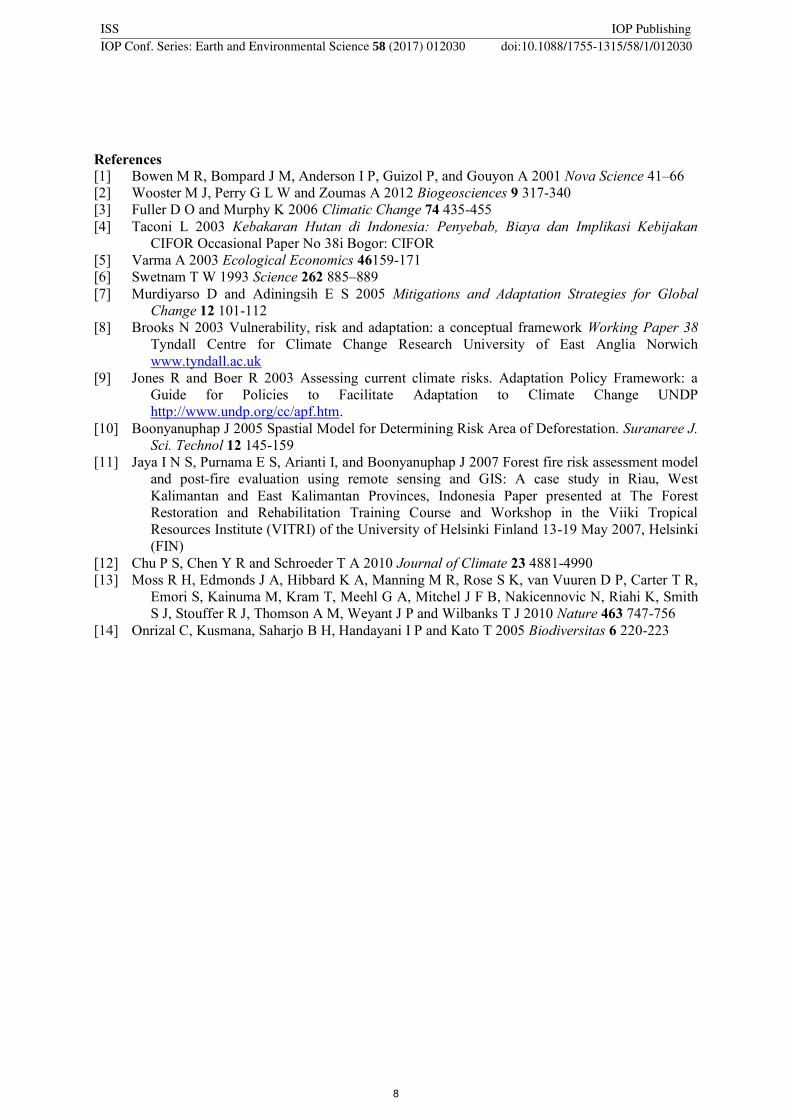
Figure 6. Pattern of baseline fire risk based on threshold by 5th percentile (left) and 10
th percentile
(right). The areas with very high level of risk generally occur in the southern part of West
Kalimantan.
6
ISS IOP PublishingIOP Conf. Series: Earth and Environmental Science 58 (2017) 012030 doi:10.1088/1755-1315/58/1/012030

Figure 7. Pattern of projected of fire risk based on threshold by 5th
percentile (left) and 10th
percentile (right). The areas with very high level of risk generally occur in the southern part of
West Kalimantan.
The very high level of fires risk occur in the southern part and the western part of West Kalimantan
with land-use as peat areas and shrub swamps. In an area of natural forest, the level of fires risk has
low level. The extreme dry rainfall value by 5th percentile indicates a higher risk than the 10
th
percentile. Projected of fires risk showed an increased risk in the southern part of West Kalimantan
and decreased of fires risk in the northern part and eastern part. With 5th
percentile a decrease in the
fires risk in the northern region, while with 10th
percentile can be clearly seen that the southern part has
increased of fires risk in the future (Figure 7).
The very high level of fires risk generally located at secondary swamp forest land and shrub swamp
in the southern part of West Kalimantan. These region also the location of peatlands, which has a
depth about 50-200 cm. Areas with high level of vulnerability generally located on plantation areas
and peat swamp forests rounded the Danau Sentarum National Park (DSNP). Normally, the DSNP
region is a protected national park. However, there is a tendency in the communities around these
location will conduct fishing activities during the dry season. These activities allegedly affect the fires
risk where they will do the expansion of fishing regions in a way that could be caused forest and land
fires [14].
4. Conclusion
The rainfall pattern in West Kalimantan is equatorial pattern with high rainfall locate in the northern
and eastern part, while low rainfall in the southern and western part. Projected rainfall in 2016-2040
relative to the 1981-2005 indicate that an increase rainfall in the rainy season and decrease during the
dry season. Projected of the extreme dry rainfall will increased and over most of West Kalimantan
areas.
Vulnerability models of fire showed that some indicators such as land cover, distance from the
center of government / village and land systems have a strong influence at the number of hotspot.
Areas with the peat and agricultural areas has a propensity of a higher level of vulnerability compared
to other land-use. Areas with high and very high level of vulnerability generally located on the
southern and western parts of West Kalimantan province, while the level of vulnerability of low and
very low generally in northern and eastern part.
The risk of forest and land fires for baseline condition have the same pattern with the patterns of
vulnerability. In the projection period, the risk of forest and land fires increased with the wider region.
The trend of decreased rainfall during the dry season in the future will contributed to the increased of
risk level of forest and land fires.
7
ISS IOP PublishingIOP Conf. Series: Earth and Environmental Science 58 (2017) 012030 doi:10.1088/1755-1315/58/1/012030
References
[1] Bowen M R, Bompard J M, Anderson I P, Guizol P, and Gouyon A 2001 Nova Science 41–66
[2] Wooster M J, Perry G L W and Zoumas A 2012 Biogeosciences 9 317-340
[3] Fuller D O and Murphy K 2006 Climatic Change 74 435-455
[4] Taconi L 2003 Kebakaran Hutan di Indonesia: Penyebab, Biaya dan Implikasi Kebijakan
CIFOR Occasional Paper No 38i Bogor: CIFOR
[5] Varma A 2003 Ecological Economics 46159-171
[6] Swetnam T W 1993 Science 262 885–889
[7] Murdiyarso D and Adiningsih E S 2005 Mitigations and Adaptation Strategies for Global
Change 12 101-112
[8] Brooks N 2003 Vulnerability, risk and adaptation: a conceptual framework Working Paper 38
Tyndall Centre for Climate Change Research University of East Anglia Norwich
www.tyndall.ac.uk
[9] Jones R and Boer R 2003 Assessing current climate risks. Adaptation Policy Framework: a
Guide for Policies to Facilitate Adaptation to Climate Change UNDP
http://www.undp.org/cc/apf.htm.
[10] Boonyanuphap J 2005 Spastial Model for Determining Risk Area of Deforestation. Suranaree J.
Sci. Technol 12 145-159
[11] Jaya I N S, Purnama E S, Arianti I, and Boonyanuphap J 2007 Forest fire risk assessment model
and post-fire evaluation using remote sensing and GIS: A case study in Riau, West
Kalimantan and East Kalimantan Provinces, Indonesia Paper presented at The Forest
Restoration and Rehabilitation Training Course and Workshop in the Viiki Tropical
Resources Institute (VITRI) of the University of Helsinki Finland 13-19 May 2007, Helsinki
(FIN)
[12] Chu P S, Chen Y R and Schroeder T A 2010 Journal of Climate 23 4881-4990
[13] Moss R H, Edmonds J A, Hibbard K A, Manning M R, Rose S K, van Vuuren D P, Carter T R,
Emori S, Kainuma M, Kram T, Meehl G A, Mitchel J F B, Nakicennovic N, Riahi K, Smith
S J, Stouffer R J, Thomson A M, Weyant J P and Wilbanks T J 2010 Nature 463 747-756
[14] Onrizal C, Kusmana, Saharjo B H, Handayani I P and Kato T 2005 Biodiversitas 6 220-223
8
ISS IOP PublishingIOP Conf. Series: Earth and Environmental Science 58 (2017) 012030 doi:10.1088/1755-1315/58/1/012030