Climate Change - University of Otago
49
Climate Change Why we have to get off the carbon intensive gravy train 14 August 2009
Transcript of Climate Change - University of Otago
Climate Change
Why we have to get off the carbon
intensive gravy train
14 August 2009

14 August 2009
Outline
• The greenhouse effect and climate change
• Observed climate
• Impacts of climate change
• Climate scenarios for the future
• Impacts
• Why it is urgent

14 August 2009
The greenhouse effect
• Long-term balance controlled by:
– Amount & distribution of sunlight (nature)
– Greenhouse gas concentrations (man & nature)
• Atmosphere is 0.04% CO2– Difference between +15°C and -18°C

14 August 2009
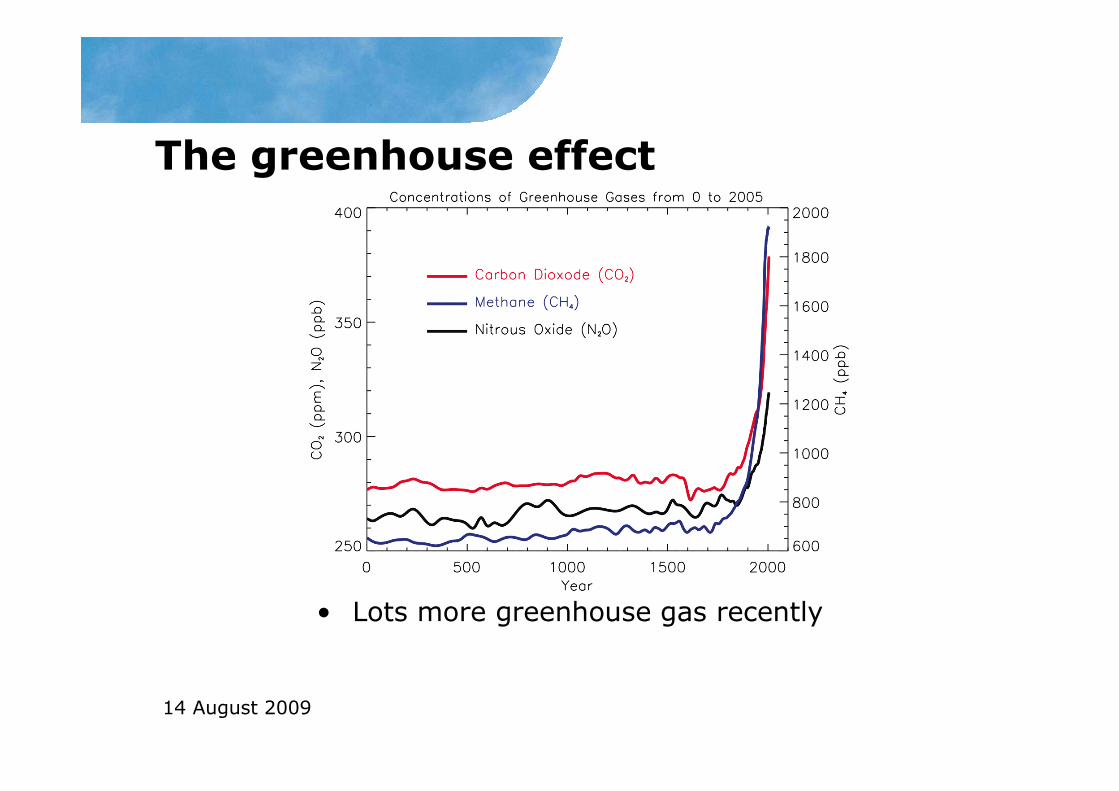
Global atmospheric concentrations of carbon dioxide,
methane and nitrous oxide have increased marked as a result of human activities since 1750, and now far exceed values for at least the last 650,000 years.
The greenhouse effect
14 August 2009
The greenhouse effect
• Lots more greenhouse gas recently

14 August 2009
Fossil fuel burning adds
7 GtC+2 GtC from
deforestation
Oceans take up 2 GtC
Biosphere takes up 2 GtC
Humanity & the carbon cycle
• Human inputs are about 10% of the natural (balanced) cycle– Net gain to atmosphere over time significant (~100 year lifetime)– Inputs increasing faster than expected, sinks becoming weaker (BAS)– We are important players in the climate system
Atmosphere gains 4-5 GtC= about half of
total human source
14 August 2009
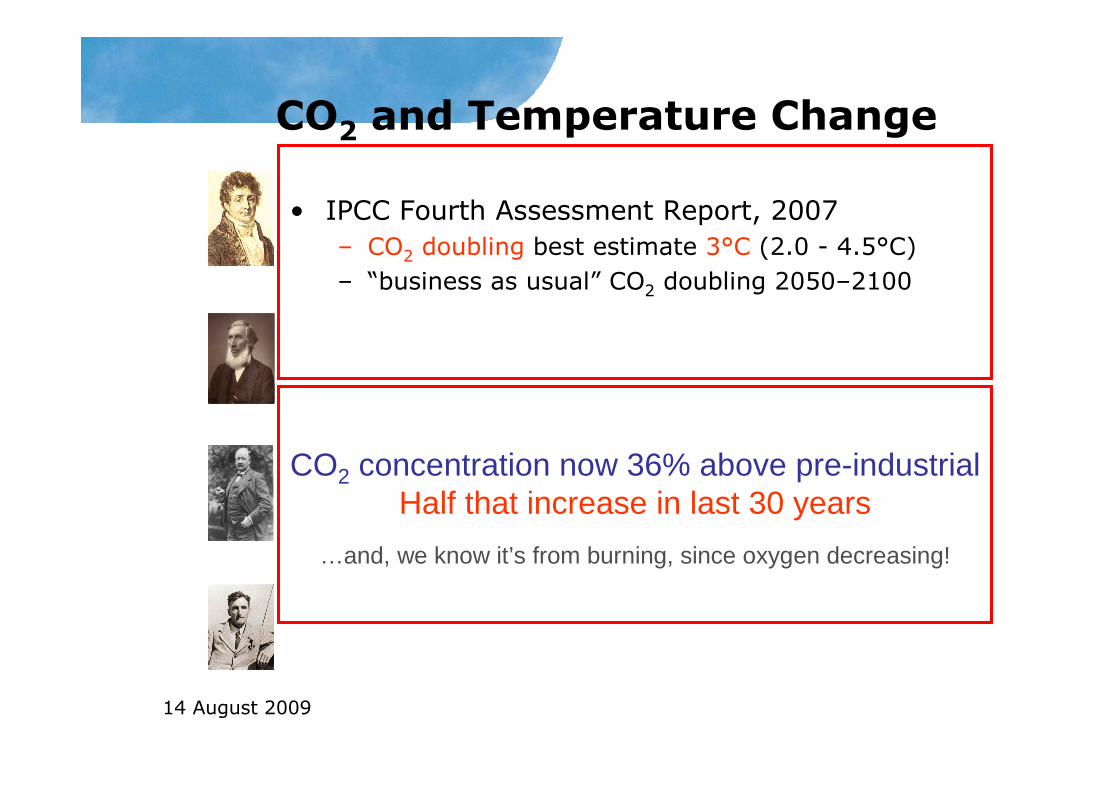
CO2 and Temperature Change
• Joseph Fourier – 1820s– Calculated Earth’s “equilibrium” temperature
• Surface must be warmer because of the atmosphere
• John Tyndall, Irish earth scientist, 1860s– Found CO2 and H2O are key greenhouse gases
• Atmosphere blocks heat from escaping to space
• Svante Arrhenius, Swedish chemist, ~1900– Doubling CO2 would raise temperatures 5°C
• Could happen over several centuries.
• Guy Callendar, English engineer, 1930’s– Doubling CO2 would raise temperatures 2°C
• Collated first observations of global warming
• IPCC Fourth Assessment Report, 2007
– CO2 doubling best estimate 3°C (2.0 - 4.5°C)
– “business as usual” CO2 doubling 2050–2100
CO2 concentration now 36% above pre-industrialHalf that increase in last 30 years
…and, we know it’s from burning, since oxygen decreasing!

14 August 2009
Observed climate
• observations of increases in global average air and ocean temperatures with warmest years recently
• oceans warming and sea levels rising
• northern hemisphere snow cover decreasing
• less frosts, more heatwaves

14 August 2009
Observed climate
14 August 2009
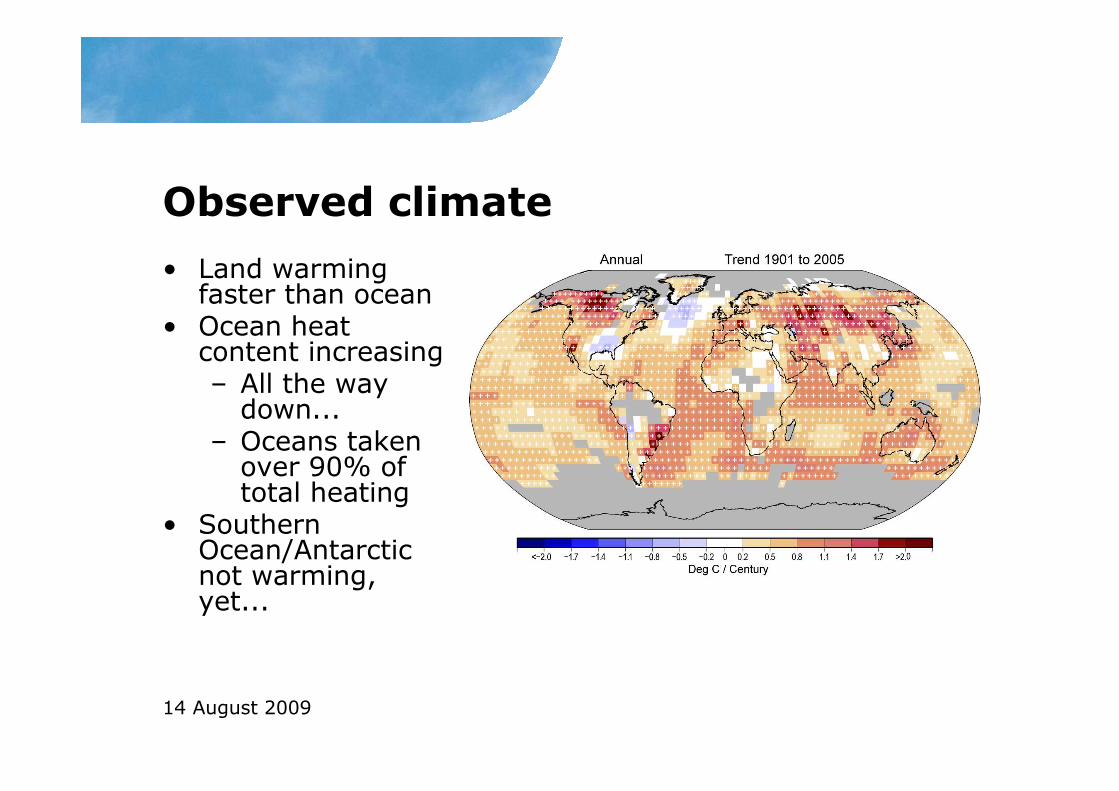
Observed climate
• Land warming faster than ocean
• Ocean heat content increasing– All the way down...
– Oceans taken over 90% of total heating
• Southern Ocean/Antarctic not warming, yet...
14 August 2009
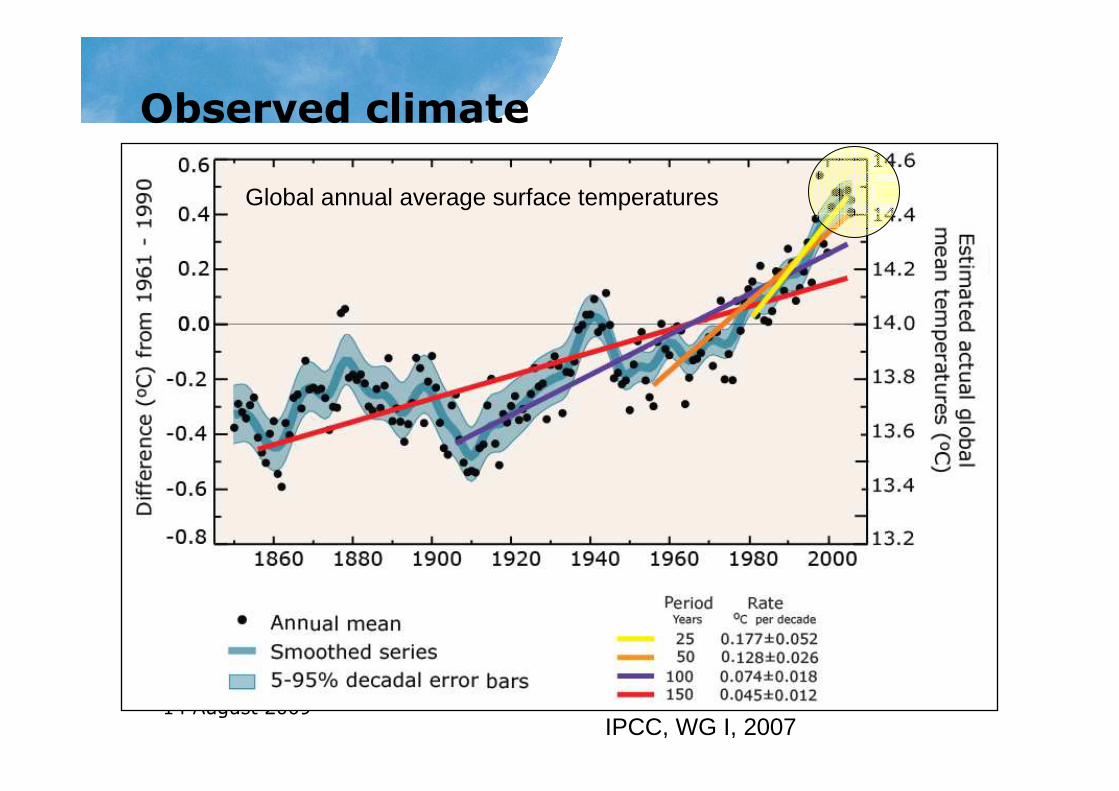
Observed climate
Global annual average surface temperatures
IPCC, WG I, 2007

14 August 2009
Observed climate
• The upper atmosphere is cooling
• The lower atmosphere is warming
• Trends from weather balloons and satellite sensed temperatures are similar
14 August 2009
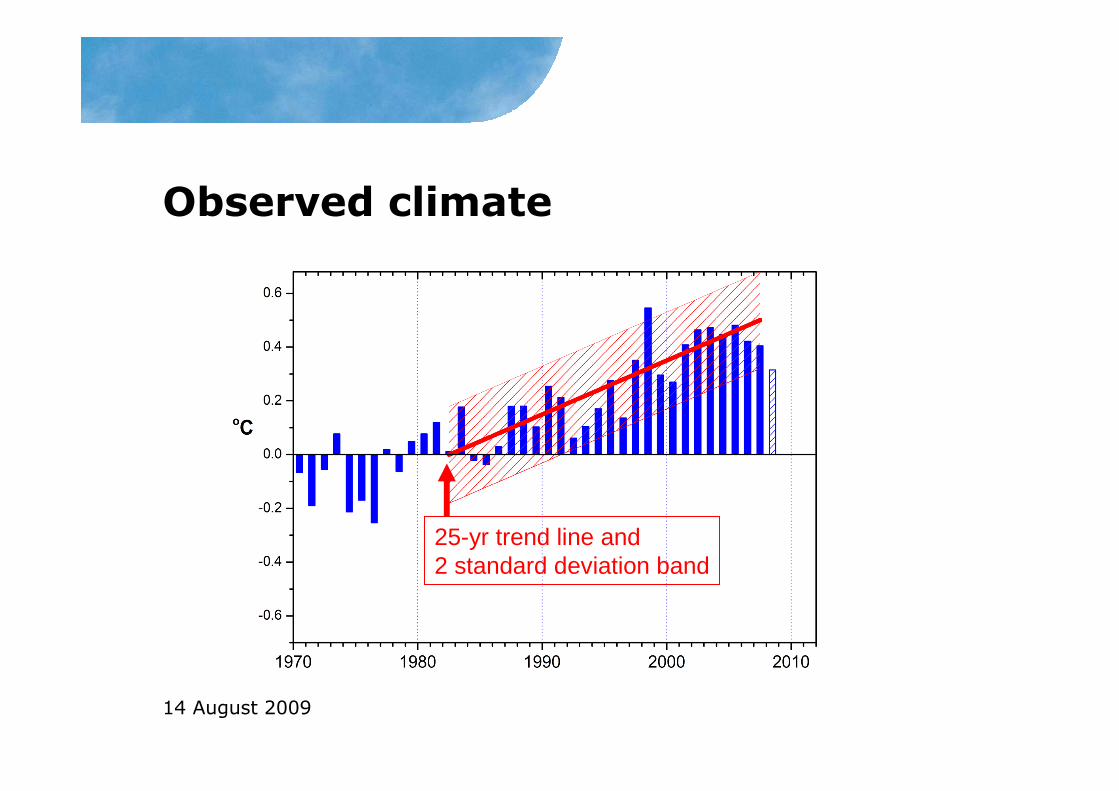
Observed climate
25-yr trend line and2 standard deviation band
14 August 2009
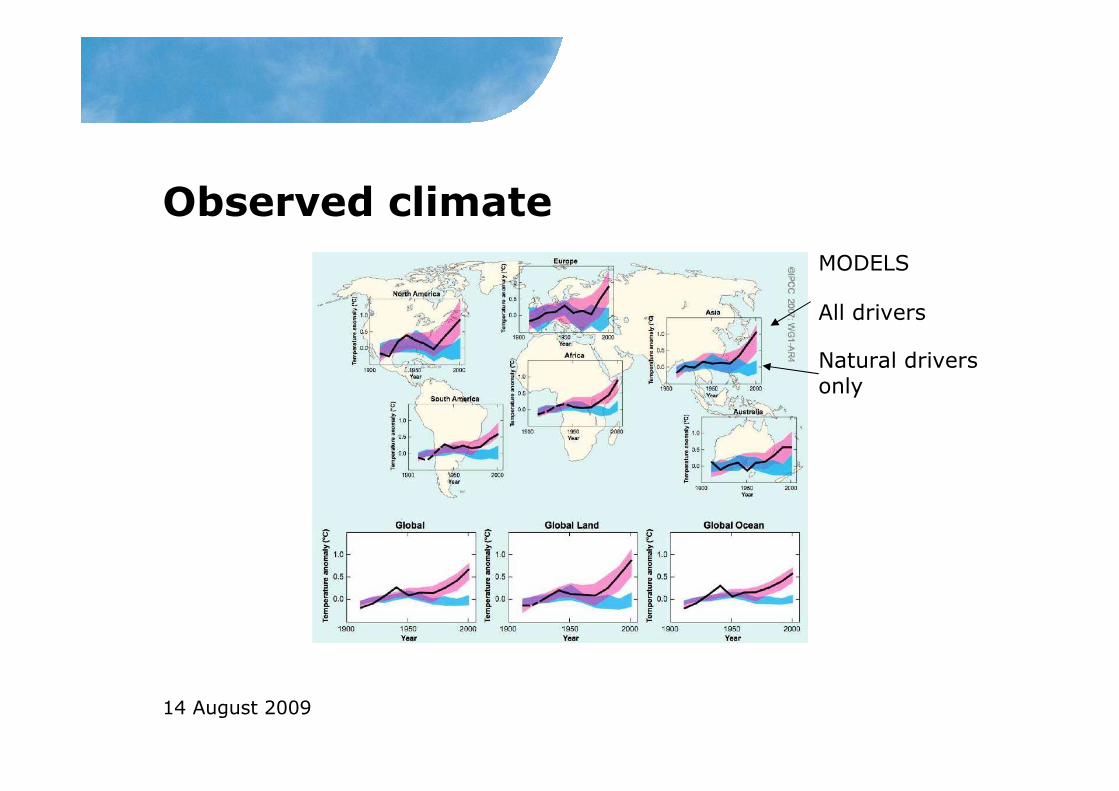
Observed climate
All drivers
Natural drivers only
MODELS

14 August 2009
Observed climate
• 100-year change & year to year change both about 1°C

14 August 2009
Arctic sea ice
Arctic summertime minimum sea-ice extent, 1979 – 2008.
National Snow and Ice Data Center, http://nsidc.org

14 August 2009
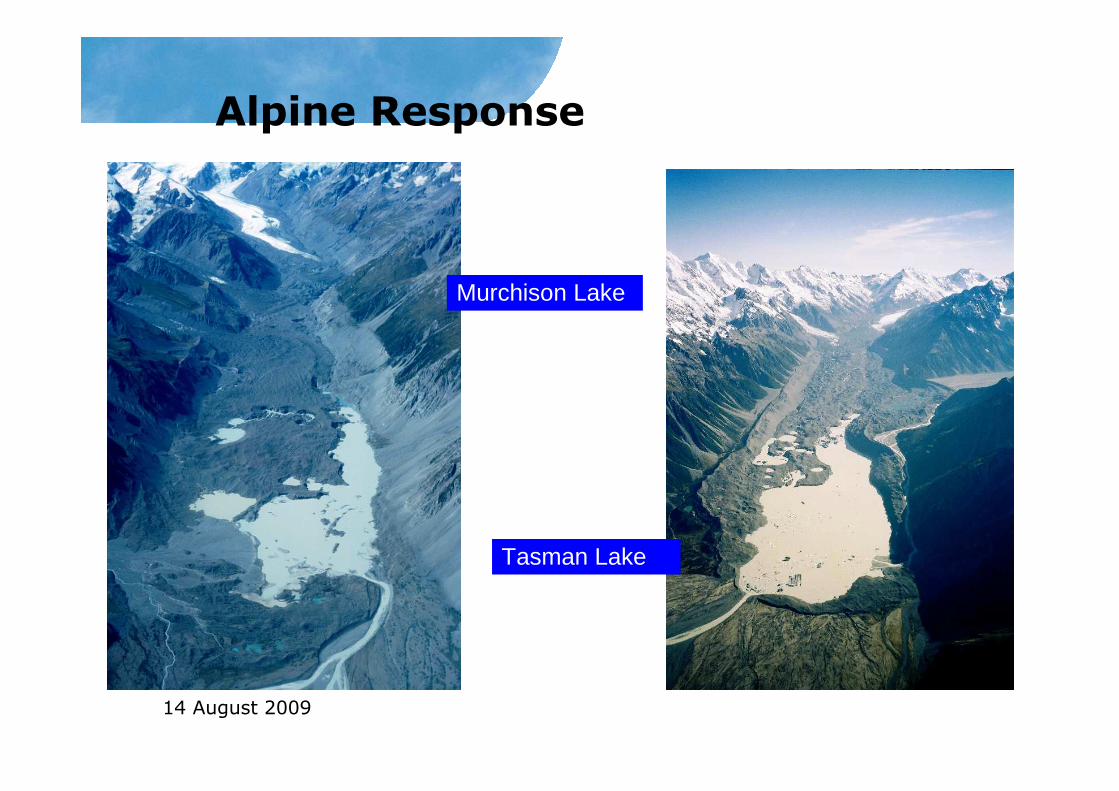
Alpine Response
• Southern Alps ice volume has decreased 11% from 55 to 49 km3 1976 - 2005
• This equates to 0.2 km3/yr
• Only 9% comes from mass balance volume changes
• Long term volume loss due to calving and trunk down wasting of 12 large glaciers
Solid line total volume change of alpine ice volume
14 August 2009
Alpine Response
Murchison Lake
Tasman Lake
14 August 2009
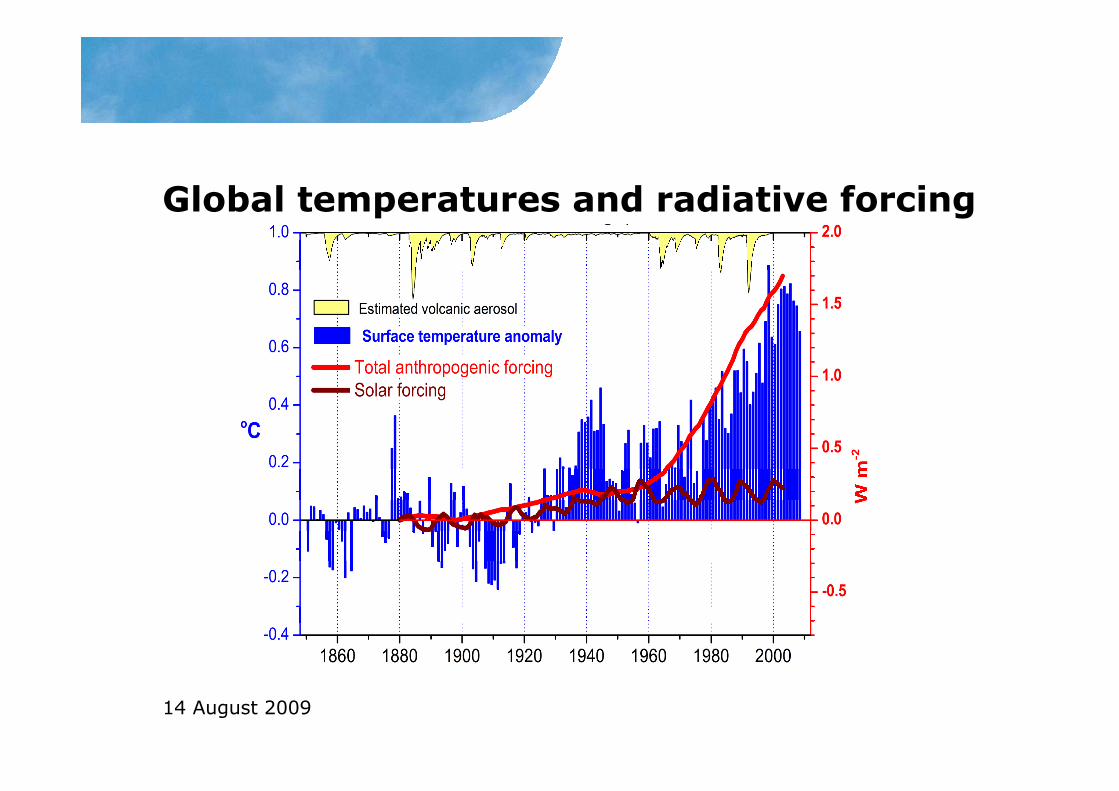
Global temperatures and radiative forcing

14 August 2009
Temperature change WITHOUT human factorsTemperature change WITH human factors
Deg
rees
Cel
sius
Diagnosis of actual climate change
“Most of the observed increase in global average temperatures since the mid-20th century
is very likely* due to the observed increase in anthropogenic greenhouse gas concentrations.”
(IPCC, 2007)
* very likely = more than 90% chance
G. Meehl, NCAR, 2007
14 August 2009
Impacts of climate change

14 August 2009
Ocean acidification
• 0.1pH unit decrease observed
• Another 0.3pH unit decrease this century– Unprecedented for over 20 million years
• Affects corals, shell formation, plankton growth
• May damage whole food chain in the oceans– Regardless of “global warming”

14 August 2009
European 2003 heatwaveOver Europe, the main sectors hit by the extreme climate conditions were the green fodder supply, the arable sector, the livestock sector & forestry. Drought affects the state of vegetation by lowering photosynthetic activity leading to a reduction in productivity, in particular for crops & fodder. It also affects forests, weakening trees & making them vulnerable to diseases & insect attacks.

14 August 2009
Australian heatwave 2009
It has been a truly
unbelievable event and the
climate change implications
are very clear - it was the
hottest day on record in the
midst of the longest heatwave
on record with 2009 having
the driest start to a year on
record in a 12 year drought
which has been our hottest,
longest and driest on record.
Dr David Jones
Bureau of Meteorology
14 August 2009
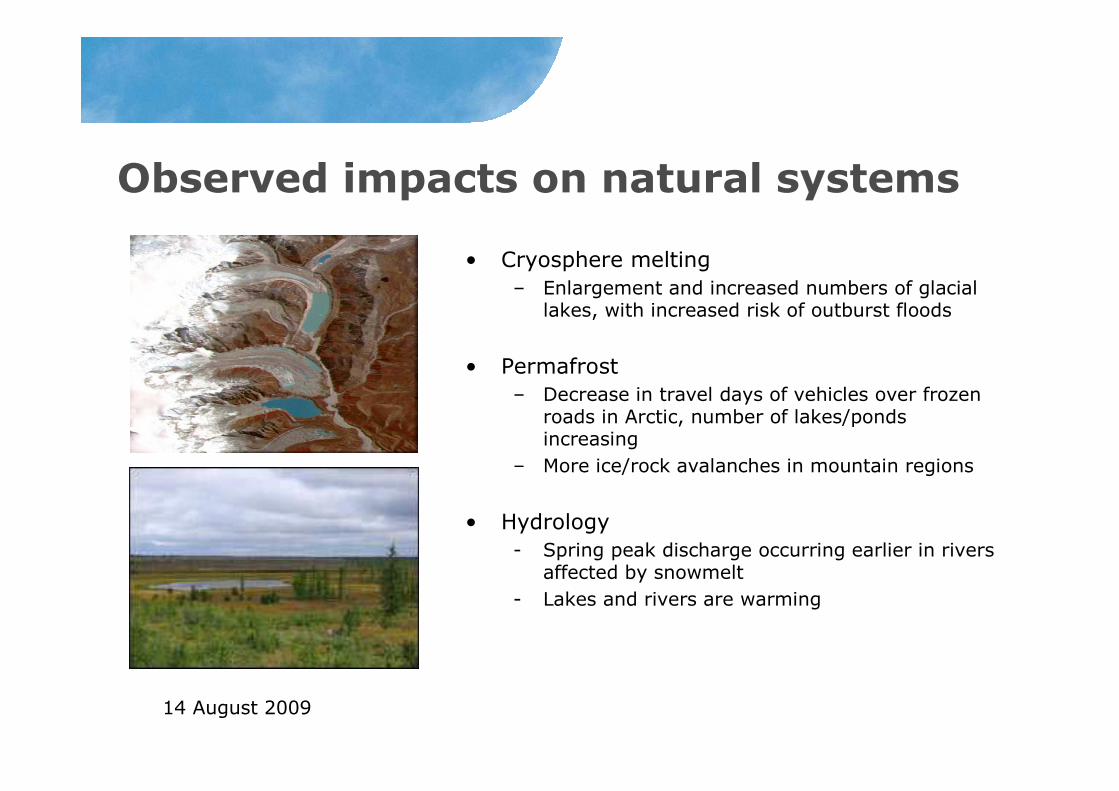
Observed impacts on natural systems
• Cryosphere melting
– Enlargement and increased numbers of glacial lakes, with increased risk of outburst floods
• Permafrost
– Decrease in travel days of vehicles over frozen roads in Arctic, number of lakes/ponds increasing
– More ice/rock avalanches in mountain regions
• Hydrology
- Spring peak discharge occurring earlier in rivers affected by snowmelt
- Lakes and rivers are warming

14 August 2009
Observed impacts on natural systems
• Terrestrial species
– Earlier timing of spring events (leaf emergence, bird migration, egg-laying)
– Poleward and upward shift of species ranges

14 August 2009

14 August 2009
Climate scenarios
• The range of projections (Table SPM.1) is broadly consistent with the TAR.– However, high end of range is larger than in TAR.
– Broader range of available models suggests stronger climate-carbon cycle feedbacks.
• Sea level rise projections for the 21st century are also consistent with the TAR. – However, uncertainty hinders making reliable estimates of the upper bound.
Best estimate and likelyuncertainty range at 2100
14 August 2009
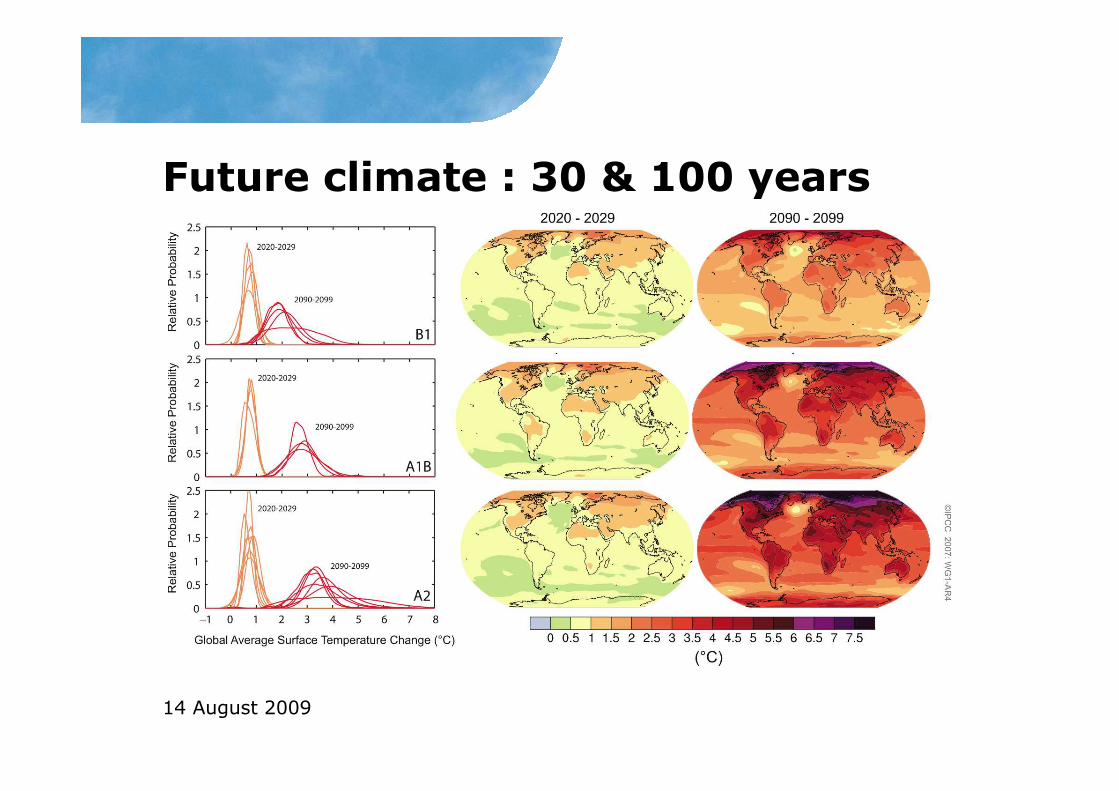
Future climate : 30 & 100 years
14 August 2009
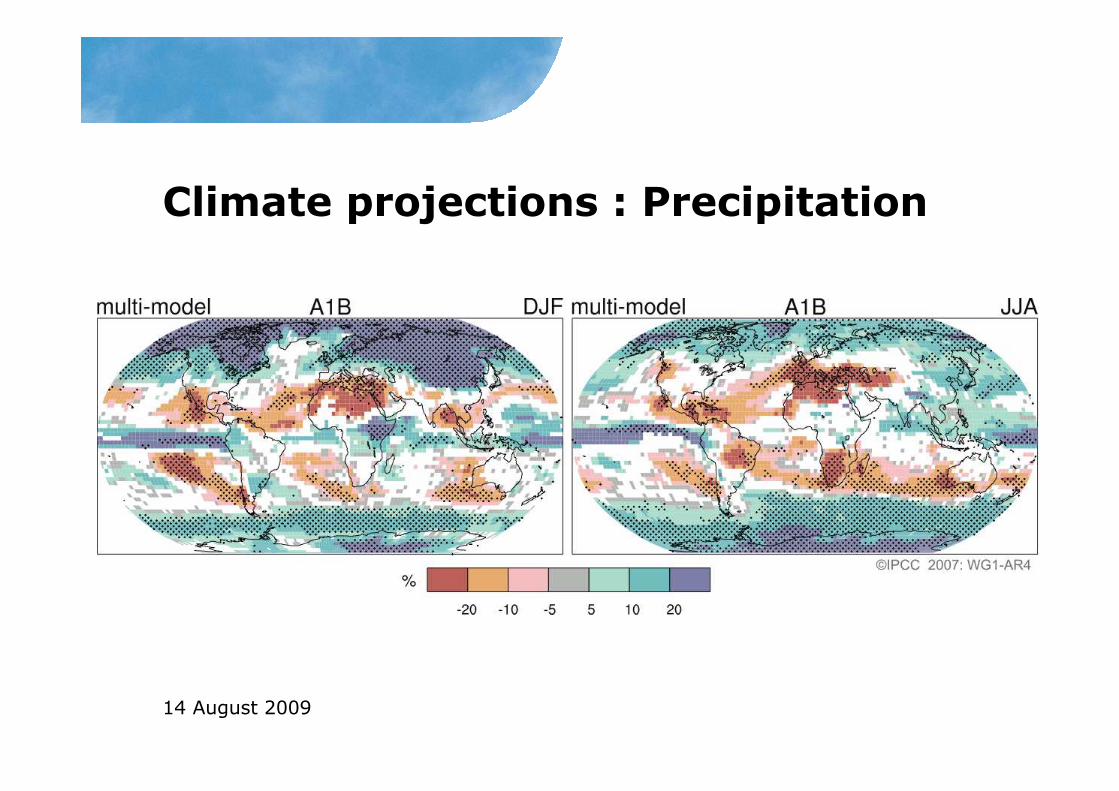
Climate projections : Precipitation

14 August 2009
Impacts of climate change
• Warming greatest over land and at most high northern latitudes and least over Southern Ocean and parts of the North Atlantic Ocean
14 August 2009
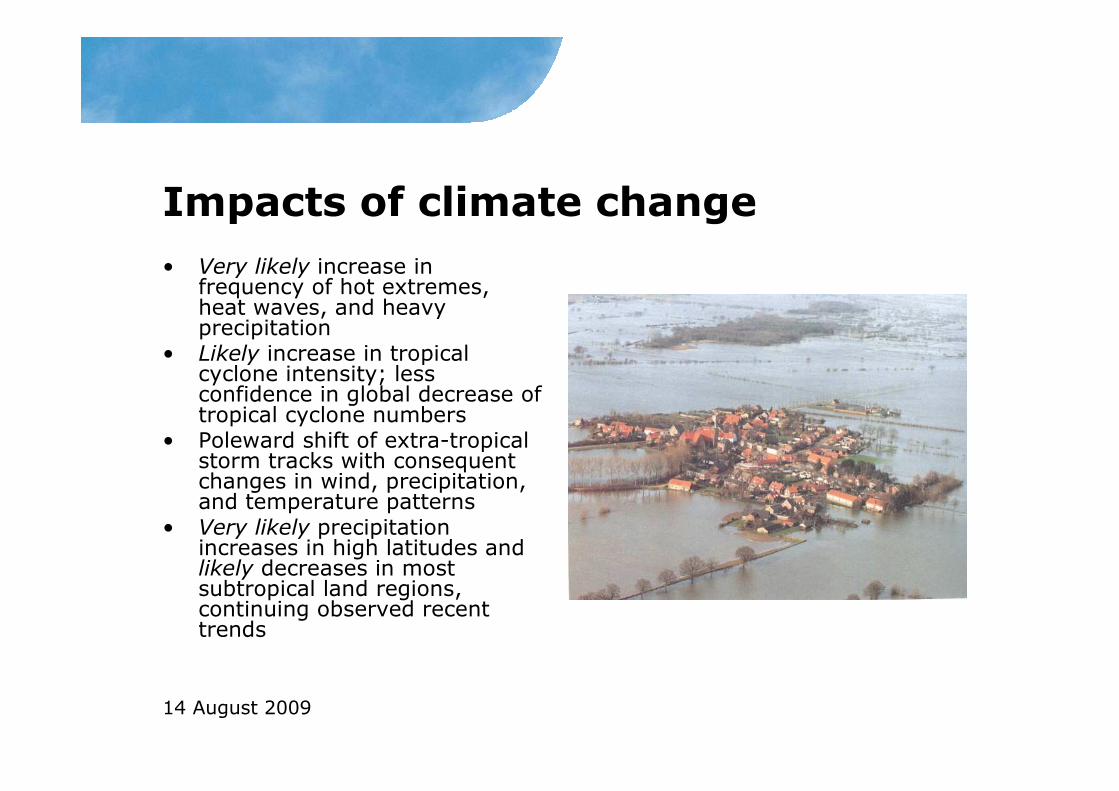
Impacts of climate change
• Very likely increase in frequency of hot extremes, heat waves, and heavy precipitation
• Likely increase in tropical cyclone intensity; less confidence in global decrease of tropical cyclone numbers
• Poleward shift of extra-tropical storm tracks with consequent changes in wind, precipitation, and temperature patterns
• Very likely precipitation increases in high latitudes and likely decreases in most subtropical land regions, continuing observed recent trends

14 August 2009
Impacts of climate change
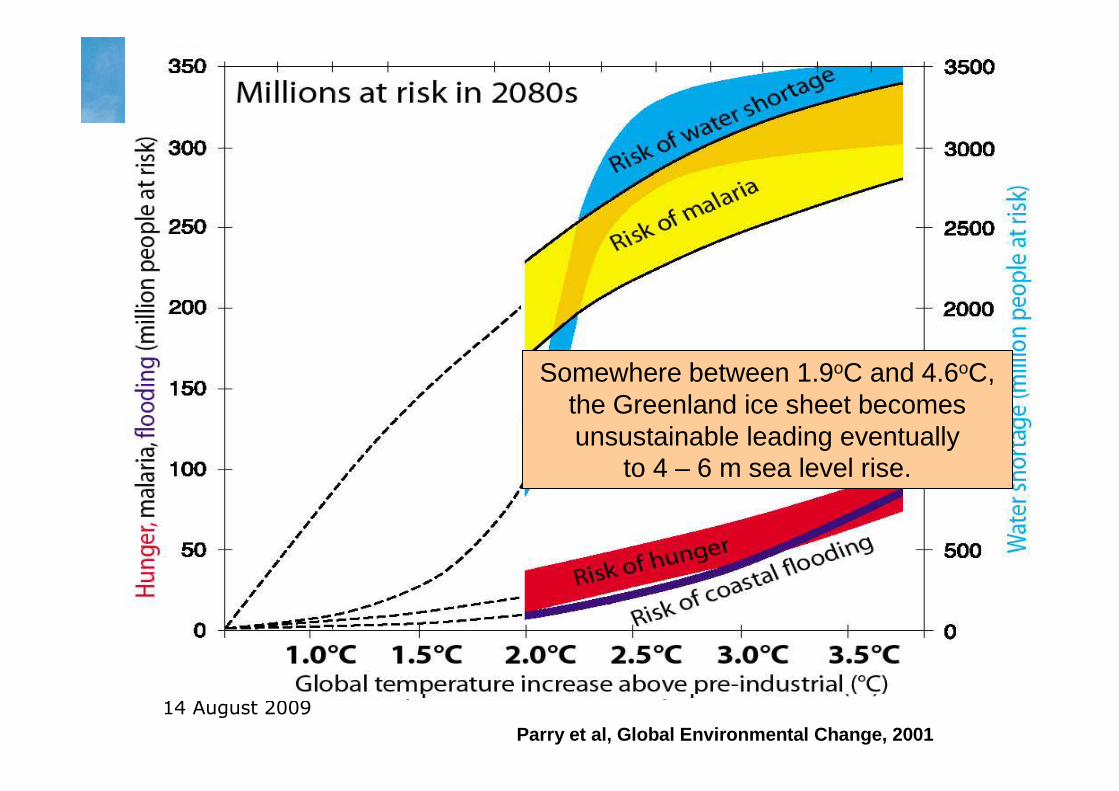
More systematic understanding of the timing and magnitude of impacts related to differing amounts and rates of climate change.
14 August 2009
Parry et al, Global Environmental Change, 2001
Somewhere between 1.9oC and 4.6oC,the Greenland ice sheet becomes unsustainable leading eventually
to 4 – 6 m sea level rise.

14 August 2009
Impacts of climate change• Arctic
– High rates of warming on natural systems
– Arctic sea ice 20 – 30% less by 2100
– Permafrost significantly decreased
– Large scale forest fires & outbreaks of tree-killing insects
• Africa
– Especially sub-Saharan because of low adaptive capacity and drying
• Small Islands
– High exposure of populations & infrastructure to risk of sea level rise & storm surge
– Reduction in average rainfall is very likely to reduce the size of the freshwater lens
• Asian megadeltas
– High exposure of populations & infrastructure to risk of sea level rise & storm surge
14 August 2009
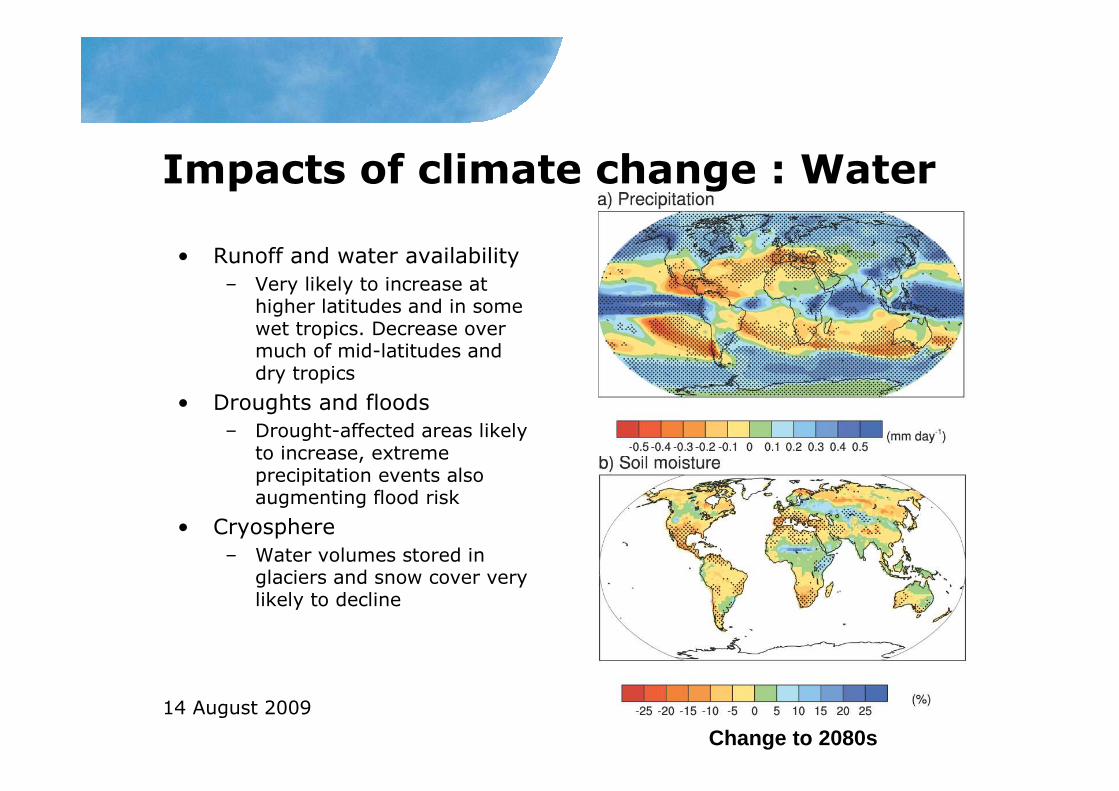
Impacts of climate change : Water
Change to 2080s
• Runoff and water availability
– Very likely to increase at higher latitudes and in some wet tropics. Decrease over much of mid-latitudes and dry tropics
• Droughts and floods
– Drought-affected areas likely to increase, extreme precipitation events also augmenting flood risk
• Cryosphere
– Water volumes stored in glaciers and snow cover very likely to decline

14 August 2009
Impacts of climate change: Food
• Crop yield– Likely to increase at higher latitudes for global average temperature increases of 1 to 3°C, then decrease
– At lower latitudes especially dry tropics likely to decrease
• Global production– Likely to increase up to about 3°C, then decrease
• Droughts and floods– Negative impacts, especially subsistence sectors at low latitudes

14 August 2009
Impacts of climate change: Health
• Indirect effects
– Projected climate change likely to affect millions of people, particularly those with low adaptive capacity through malnutrition and consequent disorders
• Malaria
– Mixed effects due to expansion and contraction of range
• Beneficial effects
– Some benefits to health such as fewer deaths from cold exposure

14 August 2009
Vulnerable regions/sectors
• Ecosystems– Tundra– Boreal forests– Mountain areas– Coasts– Coral reefs
– Sea ice biomes
• Coasts– Low lying coasts due to threat of sea-level rise
• Water Resources– Middle and dry low-latitude regions due to decrease in rainfall and higher rates ofevapotranspiration
Relative vulnerability of coastal deltas ro sea leve l trends to 2050

14 August 2009
The issue
Low scenarioMedium scenarioHigh scenario
Warming of about 0.2oC per decade for next two decades for a range of scenarios
2.3oC
3.3oC
3.9oC
Higher emissions lead to more warming later in century.
Further warming of ~ 0.6oC for concentrations fixed in 2000
Glo
bal s
urfa
ce w
arm
ing
from
pre
-indu
stria
l lev
el o
C
Adapted from IPCC, WG I 2007

14 August 2009
The Issue
• Currently above pre-industrial temperatures by …~0.7oC
• Committed warming as oceans catch up with atmosphere … >0.6oC(IPCC, WG I, 2007)
• Minimum warming while energy infra-structure changes … ~0.8oC
• (van Vuuren et al, PNAS, 2008)>2.1oC

14 August 2009
Urgency
0
10
20
30
40
2000 2050 2100 2150 2200
350
400
450
500
550
2000 2050 2100 2150 22000
1
2
CO2 Emissionsbillions tonnes per year
CO2 Concentrationparts per million
Temperature changeoC
First we have to change our energy technology and infrastructure.
Then CO2 in the atmosphere stabilises.
Then further warming stops.
Then CO2 emissions peak and decline.
30 + years
About 30 years
20 – 40 years
14 August 2009
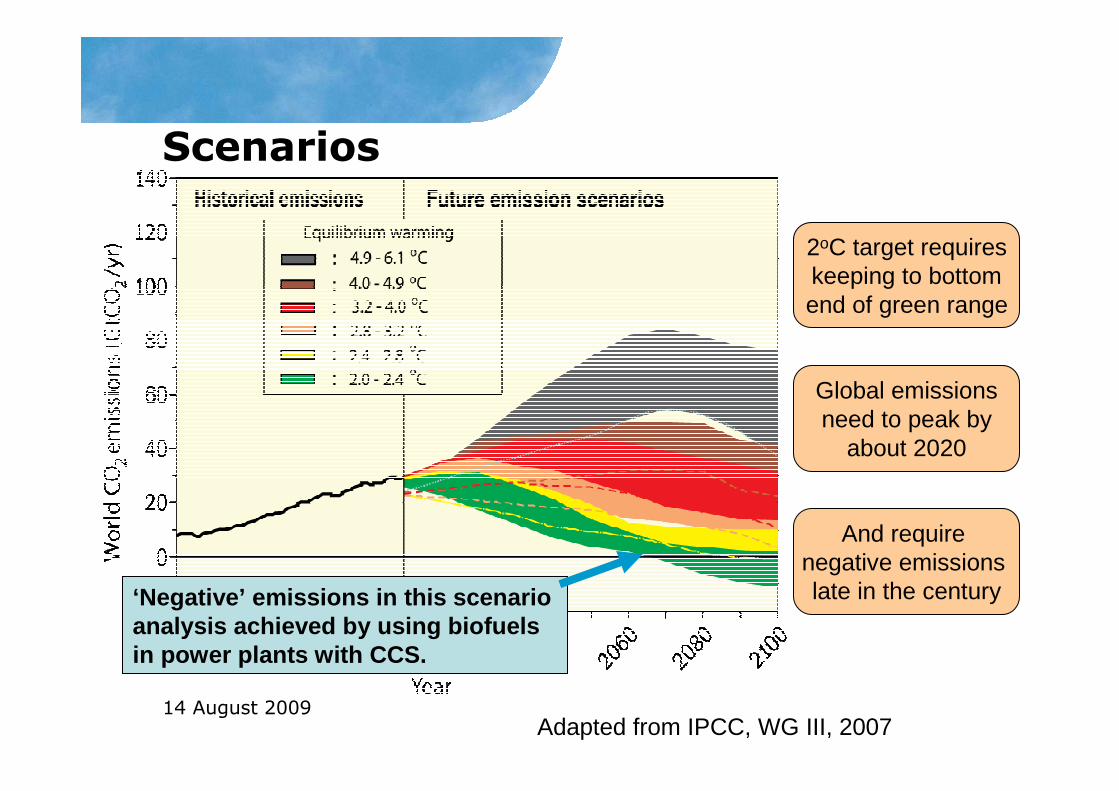
Scenarios
2oC target requireskeeping to bottomend of green range
Global emissionsneed to peak by
about 2020
And require negative emissions late in the century
Adapted from IPCC, WG III, 2007
‘Negative’ emissions in this scenario analysis achieved by using biofuelsin power plants with CCS.
14 August 2009
Surprise
Geoth.
Solar
Biomass
Wind
Nuclear
Hydro
Gas
Oil & NGL
Coal
Trad Bio.0
500
1000
1500
1860 1880 1900 1920 1940 1960 1980 2000 2020 2040 2060
exajoules
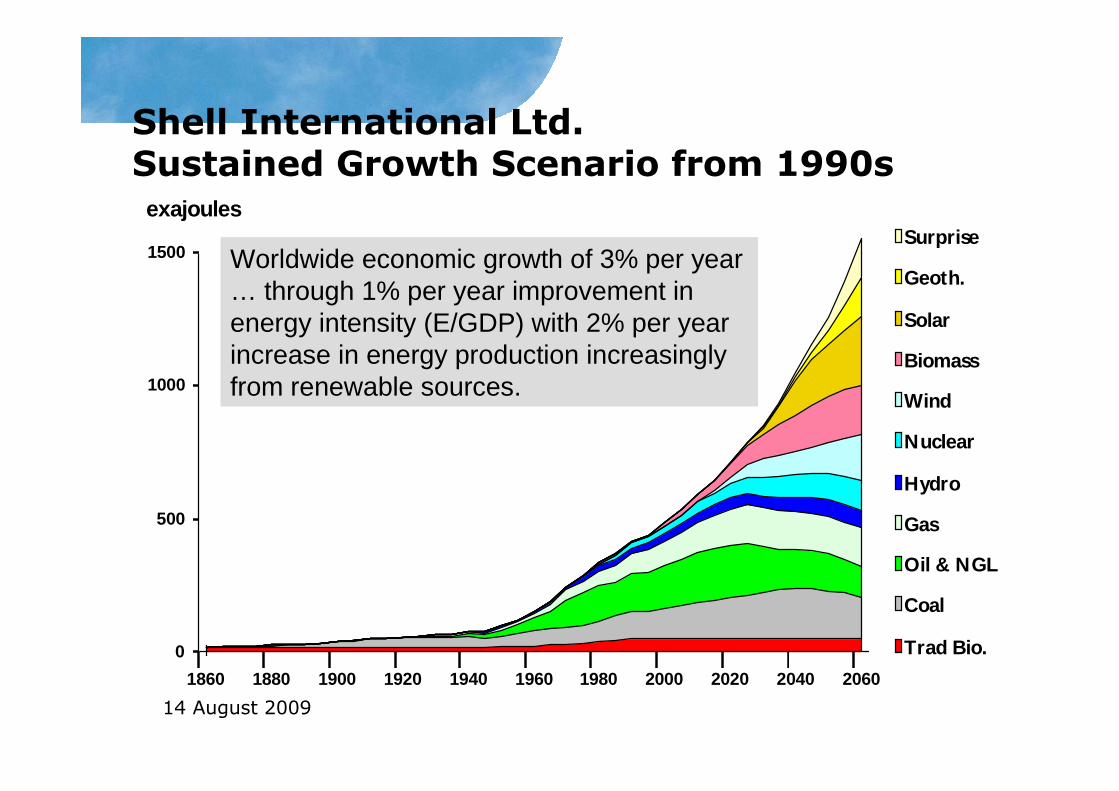
Shell International Ltd.Sustained Growth Scenario from 1990s
Worldwide economic growth of 3% per year … through 1% per year improvement in energy intensity (E/GDP) with 2% per year increase in energy production increasingly from renewable sources.
14 August 2009
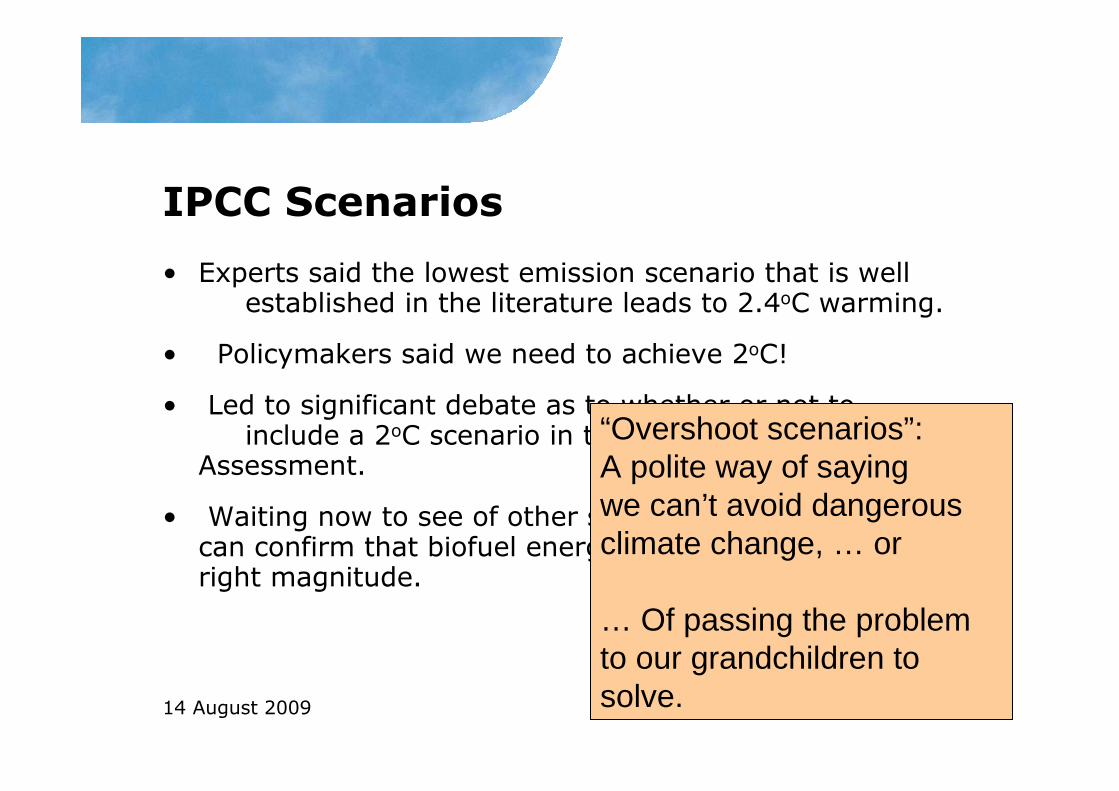
IPCC Scenarios
• Experts said the lowest emission scenario that is wellestablished in the literature leads to 2.4oC warming.
• Policymakers said we need to achieve 2oC!
• Led to significant debate as to whether or not to include a 2oC scenario in the IPCC Fifth
Assessment.
• Waiting now to see of other scenario modelling groups can confirm that biofuel energy with CCS can be of the right magnitude.
“Overshoot scenarios”: A polite way of saying we can’t avoid dangerous climate change, … or
… Of passing the problem to our grandchildren to solve.
14 August 2009
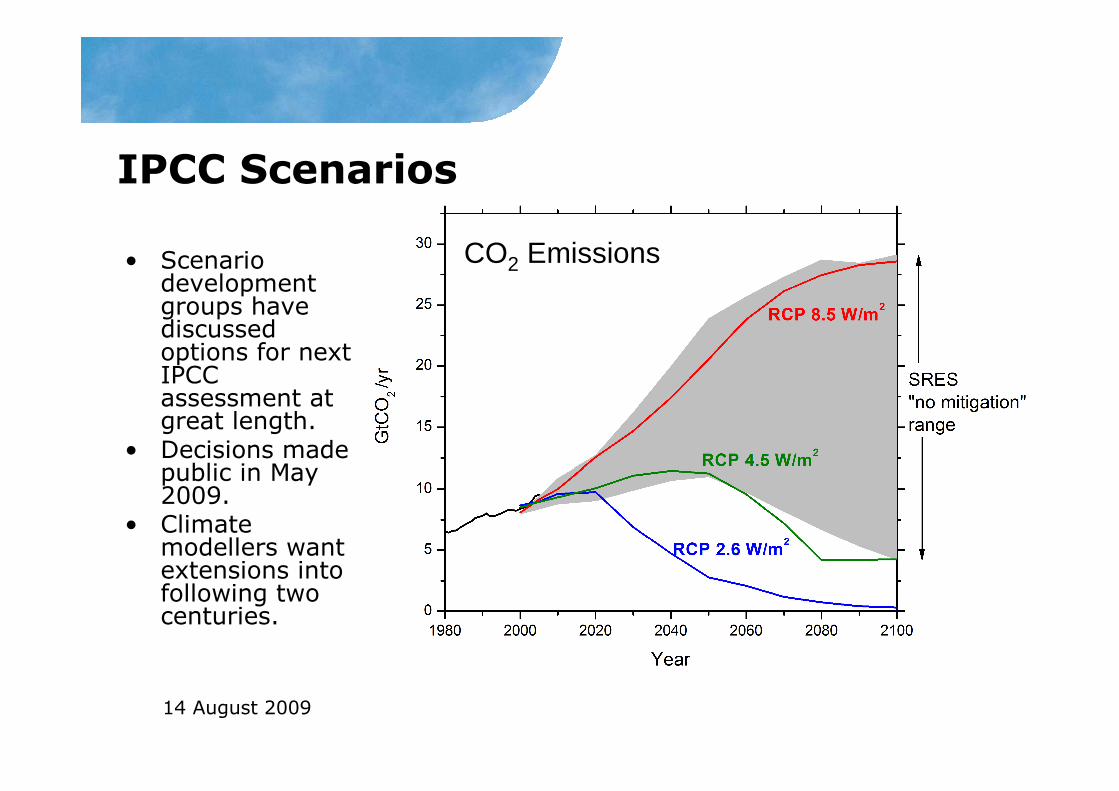
IPCC Scenarios
• Scenario development groups have discussed options for next IPCC assessment at great length.
• Decisions made public in May 2009.
• Climate modellers want extensions into following two centuries.
CO2 Emissions

14 August 2009
The next IPCC assessment
• Uncertainty range in warming for a given scenario still large.
• This from a paper by Malte Meinshausen et al in Nature (30 April 2009) arguing that emissions in the first half of this century are critical to outcomes.

14 August 2009
Concluding remarks
• Increases in greenhouse gases are causing the climate system to warm
• Observations show unequivocal warming of the climate system
• New Zealand temperatures have warmed 0.8°C over 100 years
• Mean projections give 2 to 2.5°C for the 2090s

14 August 2009
Concluding remarks
• Impacts of warming include massive reduction in ice volumes, melting of Arctic permafrost, earlier emergence of insects, birds and plants in spring, retreat of New Zealand glaciers and southward spread of agriculture
• Sea level rise likely to be much more than projected