CLIMATE CHANGE - Source Protectionhome.waterprotection.ca/.../AR/GSCA/GSSPA_Ch5_2016_Final.pdf ·...
22
Approved Appendix E - Approved Assessment Report -- Grey Sauble Source Protection Area Chapter 5 CLIMATE CHANGE APPROVED ASSESSMENT REPORT for the Grey Sauble Source Protection Area October 15, 2015
Transcript of CLIMATE CHANGE - Source Protectionhome.waterprotection.ca/.../AR/GSCA/GSSPA_Ch5_2016_Final.pdf ·...

Approved
Appendix E - Approved Assessment Report -- Grey Sauble Source Protection Area
Chapter 5
CLIMATE
CHANGE
APPROVED ASSESSMENT REPORT
for the
Grey Sauble Source Protection Area
October 15, 2015

Approved
Appendix E - Approved Assessment Report -- Grey Sauble Source Protection Area
This page intentionally left blank.
Approved
Appendix E - Approved Assessment Report -- Grey Sauble Source Protection Area
APPROVED ASSESSMENT REPORT
for the
Grey Sauble Source Protection Area
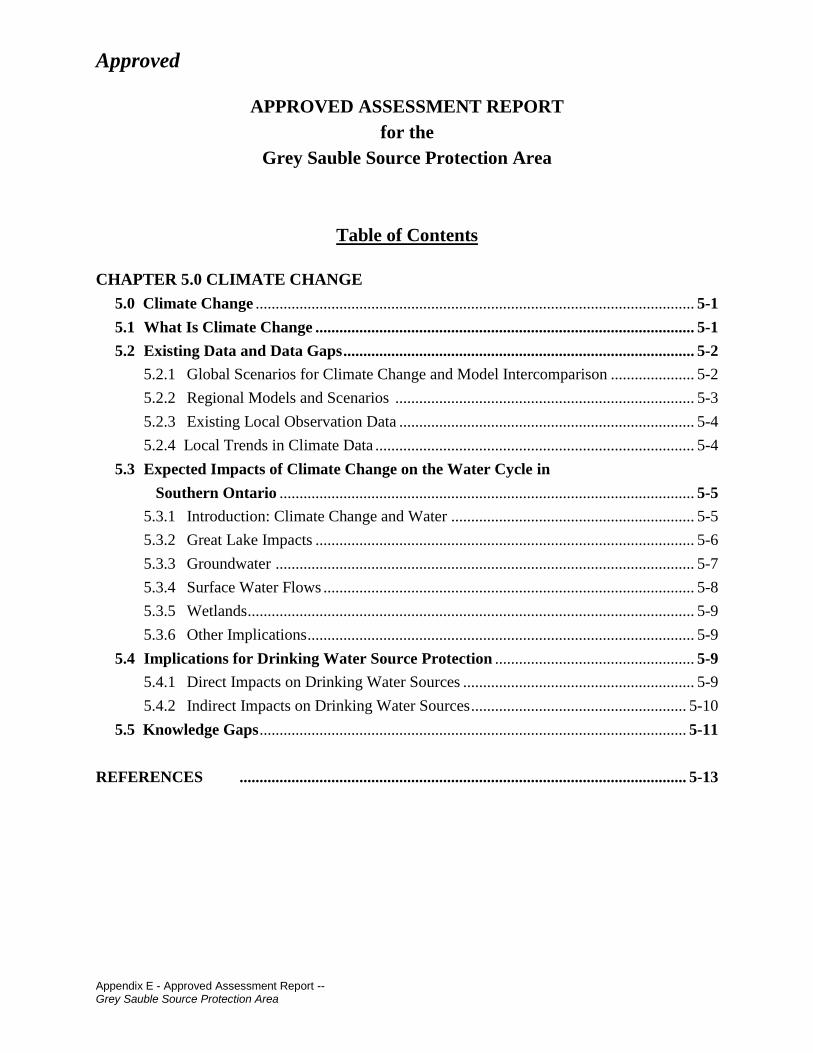
Table of Contents
CHAPTER 5.0 CLIMATE CHANGE
5.0 Climate Change .............................................................................................................. 5-1
5.1 What Is Climate Change ............................................................................................... 5-1
5.2 Existing Data and Data Gaps ........................................................................................ 5-2
5.2.1 Global Scenarios for Climate Change and Model Intercomparison ..................... 5-2
5.2.2 Regional Models and Scenarios ........................................................................... 5-3
5.2.3 Existing Local Observation Data .......................................................................... 5-4
5.2.4 Local Trends in Climate Data ................................................................................ 5-4
5.3 Expected Impacts of Climate Change on the Water Cycle in
Southern Ontario ........................................................................................................ 5-5
5.3.1 Introduction: Climate Change and Water ............................................................. 5-5
5.3.2 Great Lake Impacts ............................................................................................... 5-6
5.3.3 Groundwater ......................................................................................................... 5-7
5.3.4 Surface Water Flows ............................................................................................. 5-8
5.3.5 Wetlands ................................................................................................................ 5-9
5.3.6 Other Implications ................................................................................................. 5-9
5.4 Implications for Drinking Water Source Protection .................................................. 5-9
5.4.1 Direct Impacts on Drinking Water Sources .......................................................... 5-9
5.4.2 Indirect Impacts on Drinking Water Sources ...................................................... 5-10
5.5 Knowledge Gaps ........................................................................................................... 5-11
REFERENCES ................................................................................................................ 5-13

Approved
Appendix E - Approved Assessment Report -- Grey Sauble Source Protection Area
This page intentionally left blank.

Approved
Appendix E - Approved Assessment Report -- Grey Sauble Source Protection Area 5 - 1
5.0 CLIMATE CHANGE
5.1 What is Climate Change?
Climate can be defined as the meteorological conditions that are characteristic to a particular
region, including temperature, precipitation and wind. The classical period for averaging these
variables is 30 years, according to the World Meteorological Organization.
In a wider sense, the climate system refers to a highly complex system consisting of five major
components: the atmosphere, the hydrosphere, the cryosphere, the land surface, and the
biosphere, as well as the interactions between them. The climate system evolves over time
through its own internal dynamics and under the influence of external forcing such as volcanic
eruptions and variation in solar radiation (Intergovernmental Panel on Climate Change, AR4
WG1 Annex I).
Climate change refers to the change of the mean and/or the variability of statistical properties
that characterize the climate system. To be considered an actual change in climate, and not
simply a natural variation, the change must be persistent and measurable over time (Environment
Canada, 2008). Three drivers for climate change have been distinguished. The first is natural
internal processes, such as the evolution of land cover, major volcanic eruptions that alter the
earth’s atmosphere and planetary oscillations that include El Niño and the North Atlantic
oscillation. The second relates to natural forcing that is external to the earth’s climate system,
which is mostly the intensity of solar radiation. The third, and most recent, driver is
anthropogenic influences that change the composition of the atmosphere (especially by emitting
greenhouse gases), the river systems, global nutrient cycles, and land use (Intergovernmental
Panel on Climate Change, AR4 WG1 Annex I). The most relevant greenhouse gases are water
vapour, carbon dioxide, methane, nitrous oxide, and ozone. These gases trap and reflect heat
energy back to the Earth’s surface (Lemmen and Warren, 2004).
As anthropogenic drivers of climate change, greenhouse gases are most significantly produced
through the burning of fossil fuels for energy production, transportation and heating, as well as in
agricultural activities and forest clearing (Lemmen and Warren, 2004). Lately, the emissions
from peat oxidation after wetland drainage (Obenchain, 2004; Global Environment Centre, 2007)
and livestock production (Food and Agriculture Organization, 2006) were recognized. The
detection of climate change is now based on measurement values, especially in the polar regions.
Regarding causes of global warming, the formally agreed-upon statement of the
Intergovernmental Panel on Climate Change (IPCC) concerning key findings and uncertainties
states that:
“Most of the observed increase in global average temperatures since the mid-20th century is
very likely due to the observed increase in anthropogenic GHG [greenhouse gas]
concentrations. It is likely that there has been significant anthropogenic warming over the
past 50 years averaged over each continent (except Antarctica).”

Approved
Appendix E - Approved Assessment Report -- Grey Sauble Source Protection Area 5 - 2
(Intergovernmental Panel on Climate Change,
AR4 Synthesis Report: Summary for Policy Makers, 2007)
This statement was drafted by leading scientists and adopted by representatives of governments
and intergovernmental organizations, including a delegation of the Canadian government.
5.2 Existing Data and Data Gaps
The impacts of climate change on the local hydrological cycle and its effect on water quality and
quantity are poorly understood. While there is an understanding of climate change on the larger
scale, very little is actually known about local impacts, particularly on a watershed basis. Any
model-based research is limited by data availability, so better observational climate and
hydrological data is needed to complete inventories and local scale data sets (Bates et. al., 2008).
The IPCC released their Fifth Assessment Report in 2013 and 2014. It provides an update on
the current state of climate change and the science behind it. The complete report consists of
three Working Group reports and a Synthesis Report. The Synthesis Report will be finalized
on October 31, 2014. The Working Group I report is entitled “The Physical Science Basis”
and was released in 2013. It contains a detailed assessment of climate change including
chapters on sea level change, biogeochemical cycles, clouds and aerosols, and regional
climate phenomena. Extensive information was taken from models and includes climate
projections. The document also includes a new comprehensive atlas of global and regional
climate projections for 35 regions around the world. The Working Group II report is entitled
“Impacts, Adaptation and Vulnerability” and was released in 2014. It takes into consideration
both human and natural system vulnerability, exposure and adaptation as well as impacts and
future risks of climate change. The Working Group III report is entitled “Mitigation of
Climate Change” and was released in 2014. This third report assesses the risks and ethics of
climate change mitigation policies on all levels and for all sectors, including technological,
economic and institutional (IPCC, 2013).
5.2.1 Global Scenarios for Climate Change and Model Intercomparison
As part of the regional chapter of the latest IPCC report, climate change was assessed for the
North American continent and its five sub-regions using pre-defined scenarios for the
development of humankind over the next century (Intergovernmental Panel on Climate Change,
2001). The leading global climate models were run under a rapid but balanced growth emission
scenario (Intergovernmental Panel on Climate Change, 2001: A1B) and evaluated for large sub-
regions. For the northern portion of Ontario, the corresponding sub-region is East Canada,
Greenland and Iceland. For the southern portion of Ontario, the sub-region is Eastern North
America, which includes this Source Protection Area (SPA) (Intergovernmental Panel on
Climate Change, WG1-Ch. 11.5). These sub-regions are evaluated, and climate change between
the current climate and the climate at the end of this century are computed, and results are
compared between all climate models, which is referred to as multi-model intercomparison.
All models consistently show an increase in precipitation in the northern sub-region, with a
model median value of 26% for the winter months and a lower increase of 11% for the summer
months. For the full sub-region, temperature is expected to rise by 5.9°C in the winter and by

Approved
Appendix E - Approved Assessment Report -- Grey Sauble Source Protection Area 5 - 3
2.8°C in the summer, which is reflective of the global trend of the strongest warming in the
higher latitudes. For the southern sub-region, models show an increase in precipitation of 11%
for the winter months and nearly no change (+1%) for the summer months. For the full sub-
region, temperature is expected to rise by 3.8°C in the winter and by 3.3°C in the summer. The
north will experience extreme seasons that are warm and wet, and the south is projected to have
more frequent warmer seasons (Intergovernmental Panel on Climate Change, AR4 WG1, Ch.
11.5.3). However, the spatial resolution of global circulation models can only give limited
insight into the climate development of Southern Ontario. This is mainly due to the fact that the
sub-region is not representative for this most-southern end because of its unique location
between the Great Lakes, which has a strong climatic imprint locally.
5.2.2 Regional Models and Scenarios
Within the Canadian Regional Climate Modelling and Diagnostics Network, the Canadian
Regional Climate Model (CRCM) was developed for the North American domain. This model
has a more detailed representation of processes, such as sea ice, clouds and mesoscale
atmospheric convection schemes, than the global climate models, as well as a higher resolution
and description of unique geographic features such as the Great Lakes (Goyette, 2000; Music
and Caya, 2007; Plummer et al., 2006). Model quality for lake ice cover still remains difficult
(Martynov, 2009).
The Canadian Centre for Climate Modelling and Analysis provides online access to climate data
from this model with a 45 km horizontal grid-size mesh. The model uses observed data for the
years 1961-2000 and assumes the rapid and heterogeneous growth emission scenario for the
years 2001-2100 (Intergovernmental Panel on Climate Change, 2001: A2; Canadian Centre for
Climate Modelling and Analysis, 2008). Recently, a new generation of the Canadian regional
change model, GEMCLIM 2008, was presented. GEMCLIM was developed within the
Meteorological Service of Canada using its modelling framework Global Environmental
Multiscale (GEM).
A second attempt to model the regional impact of climate change for North America was
developed in the United States. An impact report for the U.S. was published in 2009 by the
United States Global Climate Change Research Program (USGCRP). It combines model outputs
from the National Center for Atmospheric Research, the National Oceanic and Atmospheric
Administration, the Geophysical Fluid Dynamics Laboratory, and the NASA Goddard Institute
for Space Studies (Climate Change Science Program, 2008). The data is available online
(Program for Climate Model Diagnosis and Intercomparison, 2009) and also from regional
models (North American Regional Climate Change Assessment Program, 2009). The USGCRP
report contains chapters for the state of Michigan, which can also be inferred for Southern
Ontario due to geographic similarities.
Model projections for Michigan were evaluated under various emission scenarios, both for mid-
century (2040-2059) and end-of-century (2080-2099) climate. In Michigan, summer average
temperatures and precipitation are expected to feel progressively more like the summers
currently experienced in the south and west towards the middle of the North American continent.
In the year 2100, assuming the highest emission scenario, Michigan will experience a climate
that corresponds to Northern Texas today. The models project that heat waves will be more

Approved
Appendix E - Approved Assessment Report -- Grey Sauble Source Protection Area 5 - 4
frequent, more severe and longer lasting. However, both the frequency of hot days and the length
of the heat-wave season will be more than twice as great under a scenario of higher greenhouse
gas emissions than under a scenario of lower emissions (United States Global Climate Change
Research Program, 2009). Other areas and sectors affected are urban areas (intensified heat
island effect), flood control and stormwater systems, human health, energy, ecosystems, and the
agricultural sector.
5.2.3 Existing Local Observation Data (Climate Stations)
Environment Canada’s Atmospheric Environment Service (AES) provides daily climate data
from climate stations in the form of hourly precipitation and temperature records (see Chapter 2:
Watershed Characterization of this Report).
As is typical for such time series data, gaps exist for some time intervals and methodological
inconsistencies have contributed to imprecise data records. Using statistical methods, data gaps
were filled, methodological inconsistencies addressed (Schroeter and Associates, 2007) and
continuous daily time series data for the period from 1950 to 2006 were created for five data
points in the Grey Sauble SPA.
However, when evaluating climate data over this temporal interval, the impact of long-term
climate change is convoluted with two natural large-scale oscillation patterns that cause decade-
scale variability: the Arctic Oscillation/North Atlantic Oscillation and the El Niño-Southern
Oscillation (Zhang et. Al., 1997; Latif and Barnett, 1994; Intergovernmental Panel on Climate
Change, 2007 WG1, Ch. 9). Further, the eruption of the Agung volcano in 1963 started a decade
of global temperature depression (Intergovernmental Panel on Climate Change, 2007 WG1, Ch.
9.4.1.2). If pulled together, the 1950s are typically characterized by elevated temperatures, while
the 1960s are significantly cooler as evidenced by precipitation patterns that are associated with
cooler temperatures. The stated reasons limit the analysis of data from local climate stations.
5.2.4 Trends in Local Climate Data
A project was completed by Huron Geosciences in 2011 to assemble, graphically display and
analyze available meteorological data within the Source Protection Region (SPR) in order to give
guidance to the SPR on providing services to their communities and member municipalities.
Overall, the trends indicate that total annual precipitation has increased over the 1950-2006
period. Temperatures have been increasing throughout the SPR with the exception of the
Chatsworth station, which has a minor decrease. The increase in temperatures is largely the result
of an increase in daily minimum temperatures.
Heat units are up across the SPR, as are the number of days where maximum temperatures have
exceeded 30ºC, which is indicative of warmer summer seasons. A marked decrease in the days
where maximum daily temperatures do not exceed 0ºC for the watershed is noted throughout the
SPR, and is likely the result of a reduced frozen period and increased frequency and duration of
winter melting events.
The study concluded that the impacts of the observed trends on drinking water sources will be
low. In this SPA, the municipal systems are reliant on either deep bedrock aquifers or Lake
Huron for their water supplies. From a water quantity perspective, increases in precipitation

Approved
Appendix E - Approved Assessment Report -- Grey Sauble Source Protection Area 5 - 5
would lead to increases in the supply to these sources. The study highlights the increases in
precipitation documented in the study when compared to the overall storage of these two
systems.
Temperature increases could have a long term impact on water levels within Lake Huron, as they
point to increases in evaporation (and notably, increased local precipitation). In particular,
increased lake temperatures could lead to less ice cover on Lake Huron during the winter months
and more winter lake-effect precipitation.
Increasing amounts of precipitation coupled with increases in intensity of precipitation are often
associated with increases in soil erosion and ultimately on water quality of riverine surface water
systems. In this SPA, there are no municipal systems that are exploiting riverine surface systems,
and impacts on the overall quality of water in Lake Huron are buffered by the large volume of
water in the system.
5.3 Expected Impacts of Climate Change on the Water Cycle in Southern Ontario
5.3.1 Introduction: Climate Change and Water
Climate change shows profound impacts on global and regional water systems, which are
integral parts of the climate system. The increase of heat energy directly impacts the amount of
evapotranspiration, atmospheric convection and precipitation that is received in any region, with
feedback on land use (Intergovernmental Panel on Climate Change, 2008).
Precipitation is the condensation of atmospheric water vapour as rain, snow or other forms, if air
is over-saturated with water. One cause is the addition of moisture to the air through evaporation
from soils, from water surfaces or through precipitation/virga from higher atmospheric levels.
Another cause is the increase of relative humidity by cooling and/or adiabatic expansion, for
example, in upward movement of air during convection. Warmer climate impacts temperature
and evapotranspiration, which affects the amount of water that air can transport and on
temperature gradients that cause air convection. As a result, the amount and intensity of
precipitation are affected, as well as its variability in time and space.
Evapotranspiration refers to the amount of water that is transported into the atmosphere from
soils, water surfaces and plants. It depends on the amount of water that the air can transport, on
temperature and relative humidity, as well as on the amount of moisture on the ground. In many
regions, additional precipitation and warming will intensify evapotranspiration (Bates et. al.,
2008).
If precipitation is more intense, larger portions of this water cannot be intercepted by plants or
infiltrate into soils. Thus, intense precipitation creates more runoff into rivers and causes erosion
of soils (de Loë and Berg, 2006), which can potentially reduce the amount of water recharging
local aquifers.
Over the year, warmer temperatures will shift the form of precipitation from snow to rain and
decrease the storage of snow in winter. Warmer summers will be drier and winters will be wetter.

Approved
Appendix E - Approved Assessment Report -- Grey Sauble Source Protection Area 5 - 6
The spring thaw will probably occur more rapidly and cause more intense river runoff. Together,
these changes are expected to cause more extreme flooding, landslides, coastal erosion, and
droughts (de Loë and Berg, 2006).
The water cycle is not only modified because of climate change, but also by other human factors
that influence the hydrologic cycle quantitatively as well as qualitatively. Urbanization and urban
sprawl increase the sealing of soils and change the surface albedo. River modifications and
wetland drainage, chemical pollution, and changes in the nutrient balance are other relevant
factors (Aerts and Droogers, 2004).
In Southern Ontario, many relevant hydrological processes are closely linked to annual
accumulations of snow in winter and melt in early spring. These processes include river runoff,
the accumulation of moisture in near-surface soils and aquifer recharge (Rush, 2004).
The west side of the Bruce Peninsula is under the influence of Lake Huron and lake-effect snow,
especially in winters with warmer Lake Huron water temperature and thus reduced ice cover.
Lake-effect snowfall occurs if cold west/northwest winds travel over a significant stretch of
open, warm water. This causes areas to the lee of Lake Huron to experience increased winter
snowfall (Saugeen, Grey Sauble, Northern Bruce Peninsula Source Protection Region, 2008a).
This phenomenon is linked to the migration tracks of mid-latitude cyclonic regimes, such as
Alberta Clippers and other storms from the northwest. While global warming already seems to
have increased the number of years with reduced ice cover on Lake Huron, little is known about
how the decreased temperature gradient caused by arctic warming will impact these cyclonic
patterns.
5.3.2 Great Lake Impacts
Water levels within the Great Lakes are regulated to a certain degree at the outflows of Lake
Superior and Lake Ontario (Schertzer et al., 2008; Tupman, 2004). Several diversions exist
throughout the basin. However, climate is the dominant factor affecting lake levels (Changnon,
2004). Lake Huron is not regulated; therefore, the impact of diversions is considered negligible
in comparison with climate factors in controlling lake levels (Changnon, 2004).
The impact of climate change on the water budget of the Great Lakes depends on the relationship
between precipitation and evaporation at the lake surface, on flow of surrounding rivers into the
lakes and on other factors, such as groundwater inflows. In the past 150 years, annual average
water levels in the Great Lakes have fluctuated up to 180 cm. Lake level data can be found on
the Environment Canada website (http://www.on.ec.gc.ca/water/levels). In 2001, Lake Superior
was at its lowest level since 1925 and Lakes Michigan and Huron were at their lowest levels
since 1965. Low water levels reflect substantial loss of water volume in the Great Lakes system.
Since this time, water levels in Lakes Huron and Michigan have rebounded significantly.
The exact balance of these processes is not understood well, in part because it is difficult to
measure precipitation and evaporation over the Great Lakes and because no continuous
measurement stations exist. Analysis of long-term regional climate data suggests that
precipitation accounts for 55% of the variability in lake levels, with temperature accounting for
30% (Changnon, 2004). For the 1997 to 2000 period, temperature increases may be the primary

Approved
Appendix E - Approved Assessment Report -- Grey Sauble Source Protection Area 5 - 7
cause of low water levels (Assel et al., 2004). In the long-term, net basin supplies will decrease
with climate change. Lake levels will also decline due to increased evaporation and timing of
precipitation (de Loë and Berg, 2006), which will be most pronounced in Lakes Michigan and
Huron, at 0.73 to 1.18 m by the 2050s (Mortsch et al., 2006). Work in the Maitland Valley SPA
has shown increases in both totals and intensity of precipitation over the period from 1950 to
2006, and it is not known what impacts this will have on lake levels or whether those trends are
applicable to the Grey Sauble SPA (Luinstra, 2009).
Great Lakes ice cover is the second major climatic factor. Since the 1970s, the ice cover on
America's Great Lakes has dropped by 30% (Great Lakes Environmental Research Laboratory,
2009). Moreover, Traverse Bay in Lake Michigan did not freeze over from 1995 to 2000, the
first period of five consecutive winters without freeze over in at least 150 years (Assel, 2003).
The ice cover of coastal regions is not noted and deep regions of the lakes remain open more
frequently (Assel, 2007). Evaporation causes less ice coverage in winter, when cold, dry air
passes over the open lake surface, which increases the amount of lake-effect snow in Southern
Ontario. Other potential impacts include increased wave erosion, more hazards for transportation
and navigation due to low water levels, potential reduction in hydropower generation due to
drought, and the need for increased shoreline protection (Canadian Climate Impacts and
Adaptation Research Network, 2006). Low water levels may also have negative impacts on
recreational uses and the local tourism industry.
The combined impacts of climate change on the Great Lakes basin are complex as the area is
influenced by hurricane tracks from the Caribbean, artic air masses and pacific air masses. The
manner in which global climate teleconnections interact with each other – especially the El Nino
Southern Oscillation, the Arctic Oscillation and the Pacific Decadal Oscillation (Rodionov et al.,
2003; Bai and Wang, 2009) – dominate the severity of winters, ice cover and summer heat in the
Great Lakes area. Ultimately, the impacts of climate change on these global patterns will
determine our future climate.
5.3.3 Groundwater
The number of freeze and thaw events has a significant impact on runoff distribution in the
spring. Even if all data analysis uncertainties are acknowledged (see section 5.4.1), climate
observations for the period from 1950 to 2006 document changes in the climate over the past two
decades. Average annual temperatures have increased modestly, yet the annual number of days
with highs that exceed 30°C has increased. A more pronounced trend suggests that there are
fewer days where temperatures remain below 0°C. This trend likely reflects a shorter frozen
period or an increase in the number of freeze and thaw cycles (Luinstra, 2009).
Data and modelling indicate that winter months are most significant recharge times, peaking in
late autumn and spring thaw (Saugeen, Grey Sauble, Northern Bruce Peninsula Source
Protection Region 2008a; Prodonović, 2008). Further research is needed to validate these results.
Reduced snow cover and a shorter frozen period, together with faster thawing, are likely to
diminish the quantity of recharge to local aquifers, which could have negative implications for
private well owners that rely on shallow, unconfined aquifers for drinking water sources. This
could lead to a shift from the exploitation of shallow aquifers to deep aquifers, which would

Approved
Appendix E - Approved Assessment Report -- Grey Sauble Source Protection Area 5 - 8
result in additional demand for the latter (Lemmen and Warren, 2004) and have uncertain
impacts in this Source Protection Area. Implications on fish populations from reduced
groundwater discharge to rivers, which is relevant during the low-flow season in summer and
autumn, is still unknown (de Loë and Berg, 2006).
5.3.4 Surface Water Flows
Surface water flows comprise the water in rivers, their tributaries and creeks and also includes
water in reservoirs, wetlands and lakes. Surface water is derived from yearly snowmelt, base
flow from groundwater, runoff from precipitation events, and other human intervention, such as
dams and flood control measures.
IPCC multi-model intercomparison (see section 5.2.1) suggests that the annual amount of
precipitation decrease around the Great Lakes is comparatively low, with a projected zero to five
percent decrease. However, precipitation is projected to increase in winter and spring, and
models and recent observations indicate that the intensity of precipitation events increases during
the rest of the year (United States Global Climate Change Research Program, 2009; Luinstra,
2009) with a longer duration of low-flow periods (de Loë and Berg, 2006). The intense
precipitation events seem to be more localized, causing local flash floods and erosion events.
While such events are difficult to measure with the existing meteorological network because of
their small spatial extent, their impact on local infrastructure can be profound (Pearson, 2009).
Earlier and lower spring freshets – the flow resulting from melting snow and ice – are expected
for Southern Ontario (Lemmen, 2008). The increase in thaw events and flash floods has the
following implications:
maintenance of municipal infrastructure, such as roads and bridges
sewage and water treatment facilities
increased capacity demand on storm sewers and stormwater management systems
dams, shore erosion control and flood control measures
The changing environmental conditions should be taken into account, especially for land use
planning and for those investments that have a turnover time of several decades, which include
sewer and drainage systems, water treatment plants, and flood and erosion control measures
(Burton, 2008).
Within the Maitland Valley Conservation Authority, precipitation increases have been observed
during the period from 1950 to 2006, which can be attributed to decreased ice cover on Lake
Huron and the northerly migration of winter storm tracks for mid-latitude cyclones. Higher
intensity rainfall events lead to increased erosion of gullies near the lakeshore, increased soil
erosion and a deterioration of surface water quality (Luinstra, 2009).
5.3.5 Wetlands
Climate change impacts on wetlands are still insufficiently understood. Coastal wetlands are an
important habitat for waterfowl as well as breeding and nursery areas for many fish. The
lowering of Great Lakes water levels could modify or eliminate coastal wetlands and reduce their
ecosystem functions (shoreline protection, erosion reduction, contaminant filtering) as reservoirs

Approved
Appendix E - Approved Assessment Report -- Grey Sauble Source Protection Area 5 - 9
that absorb excess storm water (Lemmen, 2008) and as carbon storage (Obenchain, 2004). The
impact of climate change must be evaluated in conjunction with other stressors, such as urban
development and agriculture (Ministry of Natural Resources, 2009). Key wetlands are at risk,
particularly those that are impeded from adapting to the new water level conditions by man-made
structures or geomorphic conditions (Mortsch, 1998).
Inland wetlands, especially within this SPA, are closely linked to the groundwater and surface
water cycle and are even more difficult to assess since they partly replenish groundwater aquifers
and are partly supplied by groundwater. The understanding of climate change impacts on
wetlands requires improved data on the role of Karst aquifers, surface water bodies, aquifers, and
groundwater recharge. Indirect climate impacts due to changing human land use may also impact
wetlands.
5.3.6 Other Implications
Impacts on maintenance costs for electricity and communications lines are expected. For
example, in the Toronto area the cost of insurance as a result of flooded basements and buildings
and extreme weather events is reported to have multiplied by more than 13 times from 1960 to
1999 (CAP, 2007). Some municipalities in the neighbouring Maitland Valley SPA reported an
increase in road maintenance costs, due to premature deterioration of roads, after an increase in
the freeze and thaw cycle (Pierson, 2009, Mills et. al., 2007).
5.4 Implications for Drinking Water Source Protection
5.4.1 Direct Impacts on Drinking Water Sources
The amount and availability of municipal drinking water in the Grey Sauble SPA is not expected
to be significantly impacted by changes in climate in the next few decades. The largest impact is
expected for private overburden wells and Karstic systems; however, the impact on these
systems is not known (Saugeen, Grey Sauble, Northern Bruce Peninsula Source Protection
Region, 2008b).
Most municipal drinking water systems for small urban centres rely on wells that retrieve water
from confined bedrock aquifers, which are not expected to experience any significant reductions
in water availability in the near future. Impacts are most likely in systems that rely on
overburden wells, inland lakes or springs that are impacted by precipitation and flood events.
Refer to chapter 7 for more detailed evaluation of potential climate impacts on municipal
drinking water systems. Municipal drinking water systems that are exploiting Karstic aquifers
may experience more frequent periods of contamination due to increasing intensities of rainfall
and more frequent snowmelt events.
Great Lake intakes will be affected by the change of lake level, as well as by the change of the
physical, chemical and biological properties of lake water. Most intakes in the Grey Sauble SPA
are located in deep water so that, even employing a conservative estimate, no deterioration in the
ability of the intakes to provide water can be reasonably projected. In the near future, lake levels
are not expected to drop more than one metre (Luinstra, 2009). However, it should be noted that
no standard exists for intake depth, which could provide guidance on optimal intake depth.

Approved
Appendix E - Approved Assessment Report -- Grey Sauble Source Protection Area 5 - 10
Climate change may cause or trigger water quality issues and health issues in drinking water
systems. These are related to the decrease of water quantity (decrease of dilution effects), new
and invasive pathogens under a new temperature regime, and extreme events such as water
intrusions caused by flooding and stormwater runoff. The role of transport pathways, such as
abandoned or improperly decommissioned wells, may play a significant role. Especially for
Karst bedrocks, the potential impact of increased rainfall intensity is poorly understood.
Finally, the overall impact of climate change on this SPA is intrinsically linked to the impacts on
the local hydrologic cycle. Lake Huron is the dominant local driver of climate in the area;
therefore, any impacts on it will have a profound effect on local climate patterns.
5.4.2 Indirect Impacts on Drinking Water Sources
With climate change impacting the water cycle, humans and ecosystems will adapt to their new
environment. This adaptation of sectors such as agriculture, tourism, industry, and others (Field
et al., 2008) will modify the water cycle indirectly.
With increasing variability of precipitation, the agricultural sector might increasingly rely on
supplemental irrigation practices (International Assessment of Agricultural Science and
Technology for Development, 2008). To mitigate the risk of yield loss, farmers may use either
surface water (e.g., from retention ponds) or groundwater for irrigation water. Especially for
crops that require a high level of input and have associated investment costs, either because of
manual labour, energy, chemicals, or any other form, the high energy cost associated with
groundwater pumping can be economical. Examples of activities where irrigation security
requirements are highest and groundwater-based irrigation is most likely include contract
farming, perennial plantations and vegetable farms.
With the increasing strength of climate change, the relevance of food security concerns will also
impact the general farming patterns (International Assessment of Agricultural Science and
Technology for Development, 2008b). While a shift toward an increasing share of local
production of high value products that rely on groundwater irrigation can be expected, a great
level of uncertainty remains.
The tourism sector may change and its water demands may significantly increase, especially if
living conditions in nearby urban centres are less favourable than today during the hot and dry
summer months. The changing living conditions in urban centres might change the water
demand.
The quality requirements for drinking water are higher than for any other sector – for human
consumption as well as for livestock. Under a scenario of climate change, the pressure on
existing drinking water resources might increase significantly because other sectors increase
demands. As a result, the provision of drinking water from clean groundwater sources can
increasingly compete with the increasing demands from other sectors and require improved
management.

Approved
Appendix E - Approved Assessment Report -- Grey Sauble Source Protection Area 5 - 11
5.5 Knowledge Gaps
Groundwater has traditionally received less attention than surface water, despite its importance
as a drinking water source worldwide. While groundwater has been monitored in the past, it has
not been monitored and examined for the eventuality of a changing climate and the associated
impacts. Such analysis would require an improved understanding of aquifer formation, sources
and natural discharges, for example, into the Great Lakes. However, depletion levels and
recharge rates have neither been modeled nor measured well, and existing models are based on
limited data (Bates et al., 2008). More study is needed on core processes such as recharge,
aquifer discharge and in-aquifer water movement, before confidently assessing the impacts of
climate change on water resources at a watershed scale.
With respect to surface water flow, local trends in climate data suggest that precipitation is
becoming more intense and localized, which has significant implications for flood management.
Due to their local nature, an early warning system for such intense events requires a denser
measurement network than exists today.
The impact of climate change on mid-latitude cyclones on this region is profound. In winter,
these cyclones carry precipitation from outside the Great Lakes basin into the area. In addition,
lake-effect snow heavily impacts Southern Ontario, and is highly sensitive to the extent of ice
cover on Lake Huron. While data indicates that this ice cover is changing dramatically, neither
the impact of climate change on the storm track of cyclones, nor the changes in lake-effect
precipitation, are well understood (Luinstra, 2009).
A significant, indirect impact of climate change is expected, if other human sectors change their
water consumption behaviour, such as the agricultural sector or the tourism sector. This human
adaptation to climate change has the potential to impact water quantity and quality. However,
very little research is available to estimate the magnitude of these potential impacts.
Further, potential climate change impacts on Karstic aquifers within this SPA remains a core
knowledge gap. There is a general lack of understanding of these Karstic systems and their
interaction with the local climate.

Approved
Appendix E - Approved Assessment Report -- Grey Sauble Source Protection Area 5 - 12
This page intentionally left blank.

Approved
Appendix E - Approved Assessment Report -- Grey Sauble Source Protection Area 5 - 13
REFERENCES
Aerts, J. and P. Droogers (eds.) 2004: Climate Change in Contrasting River Basins: Adaptation
Strategies for Water, Food and Environment. Centre for Agricultural Bioscience
International, 2004.
Assel, R.A., K. Cronk, and D.C. Norton. 2003: Recent trends in Laurentian Great Lakes ice
cover. Climatic Change 57:185-204.
http://www.glerl.noaa.gov/pubs/fulltext/2003/20030001.pdf
Assel, R. A. 2007: Indicator: Lake Erie ice cover. In State of the Strait: Status and Trends of Key
Indicators. J.H. Hartig, M.A. Zarull, J.H. Ciborowski, J.E. Gannon, E. Wilke, G. Norwood,
and A. Vincent (eds.). Great Lakes Institute for Environmental Research, Occasional
Publication No. 5, University of Windsor, Ontario, Canada, 102-104 (2007).
http://www.glerl.noaa.gov/pubs/fulltext/2007/20070044.pdf
Bai, X., and J. Wang. Impacts of ENSO and AO on inter-annual variability of Great Lakes ice
cover. 52nd Annual Conference of the International Association for Great Lakes Research,
University of Toledo, Toledo, OH, May 18-22, 2009 (2009).
Barrow, E. et al., 2005: Climate Variability and Change in Canada: Past, Present and Future.
Environment Canada.
Bates, B.C., Z.W. Kundzewicz, S. Wu and J.P. Palutikof (eds.) 2008: Climate Change and
Water. Technical Paper of the Intergovernmental Panel on Climate Change. IPCC.
Bruce, J.P. and D. Lean 2006: Planning for Extremes: Adapting to Impacts on Soil and Water
from Higher Intensity Rains with Climate Change in the Great Lakes Basin. Paper presented
on the Planning for Extremes Workshop of the Soil and Water Conservation Society;
Milwaukee, Wisconsin; November 1-3, 2006.
Burton, Ian 2008: Moving Forward on Adaptation. In From Impacts to Adaptation: Canada in a
Changing Climate 2007. D.S. Lemmen, F.J. Warrne and E. Bush (eds). Ottawa: Government
of Canada. pp. 425-440.
Canadian Climate Impacts and Adaptation Research Network 2006: Climate Change Impacts in
the Great Lakes Region. (Poster). http://www.c-ciarn.ca/pdf/great_lakes_poster2.pdf
Clean Air Partnership 2007. Cities Preparing for Climate Change: A Study of Six Urban
Regions. Clean Air Partnership. http://adaptation.nrcan.gc.ca/projdb/pdf/171e_e.pdf
Canadian Centre for Climate Modelling and Analysis 2008: Web site of the Canadian Centre for
Climate Modelling and Analysis, Data section. http://www.cccma.ec.gc.ca/data/data.shtml.
October 16th, 2008.

Approved
Appendix E - Approved Assessment Report -- Grey Sauble Source Protection Area 5 - 14
Climate Change Science Program, 2008a: Climate Projections Based on Emissions Scenarios for
Long-Lived and Short-Lived Radiatively Active Gases and Aerosols. A Report by the U.S.
Climate Change Science Program and the Subcommittee on Global Change Research. H.
Levy II, D.T. Shindell, A. Gilliland, M.D. Schwarzkopf, L.W. Horowitz, (eds.). Department
of Commerce, National Oceanic and Atmospheric Administration's National Climatic Data
Center, Washington, D.C., USA, 100 pp.
Climate Change Science Program, 2008b: Weather and Climate Extremes in a Changing
Climate. Regions of Focus: North America, Hawaii, Caribbean, and U.S. Pacific Islands. A
Report by the U.S. Climate Change Science Program and the Subcommittee on Global
Change Research. Thomas R. Karl, Gerald A. Meehl, Christopher D. Miller, Susan J. Hassol,
Anne M. Waple, and William L. Murray (eds.). Department of Commerce, National Oceanic
and Atmospheric Administration's National Climatic Data Center, Washington, D.C., USA,
164 pp.
Changnon, S.A., 2004: Temporal behaviour of levels of the Great Lakes and climate variability.
Journal Great Lakes Research, 30, 184-200.
Corkal, Darrell R. and Philip E. Adkins 2008: Canadian Agriculture and Water - Coping with
environmental pressures and climate change. Authors are employed by Agriculture and
Agri-Food Canada's Prairie Farm Rehabilitation Administration. Paper presented at 13th
International Water Resources Association World Water Congress, Montpellier, France 2008
de Loë, R.C. and A. Berg, 2006: Mainstreaming Climate Change in Drinking Water Source
Protection in Ontario. 2006.
Food and Agriculture Organization 2006: Livestock’s Long Shadow - Environmental Issues and
Options. Food and Agriculture Organization of the United Nations. Rome, 2006.
Field, C.B., L.D. Mortsch, M. Brklacich, D.L. Forbes, P. Kovacs, J.A. Patz, S.W. Running and
M.J. Scott, 2007: North America. Climate Change 2007: Impacts, Adaptation and
Vulnerability. Contribution of Working Group II to the Fourth Assessment Report of the
Intergovernmental Panel on Climate Change, M.L. Parry, O.F. Canziani, J.P. Palutikof, P.J.
van der Linden and C.E. Hanson, (eds., Cambridge University Press, Cambridge, UK, 617-
652.
Global Environment Centre 2007: F. Parish, A. Sirin, D. Charman, H. Joosten, T. Minayeva and
M. Silvius (eds.) Assessment on Peatlands, Biodiversity and Climate Change: Executive
Summary. Global Environment Centre, Kuala Lumpur and Wetlands International,
Wageningen.
GEMCLIM 2008: GEMCLIM (Global Environment Multiscale in climate mode). Environment
Canada Collaboration, http://collaboration.cmc.ec.gc.ca/science/rpn/gem/gem-climate/ Last
updated June 2008

Approved
Appendix E - Approved Assessment Report -- Grey Sauble Source Protection Area 5 - 15
Goyette, S., N.A. McFarlane, and G. Flato, 2000: Application of the Canadian Regional Climate
Model to the Laurentian Great Lakes Regions. Implementation of a Lake Model. Atmos. Oc.,
38, 481-503.
Huron Geosciences, 2011. Climate Trends in the Saugeen, Grey Sauble, Northern Bruce
Peninsula Source Protection Region. Unpublished Report.
Intergovernmental Panel on Climate Change 2001, Special Report on Emissions Scenarios.
Nebojsa Nakicenovic and Rob Swart (eds.), Intergovernmental Panel on Climate Change.
Geneva, 2001. http://www.grida.no/publications/other/ipcc_sr
Intergovernmental Panel on Climate Change AR4 WG1 2007. Climate Change 2007: The
Physical Science Basis. Contribution of Working Group I to the Fourth Assessment Report of
the Intergovernmental Panel on Climate Change. Solomon, S., D. Qin, M. Manning, Z. Chen,
M. Marquis, K.B. Averyt, M. Tignor and H.L. Miller (eds.). Cambridge University Press,
Cambridge, United Kingdom and New York, NY, USA, 996 pp.
Intergovernmental Panel on Climate Change AR4 Synthesis Report: Summary for Policy Makers
2007: Contribution of Working Groups I, II and III to the Fourth Assessment Report of the
Intergovernmental Panel on Climate Change. This summary, approved in detail at IPCC
Plenary XXVII (Valencia, Spain, 12-17 November 2007), represents the formally agreed
statement of the Intergovernmental Panel on Climate Change concerning key findings and
uncertainties contained in the Working Group contributions to the Fourth Assessment Report.
http://www.ipcc.ch/pdf/assessment-report/ar4/syr/ar4_syr_spm.pdf
Intergovernmental Panel on Climate Change 2007: Report of the 27th session of the
Intergovernmental Panel on Climate Change. Valencia, 12-17 November 2007
http://www.ipcc.ch/meetings/session27/final-report.pdf
Intergovernmental Panel on Climate Change 2008: Climate Change and Water. Bates, B.C.,
Z.W. Kundzewicz, S. Wu and J.P. Palutikof (eds.). Intergovernmental Panel on Climate
Change Secretariat, Geneva, 210 pp., June 2008.
IPCC, 2013: Climate Change 2013: The Physical Science Basis. Contribution of Working Group
I to the Fifth Assessment Report of the Intergovernmental Panel on Climate Change
[Stocker, T.F., D. Qin, G.-K. Plattner, M. Tignor, S.K. Allen, J. Boschung, A. Nauels, Y.
Xia, V. Bex and P.M. Midgley (eds.)]. Cambridge University Press, Cambridge, United
Kingdom and New York, NY, USA, 1535 pp.
International Assessment of Agricultural Science and Technology for Development 2008:
International Assessment of Agricultural Knowledge, Science and Technology for
Development – Synthesis Report. Intergovernmental report, International Assessment of
Agricultural Science and Technology for Development, http://www.agassessment.org/, April
2008.

Approved
Appendix E - Approved Assessment Report -- Grey Sauble Source Protection Area 5 - 16
International Assessment of Agricultural Science and Technology for Development 2008b: Food
Security in a Volatile World – Issues in Brief. International Assessment of Agricultural
Knowledge, Science and Technology for Development.
http://www.agassessment.org/docs/10505_FoodSecurity.pdf, April 2008.
Jackson, Brian 2007: Potential effects of climate change on lake trout in Atikokan Area. Climate
Change Research Note CCRN-04, 2007. Ontario Government, Ministry of Natural
Resources, 2007
Kling, G.W., K. Hayhoe, L.B. Johnson, J.J. Magnuson, S. Polasky, S.K. Robinson, B.J. Shuter,
M.M. Wander, D.J. Wuebbles, D.R. Zak, R.L. Lindroth, S.C. Moser, and M.L. Wilson. 2003.
Confronting Climate Change in the Great Lakes Region: Impacts on our Communities and
Ecosystems. Cambridge, Massachusetts: Union of Concerned Scientists; Washington, D.C.:
Ecological Society of America.
Kunkel, Kenneth E. and Leslie Ensor, Michael Palecki, David Easterling, David Robinson,
Kenneth G. Hubbard, Kelly Redmond 2009: A new look at lake-effect snowfall trends in the
Laurentian Great Lakes using a temporally homogeneous data set. Journal of Great Lakes
Research. Volume 35, Issue 1, March 2009, Pages 23-29.
Latif, M. and T.P. Barnett, 1994: Causes of decadal climate variability over the North Pacific and
North America. Science 266, 634-637.
Lemmen, D.S. and F.J. Warrne and E. Bush (eds.) 2007: Canada in a Changing Climate 2007.
Ottawa: Government of Canada. pp. 425-440.
Lake Huron Centre for Coastal Conservation 2008: Lake Huron and Climate Change - What Are
The Possibilities? Report of Lake Huron Centre for Coastal Conservation, 2008.
Luinstra, Brian 2009: Climate Trends in the Maitland Valley Conservation Authority Watershed.
unpublished report for Maitland Valley Conservation Authority.
MacRae, R., 2008: How Will Your Farm Cope with a Changing Climate? Maitland Valley
Conservation Authority. 2008.
MacIver, D. et al., 2007: Coastal Zone Management under a Changing Climate in the Great
Lakes, Environment Canada.
Martynov, A., L. Sushama, R. Laprise, 2009: Implementation of lakes in the Canadian Regional
Climate Model. Présentation orale, 62nd Annual Conference of the Canadian Water
Resources Association, June 9-12 2009, Quebec, QC, Canada.
Mills B.N., S.L. Tighe, J. Andrey, J.T. Smith, S. Parm, K. Huen (2007): The Road Well-
Travelled: Implications of Climate Change for Pavement Infrastructure in Southern Canada.
Study for Environment Canada. http://adaptation.nrcan.gc.ca/projdb/pdf/134b_e.pdf

Approved
Appendix E - Approved Assessment Report -- Grey Sauble Source Protection Area 5 - 17
Ministry of Natural Resources 2009: Climate Change & Ontario’s Wetlands. Web site of the
Ministry of Natural Resources.
http://www.mnr.gov.on.ca/en/Business/ClimateChange/2ColumnSubPage/STEL02_168601.
html
Mortsch, L. 1998: Assessing the Impact of Climate Change on the Great Lakes Shoreline
Wetlands. Climatic Change 40: 391-416, 1998.
Mortsch, L. et al., 2005: Development of Climate Change Scenarios for Impact and Adaptation
Studies in the Great Lakes – St. Lawrence Basin, Environment Canada. 2005.
Mortsch, L. et al., (eds.) 2006: Great Lakes Coastal Wetland Communities: Vulnerable to
Climate Change and Response to Adaptation Strategies, Environment Canada. 2006.
Music, B., and D. Caya, 2007: Evaluation of the Hydrological Cycle over the Mississippi River
Basin as Simulated by the Canadian Regional Climate Model. J. Hydromet., 8(5), 969-988.
North American Regional Climate Change Assessment Program 2009: Model Information,
Regional Models. North American Regional Climate Change Assessment Program. Boulder,
Colorado. http://www.narccap.ucar.edu (Accessed October 2009).
Obenchain, A.M. 2004: Including Wetlands in Carbon Budget Modelling. Ontario Forestry
Research Institute, Ontario Ministry of Natural Resources, Sault Ste. Marie, ON, Insights,
6(2): 13-14.
Program For Climate Model Analysis and Comparison 2009: Program For Climate Model
Analysis and Comparison. Lawrence Livermore National Laboratory in Livermore,
California. www-pcmdi.llnl.gov/ (Accessed October 2009).
Pearson, David 2009 – Summary of MVCA Meeting. Unpublished conference report. Climate
Change Action: Rural Perspectives from the Maitland Valley Watershed – April 23, 2009.
See also http://www.climateontario.ca/workshops.html
Plummer, D.A., D. Caya, A. Frigon, H. Cote, M. Giguere, D. Paquin, S. Biner, R. Harvey, and R.
de Elia, 2006: Climate and Climate Change over North America as Simulated by the
Canadian RCM. J. Clim, 19(13), 3112-3132.
Rodionov, S. and R. A. Assel. Winter severity in the Great Lakes region: A tale of two
oscillations. Climate Research 24:19-31 (2003).
Prodonović, P., 2008: Response of Water Resources Systems to Climate Change, University of
Western Ontario. 2008.
Rush, R., with J. Ivy, R. de Loë, and R. Kreutzwiser, 2004: Adapting to Climate Change in the
Maitland Valley Watershed, Ontario: A Discussion Paper for Watershed Stakeholders.
University of Guelph. 2004.

Approved
Appendix E - Approved Assessment Report -- Grey Sauble Source Protection Area 5 - 18
Schertzer, W.M., R.A. Assel, D. Beletsky, T.E. Croley II, B.M. Lofgren, J.H. Saylor, and D.J.
Schwab 2008: Lake Huron climatology, inter-lake exchange and mean circulation. Aquatic
Ecosystem Health and Management 11(2):144-152 (2008).
Schroeter and Associates 2007: Meteorological Data Missing-Value Fill-in Study for Ontario.
Memo report to the Ministry of Natural Resources, Ontario. Report supplied by MNR with
data disk. June 2007.
Scinocca, J. F., N. A. McFarlane, M. Lazare, J. Li, and D. Plummer, 2008: The CCCma third
generation AGCM and its extension into the middle atmosphere. Atmos. Chem. Phys.
Discuss., 8, 7883-7930. www.atmos-chem-phys-discuss.net/8/7883/2008/.
Séguin, Jacinthe and Peter Berry (eds.) 2008: Human Health in a Changing Climate: A Canadian
Assessment of Vulnerabilities and Adaptive Capacity. Climate Change and Health Office,
Safe Environments Program, Health Canada, Ottawa, Ontario
Semenov, M. E and E. M Barrow 1997: Use of a stochastic weather generator in the
development of climate change scenarios. Climatic Change 35, pp. 397–414, 1997.
Saugeen, Grey Sauble, Northern Bruce Peninsula Source Protection Region 2008a: Watershed
Characterization Report. Saugeen, Grey Sauble, Northern Bruce Peninsula Source Protection
Region. Drinking Water Source Protection Project Report, 2008
Saugeen, Grey Sauble, Northern Bruce Peninsula Source Protection Region 2008b: Saugeen,
Grey Sauble, And Northern Bruce Peninsula Tier 1 Surface Water Budget And Stress
Assessment Report. Drinking Water Source Protection Project Report, 2008
Tupman, Kevin 2004: The potential impact of climate change on the Lake Huron shoreline at
Oliphant. Report to Lake Huron Centre for Coastal Conservation. 2004
United States Global Climate Change Research Program 2009: Global Climate Change Impacts
in the United States. A State Of Knowledge Report from the U.S. Global Change Research
Program. Cambridge University Press. June 2009. www.globalchange.gov/usimpacts
Wall, Ellen and Barry Smith and Johanna Wandel 2007: Farming in a Changing Climate:
Agricultural Adaptation in Canada. Book, University of British Columbia Press, Canada
Zhang, Y., J.M. Wallace and D.S. Battisti 1997: ENSO-like Interdecadal Variability: 1900-93.
Journal of Climate, Vol. 10, 1004-1020.Aerts, J. and P. Droogers (eds.) 2004: Climate
Change in Contrasting River Basins: Adaptation Strategies for Water, Food and
Environment. Centre for Agricultural Bioscience International, 2004.