CLIMATE CHANGE PUBLIC EXPENDITURE AND … · Cover photos from the World Bank Flickr Site. ......
257
CLIMATE CHANGE PUBLIC EXPENDITURE AND INSTITUTIONAL REVIEW SOURCEBOOK
Transcript of CLIMATE CHANGE PUBLIC EXPENDITURE AND … · Cover photos from the World Bank Flickr Site. ......
CLIMATE CHANGE PUBLIC EXPENDITURE AND INSTITUTIONAL REVIEW SOURCEBOOK

© 2014 International Bank for Reconstruction and Development / The World Bank 1818 H Street NW Washington DC 20433 Telephone: 202-473-1000 Internet: www.worldbank.org This work is a product of the staff of The World Bank with external contributions. The findings, interpretations, and conclusions expressed in this work do not necessarily reflect the views of The World Bank, its Board of Executive Directors, or the governments they represent. The World Bank does not guarantee the accuracy of the data included in this work. The boundaries, colors, denominations, and other information shown on any map in this work do not imply any judgment on the part of The World Bank concerning the legal status of any territory or the endorsement or acceptance of such boundaries.
Rights and Permissions The material in this work is subject to copyright. Because The World Bank encourages dissemination of its knowledge, this work may be reproduced, in whole or in part, for noncommercial purposes as long as full attribution to this work is given. Any queries on rights and licenses, including subsidiary rights, should be addressed to the Office of the Publisher, The World Bank, 1818 H Street NW, Washington, DC 20433, USA; fax: 202-522-2422; e-mail: [email protected]. Cover photos from the World Bank Flickr Site. Cover design by World Bank staff Ivy Ka-Yee Lau.

PREFACE The 2013 Fifth Assessment Report of the Intergovernmental Panel on Climate Change (IPCC AR5) advised that “warming of the climate system is unequivocal” and said that since the 1950s “many of the observed changes are unprecedented over decades to millennia.” Climate change is one of the greatest challenges of our time–it affects every country and yet progress in mainstreaming climate change into the policy-making process is patchy. Some countries’ political leaderships have put in place high-profile climate change mitigation and adaptation plans, with broad participation across government agencies and nongovernmental stakeholders, and with their central finance and planning agencies assuming a key role. In many other countries, however, climate change issues remain the preserve of specialist environmental agencies and there is no framework or mechanism by which climate change issues are systematically taken into account in national planning. This Climate Change Public Expenditure and Institutional Review Sourcebook (CCPEIR) seeks to provide practitioners with the tools and information needed to respond to the public expenditure policy and management challenges arising from climate change. It is a series of notes and supporting materials written to consolidate current research and international experience, to identify emerging practice, and to provide practical and applicable guidance for staff of central finance agencies, development agencies, environmental agencies, and international organizations working on climate change issues. While the key issues addressed in most public expenditure reviews–aggregate expenditure discipline, policy alignment, efficiency, and effectiveness–are all relevant to climate change expenditure analysis, these issues are adequately addressed elsewhere. In addition to emphasizing the importance of strengthening national systems, this Sourcebook focuses on the specific public expenditure policy and management challenges posed by climate change, such as decision making in the face of uncertain future climate conditions, expenditure planning for extreme weather and climate events, and the lack of agreed-upon budget classifications for climate-related activities. Differences in the level of knowledge and experience across the range of public expenditure policy and management issues are reflected in the chapters; this Sourcebook is intended, however, to be only the first step toward providing a comprehensive source of information that is detailed enough to provide clear and operational guidance, to help raise awareness, and to support policy dialogue in countries that are developing climate change plans. It is hoped that this Sourcebook will be continually expanded and updated to become more useful and relevant for policy makers in developed and developing countries alike. The costs of inaction on climate change are high and will be disproportionately borne by developing countries. While the costs of mitigation and adaptation may be short-term, the benefits are likely to accrue well beyond the time horizon of politicians and planners. It is imperative for both human welfare and continued economic development that growth and poverty reduction agendas go hand-in-hand with the green agenda. Climate change is an emerging and evolving issue, and it must be mainstreamed starting today. The CCPEIR Team June 2014

ACKNOWLEDGEMENTS The Climate Change Public Expenditure and Institutional Review (CCPEIR) Sourcebook was prepared by a World Bank team led by Adrian Fozzard and, in the final phase, by Erika Jorgensen.
The Sourcebook team included Adrian Fozzard, Elisa Portale, Sylke Von Thadden, Leo Dobes, Murray Petrie and Arvind Nair during preparation; and Erika Jorgensen, Ivy Ka-Yee Lau, and Maria Shkaratan for final revisions and completion.
Helpful comments, suggestions, and contributions were received from many reviewers, including Nataliya Biletska, Milan Brahmbhatt, Jim Brumby, Francis Ghesquiere, Stephane Hallegatte, Ari Juhani Huhtala, Auguste Kouame, Eduardo Ley Andrea Liverani, Jenni Panjunen, Apurva Sanghi, Rob Taliercio and Lorena Vinuela, and GEF staff, all of the World Bank; and Paul Steele and also Tom Beloe of UNDP.
World Bank staff Philippe Ambrosi, Marc Forni and Olivier Mahul contributed to the development of the chapter on disaster risk management. Christophe Crepin and Andrea Liverani (World Bank), and Paul Steele (UNDP) contributed to the chapter on budget classification. Jane Ebinger and Wei-Jen Leow of the Bank’s CCGPT team redrafted the chapter on international public climate finance. Andrew Velthaus, Yasemin Biro, Rawleston Moore and Knut Sundstrom of GEF provided key inputs for the chapters on planning and international public climate finance. Topics and methods for the Sourcebook were discussed at a UNDP-led workshop in Bangkok in 2012, with the participation of the World Bank, the European Union, GIZ, the Republic of Korea, SIDA, OECD, DfID, USAID, UNCDF and UNEP, together with government officials from over 22 countries in Asia Pacific, Africa, Latin America and Europe. Erika Jorgensen led the team that brought the Sourcebook to completion, especially Ivy Ka-Yee Lau and Maria Shkaratan, and also Simon Davies, Eduardo Ferreira, Rachel Li Jiang and Wei-Jen Leow. Jane Ebinger provided essential guidance during the final phase as well as contributions from her team. Special thanks go to the financial support provided by the Governance Partnership Facility, which included contributions from Norway, Netherlands, Australia and United Kingdom, and the APEC Climate Change Policies Trust Fund.
Vice President, PREM:
Sector Director, and Sector Manager, PRMPS:
Task Team Leader, ECSP2:
Ana Revenga
William Dorotinsky
Erika Jorgensen

TABLE OF CONTENTS
INTRODUCTION ........................................................................................................................ 1
A. Climate Change Context ...................................................................................................................... 2
B. Purpose, Analytic Framework and Process ........................................................................................15
C. Sourcebook Scope and Structure .......................................................................................................22
CHAPTER 1. POLICY ................................................................................................................. 28
1.1. Chapter Summary ...........................................................................................................................28
1.2. Main Issues .....................................................................................................................................30
1.3. Better Informed Policy Choices .......................................................................................................39
1.4. Mitigation Policy Challenges: Energy Pricing ..................................................................................42
1.5. Mitigation Policy Challenges: Carbon Pricing .................................................................................50
1.6. Mitigation Policy Challenges: Adoption of Low-Carbon Technologies ...........................................56
1.7. Adaptation Policy Challenges: Public Investment and Private Sector Action .................................63
1.8. The Role of Regional and Local Government ..................................................................................64
1.9. The Role of the Private Sector ........................................................................................................70
CHAPTER 2. PLANNING ........................................................................................................... 72
2.1. Chapter Summary ...........................................................................................................................72
2.2. International Framework ................................................................................................................74
2.3. National Planning ............................................................................................................................80
CHAPTER 3. DECISION MAKING ............................................................................................. 101
3.1. Chapter Summary .........................................................................................................................101
3.2. Tools Used for Decision Making ....................................................................................................103
3.3. Uncertainty in Climate Change .....................................................................................................112
3.4. Uncertainty and Decision Making Tools .......................................................................................116
3.5. Flexibility and the Decision Making Process .................................................................................121
CHAPTER 4. DISASTER RISK MANAGEMENT ........................................................................... 126
4.1. Chapter Summary .........................................................................................................................126
4.2. Disasters: An Overview .................................................................................................................128
4.3. Disaster Risks and Impacts ............................................................................................................129
4.4. Risk Management Strategies ........................................................................................................133
4.5. Financial Protection ......................................................................................................................139
4.6. Resilient Reconstruction ...............................................................................................................150
CHAPTER 5. INTERNATIONAL PUBLIC CLIMATE FINANCE ........................................................ 154
5.1. Chapter Summary .........................................................................................................................154
5.2. Public Climate Finance: An Overview ...........................................................................................156

5.3. Market-Based Climate Finance .....................................................................................................164
5.4. Implications for Developing Countries ..........................................................................................170
CHAPTER 6. FINANCIAL MANAGEMENT ................................................................................. 178
6.1. Chapter Summary .........................................................................................................................178
6.2. Budgeting and Expenditure Planning ............................................................................................180
6.3. Resource Allocation Outside the Budget Process .........................................................................192
6.4. National Climate Change Funds ....................................................................................................201
6.5. Climate Change Auditing ...............................................................................................................208
CHAPTER 7. BUDGET CLASSIFICATION ................................................................................... 212
7.1. Chapter Summary .........................................................................................................................212
7.2. Overview .......................................................................................................................................214
7.3. Purpose .........................................................................................................................................215
7.4. Environmental Accounting ............................................................................................................219
7.5. Budget Classification .....................................................................................................................221
7.6. Reporting Climate Change Finance ...............................................................................................224
7.7. Tagging Climate-Relevant Expenditures .......................................................................................227
7.8. Off-Budget Climate Expenditures .................................................................................................231
REFERENCES ......................................................................................................................... 235
RELEVANT WEBSITES ............................................................................................................ 249

1
Adaptation should not be seen as an additional policy agenda to deliver, but as “development in a
harsher climate.”
Nicholas Stern (2009) 1
INTRODUCTION
Consensus has grown that the global climate system is warming, a trend in which anthropogenic
influences are substantial. Climate change will bring with it a range of damages driven by more frequent
extreme heat waves and precipitation as well as sea-level rise, raising risks to food security, livelihoods,
and human health. At the same time, it is expected that all countries, both developed and developing
ones, will eventually take on commitments to mitigation. It is therefore essential for continued
economic growth and sustained improvements in welfare that the economic development agenda
become aligned with the climate action agenda.
Climate change represents one of the most important challenges facing the developing world. An
effective response requires action by various agencies and constituencies across the public and private
sector, and is not an issue that can be addressed by environmental agencies alone. Climate change
should be of particular concern to central finance and planning agencies. After all, a successful response
to climate change is central to their development mission. The goal is still to achieve growth and poverty
reduction, but to do so in a harsher, more uncertain climate and in a more sustainable manner. This calls
for translating climate change into issues that are core responsibilities of central finance and planning
agencies. Climate change shares many of the characteristics of policy issues that central finance and
planning agencies are routinely asked to address. However, it also presents specific challenges.
The Climate Change Public Expenditure and Institutional Review (CCPEIR) Sourcebook identifies the
key issues that central finance and planning agencies will need to consider and the various approaches
taken in dealing with the technical, policy, and institutional issues that are likely to arise in the response
to climate change. It seeks to equip public expenditure practitioners with the background information
needed to conduct public expenditure reviews on climate change and to focus attention on the policy
response to climate change, the application of scarce resources, and the institutional arrangements to
support these policies.
This introduction provides background on the climate change context and on the purpose and process
of climate change public expenditure reviews. It also provides an overview of the key issues that these
reviews will typically have to address. Section A provides a brief overview of climate change issues as a
context for CCPEIRs. Section B explains the purpose of CCPEIRs and discusses the analytic framework.
Section C provides guidance on the expenditure review process. Finally, Section D lays out the structure
of the Sourcebook. This overview recognizes that the scope, content, and process for Climate Change
Public Expenditure Reviews will differ among countries according to their needs. It also acknowledges
1 Stern, Nicholas (2009). A Blueprint For a Safer Planet: How to Manage Climate Change and Create a New Era of Progress and
Prosperity. The Bodley Head, London, UK.
2
that there will be differences in approaches among international agencies providing support for this
process.
A. CLIMATE CHANGE CONTEXT
Climate Change Impacts
The 2014 Fifth Assessment Report of the Intergovernmental Panel on Climate Change (IPCC AR5)
advised that “warming of the climate system is unequivocal” and that it is “extremely likely (95
percent confidence) that more than half of the observed increase in global average surface
temperature from 1951 to 2010 was caused by the anthropogenic increase in greenhouse gas
concentrations and other anthropogenic increase forcings together.”2 The earth has warmed at an
increasing rate throughout the 20th century. Today, global mean temperature is 0.8˚C above pre-
industrial levels, and every year since 2000 has ranked among the 14 hottest years since recordkeeping
began in 1880. Annual global mean temperatures have been above the long-term average for the 36th
consecutive year. Atmospheric concentrations of CO2, the principal greenhouse gas (GHG), have
increased from 278 parts per million (ppm) in the pre-industrial 1750s to over 400 ppm in 2014. The
concentration continues to increase at a rate of 1.8 ppm per year (Box A). Moreover, even if greenhouse
gas concentrations are stabilized today, anthropogenic atmospheric warming will continue for centuries
because GHGs remain in the atmosphere for decades or even millennia.3
Box A. Sources and Trends in GHG Emissions
Industrialized countries are responsible for about two-thirds of the world’s cumulative CO2 emissions from energy since 1850, middle-income countries are responsible for about one-third, and low-income countries for a negligible share. However, emissions from developing countries, especially the fast-growing larger economies, are rising rapidly along with industrialization, urbanization, and incomes. The OECD Environmental Outlook (2011) reports that the share of global GHG emissions from Brazil, India, Russia, and China has grown from 26 percent in 1970 to 35 percent in 2005, while other-non OECD countries’ share has grown from 20 percent to 28 percent over the same period. These trends are expected to continue under business-as-usual scenarios with China, India, Brazil and other non-OECD countries’ share rising to 70 percent of GHG emissions by 2050. Under this business-as-usual scenario, per capita GHG emissions in China, India, and Brazil would almost double, from 5.4 tCO2e in 2010 to 10.4 tCO2e in 2050, far outstripping growth in per capita emissions in other non-OECD countries (rising from 3.8 to 5.5 tCO2e) but not yet catching up with OECD countries (rising from 13.4 to 15.3 tCO2e).
Most GHG emissions come from the burning of fossil fuels, primarily for power but also for industrial processes and transport. Deforestation, forest fires, and changes in land use and land management practices that lead to loss of vegetation, soil, and peat in wetlands are important sources of GHGs. They are also important because they reduce the capacity of ecosystems to capture and store GHGs. Under the OECD Environmental Outlook’s business-as-usual scenario, most increases in CO2 emissions in the period to 2050 will come from increasing demand for electricity and vehicle use. Much of the increase in emissions will occur in China, India, Brazil, and the developing world. Deforestation is expected to slow in much of the developing world except Sub-Saharan Africa, where there will be pressure to expand agricultural land at the expense of forests.
Sources: UNEP (2012). Annual Report 2012; OECD (2011). Environmental Outlook to 2050, Chapter 3: Climate Change; IEA (2012). CO2 Emissions from Fuel Combustion.
2 IntergovernmentalPanel on Climate Change Fifth Assessment Report (2013). Climate Change 2013: The Physical Science Basis.
3 The World Bank (2012). Turn Down the Heat: Why a 4
oC Warmer World Must be Avoided.
3
The international community has set 2oC of warming4 as the upper limit at which the economic, social,
and environmental costs of adaptation would be manageable. In order to have a greater than 50-
percent chance of limiting global warming to 2oC, GHG concentrations will have to be kept below 450
ppm.5 At 550 ppm, the probability of achieving the 2oC target drops to 20 percent; at 400 ppm, it rises to
80 percent.6 Without further commitments and action, the world is likely to warm by more than 3°C
above pre-industrial levels. Even if current emissions reductions pledges are fully met, there is roughly a
20-percent likelihood that temperatures will exceed 4°C by 2100 and a 10-percent likelihood of
exceeding 5°C by the same year. If the pledges are not met, warming of 4°C could occur as early as the
2060s.7
There is broad agreement on the impacts of atmospheric warming on the global climate and oceans,
but uncertainty as to how this will affect specific countries and the pace of change. Most models
predict more warming and precipitation in higher latitudes than in lower latitudes. However, the
differences between models' predictions at a regional or country level can be huge, particularly in the
lower latitudes. In West Africa, for instance, one of the leading models (CCSM3) predicts a 20-percent
increase in precipitation while another (GFDL) predicts a 30-percent decrease. Further, while the rate of
warming is largely dependent on progress in curbing greenhouse gas emissions, abrupt and irreversible
changes in climate and ecosystems can occur once certain temperature thresholds are reached, thereby
giving unexpected boosts to warming.8 Examples of sudden, catastrophic phenomena include the
collapse of the Greenland and Antarctic ice sheets, release of Arctic methane, and dieback of the
Amazon rainforest. Unprecedented changes to climatic, hydrological, and environmental systems
induced by even modest changes in global temperatures add further uncertainty when trying to
anticipate the impact of climate change on human activity. The IPCC AR5 provides an overview of the
expected impacts of climate change on human systems and the environmental systems on which they
depend. The World Bank, in advance of IPCC AR5, explored the impacts of warming up to 2100.9
Climate-change impacts on ecosystems will range from loss of biodiversity and diminished land cover
to large-scale ecosystem collapses. If warming is limited to less than 2˚C, modest biome shifts are
expected only in temperate and tropical regions, while 3˚C warming will lead to significant changes in
both cold and tropical regions. At warming greater than 4˚C, biomes in temperate regions will also be
affected, including poleward biome shifts of up to 400 kilometers. This would put isolated mountaintop
ecosystems, island ecosystems, and those at the edges of continents at risk of extinction. Humid tropical
forests will face climate-induced losses caused by decreased water availability. If warming can be kept at
2˚C, around 25 percent of the land extent of humid tropical forests will be lost; at 4°C warming, humid
tropical forests are expected to contract by 75 percent. By the end of the 21st century, global mangrove
4 The increase in global average temperature to less than 2°C above pre-industrial levels.
5 IPCC (2014). WGIII AR5 Summary for Policymakers.
6 IPCC (2007). WGI AR4 Summary for Policymakers.
7 WB (2012). “Turn Down the Heat: Why a 4
oC Warmer World Must be Avoided.”
8 IPCC (2014). “WGII AR5 Summary for Policymakers” in Climate Change 2014, Mitigation of Climate Change. Contribution of
Working Group III to the Fifth Assessment Report of the Intergovernmental Panel on Climate Change. 9 World Bank (2012 and 2013). Turn Down the Heat: Why a 4
oC Warmer World Must be Avoided.

4
cover in coastal areas is projected to experience a significant decline due to heat stress and sea-level
rise.
Climate change will lead to changes in the patterns of precipitation and evapotranspiration,
exacerbating water stress in areas where these resources are already under pressure. Mean annual
runoff is expected to decrease in the Danube, Mississippi, Amazon, and Murray Darling river basins, and
increase in both the Nile and the Ganges basins. Areas that do not experience a decrease in average
precipitation may experience a change in rainfall patterns, with much of their annual rainfall falling in a
short period of time. They may suffer extended dry seasons interspersed with severe precipitation
events. Reduced glacial runoff, critical during the dry season in India, China and South America, will
aggravate these trends. Impacts on water stress will ultimately depend on the interactions between
climate change, demographic change, and changes in patterns of demand for water resources. The IPCC
Fourth Assessment Report estimated that with a global warming of 2oC, 1-2 billion people will be
exposed to water stress; this figure is poised to rise to 3 billion as warming reaches 4oC.10
Contrary to the suggestions in the IPCC AR4 that climate change would be good for crops in high-
latitude regions, possibly offsetting negative impacts elsewhere, the IPCC AR5 concludes that, already,
“negative impacts of climate change on crop yields have been more common than positives ones.”
Even in high-latitude regions, “it is not yet clear whether the balance of impacts has been negative or
positive.” 11 The severity and extent of droughts will increase in Southern Africa, the United States,
Southern Europe, Brazil, and Southeast Asia. Increased salinization in irrigated areas, inundation of
highly productive agricultural land in deltas, and saltwater incursion into coastal aquifers will have
cumulative adverse impacts on agricultural productivity. At the same time, demand for food will
increase, possibly by as much as 60-100 percent, as the world population reaches nine billion around
2050 and living standards rise. Modeling undertaken for the AR5 estimates “an increase in global
malnourished population by 40 million (11 percent) in 2050.” The World Bank suggests that these
models could well underestimate the impacts on agricultural productivity, highlighting recent research
that indicates that crop yields are much more sensitive to high and extreme temperatures in India,
Africa, the United States, and Australia than previously thought.12 The IPCC now considers it “very likely”
that climate impacts “will lead to increased food prices by 2050, with estimated increases ranging from
3-84 percent.” 13
Extreme weather events will be more intense. In the 1960s, summertime heat waves that are more
than three standard deviations greater than the mean affected less than one percent of the earth’s
surface. The area affected by these outlier events increased to 4-5 percent by 2006-08, and 6-13 percent
by 2009-11. Intense heat waves and droughts have been associated with increased incidence of
wildfires, as seen in recent years in Russia, the U.S., and Australia. The warming of tropical waters is
10
Parry, M., Canziani, O. & Palutikof, J.(2007). Climate Change 2007: Impacts, Adaptation, and Vulnerability. Contribution of Working Group II to the Fourth Assessment Report of the Intergovernmental Panel on Climate Change. Cambridge: Cambridge University Press. 11
IPCC WGII (2014). AR5 Summary for Policy Makers. Section A1. 12
World Bank (2012). Turn Down the Heat. 13
IPCC WGII (2014). Chapter 7, Section 7.4.4, “Food Security and Food Production Systems” in AR5.

5
likely to intensify tropical storms. While the frequency of tropical storms may not increase, damages will
rise as they bring higher winds and more rain. A recent modeling exercise suggests that economic
development will double global tropical cyclone damage by putting more people and assets in harm’s
way. Global warming to 3oC will double global damage, causing an additional $54 billion in losses per
year by 2100. Damage will be concentrated in countries in the Caribbean Basin and East Asia, mostly due
to a small number of very intense storms.14
Sea levels will rise, threatening low lying coastal areas with inundation. Warming of the lower
atmosphere also leads to warming of the oceans, causing water to expand and sea levels to rise. During
the 20th century, sea levels rose at the rate of 1.7 cm per decade on average, but 3.2 cm per decade
since the beginning of the 1990s. Current rates of melting in polar ice caps and ice sheets will contribute
13 cm to the rise in sea levels by 2100; accelerated melting may contribute a further 56 cm.15 Sea-level
rises are projected to be up to 20-percent higher in the tropics than at higher latitudes owing to
geophysical factors. Impacts will vary depending on local conditions. Increased exposure to extreme
weather events and coastal and marine habitat loss will exacerbate the effects of rising sea levels. Some
of the most vulnerable cities are located in Mozambique, Madagascar, Mexico, Venezuela, India,
Bangladesh, Indonesia, the Philippines, and Vietnam.16
As atmospheric CO2 concentrations rise, the oceans will absorb more CO2 and become more acidic,
damaging coral reefs and other marine ecosystems. Ocean acidity is currently 30 percent above pre-
industrial levels. In the geological past, significant changes in pH have been associated with large-scale
extinction events. The combination of thermally induced bleaching, ocean acidification, and sea-level
rise threatens large areas of coral reef. Reefs provide nursery grounds and habitat for a variety of fished
species, a valuable tourism asset, and protection against coastal floods and rising sea levels, Damage to
and ultimately extinction of coral reef ecosystems would have serious consequences for the people who
depend on them for food, income, and shoreline protection.
Climate change will also impact human health. Changes in temperature, precipitation, and humidity
will increase the risk of food-borne, water-borne, and vector-borne diseases, including malaria, dengue
fever, hantaviruses, leishmaniasis, Lyme Disease, and schistosomiasis. Malaria will spread into areas
previously free from the disease where the population has no immunity. Malnutrition and
undernutrition, which are major contributors to child mortality in developing countries, are expected to
increase as a result of declining agricultural productivity and more frequent crop failures.
Undernourishment increases vulnerability to illness and infection severity: meningitis epidemics in Sub-
Saharan Africa, for instance, often follow famines.
Developing countries are particularly vulnerable to climate change. Even though the largest
temperature increases will take place in higher latitudes, developing countries in tropical areas will
suffer the combined impact of sea-level rises, increased aridity and more frequent droughts, and more
14
Mendelsohn, R., Emanuel, K., Chonabayashi, S. and Bakkensen, L. (2012). “The Impact of Climate Change on Global Tropical Storm Damages” in Nature Climate Change. Volume 2, p. 205–209. 15
P. 9 WB (2012). “Turn Down the Heat: Why a 4oC Warmer World Must be Avoided,” World Bank
16 P. 34 WB (2012). “Turn Down the Heat: Why a 4
oC Warmer World Must be Avoided,” World Bank.

6
intense extreme weather events. Developing countries are especially vulnerable to these changes
because they are dependent on climate-sensitive sectors such as agriculture, fisheries, and forestry.
Much of their population lives in exposed locations and in economically precarious conditions. Rain-fed
agriculture, for instance, accounts for around 25 percent of GDP and 70 percent of employment in Sub-
Saharan Africa. Developing countries’ financial and institutional capacity to adapt is also limited.
Global Policy
Climate change is a global problem that has to be tackled by collective action at the global level. No
single country acting alone can resolve the problem of climate change, and uncoordinated action will be
much less efficient and effective than a coordinated international response. This section provides a brief
overview of the issues driving the international policy agenda. These issues are relevant to national
authorities as participants in international negotiations and as parties to international agreements. They
are also relevant to national authorities because the same issues will have to be dealt with at national
and local levels.
Policy makers have to determine whether to integrate climate change concerns into growth and
poverty reduction strategies, how much and when to invest in emissions reductions, and how much
and when to invest in adaptation. Choices between these policy options should be informed by relative
costs and benefits; integrated assessment models are used to undertake some of this analysis (Box B).
Due to the high levels of uncertainty surrounding climate change, such modeling is particularly sensitive
to assumptions. Nonetheless, the results are useful for assessing tradeoffs between policies and
identifying the most efficient solutions at a global level. On top of modeling, policymakers also need to
consider equity and justice when choosing policy options. Not only do industrialized countries bear a
greater moral responsibility for addressing the challenge of climate change, they also have a greater
capability for doing so. Considerations of equity and justice also arise across time. Today’s emissions
impose costs on future generations who will have to live with the consequences of environmental
damage, including reduced growth and the increased costs of climate change adaptation. Economic
analysis can help policy makers understand how different policy options will impact the distribution of
costs and benefits at a global level and between generations. They can also provide some understanding
of the levels of transfers needed to ensure a more efficient, equitable, and just distribution of costs.
The costs of inaction are high and will be borne disproportionately by developing countries. The Stern
Review17 argued that under a business-as-usual scenario, with no action taken to reduce emissions and
mitigate climate change, global warming of 2-3oC could cause a permanent loss of around five percent of
per capita consumption compared with what could have been achieved in a world without climate
change. Abrupt and much more extensive climate change at higher levels of global warming, at around
5-6oC, would lead to an average 5-10 percent loss in consumption, with poor countries suffering costs in
excess of 10 percent. Around 80 percent of the cost of climate change would fall on developing
countries (Stern 2007). The 2010 World Development Report cites integrated assessment model studies
17
Stern, Nicholas (2007). The Economics of Climate Change: the Stern Review. Cambridge University Press, Cambridge, UK.

7
Box B. Integrated Assessment Models
Integrated assessment models (IAMs) are used to generate scenarios at a global or regional level by simulating the interactions between complex climate and human systems. IAMs fall into four broad categories:
Welfare optimization models lay out a causal chain: production generates consumption and emissions; emissions in turn affect the climate, causing damages which reduce production. Models maximize the discounted value of future welfare by choosing the optimum level of emissions reductions in each time period.
General equilibrium models represent the economy as a set of linked economic sectors and factor markets. The model functions by finding a set of prices that satisfy supply and demand in all of these discrete markets simultaneously.
Simulation models set a predetermined amount of emissions that can be generated from production and then calculate the cost of mitigation and the cost of damages. There is no feedback between climate and economic dynamics.
Cost minimization models are typically used in a specific sector, such as energy. They model the interactions among technological choices, energy supply and demand, and emissions so as to identify the least-cost solution to achieve a particular emissions target.
IAMs can help inform decisions regarding the timing, design, and level of mitigation policies and their distributional consequences. However, IAMs are simulations, not forecasts, and the results depend on the underlying assumptions regarding discount rates, the causal relationships between parameters, and the pace of technological and institutional change. As such, outputs should be presented as a range rather than as a single number, in order to better represent the uncertainties associated with the estimate. Most models fail to take into account extreme, low probability climate impacts and so may lead decision makers to underestimate the risks of not taking mitigation action. Analysts have questioned whether the damage functions used to describe climate change impacts overestimate adaptation capacity, thereby underestimating residual damages and in turn discouraging early investment in mitigation. Concerns have also been raised that models generating regional scenarios fail to account for the vastly differenft levels of welfare between regions when optimizing welfare at a global level.
IAMs are less helpful in informing adaptation policy. Most models address adaptation through a damage function. This simply assumes the proportion of climate impact that will be addressed through adaptation and a residual amount of damage that arises because it is not possible to adapt or because it is uneconomical to do so. The damage function often cannot be adjusted as a policy variable, the rationale being that adaptation is a private decision and not something that policy makers can influence. Clearly, this is unrealistic because governments are actively engaged in adaptation and can influence private adaptation through a range of fiscal and regulatory instruments. More recent models have distinguished between a stock of adaptive capacity and a flow of adaptive action: this distinction is helpful in highlighting the adaptation deficit faced by many developing countries in terms of inadequate infrastructure, human capital, and social capital. These models highlight the need for substantial up-front investments in adaptive capacity development in the developing world in order to ameliorate impacts and reduce longer term adaptation action costs. However, the specification of the adaptation and residual damage functions remains rudimentary, failing to capture the complexity of adaptation choices at a sector level. Hence the models offer little useful guidance on the cost of adaptation.
IAM developers are continually improving model specification, adding spatial resolution and technical detail, and refining functions related to damages, technological change, and other factors. Commentators argue that greater effort also needs to be put into improving transparency and policy makers’ understanding of the functional capabilities of the models and their strengths and weaknesses, and in standardizing outputs so that results can be compared.
Sources: Ackerman, Frank et al. (2009). Limitations of Integrated Assessment Models of Climate Change; Agrawala, Shardul et al. (2010). Plan or React? Analysis of Adaptation Costs and Benefits Using Integrated Assessment Models; Patt, Anthony G. et al (2010). Adaptations in Integrated Assessment Modeling: Where Do We Stand?; Stanton, Elizabeth et al. (2008). Inside the Integrated Assessment Models: Four issues in Climate Economics.
8
that arrive at similar cost ranges and distributions, concluding that developing countries face 75-80
percent of the potential global damage from climate change. IAM estimations of the distribution of costs
among developing countries vary depending on model specification. The Stern Review concludes that
GDP losses in Asia and South Asia would be higher than in the rest of the world. A UNEP study concludes
that losses would be highest in Africa, possibly amounting to some 1.5-3 percent of GDP by 2030.18
The costs of mitigation to achieve the 2oC target are significant but affordable if action is taken now.
The Stern Review estimated the cost of achieving atmospheric concentrations of GHG consistent with
the 2oC target would be approximately one percent of GDP by 2050, arguing that this is a relatively
modest cost in relation to the cost of inaction. The World Bank’s World Development Report 2010 (WDR
2010) reviews a range of modeling exercises that suggest that the costs of mitigation efforts consistent
with a 2oC target would increase over time to accommodate growing populations, leading to increasing
energy costs, but the present value of mitigation would still fall within the range of 0.3-0.7 percent of
GDP.19 The OECD Environmental Outlook estimates that the pathway to stabilization at 450 CO2e ppm
would slow growth by around 0.2 percent a year, reducing GDP in 2050 by 4-6 percent depending on the
model used. That report notes that this falls within the -0.5 to 6 percent reduction of GDP range of
estimates reported by the IPCC and others. Delaying action significantly increases these costs, largely
because it will require more aggressive reductions in emissions at a later date to put emissions
reductions back on a GHG stabilization pathway. Delaying action to 2020–such as making no further
progress on emissions pledges or waiting for improved technologies before replacing aging equipment–
could increase the costs through to 2050 by as much as 50 percent.20
Carbon pricing, technological change, and curbs on deforestation are key elements of this emissions
reduction pathway. Carbon pricing creates market signals throughout the economy and incentives for
both producers and consumers to reduce emissions (see Chapter 1). An effective global carbon market,
coupled with carbon pricing, allows resources to flow to the lowest cost emissions reduction options.
Early introduction of carbon pricing, a global market, and a steadily increasing carbon price significantly
increase the prospects of reaching the 2oC target and reduce costs by improving efficiency. Carbon
pricing will encourage the adoption of energy-efficient, low-carbon technologies and shift demand to
low-carbon products whose relative price will fall. The pace of development and diffusion of these
technologies is a key determinant of the emissions reduction pathway in IAMs. Indeed, in some models
the availability of particular technologies (e.g., renewables and biomass energy carbon capture and
storage) is critical to achieving emissions reductions goals (see Box B and the discussion of modeling in
Chapter 1). Curbing emissions from agriculture and land-use change, which currently account for about
24 percent of total emissions,21 much of these associated with deforestation and the draining of
wetlands, will also make important contributions to GHG stabilization. Here too, IAMs suggest that there
is an important role for carbon pricing as an economic price for land-use emissions provides incentives
18
UNEP (2010). ADAPT Cost Project: Analysis of the Economic Costs of Climate Adaptation in Africa. 19
World Bank (2010). World Development Report 2010: Development and Climate Change. 20
Marchal, V. et al. (2012). OECD Environmental Outlook to 2050: The Costs of Inaction. Paris: Organization for Economic Cooperation and Development. 21
IPCC (2014). AR5: Mitigation - Summary for Policimakers.

9
to retain forest cover even in the face of rising food demand (as long as this is accompanied by increases
in agricultural productivity to help offset pressures to expand the cultivated area).22
Developing countries will have to make a significant contribution to global mitigation efforts if 2oC
warming is to be achieved, and they will need finance and access to technology to do so. The
participation of developing countries in global mitigation efforts makes sense from an economic
perspective: it broadens the range of mitigation opportunities available and enables emissions
reductions to occur wherever it is cheapest to do so. The World Development Report 2010 estimates
that, in order to achieve global emissions reductions targets of around 65-70 percent, emissions
reductions in developing countries will have to occur; furthermore, these countries will have to account
for 45-70 percent of mitigation investments in 2030. Postponing mitigation efforts in developing
countries until after 2030 would double the cost of achieving the 2oC target. Globally, the additional
investments needed in clean energy and energy efficiency, low-carbon transport, and forestry will
amount to $700 billion a year.23 Developing countries will need a large share of this financing, likely to
be at least $560 billion24 a year by 2030.
Developing countries will also face substantial adaptation costs in dealing with climate-change
impacts. Using the IAM approach (Box B), the UN Framework Convention on Climate Change (UNFCCC)
estimated the cost of adaptation at $49-171 billion a year by 2030, of which $27-66 billion would fall on
developing countries. By far the largest cost item identified was infrastructure, which accounts for about
three quarters of the needed investment. Other estimates cover the additional cost to economic
infrastructure, coastal protection, and measures against extreme weather events, as well as investments
in public sector capacity—these amount to $70-100 billion a year25 for the period 2010-2050. East Asia
and the Pacific would bear the highest adaptation costs, but Sub-Saharan Africa’s costs would be the
highest as a share of GDP.
International Agreements
The United Nations Framework Convention on Climate Change (UNFCCC) is the principal instrument
for framing this global collective action on climate change. Adopted in 1992 and coming into force in
1994, UNFCCC now has 196 Parties. The UNFCCC process directly impacts the work of national
authorities. It establishes a common framework for reporting on and planning the response to climate
change. It establishes some of the key global instruments for developing countries to access climate
change finance, it offers a forum for international collective action to address their needs and priorities,
and it provides a framework for the stabilization of greenhouse gas concentrations in accordance with
such principles as equity, common but differentiated responsibilities, and respective capabilities.
22
Izaurralde R.C., A.M. Thomson, J.A.Morgan, P.A.Fay, H.W.Polley and J.L Hatfield (2011). “Climate Impacts on Agriculture: Implications for Forage and Rangeland Production” in Agronomy Journal. Volume 103 No. 2, p. 371-381. 23
World Eeconomic Forum (2013). The Green Investment Report: The Ways and Means to Unlock Private Finance for Green Growth. 24
World Bank (2010). World Development Report: Development and Climate Change. Given continued progression along the current GHG trajectory, the updated estimate of developing country financing needs will likely be higher than 2010 estimates. 25
World Bank (2010). The Economics of Adaptation to Climate Change.
10
The Kyoto Protocol is an international agreement linked to the UNFCCC that commits its Annex I
Parties, which are developed countries, to internationally binding emissions reduction targets. The
developed countries are given a heavier burden under the principle of “common but differentiated
responsibilities”; this reflects the understanding that developed countries are principally responsible for
the current high levels of GHG emissions in the atmosphere.26 The Kyoto Protocol was adopted in 1997
when it was clear that Annex I countries would not meet their original UNFCCC emissions reduction
commitments. The Kyoto Convention’s implementation arrangements were agreed to in 2001 and the
convention came into force in 2005. Emissions targets were set for 37 industrialized countries and the
European Community with the goal of reducing overall emissions of such gases by at least five percent
below 1990 levels in the first commitment period (2008-2012). During the second commitment period,
Parties of a different composition from the first period committed to reducing GHG emissions by at least
18 percent below 1990 levels in the 8-year period from 2013-2020.
The protocol established three flexible mechanisms intended to improve the efficiency of emissions
reductions efforts. The first mechanism is a framework for joint implementation, whereby countries can
transfer or acquire emissions reductions in another Annex I country to count against their own
emissions reductions target. The second mechanism is the Clean Development Mechanism that allows
Annex I countries to finance projects that reduce emissions in non-Annex I countries and count the
certified emissions reductions from these projects against their emissions reduction targets (see Chapter
5). The third mechanism provides for emissions trading between Annex I countries so that countries
whose emissions are below their targets can sell emissions rights to other Annex I countries.
There are marked differences in the achievements of participating countries in the Kyoto Protocol.
The United States failed to ratify the Protocol, significantly reducing its emissions reductions potential
from the start. The economies in transition have achieved the largest emissions reductions relative to
their targets, largely due to the closure of heavy industrial plants over the last two decades (thereby
accumulating substantial unused emissions rights).27 At the end of 2012, most of the European Union
member states were on track toward the achievement of their individual targets, and the 15 pre-2004
EU member states were on track to meet their collective target of an eight percent reduction in
emissions in relation to the 1990 baseline. Ten member states have used the Kyoto Protocol’s flexible
mechanisms to acquire emissions reductions equivalent to about two percent of base-year emissions to
help meet their targets, with nine of these countries allocating a combined €2,890 million for that
purpose. Spain is planning large purchases of emissions rights to meet its targets; Italy is off the track
and has not yet announced plans to purchase emissions rights to make up its shortfall.28 New Zealand,
Canada, and Australia are also off the track in relation to their targets, with significant increases in
emissions, including land-use changes, of 60, 46, and 14 percent respectively over the period 1990-2011.
The Kyoto Protocol has not had the desired impact on global emissions growth (see Box C). Progress in
emissions reductions by Kyoto Protocol countries has been dwarfed by the growth in emissions from
26
For more details, visit http://unfccc.int/kyoto_protocol/items/2830.php. 27
UNFCCC (2012). National Greenhouse Gas Inventory Data for the Period 1990-2010. 28
European Environment Agency (2013). Trends and Projections in Europe 2013—Tracking Progress Towards Europe’s Climate and Energy Targets Until 2020.

11
non-Annex I countries. Some of this growth is a result of outsourcing of manufacturing activity from
developed to developing countries. This has allowed developed countries to increase their consumption-
based emissions while stabilizing or reducing emissions within their territorial boundaries. One recent
study estimates that increases in net emissions transfers via international trade from developing to
developed countries exceed Kyoto Protocol emissions reductions.29 At the same time, the Kyoto
Protocol has had an important role in mobilizing and channeling finance to developing countries and has
demonstrated the value of a rule-based system for global agreements.
Box C. The Emissions Gap
Current global GHG emissions are significantly higher than levels compatible with of the 1.5oC or 2
oC targets in
2020. UNEP estimates that global GHG emissions increased from 37 GtCO2e in 1990 to 45 GtCO2e in 2005, dropping off slightly in 2008 and 2009 due to the economic downturn and picking up again to reach 50 GtCO2e in 2010. In the absence of policy changes, global GHG emissions will increase to 59 GtCO2e by 2020. If current UNFCCC conditional and unconditional pledges are fully implemented, global GHG emissions in 2020 will still be 52-56GtCO2e per year. This compares with global GHG emissions of 44 GtCO2e in 2020 that UNEP considers as offering a likely chance of meeting the 2
oC target for global warming.
If emissions peak before 2020, UNEP projections suggest that the target for 2030 would have to be around 1990 levels, (i.e., 37 GtCO2e), with further reductions to 21 GtCO2e required by 2050. These lower levels of emissions would have to be achieved in a world with a population of around nine billion people and a world economy 3-4 times larger than today’s. This represents a significant cut in emissions per capita, from the current global average of seven tCO2e to around two tCO2, and reduction in ratio of GHG emissions to GDP to around one eighth of current levels.
Source: UNEP (2013). The Emissions Gap Report 2013.
Emissions targets have also fallen short of what is needed. The Copenhagen Accord, agreed to at COP
15 in 2009, set a firm target for international climate change mitigation efforts as an upper boundary of
2oC for the increase in global temperatures. Annex I countries committed to emissions reductions
targets for 2020, but European countries, together with Australia and New Zealand, responded with a
conditional offer to deepen emissions reductions to 2020 if all developed countries participated and
developing countries agreed to contribute in line with their “respective capabilities.” In the absence of a
broader agreement, participating countries’ commitment waned. In December 2011, immediately after
COP 17 in Durban, Canada announced its withdrawal from the Kyoto Protocol, arguing that Canada
could not justify the cost of implementation (estimated at C$13.6 billion) when major emitting countries
such as the United States and China were not party to the agreement (Kent 2011). Although the Kyoto
Protocol Parties still cover only 15 percent of global emissions, the protocol will continue to be in force
until 2020. Negotiations on a successor agreement are expected to conclude in 2015 and to come into
force in 2020. The crucial difference with this new agreement is that countries have agreed that it
should apply to all parties. As part of the new formulation, the concept of nationally determined
contributions—where countries put forward their emissions reductions and/or financing contribution
based on their circumstances—is being developed as part of the negotiations.
29
Peters, Glen P., Jan C. Minx, Christopher L. Weber and Ottomar Edenhofer (2011). “Growth in Emission Transfers via International Trade From 1990 to 2008” in Proceedings of the National Academy of Sciences. Volume 108 no. 21.
12
In terms of financing, it has been estimated that about $182 billion in annual financing30 for developing
countries has been directed toward mitigation and adaptation. The majority of this was actually
provided by developing countries themselves (domestic resources and South-South funding).
Governments of developed countries have provided $35-$49 billion through their bilateral financial
institutions and multilateral development banks (MDBs). The provision of resources under official
UNFCCC auspices has been modest. Bilateral aid agencies and the UN have provided $4-$11 billion.
Another $1.4 billion has been channeled through non-UN climate funds. One of the earliest UNFCCC
mechanisms to tackle climate change was The Global Environment Facility (GEF). The GEF focuses on
“the provision of financial resources on grant or concessional basis, including for the transfer of
technology” for a variety of global commons issues, including biodiversity and climate change. As of the
fifth GEF replenishment, the tally of commitments to climate change was $3.8 billion.31 The Least
Developed Countries Fund (LDCF) and the Special Climate Change Fund (SCCF) were established in 2003
and 2004 respectively to complement GEF with additional financing for adaptation. Financing from these
funds is modest relative to GEF–since their inception the LDCF has disbursed $133 million and the SCCF
has disbursed $111 million. The Adaptation Fund was established to finance projects and programs in
developing countries that are Parties to the Kyoto Protocol. The fund, established in 2001 but only
launched in 2007, is financed primarily via a two-percent levy on the issuance of certified emissions
reductions (CERs) under the Kyoto Protocol’s Clean Development Mechanisms from CER sales; the rest
comes from developed countries’ voluntary pledges. The latest fund to be established is the Green
Climate Fund, and it is the UNFCCC’s most ambitious and largest financing mechanism to date. It is
expected to channel most of the $100 billion in annual climate finance pledged under the Copenhagen
Accord of 2009. The fund will place equal emphasis on mitigation and adaptation, have the ability to
work alongside the public and private sectors, respond to country priorities, and involve more
stakeholders. The GCF is currently working to finalize its business model and aims to begin capitalization
in 2014.
UNFCCC has made further progress in adaptation with the establishment in 2013 of the Warsaw
International Mechanism for Loss and Damage (L&D). To promote the implementation of approaches
to address loss and damage associated with the adverse effects of climate change, the L&D mechanism
fulfills the function of enhancing knowledge and understanding of comprehensive risk management
approaches, including slow onset impacts. It also fulfills the function of strengthening dialogue,
coordination, coherence, and synergies among relevant stakeholders. Furthermore, the L&D mechanism
seeks to enhance action by facilitating finance, technology, and capacity building. The structure,
mandate, and effectiveness of the mechanism will be reviewed at COP 22 (November-December
2016).32
30
Climate Policy Initiative (CPI )(2013). The Global Landscape of Climate Finance. 31
GEF Independent Evaluation Office (2014). Fifth Overall Performance Study of the GEF. More information on GEF’s funding windows on Biodiversity and Desertification and other Rio Conventions can be found at http://unfccc.int/resource/docs/convkp/conveng.pdf. 32
For more information on the Warsaw International Mechanism for Loss and Damage, see http://unfccc.int/adaptation/workstreams/loss_and_damage/items/8134.php.

13
Climate Change and Development
Growth and poverty reduction are critical for an effective response to climate change, but they are
not sufficient; countries need to consider how they will begin to adapt to climate change today rather
than putting it off until tomorrow. Development strategies focused on achieving economic growth and
poverty reduction will increase resilience to climate change by building institutional and economic
capital. A healthy, well-educated, economically empowered population with access to diverse economic
opportunities and social protection will be better able to cope with the shocks and stresses of climate
change than a population that does not have these characteristics. However, economic growth and
poverty reduction are not sufficient in and of themselves to adequately respond to the threat of climate
change. Growth will not be sufficient to raise living standards to a point that countries will be able
absorb adverse impacts. Growth will not be equitable enough to ensure adequate protection for the
vulnerable. Failure to consider climate-change impacts will result in maladaptations that increase
vulnerability, such as locating infrastructure, settlements, and economic activity in areas that will be
drought- or flood-prone in the future. Failure to consider climate-change implications may lock-in high
carbon infrastructure (e.g., power supplies, transport systems, and urban design) that will continue to
produce high levels of emissions for much of the 21st century. Investments in vulnerability assessments
and adaptation planning today, however, can help reduce these risks and identify the specific
interventions needed to reduce exposure to climate change hazards and increase adaptive capacity.
While most of the stock of GHGs in the atmosphere was emitted by high-income countries, the largest
and rising share of new emissions now come from middle-income countries. As of 2005, industrialized
countries were responsible for about two-thirds of the world’s cumulative CO2 emissions from energy
since 1850; middle-income countries were responsible for about one-third; and low-income countries
contributed a negligible share. But middle-income countries are responsible for about half of new
emissions.33 This share continues to grow, with much of the increase occurring in the most dynamic
middle-income economies. Data from the EU Joint Research Center’s Emissions Database indicates that
China’s CO2 emissions almost quadrupled from 1990 to 2011; they are now at about the level of the U.S.
and the EU27 combined. In per capita terms, China’s emissions have increased from two tCO2 per capita
to just over seven tCO2, about the same as the EU27 average but still significantly lower than the per
capita consumption rates in the United States (17 tCO2) and Australia (19 tCO2). Other developing
countries have also seen massive increases in emissions. Emissions in India and Indonesia almost tripled
from 1990-2011, although per capita emissions are still extremely low (at two tCO2 or less), indicating
that there is significant potential demand for energy.34
Developing countries should consider opportunities for reducing the adverse environmental impacts
of their development paths. As the share of greenhouse gases emitted by non-Annex I countries
continues to increase, it is becoming more important that the developing countries fully commit to low-
carbon development. Reduction or prevention of pollution and protection of ecosystems such as forests
33
IPCC (2014). Fifth Assessment: Mitigation of Climate Change. 34
Olivier, Jos, Greet Janssens-Maenhout, Marilena Muntean, and Jeroen A.H.W. Peters. (2013). Trends in Global CO2 Emissions: 2013 Report. PBL Netherlands Environmental Assessment Agency, and Institute of Environment and Sustainability (IES) of the European Commission’s Joint Research Centre (JRC).

14
and wetlands reduces future clean-up costs and avoids damage that may be irreversible. Early
investments in low-carbon technology and infrastructure held avoid “locking in” an environmentally
destructive and potentially expensive long-term development path.
Low-carbon policies can generate economic co-benefits. For example, improvements in energy
efficiency and diversification can reduce dependence on imported fuels and vulnerability to volatile fuel
prices. Shifting from diesel and heavy fuel oil can lead to lower energy costs over the long-term.35
Governments may also increase fiscal capacity by reducing environmentally harmful and economically
wasteful expenditures (such as subsidies on fossil fuel consumption) or by addressing market failures
(such as urban congestion). They may also generate direct benefits through innovation and
improvements in production efficiency.36
Box D. The World Population Takes Climate Change Seriously and Wants Governments to Do More
Pew Research Center (2013), in a poll of 39 countries conducted in March-May 2013, found that a median of 54 percent of those surveyed cited global climate change as a major threat to their countries, putting it at the top of the list of items tested. Concern about global climate change is particularly prevalent in Latin America, Europe, Sub-Saharan Africa, and the Asia/Pacific region. In contrast, the U.S. population is relatively unconcerned about global climate change. Only 40 percent say that it poses a major threat to their country, one of the lowest levels among the 39 countries surveyed and on par with responses from China, Czech Republic, Jordan, Israel, Egypt, and Pakistan.
Source: Pew Research Center (2013). Climate Change and Financial Instability Seen as Top Global Threats.
Gallup (2010), in its 2009 Annual World Poll of more than 150 countries covering 95 percent of the world’s population, found that 60 percent of the world's adult population (15+) was aware of the climate change issue. Furthermore, of those who were aware, 58 percent said it is a result of human activity as opposed to natural causes. In addition, of those who are aware, 62 percent said that their government “is not doing enough to reduce emissions of gases released by motor vehicles and factories.” Results vary by region and among each the top five greenhouse gas-emitting countries, underscoring the challenges leaders face in reaching a global climate agreement.
Source: Anthony Leiserowitz and Lucy Michaels (2010). Yale Project on Climate Change. Yale Global Perspectives on Climate Change: Preliminary Findings from the Gallup World Poll.
35
Yépez-García, Rigoberto Ariel, and Julie Dana (2012). Mitigating Vulnerability to High and Volatile Oil Prices. World Bank. 36
World Bank (2012). Inclusive Green Growth. The Pathway to Sustainable Development.
15
Not only is there a clear development imperative for action to address the impacts of climate change,
but there is also growing public awareness of the need for governments to do so. While there are
surprising few international surveys of public opinion on climate change, those that are available point
to widespread awareness of the threat of climate change and a willingness to have governments take
action even if this has direct costs (see Box D). This creates an enabling environment for political leaders
faced with tradeoffs between climate change mitigation and adaptation and what some constituencies
may consider to be more immediate development priorities. Extreme weather events raise awareness
about climate change risks and create windows of opportunity for governments to act. Governments
can play an active role in raising awareness by involving stakeholders and the media in the policy
planning process. It is perhaps no accident that developing countries that favor greater government
intervention on climate change (Mexico, Japan, China, Vietnam, Indonesia and Bangladesh) all have high
profile climate-change strategies.
B. CLIMATE CHANGE PUBLIC EXPENDITURE AND INSTITUTIONAL REVIEWS: PURPOSE, ANALYTIC FRAMEWORK AND PROCESS
Purpose
Climate change adaptation and low-carbon development require proactive policies and government
planning. The purpose of public sector interventions is to provide information, incentives, and an
enabling environment for communities, households, and the private sector that encourages them to
change their behaviors, and their consumption and investment choices. This requires the use of a range
of policy levers: information, regulation, taxation, and public spending. Public expenditure is an
important part of this policy package.
Public expenditure and institutional reviews (PEIRs) evaluate and inform the alignment of public
spending with a country’s development needs and objectives. Over the last 15 years the World Bank
has undertaken over four hundred PEIRs to inform expenditure policy. Most reviews are published in
order to contribute to the policy debate among stakeholders and to identify how public expenditure can
more effectively support a country’s growth and poverty reductions objectives. Their scope and content
are agreed to the governments. Some PEIRs take a whole-of-government approach, addressing macro-
fiscal policy and resource allocation issues across the public sector. Others focus on a few priority
sectors. These include environmental expenditure reviews that assess how to improve the policy
alignment, efficiency, and effectiveness of public expenditures in achieving environmental policy
objectives.37
Climate change has only recently been identified as a specific area of focus for Public Expenditure and
Institutional Reviews. Bangladesh, Cambodia, Morocco, Nepal, the Philippines, Samoa, and Thailand are
among the countries that have pioneered Public Expenditure and Institutional Reviews on climate
change. Similar reviews are now underway in Indonesia and Vietnam. This sourcebook draws on the
37
Swanson, AuPhil and Leiv Lundethors (2003). Public Environmental Expenditure Reviews (PEERS) Experience and Emerging Practice. World Bank Environment Strategy Papers No. 7.

16
experience of these initial reviews, identifying methods and approaches used to tackle common
problems, including the classification of climate change expenditures (see Chapter 7).38
Climate Change Public Expenditure and Institutional Reviews are important for many reasons
including the following:
They contribute to an institutional and policy environment that is more aware of and more
responsive to climate change. They provide an opportunity to extend the policy dialogue on climate
change issues beyond the specialist environmental agencies by engaging central planning and
finance agencies and key line ministries in discussions of climate change policies and their fiscal
implications. They can also facilitate engagement with a broader range of stakeholders, providing an
opportunity for dialogue on climate change with the legislature, civil society, and external partners,
thereby mobilizing support and financing.
They support the development of a country’s climate change strategy. Expenditure reviews require
an assessment of the climate change impacts of current policies, and suggest how these can be
adjusted to better address climate change adaptation and sustainable development objectives. This
analysis can provide a starting point for the formulation of a climate change strategy.
They facilitate the integration of climate change policies into government plans and budgets. The
assessment of the financial implications of climate change policy provides a starting point for the
prioritization among alternative applications of scarce resources. This is particularly important
where a climate change strategy is in place and attention has to turn to implementation.
Expenditure reviews require an assessment of the alignment of resources with stated policy
objectives and the means by which these policy objectives will be achieved. This analysis can serve
as an input to the planning and budget process, contributing to the selection, prioritization, and
allocation of resources to expenditure programs.
They contribute to good governance. Public Expenditure and Institutional Reviews address the
institutional framework for climate change policy making and implementation, clarifying lines of
accountability for the achievement of policy objectives. An open, consultative PEIR process and
publication of key documents can promote transparency and participation in the policy process.
They help mobilize resources. An assessment of the alignment of public spending with climate
change policy objectives can provide the basis for adjustments in resource allocations. It can also
highlight policy objectives that require additional financing, inform government dialogue with
development partners on development assistance priorities, identify where external financing is
needed most, and highlight the strengths and weaknesses of the governance framework for climate
change financing (and how weaknesses can be addressed). This analysis can strengthen the
argument for budgetary support – the most flexible source form of external assistance – by
demonstrating how a government’s budget supports climate change policy objectives.
38
Mark Miller (2012). CCPEIRs in the Asia Pacific Region – What Have We Learnt. UNDP.

17
Analytic Framework
The basic analytic framework for Climate Change Public Expenditure and Institutional Reviews is the
same as would be used in the review of any other policy issue. This framework comprises an
assessment of six key dimensions of public expenditure: (1) fiscal sustainability; (2) strategic resource
allocation; (3) the role of government; (4) the efficiency and effectiveness of spending; (5) the incidence
of spending; and (6) the capability of institutions and the alignment of incentives (see Box E). This
framework tests the consistency between intended and actual outcomes (i.e., the economic, social, and
environmental impacts) of public expenditure policies. It recognizes that there are tradeoffs among
policy objectives; (e.g., increased spending on public services, reduced taxation, and aggregate fiscal
discipline). It also acknowledges that policy objectives may be achieved using a range of instruments, by
providing information, through regulation and taxation, as well as through public expenditure, and that
public expenditure may not be the most cost-effective means of achieving these objectives.
Box E. Analytical Framework for Public Expenditure Reviews
Fiscal sustainability tests whether the aggregate level of public spending and deficits is consistent with a sustainable medium-term macroeconomic framework yielding a sustainable deficit and level of public debt. This assessment requires a broad definition of public spending, since fiscal imbalances may arise within the central government, autonomous agencies, and/or other levels of government. It also requires an understanding of macroeconomics and other risks and their potential fiscal impacts.
The strategic allocation of resources tests whether the allocation of resources within and across sectors, and other categories of expenditures, maximize social welfare. Given the government's role in translating society's preferences into public policy, this assessment should also determine whether current and planned expenditures are aligned with the government's stated policy objectives.
The role of government assesses whether the public sector complements rather than substitutes for the private sector in generating desired social outcomes. Government intervention may be justified in cases of market failures, which may occur for a number of reasons: with public goods, externalities, natural monopolies, and asymmetrical information. The appropriate public sector response—distinguishing public provisions, financing, or regulations—and the level of public spending will depend on the type and degree of market failure that the public sector seeks to correct.
Efficiency and effectiveness tests the relationship between government expenditures and the intended outputs in terms of goods and services (efficiency) as well as the impact of expenditures in terms of changes in social welfare (effectiveness). This entails an assessment of the inputs, means, and arrangements for the delivery of public goods and services and an assessment of whether these provide value for money.
Incidence assesses how the costs and benefits arising from public policies are distributed across society. This analysis may consider the distribution of costs and benefits between categories defined in terms of income, gender, ethnicity, region, or other policy-relevant characteristic.
The institutional assessment examines whether and how the institutional framework and incentive structure deliver aggregate fiscal discipline, strategic allocation of resources, efficiency and equity in the composition of spending, and technical efficiency in the use of budgeted resources.
Source: Pradhan, Sanjay (1996). Evaluating Public Spending. A Framework for Public Expenditure Reviews. World Bank Discussion Papers 323.

18
Building on this framework, this Sourcebook focuses on the distinct challenges facing Climate Change
Public Expenditure Reviews. Five challenges stand out: uncertainty with regard to climate change
impacts; the extended time horizon over which climate change impacts will unfold; the distributional
consequences of climate change; managing the unintended consequences of policies; the extent to
which international agreements will shape national policy and planning processes; and the need to put
in place adequate institutional arrangements.
Climate change policy is confronted as a “cascade of uncertainties” that preclude prediction of the
precise nature and timing of climate change impacts. Uncertainties regarding the impact of increased
concentrations of anthropogenic greenhouse gases on global climate are very high; indeed, estimates
from different models vary significantly, covering a wide range of climate forecasts. This uncertainty if
compounded when climatic models are downscaled to the regional or country level. It is further
compounded by uncertainties regarding the impact of climate change on ecosystems, society, and the
economy. A necessary part of the response to this uncertainty is to retain flexibility and provide regular
feedback so that institutions and policies can adapt to changing circumstances. Climate Change Public
Expenditure and Institutional Reviews will need to take this uncertainty into account and identify
opportunities to build flexibility and learning into institutional and policy responses.
The extended timeframe for action on climate change contrasts with the short-term imperatives of
political and electoral cycles and the limited horizons of typical planning instruments. This requires
CCPEIRs to take a longer time perspective than would normally be the case. Policy continuity is a
prerequisite if households and the private sector are to undertake investments that will only generate
benefits far in the future. However, policy continuity is difficult to achieve; so too is convincing
stakeholders that it will be sustained over the long term. Climate Change Public Expenditure Reviews
will need to consider how governments can retain flexibility while at the same time providing some
assurance that policy initiatives will not be reversed. The Reviews will also have to address issues of
intergenerational equity and tradeoffs between the immediate improvements in welfare and adaptation
and future mitigation; doing so will help to identify interventions that can address both development
and climate-change priorities and inform policy decisions regarding the selection and timing of
investments in adaptation and mitigation.
There will be climate change winners and losers, and these distributional consequences will impact
the political feasibility of policies. Climate change will not impact on all households, communities,
businesses, or regions in the same way. The policies required to mitigate (such as shifting to low-carbon
development strategies) and to adapt (such as adjustments in regional development and production
models) will also have distributional consequences. These distributional consequences lie at the heart of
the global response to climate change. Since the costs of climate change mitigation are borne by
national economies but the benefits are distributed globally, as a global public good, international
agreements, regulations, and financial incentives are needed to encourage national authorities to take
action. Similarly, national authorities may have to intervene to manage the distributional consequences
of climate change and to create the political environment to enable action on climate change mitigation
19
and adaptation. CCPEIRs should inform this analysis, identifying distributional consequences of policy
interventions and the means by which these can be addressed.
While Climate Change Public Expenditure and Institutional Reviews will inevitably focus on policies
that have mitigation and adaptation objectives, it is important to consider the climate change impacts
of public policy as a whole. This is true for both climate change mitigation and climate change
adaptation. Where there are subsidies for fossil fuel consumption, for instance, removal of these
subsidies is likely to be a more cost-effective means of achieving mitigation objectives than proactive
interventions (such as feed-in tariffs and subsidies for renewable energy). The CCPEIRs provide a
framework for assessing the relative merits of alternative policy interventions for achieving climate-
change objectives. Similarly, CCPEIRs will need to consider the implications of climate change for major
public investments and policy interventions. For example, it is important to identify ”lock-ins,”
interventions that will encourage stakeholders to make decisions that reduce their ability to adapt (e.g.,
development of flood-prone areas, or irrigation in areas that are likely to suffer increasing water
scarcity). While it may not be possible to avoid lock-ins, or economically desirable to do so, the potential
consequences of these interventions need to be clearly flagged for decision makers.
International agreements will play an important role in shaping climate change policies and planning
processes. Transfers of resources from industrialized countries to assist developing countries respond to
climate change will be an important part of this international response. The CCPEIRs should help
decision makers determine how to optimize potential resource flows. The longer-term international
response to climate change may entail both carrots (financing, technology transfers, and trade) and
sticks (market access, conditional transfers) that impact on developing countries. The CCPEIRs provide
an opportunity to assess the implications of the emerging international climate-change architecture for
national policy. An important part of this architecture is the structure of reporting and planning
instruments mandated under the UNFCCC. Given the considerable investment of time and resources in
complying with UNFCCC requirements, these instruments will have a significant influence on national
planning processes; hence, they need to be taken into account in CCPEIRs.
Finally, institutional issues are likely to figure prominently in Climate Change Public Expenditure and
Institutional Reviews. This is particularly true in the early years of planning for a national response to
climate change, when institutional arrangements are still evolving. Institutions are important because
they determine the extent to which climate change vulnerabilities are reflected in policy and how
policies are translated into development outcomes. The climate change literature acknowledges this,
placing considerable emphasis on “mainstreaming” and “integrating” of climate change in the decision-
making process. This addresses concerns that, in the absence of specific institutional arrangements,
climate change will not be given the necessary consideration in decision making and that institutions
simply pay lip service to climate change policy objectives. These are not unique challenges to the climate

20
change agenda. Indeed there has been a long debate on how to approach the integration of
environmental policy and the reasons behind the limited success in doing so.39
This Sourcebook proposes a diagnostic approach to climate-change-related institutional issues,
encouraging CCPEIRs to assess the capability of institutions and to identify how this capability can be
strengthened. This is in marked contrast to much of the literature, which advocates for conceptual
frameworks and specific methods for mainstreaming or integrating climate change in development and
project planning.40 The diagnostic approach focuses attention on the functional outcomes that
stakeholders are trying to achieve and the intended and unintended outcomes that are actually
delivered by institutions. Political economy analysis can be used to inform this analysis, identifying
incentives that are driving institutional behaviors and outcomes. The approach also engages
stakeholders in the identification of possible solutions. The CCPEIRs will typically provide both an
assessment of the strengths and weaknesses of the current institutional framework and suggest
alternatives that are likely to be “best fit”–rather than best practice –for the incentive environment.41
Process
Public Expenditure and Institutional Reviews are best approached as part of a policy and planning
process. These reviews are intended to inform expenditure policy decisions by national authorities,
typically by central finance and planning agencies but also by sector agencies involved in policy
implementation and their financing partners. Recognizing the importance of expenditure analysis in
informing policy, many OECD countries have institutionalized the expenditure review process by
conducting periodic reviews as part of their planning and budget processes. Some developing countries
(notably Brazil) have also expressed interest in this approach. The majority of developing countries,
however, undertake public expenditure reviews in collaboration with development partners. In this
context, particular attention has to be taken in the design of the review process to ensure that it
provides the information needed by decision makers and that it supports the decision-making process.
Decisions for the expenditure review process have to be made early on objectives, scope, interaction
with planning, and budget decision points, and the stakeholders involved. These considerations are
reviewed below, drawing on the experience gained from the implementation of public expenditure
reviews in other areas of public policy, as well as from the first CCPEIRs. The objectives of the
expenditure review process will depend on the intended audience, the climate change policy agenda,
and the stage in the policy and planning process. CCPEIRs may be used to support periodic strategic
planning exercises or the annual budget process. Where the government has yet to define a climate
change strategy, the expenditure review process will likely require first taking stock of policies and
39
See Dalal-Clayton, Barry and Steve Bass (2009). The Challenges of Environmental Mainstreaming: Experience of Integrating Environment into Development Institutions and Decisions, International Institute for Environment and Development. 40
For a guide to mainstreaming in development planning see: UNDP-UNEP (2011) .Mainstreaming Climate Change Adaptation into Development Planning: A Guide for Practitioners. For a guide to mainstreaming at the project level see a series of eight Guidance Notes under World Bank (2011) . Mainstreaming Adaptation to Climate Change in Agriculture and Natural Resources Management Projects. 41
World Bank (2012) The World Bank’s Approach to Public Sector Management 2011-2020: Better Results from Public Sector Institutions.

21
expenditures in order to assess their climate change impacts. Where the government already has a
climate change strategy, the expenditure will likely address resource allocation issues and
implementation challenges.
Reviews can take either a whole-of-government approach or focus on specific sectors, programs, and
expenditures. A whole-of-government approach entails an analysis of all public expenditures,
encompassing ministries, departments, agencies, and autonomous bodies and whether or not each has
climate change adaptation or mitigation objectives. The purpose of this analysis is to identify which
entities, programs, and expenditures have climate change impacts and distinguish those whose impacts
are supportive of climate change adaptation and mitigation objectives (i.e., “green expenditures”) and
which are detrimental (i.e., “dirty expenditures”). Expenditure reviews that focus on specific sectors or
programs are likely to ignore these distinctions, addressing only programs that have explicit climate
change objectives. The advantage of this approach lies in the greater depth of analysis that is possible
where there is a limited range of programs under review.
Participation by the central finance and planning agencies is critical. Their support is needed for
climate change issues to be taken seriously across government and to influence expenditure decisions
throughout the budget. While the central finance agencies will typically defer to specialist
environmental and climate change agencies on technical issues, the central finance agencies should take
the lead on cross-governmental policies and be empowered to require agencies to address these
policies in their sectoral plans, budgets, programs, and projects. Their involvement throughout the
Climate Change Public Expenditure and Institutional Review process and, even better, their leadership of
the process, will help develop a sense of ownership of the climate change agenda, the expenditure
review, and the recommendations for action.
Ideally this participation should extend beyond the strategic orientation for the Climate Change Public
Expenditure and Institutional Review exercise – defining key issues of scope and process – to active
involvement in the analysis and development of recommendations. The participation of central finance
agency officials in gathering and analyzing expenditure data alongside colleagues from the relevant
environmental and sectoral agencies helps to build ownership, to strengthen the credibility of findings,
and to build capacity so that the review process can be repeated as part of the government’s own
planning and evaluation processes. The extent to which this is possible will often depend on timing
(reviews conducted during the budget process or planning process will compete with more pressing
tasks) and the availability of staff working on policy-related issues. The identification of counterpart
staff, the clarification of expectations regarding everyone’s role in the expenditure review, and the
provision of training and technical assistance to help people fulfill their roles, are issues that should be
addressed at the design or concept review stage.
The participation of a wide range of external stakeholders in the Climate Change Public Expenditure
and Institutional Review process should be encouraged. Key stakeholders include specialist climate
change agencies and commissions; legislatures and other oversight institutions (such as auditing
agencies) that have a role in the approval and monitoring of public spending; scientific and academic
22
institutions with an interest in climate change; and nongovernmental organizations working on climate
change, the environment, and broader development issues. The nature of stakeholder participation
should be agreed upon and communicated to everyone involved in order to manage expectations. The
extent of external stakeholder participation may run the gamut from the preparation of background
papers, to consultations at the outset of the review process to help set direction, to consultations on
findings and recommendations, to more formal participation in a decision-making group overseeing the
CCPEIR exercise.
C. SOURCEBOOK SCOPE AND STRUCTURE
This Sourcebook is divided into seven chapters (following the Introduction). Each chapter opens with a
chapter summary. The aim is to provide a broad overview of the climate-change-related issues that
analysts should consider as part of a CCPEIR process. The relative importance and relevance of these
themes will depend on the country context. Key considerations include the nature of climate change
impacts that a country faces, its international commitments, and the government’s proposed policy
response.
Policy
Chapter 1 explores how climate change can be integrated into a broader policy framework that
addresses development goals. It recognizes that growth and poverty reduction are generally a
government’s primary concerns and that climate change will have to be addressed as part of a strategy
for inclusive growth. There are distinct challenges in the treatment of adaptation and mitigation
policies. Policy makers have to determine whether to integrate climate change concerns into growth
and development strategies, how much and when to invest in emissions reduction, and how much and
when to invest in adaptation. In translating broad objectives on climate action to the particulars of
policy, governments would do well to depend on country-specific analysis even if, in many cases,
decisions are based on other countries’ prior experience or simply on expert judgment.
In line with the principle that all countries need to commit to containing emissions, countries need to
determine their own emissions reduction path since sources of GHG emissions vary between
countries. At the same time, countries need to make their economies more resilient to a changing
climate. A primary question for policy makers is the likely impacts on growth, employment, fiscal
balances, trade flows, and other key economic variables. Low carbon and resiliency planning requires
assessment of the impact of policies on GHG emissions, the likely costs of abatement, and the
appropriate response to a changing climate. Two broad approaches can be used to assess these impacts:
bottom-up, which analyses impacts related to specific technologies and sectors, and top-down, which
uses economic modeling to assess the impact of policies through effects on supply and demand.
Chapter 1 discusses several mitigation challenges (energy pricing and energy subsidies, carbon pricing,
and adoption of low-carbon technologies) and such adaptation challenges as public investment,
private sector action, and the role of local government:
23
Energy subsidies distort the economy, damage the environment, and hurt the poor. While
economists have long recognized the adverse fiscal, economic, and environmental impacts of poorly
performing energy subsidies, reform has gained urgency in the context of international efforts to
tackle climate change. The environmental rationale for energy subsidy reform lies in its contribution
to reducing local air pollution and GHG emissions. The rationale from a fiscal perspective is that
subsidy reform facilitates fiscal management and frees resources for more productive uses.
Carbon pricing is the most efficient and potentially most effective mitigation policy instrument.
Carbon pricing forces producers and consumers to internalize some of the costs of environmental
damage caused by the emissions they generate. This creates market signals throughout the
economy and incentives for reductions in emissions. Carbon pricing can be introduced using a
carbon tax or a cap-and-trade scheme.
Clean technology innovation is concentrated in developed economies and a handful of emerging
markets. Technologies are typically deployed in high-income countries first and then diffused
through trade, foreign direct investment and licensing agreements. Developing countries can
accelerate the adoption of low carbon technologies using supportive policies and combining supply
and demand side interventions with regulatory, market-based and fiscal policy instruments.
In most countries, responsibility for climate change mitigation and adaptation is spread across
national, regional and local governments. Regional and local governments can take a lead,
developing climate change policy initiatives in their own right. They can play an important role in
adapting national policy to regional and local conditions. The challenge for national government is
to establish an institutional framework that enables multi-level government to address climate
change mitigation and adaptation effectively.
Planning
Chapter 2 provides a framework for assessing the extent to which core policy and planning systems
adequately address climate change risks and translate climate change policy goals into development
outcomes. The international architecture for climate change reporting and planning established under
the UN Framework Convention on Climate Change provides the starting point for this analysis. This
architecture comprises four key instruments: National Communications; National Inventories (which are
integrated into Communications); National Adaptation Programs of Action and their successor, National
Adaptation Plans; and Nationally Appropriate Mitigation Actions and the emerging practice of Low
Carbon Development Strategies. Preparation of these instruments requires a substantial effort on the
part of national authorities. Where developed primarily to comply with international commitments they
have had limited impact on decision making at a national level. In order to address this concern, the
consensus is now shifting toward the integration of the UNFCCC into national planning routines and
national planning documents. Nonetheless, UNFCCC guidelines and the technical assistance provided to
support UNFCCC processes are likely to play an important role in shaping national adaptation and
mitigation strategies and the way in which they are presented.
The development of a national capability for response to climate change is essential for effective
adaptation. This requires capabilities to assess risks and identify vulnerabilities to climate change;

24
reconcile these risks and vulnerabilities with development objectives; formulate appropriate policy
responses and translate these into action; engage the relevant stakeholders and influence their
behaviors; and mobilize and effectively deploy the resources needed for climate change mitigation and
adaptation. The appropriate institutional framework for this capability will depend on the country
context. Considerations should include the nature of climate change risks and vulnerabilities, the
configuration of existing development policy and planning processes, international commitments, and a
country’s level of development.
Decision Making
Chapter 3 reviews the analytical tools and processes that inform and guide the allocation of scarce
resources among competing policies, programs, and projects. CCPEIRs have to determine whether the
decision-making processes within government address the challenge of climate change and explore how
this dimension of adaptive capability can be strengthened. Three analytical approaches—multi-criteria
analysis, cost-effectiveness analysis; and cost-benefit analysis—are commonly used to support climate
change decision making. These approaches are not mutually exclusive; some central finance and
planning agencies use a combination of these tools in their formal appraisal process. The chapter
reviews the adaptations in these techniques that are needed to address the specific challenges of
climate change.
Uncertainty regarding future climate conditions presents a particular challenge for decision making.
Decision makers can no longer assume that the past and the present—the sources of data on which
decisions are made—are a reasonable guide to future conditions. The academic literature points to risk
management, robust decision making, and real options as specific techniques that can be used in
conjunction with traditional cost-benefit analysis to help address this uncertain future. Practical
applications of these techniques can be costly, data intensive and technically complex. The Chapter 3
reviews applications in developing country contexts. The most promising appear to be the ones that
stress flexibility in the face of uncertainty. The challenge for the public sector is to incorporate
uncertainty, flexibility, and learning into routine decision-making processes. The chapter concludes with
a discussion of a stylized decision-making process that addresses climate change uncertainty.
Disaster Risk Management
Chapter 4 addresses the role of central finance and planning agencies in disaster risk management.
Developing countries are particularly vulnerable to natural hazards, and climate change will increase
their exposure. The economic cost of disasters is significant and will increase as countries develop. Until
recently, disasters were treated as unforeseen, exogenous shocks by governments and development
agencies and the attention was focused on disaster response and recovery. However, natural hazards
are common and recurring events. While the timing and scale of individual disasters may be
unpredictable, decision makers can anticipate their impacts. Armed with this knowledge, governments
can plan ahead. They can choose how much risk to reduce, how much risk to transfer to markets, and
how much risk to retain. CCPEIRs provide an opportunity to incorporate this risk management approach
in expenditure policy.

25
The chapter advocates a systematic, comprehensive approach to disaster risk management. Drawing
on the framework developed by the Global Fund on Disaster Reduction and Reduction (GFDRR), the key
elements of this framework include risk identification, risk reduction, preparedness, financial protection,
and resilient reconstruction. The chapter explores how practitioners can assess the adequacy of disaster
risk management arrangements and identify how their response strategies can be strengthened.
Development of disaster risk management capacity is an integral part of the response to climate change.
Indeed, measures to reduce vulnerability to climatic hazards feature prominently in most countries’
climate change adaptation strategies. These measures often entail engineering solutions such as flood
defenses. The chapter demonstrates that effective risk management must include measures to reduce
risk exposure (such as through land use zoning and regulation) as well as a range of protective measures
and the development of capacity for effective disaster response.
The chapter also focuses on the financial management dimensions of this disaster risk management
strategy. The purpose of a financial risk management strategy is to ensure timely, cost-effective access
to the funds needed for post-disaster response, recovery, and reconstruction while simultaneously
sustaining ongoing government programs. Successful financial strategies match disaster risks with the
appropriate financing instruments so that the cost of financing is minimized and the timing of finance
mobilization is optimized. The chapter argues for a three-layer approach which uses contingency
budgets to finance the first layer of risk (for low impact, low frequent disasters); budget reallocation,
borrowing, and contingent credit for the intermediate layer of risks; and risk-transfer mechanisms to
pass on high-risks via reinsurance and capital markets. Finally, the chapter examines the institutional
arrangements that facilitate timely post-disaster response and recovery and strengthen accountability.
International Public Climate Finance
Chapter 5 provides an overview of the emerging trends in international public climate finance and
their implications for policy and institutional arrangements in developing countries. It provides an
overview of the international architecture for public climate finance, the distinguishing mechanisms
established under UNFCCC, climate finance from multilateral and bilateral sources, and general
development financing with climate change elements (climate-related development assistance).
Market-based instruments are also discussed, including mechanisms established under UNFCCC and
carbon markets and payments for environmental services. The chapter also addresses the implications
of the emerging international architecture on developing countries’ policies and the institutional
arrangements they are creating to manage climate change finance.
National authorities will need to be proactive if they are to mobilize international climate finance
resources. Climate change policies, plans, and projects, and instruments such as Climate Change Public
Expenditure Reviews, contribute to a context conducive to the mobilization of official sources of climate
change finance. The real challenge lies in mobilizing private capital, and this chapter looks at some of the
strategies to do this. These start with a favorable investment climate and a policy environment that
supports investments in mitigation activities in energy, transport, industry, and agriculture.
Governments can also facilitate investment by direct interventions, providing institutional support for
private investors as they go through the process, for instance, of accessing climate finance and certifying

26
emissions reductions. CCPEIRs provide an opportunity to assess the effectiveness of the institutional
framework for mobilizing climate change financing and to identify measures that may strengthen this
capability.
Financial Management
Chapter 6 reviews budget and expenditure planning processes and identifies the entry points for
climate change policy. It also highlights the difficulties that policy makers are likely to encounter in
shifting resources in support of emerging policy objectives (such as climate change) and shows how a
medium-term expenditure planning perspective and a strengthened budget review process can help
address these difficulties. The chapter also discusses how many, if not most, of the expenditure
decisions that impact on climate change are made outside of the budget and expenditure planning
process. These typically include externally financed expenditures (both from development assistance
and climate change financing sources); mandatory expenditures; expenditures made by autonomous
entities, state-owned enterprises, and local governments; and off-budget expenditures related to quasi-
fiscal operations, government guarantees, and taxes. The chapter provides design recommendations for
increased efficiency of National Climate Change Funds and provides a brief review of climate change
auditing.
The budget process discussed in this chapter combines a top-down, whole-of-government policy
framework led by central finance and planning agencies with a bottom-up process of expenditure
planning by spending agencies. During the budget process, central finance and planning agencies
pursue government-wide policy objectives, including expenditure constraints, while spending agencies
seek to maximize the resources available for agency-specific policy and institutional objectives. A key
challenge in this process is that climate change mitigation and adaptation, unlike many other policy
objectives, has no single institutional advocate. Spending agencies, for example, may pursue climate
change policies where these are aligned with agency objectives and interests; environmental agencies
may serve as advocates for mitigation, but they lack effective levers to influence other spending
agencies’ resource allocation decisions. Engagement by central finance and planning agencies is thus
essential if climate change policies are to be reflected in budgets. If central finance and planning
agencies are to scale-up climate change expenditures, they have to create incentives for spending
agencies to align both ongoing and new programs and projects with the government’s climate change
objectives. Earmarks, allocation targets, and virtual funds can create such incentives.
Many public sector resource allocation decisions that are relevant to climate change are made outside
of the budget process. These typically include externally financed expenditures, both from development
assistance and climate change finance; mandatory expenditures; expenditures of autonomous entities,
state-owned enterprises, and local government; and off-budget expenditures related to quasi-fiscal
operations, government guarantees, and taxes. The challenge for central finance and planning agencies
is first and foremost to track and report on these expenditures, ideally in budget documentation. Off-
budget expenditures, such as quasi-fiscal operations, government guarantees, and taxes, allow
governments to subsidize activities without revealing their costs and naming the beneficiaries. The lack
of transparency around off-budget expenditures increases fiscal risks and leads to policies whose fiscal

27
impact will only be felt later, when quasi-fiscal operations have to be covered by government, when
taxes are due, and when guarantees are called. Solutions lie in making these subsidies explicit.
Classifications of Climate-Related Expenditures
Chapter 7 identifies four purposes for climate-change-expenditure classifications: to generate
statistics; to guide the allocation of resources; to evaluate the climate change impact of public
expenditures; and to track climate change expenditures. Determining and classifying which on-budget
and off-budget expenditures are climate-related is an important step in any CCPEIR. This determination
is a necessary first step. This step is complicated, however, because there is no readily available
classification for climate change expenditures as they relate to on-budget and off-budget spending; as a
result, analysts and policy makers have to formulate and apply their own criteria in determining which
budget items and off-budget spending can be labeled “climate-related.” The System of Environmental-
Economic Accounting (SEEA) provides a statistical framework for the classification and reporting of
environmental activities, products, expenditures, and other transactions. SEEA applies the accounting
concepts, structures, rules, and principles of the System of National Accounts; as such, it is fully
compatible with economic data generated for national accounting purposes. This includes the functional
and economic classifications of government financial statistics. Adopted in 2012, SEEA will be
implemented progressively by all national authorities. The World Bank actively supports the adoption of
SEEA by national statistics authorities.
The budget process can be used to tag climate-change-relevant expenditure items and to track actual
expenditures. Some developing countries are starting to code and track actual climate-change-related
expenditures at the national level. There is an inevitable degree of subjectivity, however, in defining
how relevant different expenditures are to climate change. While there are different quantitative
estimates of climate-relevant spending as a proportion of total expenditure and GDP, the data have
limitations for the purpose of cross-country comparisons. Countries may take reference from the
ongoing work to harmonize the classification of climate finance as led by OECD and multi-lateral
development banks.
Determining off-budget climate expenditures is particularly difficult. They can take different forms, the
most common being subsidies to public enterprises, credits provided by government, government
guarantees, and subsidies routed through the tax system. There are various definitions of subsidies. For
conceptual purposes, it is helpful to take a broad view and consider subsidies as interventions that result
in the provision of goods at a price below the opportunity cost. Subsidies are financed through various
channels that are often not captured in government budgets and financial statements. Explicit subsidies
that are direct budgetary payments (e.g., those made though budgeting) are relatively straightforward.
Guarantees will only be captured in most countries if there is a specific registry in place. Implicit
subsidies and tax expenditures are the most difficult to track. Implicit subsidies occur, for example,
when a state-owned enterprise or other entity absorbs the cost of providing energy at lower than
market prices. Governments also finance subsidies through preferential tax treatment, such as by
applying taxes rates that are lower than the prevailing rates and through the use of tax credits.

28
CHAPTER 1. POLICY
1.1. CHAPTER SUMMARY
Developing countries face a myriad of development challenges. Climate action adds to the list, but not
simply as an additional objective as it sets up substantial and difficult-to-value tradeoffs between today
and the future. Climate action constitutes, to a great extent, either a global public good (in the case of
mitigation) or a national public good (in the case of most adaptation activities); as a result, government
action is needed to supplement (and sometimes to counter) private sector action on climate change.
Policy makers have to determine whether to integrate climate change concerns into growth and
development strategies, how much and when to invest in emissions reduction, and how much and when
to invest in adaptation. In translating broad objectives on climate action to the particulars of policy,
governments would do well to depend on country-specific analysis even if, in many circumstances,
decisions are made based on other countries’ prior experience or simply on expert judgment.
In line with the principle that all countries need to commit to containing emissions, countries need to
determine their own emissions reduction paths since sources of GHG emissions vary among countries.
Countries also need to make their economies more resilient to a changing climate. As for any set of
policies, a primary question for policymakers is the likely impacts on growth, employment, fiscal
balances, trade flows, and other key economic variables. Early movers on mitigation action face risks to
competitiveness. For energy-intensive trade-exposed sectors, for example, a key problem is their limited
ability to pass along any input price increases associated with a carbon tax. In addition, the financing
needs for low-carbon and resilient development are higher, and may be significantly higher than for
conventional development. Understanding and addressing the distributional impacts of climate action
within countries is critical to success.
Mitigation actions have local co-benefits in addition to their direct global benefit of reducing
greenhouse gas emissions. Understanding these co-benefits can help create incentives for the
government to implement mitigation actions, which could otherwise be viewed as costly expenditures
for global good with no national gain and also as investments in the future, with all benefits captured by
future generations while costs are absorbed by existing local populations. The co-benefits of mitigation
actions include a wide range of positive local outcomes, such as reduced particulate matter pollution
and improved health, increased energy security, technological innovation and related growth, higher
efficiency in sectors with high mitigation potential, improved rural living standards, reduced traffic
congestion, and increased road safety.
Low carbon and resiliency planning requires an assessment of the impact of policies on GHG
emissions, the likely costs of abatement, and the appropriate response to a changing climate. Two
broad approaches can be used to assess these impacts: (1) ‘bottom-up’, which analyses impacts related
to specific technologies and sectors; and (2) ‘top-down’, which uses economic modeling to assess the
impact of policies through effects on supply and demand across multiple markets. Top-down models are
able to capture the relationships and interconnections among major economic variables considering the
overall economic system. The most common tool is Computable General Equilibrium (CGE) models
29
which are widely employed to analyze the aggregated welfare and ex-ante distributional impact of
policy. Assessments of the economic impacts of climate change and adaptation policies is very complex
and inclusion of both economic and climate change variables, as well as their interactions, in the models
increases the complexity.
Energy subsidies are widespread and, in some of the developing countries, constitute 20 percent or
more of government revenues. These subsidies, while in many cases originated based on good
intentions (poverty reduction, environmental sustainability, and energy security) are distorting for the
economy, damaging for the environment and harmful to the poor (because governments spend on
subsidies at the expense of other programs). While economists have long recognized the adverse fiscal,
economic and environmental impacts of poorly performing energy subsidies, reform has gained urgency
in the context of international efforts to tackle climate change. The environmental rationale for energy
subsidy reform lies in its contribution to reducing local air pollution and GHG emissions. The rationale
from a fiscal perspective lies in the fact that subsidy reform facilitates fiscal management and frees
resources for more productive uses. The economic rationale lies in the fact that energy subsidy reform
stimulates growth and improves competiveness, although short-term impacts on prices do need to be
managed; it also reduces inequitable transfers to better-off households who are the largest energy
consumers. Compensatory measures will be needed to ensure that the reforms do not adversely affect
the poor and to mobilize political support.
Carbon pricing is the most efficient, and potentially most effective, mitigation policy instrument.
Carbon pricing forces producers and consumers to internalize some of the costs of environmental
damage caused by the emissions they generate. This creates market signals throughout the economy
and incentives for reductions in emissions. Carbon pricing can be introduced using a carbon tax or a cap-
and-trade scheme. A carbon tax is applied upstream in the fuel supply in proportion to the carbon
content of each fuel. Firms and households may generate as many emissions as they wish.
Consequently, under a carbon tax, the carbon price is fixed but the emissions reductions achieved are
uncertain. Cap-and-trade schemes set a ceiling on the amount of emissions permitted for an economy.
Emissions permits or allowances are then distributed between producers, ideally through an auction
process. Emitters can buy additional emissions permits when that is more cost-effective than reducing
emissions and sell emissions permits that they do not need through the market. While the literature
argues in favor of the introduction of carbon taxes before establishment of a cap-and-trade scheme,
there are a wide range of country experiences.
Clean technology innovations are concentrated in developed economies and a handful of emerging
markets. Technologies are typically deployed in high-income countries first and then diffused through
trade, foreign direct investment, and licensing agreements as corporations seek export markets,
investment opportunities, and improvements in the efficiency of their worldwide operations.
Industrialized countries tend to benefit from most of this technology transfer. Developing countries can
accelerate the adoption of low carbon technologies by introducing supportive policies combining supply-
and demand-side interventions with regulatory, market-based, and fiscal policy instruments. In
addition, governments are often involved in directly financing investments in low carbon technologies,

30
and the use of tax incentives is widespread. In developing countries, external assistance is an important
source of finance for low carbon technologies.
In most countries, responsibility for climate change mitigation and adaptation is spread across
national, regional, and local governments. This multi-level structure has important implications for
design and implementation of national climate change policy. Regional and local governments can take
the initiative, both developing their own climate change policy initiatives and playing an important role
in adapting national policies to regional and local conditions. The challenge for national governments is
to establish an institutional framework that enables various levels of government to effectively address
climate change mitigation and adaptation.
The remainder of this chapter includes discussion of the following topics. Section 1.2 presents the main
issues that need to be taken into account to integrate climate change into government plans. These
issues are further described in the sections that follow. Section 1.3 has a brief discussion of analytic
work that needs to be undertaken to make informed policy choices and that provides such information
as the estimates of the impact of policies on GHG emissions and the likely costs of abatement, as well as
offers recommendations on the appropriate response to a changing climate. Section 1.4-1.7 are about
major mitigation policy challenges: section 1.4 discusses energy subsidization and its distorting impact
on the economy and the environment; section 1.5 presents carbon pricing as the most efficient
mitigation policy instrument with a potential to achieve large emissions reduction and, at the same
time, generate significant government revenues; and Section 1.6 covers adoption of low carbon
technologies and policies that support their introduction. Further on, Section 1.7 describes adaptation
policies that are needed to accelerate adaptation action by providing information and creating
incentives for the private sector to get involved. Lastly, Section 1.8 is about the role of regional and local
governments in climate change mitigation and adaptation.
1.2. MAIN ISSUES
Developing countries face a myriad of development challenges. Climate action adds to the list, but not
simply as an additional objective. Climate action, whether to mitigate greenhouse gas emissions or to
adapt to a changing climate, sets up substantial and difficult-to-value tradeoffs between the present day
and the future. Climate action constitutes, to a great extent, either a global public good (in the case of
mitigation) or a national public good (for much of adaptation action); and thus, government action is
needed to supplement (and sometimes to counter) private sector action on climate. The need for
climate action by every country, although particular to the individual country’s circumstances, translates
to a new constraint on growth and revised development paths for most countries. For some countries,
diverting limited government personnel and resources from the current list of problems to address
future threats from climate change and to reducing emissions implies lower growth and reduced welfare
for its citizens in the near term.

31
Box 1.1. Integrated Assessment Models
Integrated Assessment Models (IAMs) are used to generate scenarios at a global or regional level by simulating the interactions between complex climate and human systems. IAMs fall into four broad categories: 1) Welfare Optimization models lay out a causal chain: production generates consumption and emissions; emissions affect the climate, causing damages which reduce production. Models maximize the discounted value of future welfare by choosing the optimum level of emissions reductions in each time period. 2) Computable General Equilibrium (CGE) models represent the economy as a set of linked economic sectors and factor markets. The model functions by finding a set of prices that satisfy demand and supply in all of these discrete markets simultaneously. 3) Simulation models set a predetermined amount of emissions that can be generated from production and then calculate the cost of mitigation and the cost of damages. There is no feedback between climate and economic dynamics. 4) Cost minimization models are typically used in a specific sector, such as energy, modeling interactions between technological choices, energy supply and demand and emissions so as to identify the least-cost solution to achieve a particular emissions target.
IAMs can help inform decisions regarding the timing, design and level of mitigation policies and their distributional consequences. However, IAMs are simulations, not forecasts and the results depend on the underlying assumptions regarding discount rates, the causal relationships between parameters and the pace of technological and institutional change. As such, outputs should be presented as a range rather than a single number, in order to better represent the uncertainties associated with the estimate. Most models fail to take into account extreme, low probability climate impacts and so may lead decision makers to underestimate the risks of not taking action to mitigate. Analysts have questioned whether the damage functions used to describe climate change impacts overestimate adaptation capacity, thereby underestimating residual damages and in turn discouraging early investment in mitigation. Concerns have also been raised that models generating regional scenarios fail to account for the vastly different levels of welfare between regions when optimizing welfare at a global level.
IAMs are less helpful in informing adaptation policy. Most models address adaptation through a damage function. This simply assumes the proportion of climate impact that will be addressed through adaptation and a residual amount of damage that arises because it is not possible to adapt or because it is uneconomic to do so. The damage function often cannot be adjusted as a policy variable, the rationale being that adaptation is a private decision and not something that the policymaker can influence. Clearly, this is unrealistic because governments are actively engaged in adaptation and can influence private adaptation through a range of fiscal and regulatory instruments. More recent models have distinguished between a stock of adaptive capacity and a flow of adaptive action: a distinction helpful in highlighting the adaptation deficit faced by many developing countries in terms of inadequate infrastructure, human capital and social capital. These models highlight the need for substantial upfront investments in adaptive capacity development in the developing world, in order to ameliorate impacts and reduce longer term adaptation action costs. However, the specification of the adaptation and residual damage functions remains rudimentary, failing to capture the complexity of adaptation choices at a sector level. Hence the models offer little useful guidance on the cost of adaptation.
IAM developers are continually improving model specification, adding spatial resolution, technical detail, refining functions related to damages, technological change and others. Commentators argue that greater effort also needs to be put into improving transparency and policy makers’ understanding of the functional capabilities of the models, their strengths and weaknesses and standardizing outputs so that their results can be compared.
Sources: Ackerman, Frank et al. (2009). Limitations of Integrated Assessment Models of Climate Change; Agrawala, Shardul et al. (2010). Plan or React? Analysis of Adaptation Costs and Benefits Using Integrated Assessment Models; Patt, Anthony G. et al (2010). Adaptations in Integrated Assessment Modeling: Where Do We Stand?; Stanton, Elizabeth et al. (2008). Inside the Integrated Assessment Models: Four Issues in Climate Economics.

32
Policy makers have to determine whether to integrate climate change concerns into growth and
development strategies, how much and when to invest in emissions reduction, and how much and
when to invest in adaptation. Such choices should be informed by relative costs and benefits, and
Integrated Assessment Models have some utility for this task at the global and regional levels. Due to
the high levels of uncertainty surrounding climate change, such modeling is particularly sensitive to
assumptions. Nonetheless, the results are useful for assessing trade-offs between policies and
identifying the most efficient solutions at a global level (Box 1.1). But they are generally not sufficient at
the country level to guide policy makers. In translating broad objectives on climate action into particular
policies, governments need to rely on country-specific analyses (even if, in many circumstances,
decisions are made based on other countries’ prior experience or simply based on expert judgment).
The translation of goals into policies is particularly imprecise for climate action because of the long time
horizons involved, the complex interactions with global developments on both policy and prices, and the
uncertain impact of a changing climate on national welfare.
Developing countries will need to mitigate emissions before they develop into rich nations, if the
world as a whole is to avoid catastrophic climate change. The bulk of future emissions growth is
expected to occur in developing countries. For example, energy use in non-OECD (Organization for
Economic Cooperation and Development) countries is projected to comprise approximately 85 percent
of global energy demand growth in future years.42 As a result, estimates of the global least-cost
mitigation pathway typically require about 65 percent of mitigation efforts to occur in developing
countries by 2030 (compared to a “Business As Usual” baseline). While developed countries hold
responsibility for much of the existing stock of GHGs in the atmosphere, mitigation sufficient to contain
global concentrations of GHGs to acceptable levels will require action by all large emitters, including
developing countries.
In line with the principle that all countries need to commit to containing emissions, countries also
need to determine their own emissions reduction paths since sources of GHG emissions vary among
countries. Box 1.2 provides global averages of GHG emissions sources. Globally, energy production
accounts for about one third of GHG emission sources; AFOLU, one forth; industry, one fifth;
transportation, one seventh; and buildings, one fifteenth. Indeed, much of the growth in GHG emissions
over the last 40 years is due to increases in emissions from energy production. Most developed
countries’ emissions are dominated by energy-related fuel combustion, with shares rising to over 50
percent of GHG emissions (especially for fast-growing middle-income countries). Improvements in
energy efficiency and a shift to renewables (and away from coal as a fuel) are likely to be the most
effective means of reducing emissions. Transport shares are significantly higher than the average in the
U.S. and Australia. In Argentina, agriculture is the largest source of emissions; in Brazil, forestry is by far
the largest contributor.
42
U.S. Energy Information Administration (2013). Annual Energy Outlook 2013.

33
Box 1.2. Greenhouse Gas Emissions: Trend in 2000-2010 and 2010 Emissions by Economic Sector
Globally, economic and population growth continue to be the most important drivers of increases in CO2 emissions from fossil fuel combustion. The contribution of population growth between 2000 and 2010 remained roughly identical to the previous three decades, while the contribution of economic growth has risen sharply. Between 2000 and 2010, both drivers outpaced emission reductions from improvements in energy intensity. Increased use of coal relative to other energy sources has reversed the longstanding trend of gradual decarbonization of the world’s energy supply.
Between 2000 and 2010, annual anthropogenic GHG emissions increased by 10 GtCO2eq. Forty-seven percent of this increase came directly from energy supply, 30 percent from industry, 11 percent from transport, and three percent from buildings. The only sector that did not experience emissions growth in this period was AFOLU.
Of the 49 GtCO2eq emissions in 2010, 34.6 percent was released in the energy supply sector, 24 percent in the Agriculture, Forestry and Other Land Use (AFOLU), 21 percent in industry, 14 percent in transport and 6.4 percent in buildings. When emissions from electricity and heat production are attributed to the sectors that use the final energy (i.e. indirect emissions), the shares of the industry and buildings sectors in global GHG emissions are increased to 32 percent and 18.4 percent, respectively, and the share of the energy supply sector drops to 11 percent (see Figure below).
Greenhouse gas emissions, breakdown by economic sector, 2010
Note: Inner circle shows direct emissions. Pull-out shows how emissions from electricity and heat production are attributed to sectors of final energy use. Emissions from Agriculture, forestry and Other Land Use (AFOLU) include emissions from forest and peat fires and from peat decay that approximate to net CO2 flux from the Forestry and Other Land Use sub-sector.
Source: IPCC (2014). “Summary for Policymakers” in Climate Change 2014, Mitigation of Climate Change. Working Group III. Fifth Assessment Report of the Intergovernmental Panel on Climate Change. Cambridge University Press, United Kingdom, and New York, NY, USA.

34
At the same time, countries need to make their economies more resilient to a changing climate. Most
countries will not be able to realize the growth paths currently planned and projected. The impact of a
changing climate on production and welfare needs to be accounted for in government plans. Assets and
infrastructure may be damaged or destroyed by more extreme weather (e.g., heat waves) or more
frequent extreme events (e.g., hurricanes). Damages to capital stock will reduce outputs and
productivity. Agriculture, in particular, is likely to be directly affected in many countries by water
scarcity and heat waves. People’s health will be undermined, and more lives will be lost. These impacts
are projected to vary greatly across countries and uncertainty is high, especially at the country or
subnational level.
As for any set of policies, a primary question for policy makers is the impact on growth. As
policymakers consider the extent to which they wish to act on climate, and the package of actions they
may wish to take, the impact of their actions on economic growth, as well as on employment, fiscal
balances, trade flows, and other key economic variables, is of high interest. Boxes 1.3 and 1.4 present
comprehensive lists of climate actions for mitigation and adaptation, respectively, categorized as
markets and information, regulation, and fiscal instruments. The first question is how growth will be
affected in light climate change and international mitigation policies. Countries will need to find climate-
resilient growth strategies (i.e., growth strategies which are achievable despite the impact of climate
change), and to identify and manage opportunities (such as new markets) and risks (such as trade
barriers) arising from international mitigation efforts, in order to achieve growth going forward. They
will then have to consider the further impact of domestic climate action on growth.
Early movers on mitigation face risks to competitiveness. For energy-intensive, trade-exposed sectors,
a key problem is their limited ability to pass along any input price increases associated with a carbon tax.
As a result, these sectors suffer a potential loss of competitiveness, particularly in comparison with
countries which have not implemented carbon pricing. Bilateral trade simulations for OECD countries43
suggest that, while these effects can be significant, subsidies and exemptions in exporting countries
have largely offset the effects on competitiveness. A related concern that many have voiced about the
imposition of carbon pricing is carbon leakage. The worry here is that investors in carbon-intensive
sectors will choose to invest in countries where carbon pricing is minimal or absent. Using time-series
data on trade in energy-intensive vs. non-energy intensive sectors, the World Bank found weak evidence
for carbon leakage. High-income countries experienced a moderate increase in the import-export ratio
of energy-intensive sectors during 1990-2004; there was a corresponding moderate decrease in this
ratio for low- and middle-income countries. Developing countries, meanwhile, continue to be net
importers of energy-intensive goods from high-income countries, which suggests that leakage to date
has been quite limited.
43
Hoekman, Bernard, William J. Martin, and Carlos A. Primo Braga (2008). Quantifying the Value of Preferences and Potential Erosion Losses. World Bank.

35
Box 1.3. Market, Regulatory, and Fiscal Policies for Climate Change Mitigation
Markets and Information Regulation Fiscal Instruments
Energy Tradable renewable energy certificates
Tradable emissions permits
Renewable energy obligations
Fuel economy and emissions standards
Feed-in tariffs for renewable energy
Eliminate or reduce fossil fuel subsidies
Fuel excise based on carbon content
Incentives (direct subsidies, tax incentives) for R&D on renewable energy sources; for renewable energy projects; and for low income electricity grid connections
Transport Vehicle labeling and certification
Fuel economy and emissions standards
Biofuel blending standards
Restricted access for personal vehicles and preferred access for low-carbon vehicles and mass transit
Transport infrastructure to favor mass transit and non-motorized transport options
Eliminate or reduce fossil fuel subsidies
Fuel excise based on carbon content, consumption tax on vehicle fuels
Taxes on vehicle purchase and registration charges
Road, congestion, and parking charges
Public investment in public transport infrastructure and mass transit Public-Private Partnerships (PPPs)
Incentives (direct subsidies, tax incentives) for mass transit
Building, Residential, Urban Design, and Waste management
Product energy efficiency labeling and certification
Building certification
Facilitation of energy service companies and district heating and cooling through urban design
Waste disposal charging and contracting out
Appliance energy efficiency standards
Building energy efficiency standards and codes
Contractor certification
Land use zoning to increase residential density and facilitate access to mass transit
Waste management regulations and emissions standards
Renewable energy obligations for waste energy
Green public sector procurement
Incentives (direct subsidies, tax) for upgrading energy efficiency of housing stock; waste energy projects; to promote zoning, residential density and access to mass transit
Public investments in urban green spaces and liquid waste disposal systems
Industry Product energy efficiency labeling and certification
Industry benchmarking
Tradable emissions permits
Voluntary standards and enterprises certification
Energy efficiency performance standards
Incentives (tax incentives) for upgrading energy efficiency of existing plants
Water Water permits and pricing Water use property rights
Water service efficiency standards
Agriculture, Forestry, and Fisheries
Information on land-use practices and emissions reduction
Forestry and food product environmental labeling and certification
Tradable emissions reduction certificates for land-use, afforestation, and forest sequestration
Defining fisheries rights and tradable fisheries permits
Land-use management regulations
Land-use zoning
Demarcation of fisheries and assignment of property rights
Environmental cross-compliance for agricultural and food subsidies
Incentives (direct subsidies, tax incentives) for land-use emissions reductions and sequestration (typically for afforestation); R&D on land-use management and emissions reductions in agriculture
Public investments in agricultural extension services
Ecosystems Tradable emissions reduction certificates for ecosystems
Payments for ecosystem services
Tradable long-term forest use permits
Land-use zoning
Protected area demarcation and enforcement
Land tenure and property rights for forest inhabitants
Incentives (tax incentives) for sequestration
Public investment in environmental management and protected areas
Social Sectors Education on climate change impacts and co-benefits of mitigation efforts
Sources: Adapted from IPCC (2007); World Bank (2010).

36
Box 1.4. Market, Regulatory, and Fiscal Policies for Climate Change Adaptation
Markets and Information Regulation Fiscal Instruments
Energy Information on climate change vulnerabilities: energy demand load and distribution and risks to the energy supply
Service standards for resilience and recovery in relation to extreme weather events
Identification of critical infrastructure
Transport Information on climate change vulnerabilities: transport demand, distribution, and exposure to extreme events
Construction and service standards for resilience to extreme weather events
Identification of critical infrastructure
Public investments in climate-proofing new, and upgrading and retrofitting existing, public transport infrastructure
Building, Residential, urban Design, and Waste Management
Information on zonal climate change impacts and risks
Early warning systems for extreme weather events
Air quality monitoring, information, and warning
Access to property insurance
Building standards and codes adjusted to climate proof and reduce urban heat island impacts
Land use zoning to reduce urban heat island impacts and reduce exposure to extreme weather events
Incentives (direct subsidies) to promote access to insurance for low-income groups; climate proofing of low income housing; relocation of low-income households from vulnerable sites
Public investments in climate-proofing urban infrastructure, flood defenses, and land use management; acquisition and development of land for low-income housing in safety zones; and acquisition of land to manage heat island impacts
Industry Information on industry climate change impacts, risks, and opportunities
Water Information on climate change impacts, risks, and implications for the structure and timing of water demand
Water permits and pricing
Service standards in relation to water system efficiency
Building standards adjusted to climate proof water infrastructure and improve resilience in relation to extreme weather events
Water permits and regulation
Public investment in climate-proofing new, and upgrading and retrofitting existing, public water infrastructure
Agriculture, Forestry, and Fisheries
Information on climate change impacts, risks to land and income, and business opportunities
Weather information and forecasting
Access to crop insurance, including parametric insurance
Defining fisheries rights and tradable fisheries permits
Land-use management regulations to reduce the public’s exposure to extreme weather events
Land-use zoning to reduce public exposure to risks and to protect land and ecosystems
Demarcation of fisheries and assignment of property rights
Incentives (direct subsidies, tax) for land-use management to reduce public’s exposure to extreme weather events; for R&D on crops, land-use and fisheries in changing climate; to facilitate adaptation by low-income farmers and fisheries; to promote use of insurance
Public investments in R&D, agricultural extension services, pest control, and microfinance
Ecosystems Information on climate change impacts, risks, and opportunities
Payments for ecosystem services
Tradable long-term forest use permits
Land-use zoning to protect ecosystems
Protected area demarcation and enforcement
Land tenure and property rights for forest inhabitants
Public investments in environmental management and protected areas and on R&D on ecosystem impacts
Social Sectors
Information on climate change impacts, risks, and opportunities
Heat information and warning systems
Public investments in R&D on vector control and disease eradication and implementation of vector control and vaccination programs
Sources: Adapted from Agrawala and Fankhauser (2008); World Bank (2010).

37
The financing needs for low-carbon and resilient development are certainly higher, and may be
significantly higher, than for conventional development. McKinsey & Company estimated financing
needs for low-carbon development in developing countries in 2030 at $563 billion; this can be compared
with levelized net costs of mitigation of $175 billion. This higher need for financing may be an important
issue for public investment programs in developing countries, where the sustainability of government
borrowing is a binding constraint. The availability of grant or concessional climate finance is likely to be
important as well because of the relatively high capital costs of many low-carbon technologies. For
example, a windmill-based generator has high capital costs but is accompanied by very low operating
costs because wind is free. In a country where coal is expensive, the present values of benefits minus
costs are higher for a windmill complex than for a coal-fired power plant of equivalent capacity. While
there are net economic benefits to be gained by choosing wind power in such a setting, the capital costs
of windmills may be many times higher than the capital costs of coal-electric generators. This creates a
major barrier for finance-constrained governments seeking to switch to renewables.
Reference has already been made to the complex equity implications of climate change. The
distributional implications of adaptation and mitigation policies need to be carefully assessed. For
example, the removal of energy subsidies, the imposition of a carbon tax, or tightened vehicle emission
standards might adversely affect low income groups; as a result, policy measures may be required to
protect the poor. These reforms are also often politically difficult because perceptions of inequity
generate social resistance and because politically powerful groups may be resistant to changes that have
a negative impact on them. Energy subsidy removal is a well-known example of a reform that is
politically difficult because it pushes up fuel and electricity prices, as well as the prices of all products
that are produced using energy (see Section 1.4). While removing energy subsidies reduces inequity
overall, because energy subsidies are regressive (i.e., they benefit mostly upper income groups who
consume higher quantities of electricity and other subsidized goods), the removal of subsidies often has
a significant impact on the poor, whose budgets have no room to absorb price increases. Therefore,
subsidy removal can result in deepened poverty. Mitigation measures should include well-targeted
subsidies for the poor prior to subsidy removal, low pace, step-by-step implementation of energy price
increases and the correct timing of reform (to avoid implementing it together with other politically
sensitive reforms or with price increases on other necessities, and to provide targeted subsidies prior to
the price increase). The best-targeted energy subsidies are cash transfers and vouchers. When creating a
new targeted subsidy program is not possible, existing targeted social support programs can be
expanded instead, this needs to be done prior to energy subsidy removal. Among other measures,
subsidizing connection costs instead of power tariffs is an approach that has been widely used and
works well where electricity access for the poor is a policy objective.
Rent seeking and policy capture by industry interests is a risk of policies that promote particular
technologies. This issue must be managed through robust monitoring and oversight arrangements.
The lobbying of renewable industries around policies supporting renewable energy is testimony to the
38
interests at play.44. Governments have to balance private investors’ need for continuity of government
policy and the government’s obligation to withdraw preferential assistance when policies and/or
projects fail to deliver the intended results or fail commercially. The World Bank45 recommends using a
market test; the report notes, however, that this may not always be possible where technologies are
subsidized when deployed. Performance targets addressing both market and social considerations can
help governments decide whether to continue support. Putting in place decision points, mandatory
policy reviews, and open transparent review processes may help to limit industry influence in decision
making. Governments can also follow a variety of approaches to enforcement that place specific
demands on the private sector and regulators and that have implications for how much enforcement
will cost government and how resources should be allocated to achieve regulatory policy goals.46
Government interventions in the market to promote demand for low carbon technologies are most
effective in reducing GHG emissions where they have market-wide impacts. Removal of subsidies on
fossil fuels is a sensible starting point as it levels the playing field among technologies. Carbon pricing
can further shift the competitive advantage toward low carbon technologies. These interventions have
an impact on all producers, providing incentives that affect the ultimate demand for energy and
products. Regulatory instruments can serve a similar purpose.
Mitigation actions have local co-benefits in addition to their direct global benefit of reducing
greenhouse gas emissions. Understanding these co-benefits can help create incentives for a
government to implement mitigation actions which could otherwise be viewed as costly expenditures
for global good (with no national gain) and investments in the future (with all the benefits captured by
future generations mostly living in other countries while the costs are absorbed today by the local
population). The co-benefits of mitigation actions include a wide range of positive outcomes. The most
common, and among the easiest to measure, is reduction in particulate matter (PM) pollution and the
related health benefits. Another important co-benefit is increased energy security. Renewable energy
sources, such as wind, solar, and small hydro, are usually local, and expanding renewable energy means
increasing energy diversity. Other co-benefits include technological innovation and related economic
growth; increased employment and improved sectoral efficiency in sectors with highest mitigation
potential (such as energy and transport); and improved rural living standards (off-grid renewable power
can be used to provide electricity access to power in remote communities). These latter co-benefits
may, in turn, reduce rural-urban migration. Transport sector mitigation, meanwhile, brings such co-
benefits as increased traffic safety, lessened traffic congestion, decreased traffic noise, and improved
quality of urban life. The reduced cost of new technologies (due to experience, competition, and
economies of scale) is also viewed as a co-benefit of climate-change policies and actions. New energy
technologies are typically characterized by steep learning curves and significant economies of scale; they
sometimes translate into increased employment (compared to conventional technologies), much of it in
areas requiring advanced skills and education.
44
Anthoff, A. & R. Hahn (2010). Government Failure and Market Failure: On the Inefficiecy of Envrionmental and Energy Policy. Oxford Review of Economic Policy, 26(2), pp. 197-224. See also Helm, D. (2010). Government Failure, Rent-Seeking, and Capture: The Design of Climate Change Policy. Oxford Review of Economic Policy, 2(182-196), p. 26. 45
World Bank (2011). Green Growth: The Pathway to Sustainable Development. 46
Gunningham, N. (2011). Enforcing Environmental Regulation. Journal of Environmental Law, 23(2), pp. 169-201.

39
Adaptation policies and investments face the challenge of decision making under uncertainty. The
horizon over which a changing climate will impose damages on an economy is many decades long, with
damages becoming significant in most countries only after 2050 or later. Tools are available to aid in
decision making over long time horizons with large uncertainties , but none can resolve the essential
problem of trading off growth today (from investments in productive assets) against an uncertain
probability of insuring tomorrow’s economy from harm.
1.3. BETTER INFORMED POLICY CHOICES
Low carbon and resiliency planning require assessment of the impact of policies on GHG emissions,
the likely costs of abatement, and the appropriate response to a changing climate. Two broad
approaches can be used to assess these impacts: (1) bottom-up, which analyzes impacts related to
specific technologies and sectors; and top-down, which uses economic modeling to assess the impact of
policies through effects on supply and demand across multiple markets. A particular challenge has been
to create linkages between top-down and bottom-up models so as to take advantage of the
technological and sectoral detail of bottom-up approaches along with the interactions of markets and
price adjustments that come from top-down models. Sectoral work or engineering models can provide
detailed and country-specific recommendations for action at the sector or subsector level while
macroeconomic modeling ensures consistency of projected sectoral growth rates, energy demand, and
other key variables. Various country studies have depended on detailed bottom-up sectoral work
supplemented by separate, top-down macroeconomic modeling. Clearly, a next step in methodology
would be integration of these approaches into a single model. The World Bank’s low carbon growth
study for Poland provides an example of a more integrated approach (see Box 1.5).
Top-down models are able to capture the relationships and interconnections among major economic
variables while considering the overall economic system. The most common tools are Computable
General Equilibrium (CGE) models (see reference to these models in Box 1.1); these are widely
employed to analyze the aggregated welfare and ex-ante distributional impact of various policies.47 CGE
models are based on a Walrasian general equilibrium structure (formalized by Arrow and Debreu 1954)
and seek to explain the behavior of supply, demand, and prices in an economy with many interacting
markets and given typical assumptions of utility maximization for consumers and profit maximization for
producers. These models are composed of a number of functions which describe the utility/production
relationship in a hierarchical or nested shape (usually Cobb-Douglas or constant elasticity of
substitution). Relevant parameters are substitution, transformation, and Armington elasticities
(regulating the choice between primary factors in production processes and between commodities in
consumption processes, and regulating the allocation of primary factors among different uses and
choices between domestic and foreign inputs/commodities); these parameters can either be borrowed
from economic literature or calibrated on the initial benchmark equilibrium.
47
Sue Wing, Ian (2004). Computable General Equilibrium Models and Their Use in Economy-Wide Policy Analysis. MIT Joint Program on the Science and Policy of Global Change Technical Note No. 6. Massachusetts Institute of Technology.

40
Box 1.5. Poland Low Carbon Growth Study
This study posed the question of how Poland can transition to a low emissions economy as successfully as it underwent transition to a market economy in the early 1990s. With the EU policies on climate change and 2020 targets already in place, Poland faced immediate policy challenges. What were the implications for Poland of implementing EU policies on energy and climate change? Could the country commit to more ambitious overall greenhouse gas mitigation targets for the longer term (to 2030 and beyond)? What technological options are available, and how expensive are they? Would there be high costs in lost growth and employment? The report addresses these questions by integrating bottom-up engineering analysis with top-down economy-wide modeling. The study integrated engineering and sectoral analyses into macroeconomic modeling to allow improved analysis of the impact of emissions mitigation on growth, fiscal variables, and sectoral output and employment.
Four complementary and interlinked models for Poland were developed to quantify the economic impact of CO2 mitigation, taking advantage of available data and leveraging existing models. The models complement each other; by ensuring that the sectoral work provides specific recommendations for actions at the sector or subsector level while the macroeconomic modeling ensures consistency of projected sectoral growth rates, with energy demand and other key macroeconomic variables taken into account.
MicroMAC Curve. The most widely used of these models, the Marginal Abatement Cost (MAC) curve, provides a simple first-order ranking of technical options for GHG mitigation by sector based on the net present value of costs and savings per metric ton of CO2-equivalent avoided.
Macroeconomic Mitigation Options (MEMO). - MEMO is a Dynamic Stocastic General Equilibrium (DSGE) model of Poland, revised to include energy and emissions, that assesses the macroeconomic impact of the options costed in the MAC curve. It is linked to the MAC curve via a Microeconomic Investment Decisions (MIND) module which grouped the technology levers into seven packages, including an optimized package of options for the energy sector.
Regional Options of Carbon Abatement (ROCA). - ROCA is a country-level CGE model adapted to Poland for energy and GHG mitigation policy assessment. It analyzes implementation of the EU 20-20-20 policy in the context of global policy scenarios, with an emphasis on spillover and feedback effects from international markets.
TREMOVE Plus. - This last model is a detailed sectoral approach for road transport, the sector with the fastest growing emissions and central to Poland’s commitments under EU 20-20-20 (as a non-ETS sector). It makes use of the EU transport and environmental model, TREMOVE, updated with the latest information and policy intentions, here denoted as TREMOVE Plus.
All four models use very similar “business-as-usual” reference scenarios (within the limitations of data) against which to measure policy changes. The innovative linking of the MEMO economy-wide model with the bottom-up engineering approach of the MicroMAC curve model allows analysis of the varying macroeconomic implications of GHG abatement measures, across four public financing options.
Source: World Bank (2011). Transition to a Low-Emissions Economy in Poland.
The input database of a CGE model is constructed on a Social Accounting Matrix (SAM), a refined
Input/Output based table of data which represents flows of all economic transactions that take place
within an economy, a matrix representation of the National Accounts for a given country in a specific
year. Many global models draw their data from the Global Trade Analysis Project (GTAP), which in its
most updated version (GTAP 8 database) divides the world into 129 countries or regions. The database
divides economy-wide production into 57 sectors—with extensive details for agriculture and food, and
energy (coal mining, crude oil production, natural gas production, refined oil, electricity, and distributed

41
natural gas) and emissions gases. CGE models define a counterfactual scenarios (for example a specific
policy implemented) against a Business-as-usual (BAU) scenario that is used as a baseline.
Simple CGE models can be extended with an increased number of sectors, fiscal details (such as taxes
and subsidies), additional factor markets beyond labor and capital (such as joint production, savings
and investments, open economies and trade, an increased number of global regions, imperfect
competition, unemployment, and public goods and externalities). Moreover, CGE models can be
recursive dynamic, which means that they can solve a sequence of static equilibria connected to capital
accumulation over time, and they can present exogenous or endogenous investments or exogenous
inclusion of new technologies or investment in research and development (R&D). CGE models have been
Box 1.6. A Green Growth Country Assessment for FYR Macedonia
This study for the Former Yugoslav Republic of Macedonia defines a green growth path to 2050, focusing on climate action. While addressing today's economic challenges, policy makers need to keep the long-term in mind—both the likely impact of a changing climate on water, agriculture, and infrastructure and the growing obligations to mitigate greenhouse gas emissions, especially from energy and transport. These considerations are particularly important for decisions on long-lived infrastructure such as power supply, irrigation, urban streets, water distribution, and sewers.
Carefully-chosen public investments and policies can ease the path to a more resilient and climate-friendly economy without sacrificing long-term growth. An economy-wide macroeconomic assessment in FYR Macedonia found that climate investments pose costs up-front but provide benefits both now and later. Even if financed entirely domestically, the impact on GDP growth of a package of green actions on adaptation (which protects tomorrow’s output from climate damage) and mitigation (which nearly halves greenhouse gas emissions) is modestly negative at first and becomes a boost to growth within 15 years. On the benefit side, policy makers will have taken a significant step toward creating a greener, more sustainable economy for generations to come. Such comprehensive analysis should give confidence to policy makers considering green policies and green investments.
The innovative aspect of the macroeconomic modeling was the integration of both mitigation and adaptation investments into an economy-wide model to assess the impact of climate action in water, agriculture, infrastructure, energy, and transport on growth, employment, and fiscal balances. This modeling brought together much of the sector analysis into a common framework to assess the net impact on growth and employment of packages of actions on green growth across sectors as well as to assess various public investment options. Putting the sectors together provided the government with a potentially powerful tool to consider which public investments will have the highest returns over time, including investments to counter climate change and investments to reduce greenhouse gas emissions. Macroeconomic modeling developed a dynamic general equilibrium model with detailed sectors to simulate green scenarios against the baseline. The Macroeconomic Options of Mitigation and Adaptation model (MOMA model) captured the complex linkages between climate mitigation and adaptation policies and macroeconomic performance. This large-scale dynamic stochastic general equilibrium model integrated detailed engineering options for mitigating greenhouse gases and for adaptation. The options were analyzed by the MOMA model, not only in a bottom-up manner (for agriculture, water, energy, and transport) but also econometrically in a top-down manner (for facilities of physical infrastructure). Mitigation and adaptation options were integrated into the model to allow analysis of the growth, employment, and fiscal implications of different combinations of green growth actions. Advice on public investment priorities emerged from the assessment.
Source: World Bank (2014). FYR Macedonia: Green Growth Country Assessment.
extensively applied to climate change policy analysis and, in particular, have been able to explore issues
such as the effect on the economy of emissions trading.

42
Assessments of the economic impacts of climate change and adaptation policies are even more
complex since models have to take into account both economic and climate change impacts and their
interactions. Both mitigation and adaptation policies and investments can be thought of as claiming
today’s resources in the interest of lower carbon and a more resilient economy tomorrow. Mitigation
measures are usually simplified in economic analysis (such as in Marginal Abatement Cost curves) to net
cost per ton of emissions avoided; their macroeconomic impact, meanwhile, can be assessed in a CGE
model (see Box 1.5). A consideration of adaptation issues requires first that climate damages be
factored into the baseline, and then that uncertain returns from adaptation actions (in terms of damage
avoided or resiliency increased) be assessed in a way that allows comparisons across adaptation
measures and against mitigation measures. Only then can an optimal set of climate actions be specified,
and a low carbon and resilient growth path projected. A recent study by the World Bank aims for just
this combined assessment of climate action, including macroeconomic impacts (see Box 1.6).
1.4. MITIGATION POLICY CHALLENGES: ENERGY PRICING
Energy subsidies are widespread and, in some of the developing countries, constitute 20 percent and
even more of government revenues. These subsidies, while in many cases originated based on good
intentions (e.g., poverty reduction, environmental sustainability, and energy security) are distorting
for the economy, damaging for the environment, and harmful to the poor (because governments
spend on subsidies at the expense of other programs) or a serious impediment to these goals. The
environmental rationale for energy subsidy reform lies in its contribution to reduced local air pollution
and GHG emissions. The fiscal rationale is that subsidy reform facilitates fiscal management and frees
resources for more productive uses. Energy subsidy reform can also stimulate growth and improve
competiveness, although short-term impacts on prices do need to be managed; energy subsidy reform
also reduces inequitable transfers to better off households who are the largest energy consumers.
Compensatory measures are needed, however, both to ensure that reforms do not adversely affect the
poor and to mobilize political support.
While economists have long recognized the adverse fiscal, economic, and environmental impacts of
poorly performing energy subsidies, reform has gained urgency in the context of international efforts
to tackle climate change. In September 2009, at the Pittsburgh Summit, the G20 leaders committed to
“phase out and rationalize over the medium term inefficient fossil fuel subsidies while providing
targeted support for the poorest,” and argued that “inefficient fossil fuel subsidies encourage wasteful
consumption, reduce our energy security, impede investment in clean energy sources, and undermine
efforts to deal with the threat of climate change.” This commitment has helped focus attention on
energy subsidy reforms by member governments and international organizations, and by civil society
organizations monitoring progress made toward this goal.48 This section reviews the rationale for energy
subsidy reform, the potential risks posed in implementing reforms, and the implications for the design of
reform programs.
48
G20 (2012). Summary of Progress Reports to G-20 Leaders on the Commitment to Rationalize and Phase Out Inefficient Fossil Fuel Subsidies; IEA, OECD, and World Bank (2010). The Scope of Fossil-Fuel Subsidies in 2009 and a Roadmap for Phasing Out Fossil-Fuel Subsidies; Lang, K. (2011). The First Year of the G20 Commitment on Fossil Fuel Subsidies: A Commentary on Lessons Learned and the Path Forward. International Institute for Sustainable Development.

43
Energy subsidies are substantial and widespread. Estimations of the value of subsidies generally use
the price-gap method, which calculates differences between prevailing domestic prices and a suitable
benchmark. This reveals the extent to which government interventions (i.e., subsidies) result in changes
in the consumer price of energy products; it tends, however, to underestimate the total value of
subsidies because it ignores a range of subsidies that do not have observable price effects (see Chapter
7). The International Energy Agency (IEA) estimated that energy-related consumption subsidies in 20
non-OECD countries amounted to $310 billion in 2007, half of which were for oil products.49 Subsequent
IEA reports have tracked a steady increase in global subsidies for fossil fuels, to $523 billion in 2011 (up
from $300 billion in 2009), alongside increases in global fuel prices.50 The IMF estimates global energy
(petroleum products, coal, gas and electricity) pre-tax subsidies amounted to $387 billion in 2010,
equivalent to 0.5 percent of global GDP. Of these, 43 percent are for petroleum products, 34 percent for
electricity, and 22 percent for natural gas, with coal subsidies being relatively minor. Pre-tax subsidies
were negligible as a share of GDP in most advanced economies; around 1.5 percent in Central and
Eastern Europe; one percent in Asia; and 0.5 percent in Latin America and the Caribbean. In the Middle
East and North Africa, however, pre-tax subsidies were estimated at 8.5 percent of GDP; they amounted
to more than 10 percent of GDP in three countries (Iran, Kuwait, and Libya). In addition, the IMF found
that oil producing nations consistently had the highest levels of subsidies relative to GDP. Pre-tax
subsidies amounted to 3.5 percent of regional GDP in Sub-Saharan Africa, mostly related to electricity,
with the highest rates in Zimbabwe, Zambia, and Mozambique. Post-tax subsidies, which are adjusted to
take into account the extent to which subsidies incorporate consumption taxes and a tax to charge for
externalities (including GHG emissions and local pollution), are significantly higher, at $1,800 billion, or
2.5 percent of global GDP. Advanced countries account for about 40 percent of the global total.51
The environmental rationale for energy subsidy reform lies in its contribution to reducing local air
pollution and GHG emissions. Subsidies for fossil fuels lead to fuel overconsumption and excess
emissions of local and global pollutants. Subsidies for electricity will also have this effect, although
environmental impacts will depend on the fuel mix in the electricity supply. Modeling exercises suggest
that subsidy reforms would lead to significant reductions in emissions. A review of six studies shows
emissions reductions following subsidy reforms ranging from a 1.1-percent reduction in CO2 emissions
by 2010 to an 18-percent reduction by 2050, although the most recent of the studies cited estimates
that world CO2 emissions would be reduced by 13 percent (and GHG emissions by 10 percent) by 2050 if
consumer subsidies for fossil fuels and electricity in 20 non-OECD countries were phased out.52 For
developing countries, the environmental improvements in air quality and the subsequent health
benefits probably constitute a stronger argument than global GHG effects. Case studies in the United
Kingdom and India indicate that the public health benefits from improved household ventilation and
fuel switching can be significant.53 Subsidy reform can also reduce local atmospheric pollution by cutting
49
IEA (2008). World Energy Outlook. Paris: International Energy Agency. 50
IEA (2012). World Energy Outlook. Paris: International Energy Agency. 51
International Monetary Fund (2013). Energy Subsidy Reform: Lessons and Implications. 52
Ellis, J. (2010). The Effects of Fossil-Fuel Subsidy Reform: A Veview of Modelling Andempirical Studies. Global Subsidies Initiative, International Institute for Sustainable Development. 53
Wilkinson, P., et al. (2009). Public Health Benefits of Strategies to Reduce Greenhouse Gas Emissions: Household Energy. The Lancet, 374(9705), pp. 1917-1929.

44
traffic and congestion, as users cut back on travel and switch to more fuel-efficient vehicles and to mass
transport. This too can have significant public health benefits.54
The fiscal case for energy subsidy reform is also unequivocal: subsidy reform facilitates fiscal
management and frees resources for more productive uses. Subsidies can lead to worsened fiscal
balances by reducing revenues and increasing expenditures; they divert scarce public resources from
development and social programs; and they can create incentives for smuggling, with potential
significant losses in the case of oil producers. Indonesia is an extreme but illustrative example of the
fiscal burden that subsidies can impose. From 2006-2011, direct energy subsidies for fossil fuels and
electricity exceeded capital investment by a factor of 1.7:1 and exceeded spending on health, education,
and social protection combined by a factor of almost 2:1.55 Unanticipated increases in fuel prices
hindered Indonesia’s fiscal management, forcing the government to choose between reductions in fuel
subsidies, cuts in development programs, or increases in borrowing. This created uncertainty regarding
the government’s financing needs and the outlook for inflation, as the market anticipated fuel price
increases to close the gap with international market prices, leading to increases in the cost of
government borrowing.56 And Indonesia’s case is not unique. An IMF study57 identified 28 countries
where post-tax energy subsidies accounted for a higher share of GDP than health and education
spending combined (among these, 17 are oil-exporting countries 11 are not). Evidence from successful
reforms confirms that these subsides have reduced budget outlays, though reforms may have the
paradoxical effect of increasing the number of reported subsidies (when formerly off-budget, such as
arrears to suppliers by money-losing state-owned enterprises, are made explicit in the budget).58 The
key consideration from a fiscal perspective is how quickly subsidies can be reduced without adverse
economic, social, and political consequences.
Energy subsidy reform can also stimulate growth and improve competiveness, although short-term
impacts on prices do need to be managed. Energy subsidies worsen the trade imbalance for both
importers and exporters by encouraging increased consumption. For energy exporting countries,
subsidies represent the opportunity cost of foregone foreign exchange earnings. For energy importing
countries, subsidies are a drain on international reserves. Energy subsidies discourage investment in the
energy sector, innovation, and improved energy efficiency throughout the economy. In the long-term,
reduced public and private investments and the inefficient allocation of resources in response of
distorted price signals will undermine competiveness and growth prospects.59 Energy subsidy reform
removes these distortions and can boost growth. However, the immediate macroeconomic impact of
subsidy reforms is to increase production costs. The exact impact of these price increases will depend on
the energy intensity of economic activities, the fuel mix, and the ease of switching to lower-cost
54
Künzli, N. et al. (2000). Public Health Impact of Outdoor and Traffic-related Air Pollution: A European Assessment. The Lancet, Volume 356, pp. 795-801. 55
GSI and IIER (2012). A Citizens' Guide to Energy Subsidies in Indonesia. Institute for Essential Services Reform and International Institute for Sustainable Development. 56
World Bank (2011). Indonesia Economic Quarterly: 2008 Again? 57
IMF (2013). Energy Subsidy Reform: Lessons and Implications. 58
Vagliasindi, M. (2012). Implementing Energy Subsidy Reforms: An Overview of the Key Issues. World Bank. 59
World Bank (2010). Subsidies in the Energy Sector: An Overview..

45
alternatives. Secondary effects, such as energy-induced price increases, lead to increases in wages and
other input prices; these can be managed through monetary and fiscal policies. Reduced expenditures
on subsidies creates room for government interventions to assist energy-intensive sectors (such as some
agricultural producers, fisheries, and transport activities) through the transition. Over the longer term,
empirical studies suggest that net impact of subsidy reforms will be to increase growth.60 Still, there will
be winners and losers.
Energy subsidy reform reduces inequitable transfers to better off households who are the largest
energy consumers, but it also adversely affects the poor unless compensatory transfers are used. The
extent to which the poor will benefit from energy subsidies depends on the structure of demand for
energy products. Data from 18 household surveys presented in a World Bank report (2010),61 and
another nine household surveys consolidated by Bacon et. al (2010),62 show that household
consumption of LPG and petroleum products rises sharply with income; this indicates that these are
fuels used by the better off. Electricity consumption also rises with income in most countries, while
consumption of kerosene tends to fall, indicating that the latter is the fuel of choice of the poor. Another
cross-country review of 20 case countries on the impact of subsidies on fossil fuels63 confirming earlier
studies but also highlighting just how regressive such subsidies are: on average, the value of the subsidy
for gasoline received by the highest income quintile is 20 times greater than the value received by the
lowest income quintile; 14 times greater for LPG; and around the same for kerosene. Commercial energy
accounts for more than five percent of household expenditures in the lowest income quintile in half of
the countries reviewed.64 Consequently, increases in the price of these products as a result of energy
subsidy reform will impact on the poor.65 This underlines the need for alternative transfer mechanisms if
the distributional and equity objectives of energy subsidy reforms are to be achieved.
Herein lies the real challenge of energy subsidy reform: concerns regarding the adverse financial
impacts of reform can mobilize opposition, undermining political commitment to reform. An IMF
study66 documents 28 case studies of energy subsidy reforms in 22 countries since the early 1980s. Of
these, 12 were considered successful (achieving sustained reductions in subsidies), 11 partially
successful (reductions in subsidies were reversed in part after a year or more), and the remaining five
unsuccessful (no reduction in subsidies was achieved). Partial successes and unsuccessful reforms were
associated with shifts in government policy in response to political opposition. In some countries,
opposition took the form of street protests (Indonesia in 1998 and 2000; Nigeria in 2000 and 2011;
Ecuador in 1999); in others, opposition has involved strikes by particular interest groups concerned
about loss of employment and income (coal miners in Poland in the 1990s; taxi drivers in Honduras in
60
IMF (2013). Energy Subsidy Reform: Lessons and Implications. 61
World Bank, 2010. Subsidies in the Energy Sector: An Overview. 62
Bacon, R., S. Bhattacharya,and M. Kojima (2010). Expenditure of Low-Income Households on Energy: Evidence from Africa and Asia. World Bank. 63
Ellis, J. (2010). The Effects of Fossil-Fuel Subsidy Reform: A Review of Modelling and Empirical Studies. Global Subsidies Initiative. International Institute for Sustainable Development. 64
World Bank (2010). Subsidies in the Energy Sector: An Overview. 65
Granado, F. J. A. D. and D. Coady, D. (2012). The Unequal Benefits of Fuel Subsidies: A Review of Evidence for Developing Countries. World Development, 40(11), pp. 2234-2248. 66
IMF (2013). Energy Subsidy Reform: Lessons and Implications.

46
2006-07). Drawing lessons from these and other case studies, Vagliasindi (2013)67 highlights lessons for
the technical design of reforms.
A useful starting point is an understanding of the political economy context for reform and the drivers
that lead to the creation of and have sustained subsidies. Victor (2009)68 distinguishes upstream
subsidies, which target industry and producers, and downstream subsidies, which target consumers.
Upstream subsidies tend to respond to appeals for market access and protection from relatively narrow
but influential and well-organized interests. Upstream subsidies are generally hidden, using tax
expenditures and regulatory instruments to achieve their objectives rather than direct payments.
Downstream subsidies, in contrast, benefit large numbers of dispersed and poorly organized interests.
They are highly visible and tend to be used as a means of demonstrating commitment to a sharing of
benefits and as a tool for political mobilization in contested political arenas. Both types of subsidies tend
to become entrenched. Where this is the case, successful reform typically requires strategies that
compensate losers, take advantage of moments of fiscal stress (when a case for urgent reform can be
made), and implement reforms progressively rather than as short, sharp shocks.
Successful energy subsidy reform requires a package of measures that must be planned and
implemented over an extended period. Planning allows the government to inform and consult with key
stakeholders, develop and scale up compensatory measures, monitor impacts, and adjust program
design. A recent study of petroleum subsidy reforms in Yemen argues that a gradual, phased approach
will tend to have less severe adverse impacts on poverty and short-term growth, largely because this
approach allows households and firms to adapt and compensatory measures to be put in place.69
Subsidy reforms may also need to be tied to structural measures to improve energy sector performance,
so that the quality of service improves as prices rise. This may include measures to strengthen
competition in fossil fuel markets and unbundled segments of the energy system; use of performance
targets and incentives to improve the performance of State-Owned Enterprises; and targeted
investments to address constraints in generation, transmission and connection.
Transparency, communication and consultation facilitate successful of reforms. Comprehensive
reporting of subsidies in the budget and in financial statements is an important step, ensuring that the
legislature and the media are aware of their cost. Communications can be used to make the case for
subsidy reform by identifying the beneficiaries and the opportunity costs of subsidies in terms of public
services. In Nigeria, the government announced a Subsidy Reinvestment and Empowerment Program
prior to its January 2012 petroleum price increase and indicated how the funds released from subsidies
would be used to tackle poverty and support development programs. Providing information on
compensatory measures and how these will be delivered, who will benefit, and the level of transfers can
address concerns among the poor that they will lose out. Educating the media and ensuring effective
media coverage is critical, and consultations with key stakeholders can help build trust. Niger
established a consultation committee with key stakeholders to discuss the reform strategy prior to
67
Vagliasindi, M. (2013). Implementing Energy Subsidy Reforms. Evidence from Developing Countries. World Bank. 68
Victor, D. (2009). The Politics of Fossil Fuel Subsidies. International Institute for Sustainable Development. 69
Breisinger, C., W. Engleke, and O. Ecker (2011). Petroleum Subsidies in Yem: Leveraging Reform for Development. International Food Policy Research Institute.
47
launching reform measures. Others have established permanent stakeholder consultation arrangements
(e.g., Namibia’s Energy Council) to advise on reforms and price deregulation.
Compensatory measures will be needed to ensure that reforms do not adversely affect the poor and
to mobilize political support. IMF (2013)70 reports that 18 of the 28 reform cases it studied were
accompanied by targeted compensation; nine involved the introduction or scaling up of existing cash
transfer programs. Cash and near-cash transfer programs have a strong track record in effectively
targeting funds to the poorest households, adjusting funding to address shocks and demonstrating
flexibility in scaling up.71 These programs are likely to be the most cost-effective means of compensating
the poor from the short and long-term impacts of subsidy reform. They are also likely to be the most
efficient, since they allow households to decide how they wish to use their income (as opposed to
subsidizing energy consumption). The design of transfers has to resolve the tradeoffs between the
distribution of benefits between poor and non-poor households, the materiality of the transfer (i.e., the
amount of the subsidy received by the poor in relation to their household incomes), and political
interest in securing broad support for reforms. In implementing its Targeted Subsidies Reform Act of
2010, the Government of Iran opted for broad coverage, announcing that all Iranians living in the
country were eligible for monthly cash payments. These transfers exceeded the 50 percent of revenues
generated through removal of fossil fuel prices originally allocated to in-cash and in-kind payments. In
the 2012-13 budget, this allocation was increased to 80 percent of earmarked revenues.72
Where specific energy subsidy programs are retained, these can be structured in such a way as to
improve efficiency and cost-effectiveness. Box 1.7. provides an overview of downstream energy subsidy
programs and assesses them against their expected poverty reduction performance and the extent to
which they are likely to increase fiscal risks and enable the government to exit from the program. While
life line, increasing block tariffs, and volume-based tariffs can be designed to target poverty, the
fundamental problem is that they treat electricity as a merit good and fail to take into account
externalities. Free or heavily subsidized electricity, for instance, may encourage households to cook with
electricity rather than LPG (which is cheaper and may generate lower emissions).
70
International Monetary Fund (2013). Energy Subsidy Reform: Lessons and Implications. 71
Garcia, M. and C. M. T. Moore (2012). Cash Dividend: The Rise of Cash Transfer Programs in Sub-Saharan Africa. World Bank. 72
Hassanzadeh, E. (2012). Recent Developments in Iran's Energy Subsidy Reforms. Policy Brief (ed.) International Institute for Sustainable Development.

48
Box 1.7. Targeting Energy Subsidy Programs for the Poor
Subsidy Mechanism Energy Source
Addresses Access
Benefit Incidence
Materiality Fiscal Risk Exit
Universal consumer subsidy All No Low Low High Difficult
Price caps and controls All No Low Low High Difficult
Lifeline and increasing block tariffs Electricity No Moderate Low Moderate Difficult
Volume differentiated tariff Electricity No High Moderate Low Moderate
Connection subsidy Electricity Yes High Moderate Low Easy
Price controls and caps are generally used for petroleum products which are highly volatile, transferring upside risk from consumers to the government. As a form of universal subsidy, price controls are poorly targeted. They are difficult to exit owing to the broad base of beneficiaries.
Lifeline and Increasing Block Tariffs (IBTs) can be used in relation to grid systems where consumption is metered. Tariffs increase with increased consumption. All consumers benefit from tiered pricing. Poverty targeting depends on adequate connectivity. Where connectivity is near universal, studies have shown that tiered pricing does improve progressivity.
Volume Differentiated Tariffs differ from IBTs in that each customer class pays only one rate per kwh, so that large consumers do not benefit from the lower rates paid by the low volume users. Again, poverty targeting depends on connectivity but is more effective than IBTs since the smaller number of beneficiaries allows greater materiality. The narrow base of beneficiaries reduces risk exposure.
Connection subsidies cover part of the costs of connection to the grid. Effectiveness of targeting will depend on the extent to which better-off households are already connected, though subsidies can be targeted geographically to exclude most better-off households. In principle, connection subsidies are self-eliminating as connectivity improves. However, marginal connection costs may increase over time as connections are made to more inaccessible locations. Use of performance-based contracts may assist with cost control. The number of connections can be scaled in line with available resources without a continuing commitment to users.
Targeting can be further improved by limiting the subsidies to specific areas (Colombia), means-testing beneficiaries (Argentina), or limiting subsidies to critical periods (winter heating allowances in Georgia).
Sources: World Bank (2010). Subsidies in the Energy Sector: An Overview; Komives, K. et al. (2009). Residential Electricity Subsidies in Mexico: Exploring Options for Reform and for Enhancing the Impact on the Poor; Vagliasindi, M. (2012). Implementing Energy Subsidy Reforms: An Overview of the Key Issues.
Subsidization of access to energy is likely to be the most cost-effective pro-poor intervention in much
of the developing world. Electricity is rationed in most developing countries as a result of poor grid
coverage: 1.6 billion people do not have access to electricity in their homes and 2.5 billion people rely
on biomass (wood and agricultural residues) to meet cooking and other energy needs. Lack of access to
electricity impacts on health and educational outcomes and economic opportunity.73 Use of biofuels,
meanwhile, can have adverse environmental impacts through deforestation, increased GHG emissions,
and emissions of black carbon. Evidence suggests that the rural poor are willing to pay for improved
73
Birol, F. (2007). Energy Economics: A Place for Energy Poverty in the Agenda? The Energy Journal, 28 (3), pp. 1-6.

49
services in the order of $3-10 kwh. In this context, subsidies directed at reducing up-front capital costs
(generation, transmission, and connection) to expand access may be more effective pro-poor
interventions than subsidizing operating costs and consumer prices .74
From an economic perspective, the longer-term goal should be to liberalize energy prices so that they
are set by the market, making judicious use of taxes and subsidies to address externalities, equity, and
distributional concerns. There are risks to liberalization. Market failures may create opportunities for
energy suppliers to generate rents. To address this risk, some countries have established automatic
pricing mechanisms for petroleum products and electricity to ensure that domestic prices are linked to
an appropriate market reference. Giving autonomous regulatory authorities responsibility for
administering the pricing mechanism can keep it at arms-length from government.75 Regulators will
typically include representatives of industry and consumers. However, pricing mechanisms are put
under pressure as soon as there are sharp price increases in international markets. Several countries
that have established pricing mechanisms have suspended them when faced with sharp increases in oil
prices. Countries have sought to address volatility by incorporating smoothing rules which pass through
increases in international prices gradually, with the government subsidizing energy during the transition.
This can lead to the accumulation of substantial contingent liabilities for government .76
In principle, energy taxes should reflect the social costs of the externalities that the use of that source
of energy causes. In this way, energy taxes send a price signal to consumers that forces them to
internalize the cost of externalities and encourages them to change their patterns of consumption. This
tax should be tied as closely as possible to the externality that it is trying to address, with a view to
maximizing the impact on behavior rather than maximizing the revenue yield. In the case of vehicle
fuels, for example, there are several pollutants that the government may wish to discourage (such as
those with high levels of particulates and GHG emissions). Emissions of these pollutants can be
discouraged by taxing fuels in relation to the quantity of the pollutant that they emit. In practice,
governments tend to roll all externalities into a single fuel tax to simplify administration, usually
distinguishing between taxes on fuels for vehicles and fuels for other purposes, so that the tax reflects
specific externalities generated by vehicle use (such as congestion and accidents). Complementary
congestion charging can be introduced by local authorities (see Box 1.8). Ideally, fuel taxes are
administered as an excise, charged per unit (since the cost of externalities does not vary with the cost of
the fuel) and administered across all consumers before final sales taxes, such as VAT.77
In practice, energy tax regimes and effective tax rates vary considerably across and within countries.
Overall effective tax rates on energy across OECD member states range from €0.18 per Gigajoule (GJ) in
Mexico to €6.58 in Luxembourg, with a weighted average of €1.77. Effective tax rates are significantly
74
Kammen, D. and C. Kirubi (2008). Poverty, Energy and Resource Use in Developing Countries: Focus on Africa. Annals of the New York Academy of Sciences, Issue 1136, pp. 348-357. 75
Besant-Jones, J. E. (2006). Reforming Power Markets in Developing Countries: What Have We Learned? Discussion Paper No. 19. World Bank. 76
International Monetary Fund (2013). Energy Subsidy Reform: Lessons and Implications. 77
Gillingham, R. and M. Keen. Forthcoming. Mitigation and Fuel Pricing in Developing Economies. In Fiscal Policy and Climate Change: A Guide for Policy Makers, eds. R. D. Mooij, I. W. Parry, and M. Keen. International Monetary Fund, pp. 103-126.
50
higher for vehicle fuels than for fuels for other uses, but effective tax rates are distorted in other ways
(with preferences for industries and fuel types). OECD notes that this largely reflects the piecemeal
development of tax regimes. The EU has sought to systematize the tax structure by mandating minimum
tax rates for specific fuel types. Countries with the highest and most consistent rates across fuel types
are those EU countries that have introduced specific carbon taxes, which typically are introduced
alongside other fuel taxes based on energy content. The countries with the lowest effective tax rates are
in the Americas, where only vehicle fuels are taxed. Effective tax rates for carbon vary from €2.80 per
tCO2 in Mexico to €107.28 per tCO2 in Switzerland, with a weighted average of €27.12.78
Box 1.8. Congestion Charge
Singapore, Hong Kong, London, Riga, Valleta, Milan, and Stockholm have all introduced charges for vehicles entering specific zones in their city centers in order to reduce pollution and discourage vehicular traffic (and improve transit times for remaining road users, buses, and taxis). Evidence from London, Singapore, and Stockholm indicates that congestion charging has led to 13-30 percent cuts in traffic, 15-20 percent cuts in GHGs, and significant reductions in ozone and fine particulate pollution, the principal causes of poor urban air quality. Studies have shown that the introduction of congestion charging has had no impact on retail sales in the city center (Stockholm) or on economic growth (London). Passenger traffic is simply relocated to mass transit systems. The net revenues generated from congestion charging are typically earmarked to finance improvements in these systems (Pike 2010). Multiple technologies have been shown to be effective, offering flexibility in implementation. Convenient payment systems are also available. Pricing can be adpated to meet the needs of the municipality, offering exceptions for zero emissions where the principal objective is pollution control (Milan and London), and greater differentiation in pricing according to vehicle type (and when, where, and how much it is driven) if the principal objective is congestion control (Singapore and Hong Kong).
The problem for municipal authorities seeking to introduce congestion charging is that it is unpopular. The United Kingdom’s Transport Innovation Fund sought to promote congestion charging at a city level by offering grant and loan financing. Several municipalities applied for funding; the largest was Greater Manchester, where the central government offered the municipality a $4.5 billion package to support congestion charges and mass transit system improvements. When put to a referendum in December 2008, however, voters rejected the proposals by four to one. Proponents of congestion charging stress the importance of having mass transit systems in place up-front to carry passengers displaced from the roads. When this is the case, vehicles will already carry a relatively small share of passenger traffic. In London, for example, only about 10 percent of peak-period trips were made by private automobile (Litman 2011). It is a lot easier to persuade citizens that congestion charging is an equitable solution to an urban traffic crisis when congestion and pollution are caused by only a small proportion of passengers and these affected have access to a low cost and good quality alterntive means of transport.
1.5. MITIGATION POLICY CHALLENGES: CARBON PRICING
Carbon pricing is the most efficient and potentially most effective mitigation policy instrument.
Carbon pricing forces producers and consumers to internalize some of the costs of environmental
damage caused by the emissions they generate. This creates market signals throughout the economy
and incentives for reductions in emissions. Producers will improve their energy efficiency and chose less
emissions-intensive inputs and production processes (producing electricity with gas or wind instead of
coal). Consumers will reduce consumption (cycling to work and turning off air conditioning) and select
goods that are less emissions-intensive (energy efficient appliances). This in turn encourages innovation
78
OECD (2013). Taxing Energy Use: A Graphical Analysis.

51
in less emissions-intensive products and production processes. There is ample evidence that carbon
pricing has a significant impact on energy efficiency and emissions reduction without imposing adverse
impacts on economic performance and firm exit.79
Carbon pricing can be introduced using a carbon tax or a cap-and-trade scheme. A carbon tax is applied
upstream in the fuel supply in proportion to the carbon content of each fuel. Firms and households may
generate as many emissions as they wish. Consequently, under a carbon tax the carbon price is fixed but
the emissions reductions achieved is uncertain. Cap-and-trade schemes set a ceiling on the amount of
emissions permitted for an economy. Emissions permits, or allowances, are then distributed among
producers, ideally through an auction process. Emitters can buy additional emissions permits, when that
is more cost-effective than reducing emissions, and sell emissions permits they don’t need through the
market. The price of emissions permits will change depending on supply-and-demand conditions.
Consequently, under a cap-and-trade scheme the carbon price is uncertain but the number of emissions
reductions achieved is fixed. Box 1.9 provides an overview of the current status of carbon pricing
schemes in both developed and developing countries. Some of the design considerations that impact on
the effectiveness of these instruments are reviewed below.
The coverage of the carbon pricing regime is largely determined by the choice of instrument. The
more comprehensive the coverage, the less scope for distortions induced by differentials in pricing and
the more efficient the adjustment is likely to be. No carbon pricing scheme is universal, however, and
governments have to strike a balance between coverage and administrative costs. For carbon taxes, the
most efficient way to apply carbon pricing is upstream in the supply chain, where there are a relatively
small number of operators and there are already mechanisms in place to recover fuel excises and taxes.
This ensures that the tax base includes all fossil fuel users. However, other sources of GHG emissions
from chemical processes, agriculture, forestry, and solid waste are excluded. Cap-and-trade schemes
have to apply carbon pricing downstream at the point of emission. Emitters have to be identified and
monitored, a registry of emissions permits established, and a market put into operation. The
administrative burden is thus significantly higher. Cap-and-trade schemes generally target industries
such as energy production and corporations and plants that are major emitters. Consequently, coverage
is likely to be greater under a carbon tax than under a cap-and-trade scheme. Coverage will depend on
the concentration of emissions; where a relatively small number of emitters account for a large
proportion of emissions coverage, the coverage under a cap-and-trade scheme is likely to be high.
California’s scheme covers 350 businesses and 85 percent of GHG emissions; the EU Emission trading
scheme (EU ETS) covers 11,000 businesses and just 45 percent of the EU’s total GHG emissions.
The impact of carbon pricing will vary between sectors and businesses. The key determinants will be
the energy intensity of production and the type of fossil fuel being used to generate energy. Carbon
contents differ markedly. For example, at a carbon price of $25 per tCO2, the effective cost of carbon per
kwh will be $0.013 for coal, $0.010 for fuel oil, and $0.007 for natural gas. Sectors and businesses that
are unable or slow to shift to less emissions-intensive production processes will find their production
costs increasing. Cost increases will impact on competiveness and bottom lines, particularly in trade-
79
World Bank (2011). Green Growth: The Pathway to Sustainable Development.

52
exposed sectors where there is little room to pass on increases in production costs to consumers. These
impacts will obviously generate political resistance to carbon pricing in the absence of government
counterbalancing measures.
Box 1.9. Carbon Pricing Schemes
Country Name Start Phase
Carbon Tax
Cap-and-Trade
Geographical Scope
Industry & GHG Emissions Coverage
European Union
Emissions Trading Scheme
2005 ******
Supra-National (30 countries)
Power, oil, and major emitters 45% GHG emissions
Canada British Colombia Carbon Tax Program
2008 ******
Regional (1 Province)
Fossil fuels
New Zealand Emissions Trading Scheme
2008 2010
****** National Forestry, energy, industry, and
transport
USA Regional Greenhouse Gas Initiative
2009 ******
Regional (10 States)
Power plants
Japan Tokyo Emissions Trading Scheme
2010 ******
Regional (Metropolitan)
1,400 largest emitters
Australia Carbon Price Mechanism
2012 2015
******* ****** National Fossil fuels (500 major
emitters) 60% GHG emissions
Canada Quebec Cap-and-Trade System
2013 2015
****** Regional
(1 Province) Power, transport, and construction
USA California Emissions Trading Program
2013 2015
****** Regional (1 State)
Power, industry, and transport 85% GHG emissions
Kazakhstan National Allocation Plan
2013 *******
National Oil, gas, energy, and metallurgy 80% GHG emissions
India Perform, Achieve and Trade
2014 *******
National 477 installations, power, and industry 40% primary energy
China National Emission Trading Scheme
2015 ******
National 7 pilot schemes in cities and provinces from 2013
South Korea Emissions Trading Scheme
2015 ******
National Major emitters 60% GHG emissions
South Africa Carbon Tax ******* National Fossil fuels
Notes: India’s Perform, Achieve, and Trade system seeks to achieve improvements in energy efficiency—consistent with its climate change target—rather than reductions in GHG emissions. Firms that exceed energy efficiency targets will be able to sell excess energy saving certificates.
Table excludes voluntary emissions trading schemes such as the proposed Thailand Voluntary ETS (scheduled for a 2014 launch) and Mexico’s plan under its June 2012 General Law on Climate Change.
Sources: Based on World Bank (2012); Han et al. (2012); and Ali Khan et al. (2011).
Governments have used a variety of mechanisms to avoid price shocks and to reduce the adverse
impacts of carbon pricing on the most vulnerable firms. Targeted exemptions have been offered to
some cost-sensitive industries, whereby the industries simply do not participate in the carbon pricing
scheme. An alternative approach has been to gift emissions permits. Under a carbon tax, emissions are
only taxed above a threshold. In a cap-and-trade scheme, the government gives firms some emissions
permits free of charge. This practice has been widely used in the European Trading Scheme. Studies
have shown some firms have passed on part of the notional cost of gifted emissions permits to
53
consumers, allowing them to earn windfall profits. The practice now is to reduce the scope for gifting
provisions. Under the EU ETS, at least 40 percent of emissions permits will be auctioned in Phase Three
starting January 1, 2013, with a view to transitioning to full auctioning by 2027.80 Auctioning will
strengthen the incentives to shift to lower carbon fuels, particularly from coal to gas, but it will also lead
to an increase in electricity prices as part of the costs are shifted to consumers. Since industrial
electricity prices are already significantly higher in the largest EU countries, there are concerns that
energy intensive industries (e.g., cement, copper, and aluminum) may simply move outside the EU to
jurisdictions with less stringent environmental requirements. This would undermine the effectiveness of
the trading scheme through leakage, since carbon intensive products are still consumed (they are just
imported rather than produced domestically), and would have economic consequences.81
Carbon pricing can generate significant government revenues. Carbon taxes can be collected through
existing tax administration systems. In the case of cap-and-trade regimes, revenues are generated from
the government’s initial sale of emissions permits (consequently, any gifted emissions permits will be at
the expense of revenues). The revenue yield will depend on the economic base of the pricing scheme,
the carbon price, and the underlying elasticities. Elasticity is determined by the marginal cost of
abatement: emitting firms will chose to reduce emissions as long as their marginal cost of abatement is
lower than the carbon tax or emissions permit price, and will chose to pay the tax or buy permits once
the marginal cost of abatement is above the level of the tax or the price of a permit. Governments
would also need to decide on the level of abatement they wish to achieve, using a marginal abatement
cost curve for the economy to forecast revenues realized and the reductions achieved by a given level of
tax or cap on emissions. They can then adjust tax rates or the availability of permits as needed to bring
emissions and revenues in line with targets. The potential revenue yields are substantial. Figure 1.1
shows estimated revenues from $20/t CO2 in the twenty largest economies in 2009. The tax revenues
were largest as a share of GDP in the countries which were the least energy efficient (in terms of energy
use per dollar of GDP) and largest as a share of government revenue in countries which combine low
energy efficiency with low fiscal revenue mobilization. Revenue yields at $20/t CO2 are generally in the
range of 1-2 percent of GDP, and over five percent of total government revenue in China, India, Russia,
Korea, Mexico, Indonesia, Saudi Arabia, and South Africa.
The manner in which revenues are applied has important implications for the overall cost of carbon
pricing schemes. Governments have to determine whether to spend or rebate revenues derived from
carbon pricing. In high-income countries, where domestic revenue mobilization is already high and tax
fatigue is a potent political issue, discussion has focused on replacing revenues from the most distorting
tax instruments, such as payroll taxes, with revenues from carbon pricing. While this approach aims at
fiscal neutrality, such an approach will generally also be welfare-improving since there are increased
taxes on negative factors (GHG emissions) and reduced taxes on “positive” factors (such as labor, or
capital or corporate profits). Scaling back taxes can also be used to mobilize support for carbon pricing
policies. In Australia, for example, carbon pricing was accompanied by an increase in personal income
80
European Commission (2013). The EU Emissions Trading System. 81
Frondel, M., C. M. Schmidt, and C. Vance (2012). Emissions Trading: Impact on Electricity Prices and Energy-Intensive Industries. Interecomomics, Volume 2, pp. 103-111.
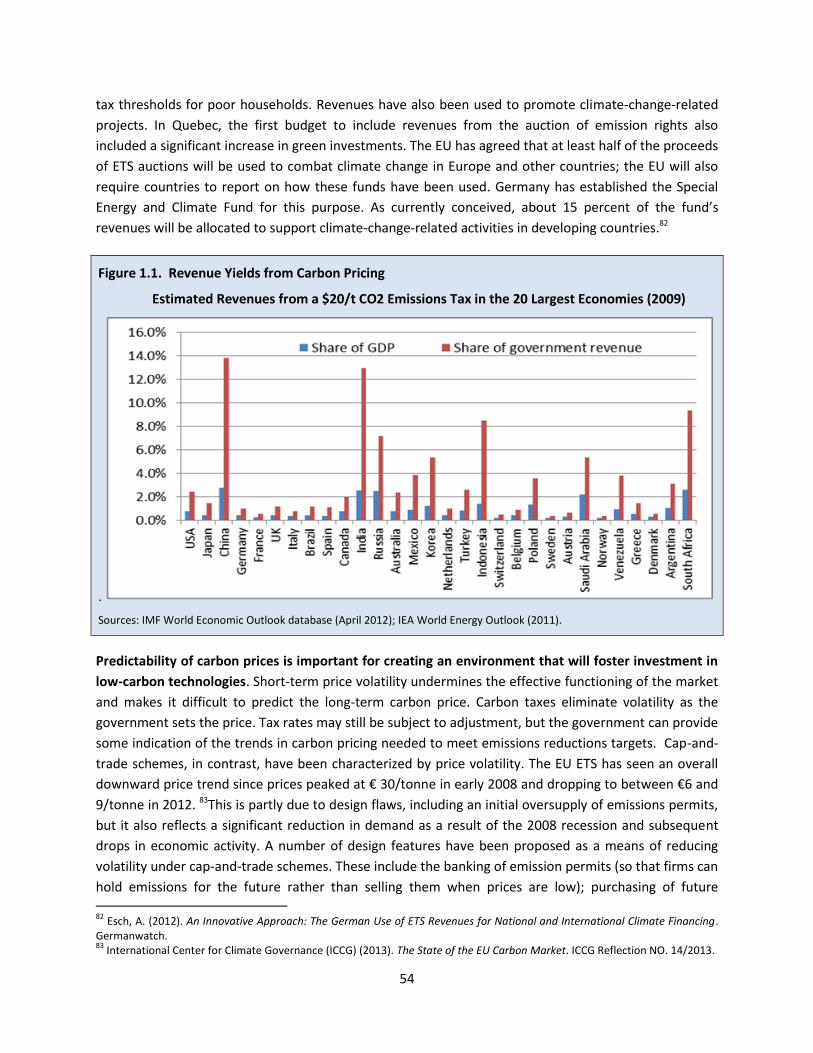
54
tax thresholds for poor households. Revenues have also been used to promote climate-change-related
projects. In Quebec, the first budget to include revenues from the auction of emission rights also
included a significant increase in green investments. The EU has agreed that at least half of the proceeds
of ETS auctions will be used to combat climate change in Europe and other countries; the EU will also
require countries to report on how these funds have been used. Germany has established the Special
Energy and Climate Fund for this purpose. As currently conceived, about 15 percent of the fund’s
revenues will be allocated to support climate-change-related activities in developing countries.82
Figure 1.1. Revenue Yields from Carbon Pricing
Estimated Revenues from a $20/t CO2 Emissions Tax in the 20 Largest Economies (2009)
.
Sources: IMF World Economic Outlook database (April 2012); IEA World Energy Outlook (2011).
Predictability of carbon prices is important for creating an environment that will foster investment in
low-carbon technologies. Short-term price volatility undermines the effective functioning of the market
and makes it difficult to predict the long-term carbon price. Carbon taxes eliminate volatility as the
government sets the price. Tax rates may still be subject to adjustment, but the government can provide
some indication of the trends in carbon pricing needed to meet emissions reductions targets. Cap-and-
trade schemes, in contrast, have been characterized by price volatility. The EU ETS has seen an overall
downward price trend since prices peaked at € 30/tonne in early 2008 and dropping to between €6 and
9/tonne in 2012. 83This is partly due to design flaws, including an initial oversupply of emissions permits,
but it also reflects a significant reduction in demand as a result of the 2008 recession and subsequent
drops in economic activity. A number of design features have been proposed as a means of reducing
volatility under cap-and-trade schemes. These include the banking of emission permits (so that firms can
hold emissions for the future rather than selling them when prices are low); purchasing of future 82
Esch, A. (2012). An Innovative Approach: The German Use of ETS Revenues for National and International Climate Financing. Germanwatch. 83
International Center for Climate Governance (ICCG) (2013). The State of the EU Carbon Market. ICCG Reflection NO. 14/2013.

55
emissions permits (so that firms can purchase at low prices to set against future emissions); and
borrowing against future emissions permits (anticipating higher future prices). Government
interventions may also help stabilize the market. Governments can establish a price collar, selling
additional emissions permits when the price hits a predetermined ceiling and buying back permits when
the price reaches a predetermined floor. The Government of Australia has proposed a floor price for the
first three years of its emissions trading scheme.
While the literature argues in favor of the introduction of carbon taxes before establishing a cap-and-
trade scheme, there are a wide range of country experiences. Carbon taxes are relatively
straightforward to design and administer. Cap-and-trade schemes, on the other hand, are
administratively complex. They require systems for measuring emissions, a legal infrastructure with
clearly defined emissions rights, permit allocation systems, trading rules, monitoring, and enforcement.
Due to this complexity, cap-and-trade systems have had to evolve through adaptive learning, addressing
design flaws as they are identified. For these reasons, the World Bank has advised developing countries
to first consider carbon taxes before putting in place a cap-and-trade scheme.84 Australia has followed
this approach, introducing a carbon tax in 2012 prior to establishing a cap-and-trade system to begin in
2015. South Africa has also proposed a carbon tax. China, however, has chosen to move directly toward
cap-and-trade systems, moving cautiously though by starting with systems in six major cities—and with
the intention of scaling up to the national level in 2015.85 In practice, carbon taxes and cap-and-trade
schemes can be complementary. In several European Union countries, carbon taxes are used to set
carbon prices for smaller, widely distributed sources of emissions such as households and transport,
while the EU ETS sets prices for the largest emitters. Australia plans to adopt a similar regime.86
The effectiveness of carbon pricing regimes in achieving their emissions reductions objectives will
depend in large part on the structure of the energy market. Carbon pricing is unlikely to be effective
where market signals do not drive behavior. Carbon prices simply may not offer sufficient incentives for
firms to change their investment plans. A study of the German energy sector argues that a carbon price
of €40 would be needed to encourage investors to shift from coal to gas. Since investors have little
confidence that the market will reach that price, planned capacity from coal outstrips gas by five to one.
In many other countries, market distortions undermine the effectiveness of price signals. Distortions
include the prevalence of energy subsidies; government interventions in energy pricing (particularly for
politically sensitive products such as electricity and vehicle fuels); energy rationing (due to production
and transmission capacity constraints); and domination of the sector by state-owned enterprises (some
of which may be vertically integrated, with electricity plants linked to the coal mines that supply their
fuel).87 All of these distortions hinder the effective transmission of market signals.
Consequently, while carbon pricing as a market instrument is generally seen as the backbone of an
efficient mitigation regime, regulatory and other non-pricing policy approaches can play an important
84
World Bank (2010). Climate Change and Development. 85
Han, G., M. Olsson, K. Hallding, and D. Lunsford, D. (2012). China’s Carbon Emission Trading. An Overview of Current Development. Stockholm Environment Institute. 86
Tom Tietenberg (2013). Carbon Pricing: Lessons Derived From Experience. 87
World Bank (2011). Climate Change and Fiscal Policy: A Report for APEC.

56
role. Standards and other regulations may usefully apply in sectors such as agriculture, where emissions
pricing is impracticable because of measurement issues at the business level. Standards and regulations
may also usefully promote greater energy efficiency in end-use applications (where price signals cannot
overcome the hurdles to adoption of efficient technologies); in dealing with agency problems (where
those who are able to reduce emissions do not exercise this option because they would not benefit from
doing so); and in transport (where land use planning and public investment in infrastructure may be the
most important mechanisms for climate change mitigation).
1.6. MITIGATION POLICY CHALLENGES: ADOPTION OF LOW-CARBON TECHNOLOGIES
Clean technology innovation is concentrated in developed economies and a handful of emerging
markets. A recent study of 13 clean technologies, drawing on worldwide patent data, found that
developed countries accounted for over three -quarters of clean technology patent registrations from
2000-2005, with just three countries (Japan, Germany, and the United States) accounting for 60 percent
of inventions. Government-funded research and environmental and climate regulations play an
important role in driving innovation in these countries. The pace of innovation has accelerated since
2000, particularly in Annex I countries that are party to the Kyoto Protocol. A few developing countries
are emerging as important players (notably China, which accounted for nine percent of clean technology
inventions from 2000-2005, but with Brazil and Russia also among the top 12). Innovations are driven by
domestic market requirements (e.g., energy efficiency for heavy industry technology and biomass) as
well as by technologies targeting export markets (e.g., photo-voltaic cells).88
Technologies are typically deployed in high-income countries first and then diffused through trade,
foreign direct investment, and licensing agreements as corporations seek export markets, investment
opportunities, and improvements in the efficiency of their worldwide operations. Data on registrations
of patents outside of the country of origin indicate that industrialized countries tend to benefit from
most of this technology transfer, with 73 percent of foreign patent filings for clean technology between
OECD countries. Developing countries, however, are more important as a destination of technology
transfer than as a source, with patent filings from OECD countries to non-OECD countries accounting for
22 percent of global filings, three-quarters of these in China; this compares to only four percent patent
filings from non-OECD to OECD, and just one percent between non-OECD countries.89 Technologies are
transferred to most developing countries toward the end of their diffusion path, when they are already
the industry standard in other markets.
Foreign direct investment data paints a similar picture, with the bulk of private sector, low-carbon
investment in industrialized countries and emerging markets. IFC estimates that global low-carbon
investment amounted to about $550 billion in 2010. Investment is concentrated in the energy sector,
with renewable energy accounting for over 40 percent of total low-carbon investment (mostly wind and
solar power) and investments in energy efficiency and low-carbon transport accounting for the rest.
Investments in agriculture and forestry are negligible. About 40 percent of low-carbon investments were
88
Dechezleprêtre, A. et al. (2011). Invention and Transfer of Climate Change–Mitigation Technologies: A Global Analysis. Revue of Environmental Economic Policy , 5(1), pp. 109-130. 89
Ibid.
57
in developing countries. This investment is concentrated, however, in a small number of emerging
economies. China accounted for close to two-thirds of the investments in developing countries, with
Brazil, India, Mexico, and Turkey accounting together for close to one-fifth (IFC 2011).90 Again, the
majority of developing countries are marginal to these flows. This is particularly true of the Least
Developed Countries. Data is unavailable for FDI Foreign Direct Investment (FDI) in low-carbon
industries in LDCs, but LDCs account for just three percent of global FDI flows for all sectors; much of this
flow is concentrated in a small number of resource-rich countries.91
Developing countries can accelerate the adoption of low carbon technologies by adopting supportive
policies. Foreign direct investment in clean technologies is drawn to the largest, most dynamic markets
that offer the greatest sales potential for low-carbon products and have growing demand for energy.
Natural resource endowments can also play a role; some developing countries may offer ideal
conditions for the deployment of solar, wind, and biomass technologies while others may not. FDI is also
influenced, however, by the policy environment in which firms operate. Countries that have policy and
regulatory environments that are supportive of the private sector tend to attract more foreign
investment than those that do not.92 Supportive policies are particularly important for low-carbon
development. Firms may be expected to adopt energy-efficient technologies simply to reduce their
operating costs without consideration of the impact on emissions. In the absence of policy support,
however, they will tend to underinvest in these technologies as they are not being compensated for the
environmental benefits that they generate. Other low-carbon technologies may not be commercially
viable under current market conditions. They may be more expensive than existing, high-carbon
technologies owing to the need for substantial up-front investments or higher maintenance and
operating costs. They may entail risks associated with market adoption and availability of technical
capacity. Thus, in order to promote low carbon technologies, governments will often have to intervene
so as to improve the commercial, risk-adjusted return.
Governments promote low-carbon technologies using a combination of supply side and demand side
interventions with regulatory, market-based, and fiscal policy instruments. Figure 1.2 provides an
overview of the principal policy tools and how they have been applied to promote various low-carbon
technologies. From an economic perspective, interventions that promote particular technologies are
less efficient than market-wide interventions (e.g., carbon pricing). Market-wide interventions
encourage producers and consumers to choose the most cost-effective way of reducing emissions
among all alternatives. Technology-specific interventions, on the other hand, direct producers and
consumers to a particular solution and offer no incentive to explore other opportunities to reduce
emissions. Fuel efficiency standards, for example, will force motorists to purchase more fuel-efficient
cars but may delay purchase of new, more efficient vehicles by increasing their price; at the same time,
this strategy offers no incentive for motorists to reduce fuel consumption—indeed, it may encourage
90
International Finance Corporation (2011). Climate Finance: Engaging the Private Sector. A background paper for “Mobilizing Climate Finance. A Report Prepared at the Request of G20 Finance Ministers.” 91
UN Conference on Trade and Development (2010). World Investment Report 2010: Investing in a Low Carbon Economy. 92
World Bank and IFC (2012). Doing Business 2013 Case Study: Does Doing Business Matter for Foreign Direct Investment?
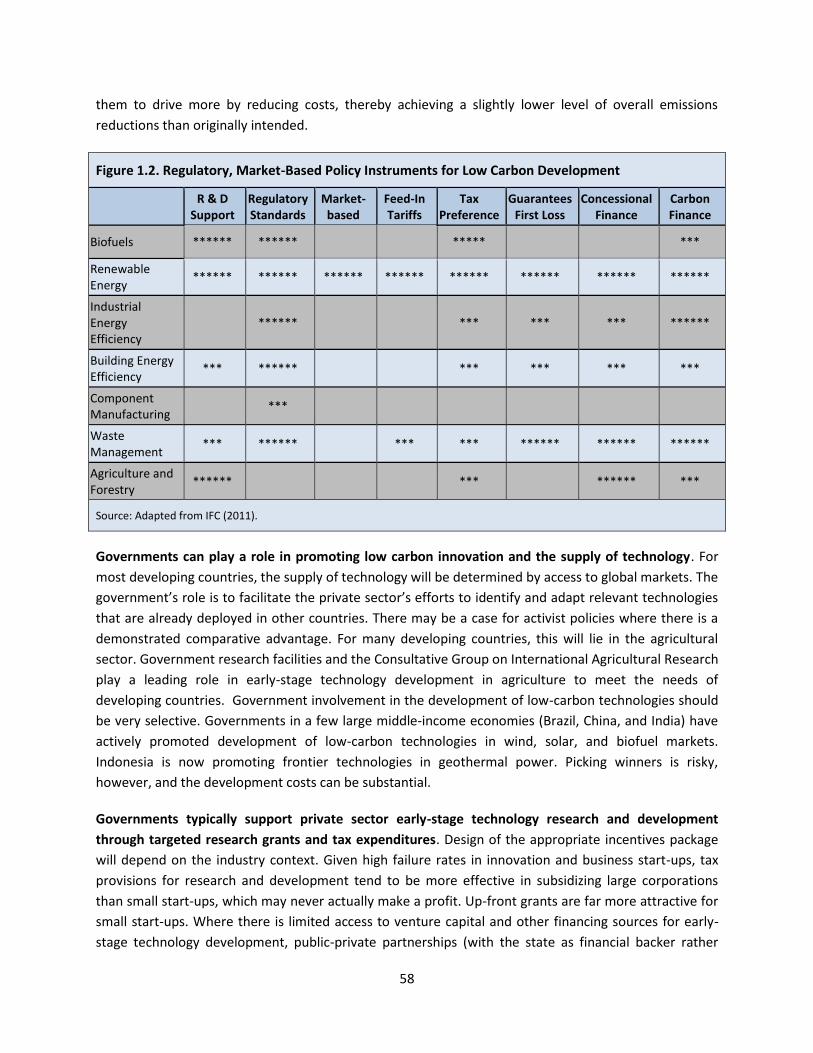
58
them to drive more by reducing costs, thereby achieving a slightly lower level of overall emissions
reductions than originally intended.
Figure 1.2. Regulatory, Market-Based Policy Instruments for Low Carbon Development
R & D
Support Regulatory Standards
Market-based
Feed-In Tariffs
Tax Preference
Guarantees First Loss
Concessional Finance
Carbon Finance
Biofuels ****** ****** ***** ***
Renewable Energy
****** ****** ****** ****** ****** ****** ****** ******
Industrial Energy Efficiency
****** *** *** *** ******
Building Energy Efficiency
*** ****** *** *** *** ***
Component Manufacturing
***
Waste Management
*** ****** *** *** ****** ****** ******
Agriculture and Forestry
****** *** ****** ***
Source: Adapted from IFC (2011).
Governments can play a role in promoting low carbon innovation and the supply of technology. For
most developing countries, the supply of technology will be determined by access to global markets. The
government’s role is to facilitate the private sector’s efforts to identify and adapt relevant technologies
that are already deployed in other countries. There may be a case for activist policies where there is a
demonstrated comparative advantage. For many developing countries, this will lie in the agricultural
sector. Government research facilities and the Consultative Group on International Agricultural Research
play a leading role in early-stage technology development in agriculture to meet the needs of
developing countries. Government involvement in the development of low-carbon technologies should
be very selective. Governments in a few large middle-income economies (Brazil, China, and India) have
actively promoted development of low-carbon technologies in wind, solar, and biofuel markets.
Indonesia is now promoting frontier technologies in geothermal power. Picking winners is risky,
however, and the development costs can be substantial.
Governments typically support private sector early-stage technology research and development
through targeted research grants and tax expenditures. Design of the appropriate incentives package
will depend on the industry context. Given high failure rates in innovation and business start-ups, tax
provisions for research and development tend to be more effective in subsidizing large corporations
than small start-ups, which may never actually make a profit. Up-front grants are far more attractive for
small start-ups. Where there is limited access to venture capital and other financing sources for early-
stage technology development, public-private partnerships (with the state as financial backer rather

59
than manager) may play a role. These policies will have a greater chance of success where the business
environment is attractive to investors, where regulations facilitate the winding up of unsuccessful
ventures, and where the education system provides a supply of technical staff for research.93
Governments can use their positions as strategically important consumers to promote low-carbon
technologies. Box 1.10 identifies some of the procurement policies that support this goal. Government
preferences in favoring energy-efficient products encourage manufacturers to introduce products that
meet government requirements in order to participate in and compete in public tenders. This
encourages households, businesses, and local authorities to adopt similar purchasing practices.
Increased demand for energy-efficient products leads to greater product availability and competition,
encouraging innovation and reductions in prices. In addition, energy efficient procurement is not simply
a low-carbon policy tool. Governments can benefit directly from low-carbon investments that bring
Box 1.10. Climate Change and Government Procurement
Drawing on country case studies, Energy Sector Management Assistance Program (ESMAP) identified the key elements of a successful strategy. These include (1) a clear procurement policy, ideally with energy efficiency as a default option; (2) development of tools, such as lifecycle cost calculators, to help decision makers reduce transaction costs; (3) consideration of behavioral changes through incentives (such as financing to help agencies cover up-front costs); and (4) periodic evaluation to assess costs. The table below outlines the policy measures that can be used to promote energy-efficient procurement and identifies countries that have implemented these policies. Energy efficiency procurement reforms typically have to be driven by central agencies. In China, for instance, the Ministry of Finance and the National Development and Reform Commission took the lead in developing a policy that made energy efficiency procurement mandatory for selected products.
Energy Consumption Labels
Requirement for products purchased to have energy efficient label from certification
program
Australia, China, Japan, Mexico, Republic of Korea
Catalogue Specification
Government catalogue lays out energy efficiency specifications for commonly purchased items
European Union, Japan, Mexico, Sweden, United Kingdom, United States
Lifecycle Costing Price of product calculated as cost over its economic lifetime, including purchase, operations, and maintenance
Australia, European Union, United Kingdom, United States
Preferences Point or price preferences for energy efficiency in bid evaluation
Australia, China, European Union, Republic of Korea, United States
Qualifying Product List Database of products that qualify with energy efficiency standards
China, European Union, Republic of Korea, United Kingdom, United States
Source: Energy Sector Management Assistance Program (ESMAP) (2012). Public Procurement of Energy Efficient Products. Lessons from Around the World.
greater efficiency through lower operating costs. This can have an appreciable impact on GHG
emissions. The public sector is a major energy consumer, typically accounting for 2-5 percent of total
93
World Bank (2011). Green Growth: The Pathway to Sustainable Development.

60
energy consumed; this rises to 20-30 percent in countries with large heating and cooling loads and
countries with limited energy access.
Regulatory standards and supply quotas can be used to create demand. Examples of regulatory
standards include minimum fuel consumption standards for vehicles and energy efficiency standards for
appliances, enforced either at the factory or at the port of entry. Supply quotas are used to promote a
shift toward particular energy types. Regulations mandating the blending of biofuels into the fuel supply
are now in place across the European Union, in 13 countries in the Americas, in 12 countries in Asia and
the Pacific, and in eight countries in Africa. The U.S., China, and Brazil have plans to increase the market
share of biofuels to 15-20 percent in 2020-2022 and India plans to implement a 20-percent ethanol
mandate for gasoline and diesel in 2017 (Lane 2012). Renewable portfolio standards (RPS) follow a
similar approach in mandating that a specific proportion of the electricity supply is from renewable
sources. RPS legislated by U.S. states have proved instrumental in increasing demand for renewables,
particularly wind power. As one would anticipate, forced switching to higher-cost renewables usually
leads to an increase in the overall cost of electricity generation, though in some circumstances these
costs can be offset by a reduction in the price of conventional fuels—and price increases are not always
passed on to consumers.94 As of 2012, 18 countries had adopted the RPS model, including China, India,
and the Philippines.95
Market-based instruments are often used in conjunction with regulatory quotas to improve efficiency.
Renewable Energy Certificates (REC) function in much the same way as emissions permits in a cap-and-
trade carbon pricing system. Generators of renewable power are issued RECs, measured in single
megawatt-hour increments. These certificates generate a stream of revenues in addition to sales of
electricity. RECs can be sold independently of the electricity generated and used by the holder to meet
RPS requirements. Since RECs can be bought and sold as needed, their price fluctuates with market
conditions.96 Use of RECs does not require the government to make choices regarding the type of
renewable energy to develop; instead, these decisions are taken by operators in a national market and
allows them the flexibility to seek out the least costly solutions. Most of the countries that have adopted
regulatory standards for renewable energy have adopted some form of tradable certificate. Evaluations
tend to be positive in terms of the impact on development of renewable industries over the longer-
term, but markets have taken time to develop. India, which introduced RECs in March 2011, has found
the supply response disappointing largely due to financing and other constraints on project
development .97
Feed-In tariffs (FITs) use an alternative approach, improving the competiveness of renewable sources
of electricity through price support. FITs are the preferred instrument for promoting renewable energy:
65 countries had FIT policies in 2012, including three low-income countries and 13 lower-middle income
94
Fischer, C. (2010). Renewable Portfolio Standards: When Do They Lower Energy Prices? The Energy Journal, 31(1), pp. 101-120. 95
Renewables Energy Policy Network for the 21st Century (2012). Renewables 2012 Global Status Report. 96
Environmental Protection Agency (2008). Renewable Energy Certificates. 97
Shrimali, G., S. Tirumalachetty, and D. Nelson (2012). Falling Short: An Evaluation of the Indian Renewable Certificate Market. Climate Policy Initiative and Indian Busines School.

61
countries (including China, India, and Indonesia) (REN21 2012).98 FITs set the energy purchase price
through a long-term purchasing agreement. The purchase price includes a surcharge set in relation to
production costs, with an adjustment mechanism to take advantage of technological changes and cost
reductions over time. This surcharge is usually passed on to consumers. The government may decide,
however, for social policy purposes that only a part of the surcharge should be passed on. In this case,
the government will reimburse the power purchaser for any losses incurred. Germany provides
substantial subsidies to support its FIT regime. Some developing countries, including Ghana, have
proposed a fund that would use external financing to cover the social costs associated with the adoption
of renewable energy. Where the power purchaser is a state-owned enterprise, governments may fail to
fully reimburse the social costs or do so only in part or intermittently. In such case, the FIT surcharge
becomes a hidden subsidy, a quasi-fiscal operation. This can be counter-productive: where cost recovery
from customers is poor and the implementation of FIT is dependent on government transfers, FITs may
not offer the long-term price security that private investors require to invest.99
Governments are often involved in directly financing investments in low carbon technologies.
Rationales for the use of public funds to promote low carbon technologies include addressing market
failures; addressing equity or distributional goals (such as promotion of affordable access for
underserved populations to basic services); and for industrial policy purposes (such as promoting
investment in innovative sectors). Support is typically provided as a package of tax expenditures, grants,
and concessional loans that complement regulatory support. The most extensive range of fiscal
measures in support of low-carbon technologies are found in high-income countries. In these countries,
much of the assistance is back-loaded, with incentives kicking in once production has started. In
developing countries, where access to capital is a constraint on project development, incentives tend to
be front-loaded for investment and during start-up.
Use of tax incentives is widespread. REN21 revealed that 84 out of the 99 countries surveyed offered
tax incentives of some kind for renewable energy. These incentives included capital subsidies, grants, or
rebates; investment or production tax credits; and reductions in sales, energy, or other taxes. Many of
these tax incentives provide benefits over extended periods. The U.S. 2009 American Recovery and
Reinvestment Act, for example, offered tax credits of $22/MWh for the first 10 years of operations for
wind, solar, and geothermal projects in service before the end of 2012.100 This had the effect of bringing
forward many projects, including some that would likely have been marginal without the incentives.
Direct public investment in low-carbon projects can be critical in mobilizing finance. The REN21 survey
indicates that 52 out of the 99 countries surveyed offered some form of direct financing in the form of
grants or concessional loans. For smaller, development-oriented projects (e.g., off-grid village-level
renewable energy systems), public investment may be the only option as private investors or
communities would be unable to mobilize commercial financing for such ventures. The government will
thus typically cover project development costs in these cases. In commercially oriented projects, public
98
REN21 (2012). 99
UN Environment Programme (2012). Feed-in Tarriffs as a Policy Instrument for Promoting Renewable Energy and Green Technologies in Developing Countries. 100
World Resources Institute (2010). Renewable Energy Tax Credits.
62
financing is used to leverage private investment. Direct public investment in these projects is unusual.
Instead, financing comes from national development banks, often on concessional terms with extended
loan maturities. Prominent investors in recent years include Brazil’s BNDES, the China Development
Bank, and dedicated public investment funds such as the Indian Renewable Energy Development
Agency.101
In developing countries, external assistance is an important source of finance for low-carbon
technologies. The IFC and World Bank draw on both core resources and international funds, such as the
Clean Technology Fund, to promote these industries. Financing may include concessional lending to
specific projects or to banks that on-lend to clean technology projects, equity stakes, guarantees, and
risk-sharing products combined with technical assistance. For development finance organizations the
extent to which public investment manages to leverage private financing is an important measure of
success. Reporting to the G20, the international financial institutions estimated leverage factors in the
range of 3-6 for non-concessional lending and 8-10 (or even higher) where the public finance
component is in the form of concessional lending, grants, or equity.102 Financing is structured so as to
maximize this leverage, minimize the public subsidy, and minimize potential market distortions through
public intervention. The IFC, for instance, applies the principle of “minimum concessionality” such that
the subsidy should be no greater than necessary to induce the intended investment.103
The success of these policies depends on investor confidence in policy continuity. Investments in low-
carbon technologies have long maturities. If investors are to undertake such investments, they have to
be confident that policy incentives will remain in place over the long term. Major institutional investors
made this point in the 2011 Global Investor Statement on Climate Change. Policy risk is considered the
most significant risk to investments in clean technology because many of the technologies are not
financially viable without some form of government policy or financial support. Perceptions of risk are
sensitive to changes in policy, and to retroactive changes in policy in particular; indeed, the investors’
report argues that a retroactive adjustment in a solar power purchase agreement in 2010 affected the
confidence in solar power projects internationally not just in the country where the policy reversal took
place.104 The European Commission discourages countries from adopting retroactive measures which
increase perceptions of risk, leading to higher financing costs and ultimately effecting project viability.105
Recognizing that policy risk is perhaps the most significant constraint for investors, some have called for
greater availability of policy risk insurance products to complement those available from the Multilateral
101
UN Environment Programme and Bloomberg (2012). Global Trends in Renewable Energy Investment 2011: Analysis of Trends and Issues in the Financing of Renewable Energy. 102
World Bank, IFC, IMF, and OECD (2011). Mobilizing Climate Finance. A Paper Prepared at the Request of G20 Finance Ministers. 103
IFC (2011). Climate Finance: Engaging the Private Sector. A background paper for “Mobilizing Climate Finance. A Report Prepared at the Request of G20 Finance Ministers.” 104
IIGCC, INCR, IGCC and UNEP-FI (2011). Investment-Grade Climate Change Policy: Financing the Transition to the Low-Carbon Economy. Investors Group on Climate Change; Investor Network on Climate Risk; Investor Group on Climate Change Australia/New Zealand; and the United Nations Environment Programme Finance Initiative. 105
European Commission (2012). Renewable Energy: A Major Player in the European Energy Market.

63
Investment Guarantee Agency and the Overseas Private Investment Corporation.106 This may help
address project risk, but it is a poor substitute for a stable policy environment.
1.7. ADAPTATION POLICY CHALLENGES: PUBLIC INVESTMENT AND PRIVATE SECTOR ACTION
Government intervention is needed on adaptation because of a lack of information in the private
sector, a focus on near-term costs and benefits, an inability to diversify risk, and the externalities of
adaptation actions. The enterprise sector in most developing countries is dominated by a few large
firms along with a large number of very small firms that lack the capacity, information, and financing to
take on a challenge such as adaptation, even as it affects the firm’s own operations. Furthermore, many
areas in need of adaptation action, such as coastal areas requiring protection and ecosystems in need of
conservation, constitute a national public good and/or suffer from high uncertainty that generates large
risks, and so are not attractive for private investment. Private sector participation holds the promise of
generating innovation and efficiency which could lower the costs of adaptation and increase the rate at
which adaptation funding is put to use; even in rich countries, however, widespread action on
adaptation is unlikely without public leadership.
A changing climate affects the reliability of physical infrastructure because of increased severity and
frequency of extreme weather events and reduced predictability of weather patterns. Engineers
design infrastructure to withstand the impacts of weather by balancing the capital costs of building
stronger roads against the cost of more frequent maintenance or partial reconstruction. Now climate
change is altering these calculations. The decision on whether to adapt or wait and repair/replace the
assets after they are damaged is complicated by both uncertainty about future climate projections and
the fact that infrastructure assets are long lived and cannot be easily upgraded. Current climate models
offer a wide range of possible future climate patterns, which complicates the decision to adapt
infrastructure as planners do not know what conditions they should adapt to. This uncertainty gives rise
to the possibility that the up-front investment is wasted if the projected climate impacts do not
materialize or if a different impact is realized. However, because some infrastructure assets are long-
lived and cannot be upgraded easily, the cost of adapting infrastructure up front will be lower than the
cost of doing nothing and relying on O&M or early upgrades to cope with climate impacts.107
Decision making about long-lived investments requires an approach that can handle the risk arising
from uncertainty about future climate patterns. A robust decision process implies the selection of a
project or plan which meets its intended goals across a variety of plausible futures. Such a process
considers the vulnerabilities of a plan (or set of possible plans) to a field of possible variables. A set of
plausible futures is then identified, incorporating sets of examined variables, and the performance of
each plan under each future is evaluated. The final step is to estimate which plans are robust to the
likely futures or otherwise important to consider. Stakeholder dialogue is used to determine which
106
Micale, V., G. Frisari, M. Hervé-Mignucci, and F. Mazza (2013). Risk Gaps: A Map of Risk Mitigation. Climate Policy Initiative. 107
Hughes, Gordon and Urvashi Narain (2014). Does Infrastructure Need To Be Built Differently To Be Climate Resilient? Making Robust Decisions. Technical paper for FYR Macedonia Green Growth Country Assessment. World Bank.

64
project aspects and scenarios to evaluate. There are a variety of methodologies that aim to address
deep uncertainty in investment decision making, including cost benefit analysis, real options analysis,
climate-informed decision analysis, and robust decision making. Robust analyses are distinguished by
allowing the cost-benefit and real option value of a strategy to vary over a wide range of future
conditions.108
1.8. THE ROLE OF REGIONAL AND LOCAL GOVERNMENT
In most countries, responsibility for climate change mitigation and adaptation is spread out across
national, regional, and local governments. The underlying rationale for the division of functional
responsibilities between levels of government is subsidiarity: the idea that responsibility should lie with
the lowest level of administration that is able to fulfill that function effectively. On this basis, activities
that have economies of scale and spillovers across regions (such as functions that impact on commerce
and trade) are best placed with the national government and functions that need to take into account
local conditions and preferences (such as land use planning) are best placed with local authorities. Most
economic and social policy functions of government fall somewhere within this spectrum and are
implemented by either a national, regional, or local governments or some combination of them all.
Cities have a critical role to play in climate change mitigation and adaptation policy because they are
where population and economic activity are concentrated. Around half of the world’s population (3.5
billion people) live in cities today, and urban populations are expected to increase 6.4 billion people (or
70 percent of the world’s population) by 2050. The world’s 50 largest cities, with more than 500 million
residents, generate a combined GDP of $9.6 trillion, second only to the U.S. economy. These 50 cities
also produce more emissions than all countries except the U.S. and China.109 IEA estimates that cities
currently account for about two-thirds of global GHG emissions, rising to three-quarters by 2030. Many
cities are also particularly vulnerable to climate change. Fifteen of the world’s megacities are in low-lying
coastal areas that are exposed to rising sea levels and more intense storm surges. Changes in
ecosystems will impact on urban water supplies, protection against flooding, and landslides. Urban
environments can also intensify heat waves, which worsens the health impacts of local atmospheric
pollution. The urban poor are particularly vulnerable since they typically live in the most exposed
locations and in precarious conditions.
Especially in federal states, regional governments have the power to undertake climate action. The
extent to which regional and local governments have autonomy to act in the areas where they have
functional responsibility is determined by the structure of government and the distribution of authority
and resources between levels of government. These arrangements will be reflected in a constitution or
framework legislation establishing the various levels of administration. In unitary states, there are
regional and local administrations rather than governments: the national government determines policy
and instructs territorial administrations at regional and local level to implement. In federal states,
108
Hallegatte, Stéphane, Ankur Shah, Robert Lempert, Casey Brown, and Stuart Gill (2012). Investment Decision Making Under Deep Uncertainty: Application to Climate Change. The World Bank. 109
World Bank (2010). Cities and Climate Change: An Urban Agenda.
65
regional governments will have exclusive authority over specific functions and share responsibility with
national and local governments in others. The U.S., Canada, Brazil, Mexico, and India assign authority
over the key elements of climate change policy–energy, transport, water, and environmental
management–to states or provinces at the regional level. Regional governments may act independently
of the national government in defining their policy objectives and the extent to which they prioritize
climate change mitigation and adaptation. Regional governments have access to the same market,
regulatory, and fiscal policy instruments to achieve their policy objectives as the national government.
While there is often overlap between the functional and policy instruments available to national and
regional governments, as Box 1.11 highlights, the role and instruments available to local government are
quite distinct.
This multi-level structure of government has important implications for design and implementation of
national climate change policy. Regional and local governments can take the initiative, developing
climate change policy initiatives in their own right. They can play an important role in adapting national
policy to regional and local conditions. The challenge for national governments is to establish an
institutional framework that enables multi-level government to address climate change mitigation and
adaptation effectively. National governments have a number of policy instruments that they can use to
do this. They can mandate through legislation that regional and local governments implement policies in
functions that fall under the national government’s responsibility. They can provide incentives to
implement policies by transferring resources to the regional and local level for this purpose. They can
also encourage regional and local governments, through negotiation toward a policy consensus, to
implement policies. In addition, national government agencies can help local governments obtain better
data for decision making on climate mitigation, including localized data on GHG emissions, energy,
transportation, water consumption, and the nexus of water-energy issues. They also typically have the
ability to create dedicated revenue streams for local governments to build community resilience and
upgrade infrastructure. Finally, they can provide ongoing support to local governments via tools,
resources, and training; examples include the US Environmental Protection Agency’s State and Local
Climate and Energy Program and the U.S. Department of Energy’s SunShot Initiative and Solar Outreach
Partnership.
Where there is scope for autonomous action, municipal and regional governments have often taken
the lead and innovated in the development of climate change policy. Attention focused initially on
mitigation activities as part of a broader set of environmental management policies. Local and regional
authorities have been responsible for an extraordinary range of innovations in the mitigation arena,
using the market based, regulatory, and fiscal instruments at their disposal: adjusting building codes and
land-use zoning to promote residential energy efficiency; increasing residential density and facilitating
access to mass transit; investing in mass transit systems and supporting non-motorized transport while
simultaneously increasing the cost of vehicle use through fees and congestion charging; increasing the
price of waste disposal; promoting recycling and harnessing urban waste for energy generation; and
introducing metropolitan carbon pricing schemes to reduce GHG emissions from energy generators and

66
Box 1.11. Roles of National, Regional, and Local Governments in Climate Change Policy
National and Regional Local
Policy Climate change policy and policies for specific sectors
Emissions reductions targets
Technical support and information for subnational decision making
Coordination arrangements with regional authorities
Local climate change planning
Local emissions reductions targets
Coordination with neighboring local authorities
Market and Information Instruments
Product labeling and certification programs
Information on emissions reductions and adaptation for sectors
Trading schemes for emissions and renewable certificates
Information on emissions reduction and adaptation for households, communities, and businesses
Contracting out of urban services for water and waste management
Trading schemes for emissions in large metropolitan areas
Regulatory Instruments
Product, vehicle, and fuel standards
Environmental standards and regulation of atmospheric pollution
Energy standards, renewable energy obligations, and feed-in tariffs for renewable energy
Demarcation of nationally and regionally protected areas
Define and apply local standards for air pollution and water quality
Land-use zoning and cadaster for all sectors
Sector-specific regulations for building, waste management, and road traffic
Demarcation of locally protected areas
Fiscal Instruments
Fuel excises and consumption taxes
Tax expenditures related to national and regional taxes
Direct subsidies
Public investment in national infrastructure
Government participation in Public-Private Partnerships (PPPs)
Green public sector procurement
Conditional transfers and grants to regional and local authorities
Matching grants to local authorities
Charging for local services: road, congestion and parking charges; waste management
Public investment and Public-Private Partnerships (PPPs): transport, water, waste management, and urban development
Direct subsidies
Tax expenditures related to municipal taxes (usually property related)
Property tax surcharge financing for residential, commercial, and community improvements
Assessment National, regional, and sectoral climate change risk and vulnerability assessments
Standards, guidance, and information for assessments by subnational and sub-regional government
Local climate change risk and vulnerability assessments
Monitoring Manage GHG inventory systems
Standards for GHG inventories by other levels of government
Monitor and report on national performance of climate policies
Manage GHG inventory for municipal services and metropolitan area
Monitor and report on performance of climate policies
industry. Attention has now turned to climate change adaptation. Much of the work in this arena by
local and regional governments has been focused on dealing with current climate variability, particularly
managing extreme weather events. That said, municipal governments are beginning to consider the
67
implications of long-term climate change for urban design (e.g., managing heat island effects) and for
the provision of key urban services such as water and waste management. The principal policy
instruments for climate change adaptation have been building codes and regulations, land-use planning
and zoning, and public investment in “hard” adaptation. But, here too, municipal and regional
governments have been experimenting with market-based solutions, including payments for ecosystem
services to protect municipal water supplies.
Policy entrepreneurs have played a critical role in promoting local and regional climate change
initiatives. Local and regional politicians who have presented themselves as green innovators have been
able to generate considerable political capital around the climate change mitigation agenda. Global
networks of like-minded local officials have encouraged policy entrepreneurship and provided a
framework that identifies, rewards, and promotes best practices. The most widespread of these
networks, the International Council for Local Environmental Initiatives, launched in 1990; it now boast a
membership of over 1,000 cities in 84 countries, including 12 megacities. Reviews indicate that these
policy entrepreneurs tend to be more pragmatic, however, than their rhetoric would suggest. Advocacy
for mitigation policies typically focuses on local co-benefits (e.g., reduced local pollution and other
environmental improvements, business opportunities related to emerging technology industries) rather
than global mitigation impacts. Where mitigation policies are seen as undermining economic interests
(notably employment and business development) or simply impose too high a cost on consumers, they
are often adjusted or dropped altogether (see Box 1.11). Climate change adaptation, meanwhile, is seen
as more of a technical rather than political agenda (Bulkeley 2010).110 This is partly a reflection of
political economy, since poorer communities tend to be more at risk from weather variability and their
voices tend to be less effective in mobilizing political support. The situation changes primarily in the
immediate aftermath of extreme weather events, when a broader range of interests are affected and it
is easier to mobilize support for action on adaptation .
Effective policy implementation requires coordination between and across the various levels of
government. Coordination failures lead to an inefficient allocation of resources, duplicative efforts, a
patchwork of policies, and even programs that work at cross purposes across level of government.
Managing these complex interactions requires information sharing and mechanisms for consultation
between authorities. A review of nine EU states found these arrangements were still at an early stage of
development in most countries, making it difficult to formulate and apply coherent strategies.111 Local
authorities also have to coordinate among each other because administrative boundaries don’t coincide
with the environmental, economic, and social systems that they have to manage. This is particularly true
of municipalities, which typically have to collaborate with surrounding local and regional governments in
managing transport, residential growth, and access to essential services such as water, energy, and
waste management. This can be complex where there are overlaying administrative levels in each
territorial area.
110
Bulkeley, H. (2010). Climate and the Governing of Climate Change. Annual Review of Environment and Resources, Volume 35, pp. 229-253. 111
Swart, R. et al., (2009). Europe Adapts to Climate Change: Status of Developing National Adaptation Strategies. Partnership for European Environmental Research.
68
Political economy considerations play an important role here too. Where the interests of national,
regional, and local governments are aligned, policy coordination tends to be more effective, either by
design or simply by individual actors working in their own interests. Where interests are not aligned,
local governments may ignore or simply refuse to cooperate in the implementation of national policies.
A study in Finland, for example, found that a city was willing to implement policies related to waste
management if there were clear local co-benefits, but was less cooperative when it came to policies
related to increasing the share of renewable energy due to the anticipated increase in energy prices.112
The interests of regional and local governments may also diverge depending on local circumstances.
Tensions between Canadian provinces are illustrative here. The federal government has not stepped in
with a national framework, leaving Canada with a patchwork of local emissions targets and market
arrangements (Juillet 2011). Whereas GHG emissions for Canada average around 22 tCO2e per capita,
GHG emissions in Alberta and Saskatchewan amount to 70 tCO2e, largely owing to the provinces’
dependence on coal-fired electricity and increasing emissions from the exploitation of oil sands.
Canada’s main industrial provinces set their emissions reductions targets as 15-20 percent reductions
relative to 1990 levels, in line with the national government’s Kyoto Protocol commitments. The
government of Alberta, however, set its target at a 58-percent increase in emissions above 1990 levels
and set emissions intensity targets that do not require industry to reduce the total amount of emissions.
A variety of approaches are being used to finance climate adaptation and mitigation programs at the
local level. In the United States, the EPA's Local Climate and Energy Program offers special grants to help
local governments adopt climate change and clean energy strategies. Likewise, Australia’s Climate
Change Action Fund provides additional funds to local governments to support them in the transition to
a low-carbon economy by helping them adopt clean energy alternatives and prepare for implementation
of the Carbon Pollution Reduction Scheme. The Local Adaptation Pathways Program directs federal
funding to councils to identify their local climate change risks and how they can prepare for them.
Bhutan’s recently adopted LoCAL program channels resources to local governments to invest in
adaptation and to build local resilience. The LoCAL program financed by United Nations Capital
Development Fund (UNCDF) is to be implemented as performance-based Climate Change Adaptation
Grants.
Renewable funding is particularly important. The U.S. “open market” Property Assessed Clean Energy
(PACE) programs for commercial properties give owners of commercial buildings the flexibility to choose
a contractor and install a custom-tailored clean energy project on an accelerated schedule. Property
owners choose the best financing option, with the investors’ repayment secured through a special tax
assessment levied on the property and repaid by the owner through the property tax bill. Tax
assessments attach to the property, not the owner, and can extend project paybacks for up to 20 years.
Importantly, the open market model requires that existing mortgage holders provide written
acknowledgement prior to project approval. By providing up-front capital and allowing property owners
to repay on their property taxes over a 15-20 year period, the PACE model overcomes two of the biggest
112
Monni, S. and F. Raes, (2008). Multilevel Climate Policy: The Case of the European Union, Finland, and Helsinki. Environmental Science and Policy, 11(8), p. 743–755.
69
hurdles to widespread adoption of renewable energy and energy efficiency–high up-front costs and
property owners’ uncertainty about when they might sell their properties.
Voluntary emissions targets have gained traction. International Council for Local Environmental
Initiatives’ (ICLEI) members in the U.S. are encouraged to set emissions reductions targets both for
municipal operations and the activities within the municipal area; 204 members have to date done so.
Mayors from some 150 global cities, many in developing countries, signed on to a Mexico City Pact
organized by the World Council of Mayors in 2010that commits their cities to establishing inventories,
setting targets, and monitoring progress. Regional governments have also made commitments to
voluntary emissions reductions targets. Canadian provinces, U.S. states, and autonomous regional
authorities in the EU have taken the lead; Sao Paolo, Brazil, meanwhile, approved a target to reduce
emissions by 20 percent by 2020.113 The numbers of municipal and regional authorities actually
monitoring progress in emissions reductions, however, falls far short of those that have made
commitments. ICLEI USA, for example, reports that only 25 of its members are actively monitoring and
reporting on progress against their targets (ICLEI 2011).114 Moreover, there are as yet no agreed-upon
standards for GHG inventories at the municipal or regional level, and the methodologies that have been
developed focus on municipal operations rather than area emissions.115 Further development of these
standards is a prerequisite both for effective monitoring and also for the use of more innovative
programmatic financing instruments that tie financing to performance (whether through international
funding instruments or as part of a broader government fiscal transfer regime to promote climate
change action).
Land-use planning and regulation are powerful instruments to address both climate change mitigation
and adaptation and are typically the responsibility of subnational governments. Many important
strategies for coping with climate change are linked to land-use planning. For example, the growth of
emissions related to vehicles is influenced by transportation infrastructure. Denser development
protects open space which may be ecologically valuable and requires less energy and fewer materials to
build and operate. Finally, policies to protect woodlands and other valuable carbon sinks can help
address emissions from deforestation. Land-use planning is also critical to helping local communities
adapt to sea-level rise, more frequent extreme weather conditions, and other climate-related hazards.
The term “smart growth” is used to refer to a range of development and conservation strategies that
help protect the natural environment and make communities more attractive. Land-use planning is
essential to a smart growth strategy, and its role is especially influential in support of mitigation and
adaptation action.116
113
Galarraga, I., M. Gonzalez-Eguino, and A. Markandya (2011). The Role of Regional Governments in Climate Policy. Environmental Policy and Governance, Volume 21, pp. 164-182. 114
International Council for Local Environmental Initiatives (2011). Empowering Sustainable Communities: ICLEI USA Annual Report 2010. 115
Corfee-Morlot, J. et al. (2009). Cities, Climate Change, and Multilevel Governance. Organization of Economic Cooperation and Development. 116
For more details, see the website of U.S. Environmental Protection Agency on State and Local Climate and Energy Program: Land Use Planning, http://www.epa.gov/statelocalclimate/local/topics/land.html.

70
1.9. THE ROLE OF THE PRIVATE SECTOR
The private sector is an essential partner in the implementation of climate change policy, both in the
abatement of GHG emissions and in ensuring effective adaptation. In most countries, the private
sector dominates economic activities that are critical to emissions reduction—energy, transport, and
industry. The public sector may apply fiscal instruments, market interventions, and regulations for
mitigation and for adaptation, but the shifts in inputs, technologies, investments, efficiency, and
productivity that are the desired outcomes of public action are mostly the responsibility of the private
sector.
Attention has focused primarily on the role of the private sector in moving toward a low-carbon
economy; it has only recently turned to the private sector’s role in effective adaptation to climate
change. In theory, the private sector should take action on its own accord to address climate change
risks and vulnerabilities. In practice, however, the private sector may fail to adapt for a number of
reasons: lack of awareness of climate change as a risk; lack of knowledge of what adaptation options are
available; lack of capacity in terms of the resources and technical skills needed to adapt; and myopic
time horizons leading companies to put short-term profits ahead of longer-term sustainability; In
addition, the private sector may consider that adaptation is simply not its responsibility, either because
private sector actors do not actually own the assets that may be at risk or because there are moral
hazards at play and the private sector believes that the public sector will eventually step in to resolve
the problem.
A recent survey of 16 major corporations suggests that some of these market failures are in fact at
play. All 16 companies said that they were aware of climate change, but only two-fifths of them had
conducted risk assessments (and those that had tended to focus on extreme events rather than climate
change). Only a third of the companies surveyed had assessed possible adaptation options; those that
had generally took action, perhaps because they were utility companies that are required to undertake
long-term infrastructure planning. Some companies, meanwhile, seemed to be more aware of the
opportunities offered by climate change than the risks.117 There is clearly a need for proactive
approaches on the part of governments to empower the private sector, both in raising awareness and in
providing access to information and tools to enable companies to assess their risks. In the end, the
markets should intervene, penalizing companies that fail to take climate change into account in their
planning and thereby providing an incentive for the private sector to take action.
For most developing countries, these policies will have to take into account the diversity of the private
sector and the fact that many firms are small informal businesses. Much of the architecture for climate
change mitigation is still geared to the needs of large corporate investors, and the implications of
climate change for the private sector are still not addressed systematically in government planning
processes; this is especially true regarding the implications for small and informal businesses. This bias is
even stronger for adaptation action. A review of the 47 National Adaptation Programs of Action (NAPA)
117
Agrawala, S. et al. (2011). “Private Sector Engagement in Adaptation to Climate Change: Approaches to Managing Climate Risks.” OECD Environment Working Papers, No. 39,

71
prepared by developing countries since the UN Climate Summit in 2001 revealed that just under one-
half explicitly recognized a role for the private sector in adaptation, and only a quarter refer (briefly) to
specific activities.118 There are exceptions. Small businesses were consulted in the preparation of
Zambia’s Strategic Program for Climate Resilience, and the program includes a specific component that
seeks to address their needs. A study prepared for the IFC in Bangladesh highlighted the private sector’s
appeal for dedicated financing, arguing that financing channeled through the public sector and civil
society would not reach private sector.119
Use of fiscal, regulatory, and market instruments for climate action is still relatively rare in developing
countries. Adoption of these environmental regulations and institutional arrangements across countries
should be expected to follow a typical S-shaped pattern, with developing countries lagging behind
industrialized countries. Such a delay can benefit developing countries. Over time, policies are refined
and technologies tend to become more efficient at achieving the standards set by environmental
regulations. Furthermore, regulators are able to learn from the experience of early adopters and adapt
the design of regulations so that they achieve their goals more cost-effectively.120 In addition, late
starters are able to implement policies and regulations at lower costs. However, constraints facing
developing countries in implementing any of these approaches include insufficient capacity for policy
analysis to provide solid assessments to policy makers in support of fiscal instruments, market policies,
and regulatory reforms, as well as limited regulatory capacity, both technical and institutional. As such,
these shortfalls constitute an additional significant obstacle to developing country specific action on
climate action.
Concerns about costs to growth and poverty reduction clearly dominate developing country concerns
about climate action, particularly on mitigation. Shortfalls in assessment and institutional capacity
provide a further explanation as to why developing countries have tended to move late in adopting both
mitigation and adaptation policies. Countries may find it difficult and risky to commit to climate action in
the absence of a better understanding of the impact on their growth and development path as well as in
the absence of precise ideas about what actions would best serve any climate objective to which a
country were to commit.
118
Pieter Pauw and Imme Scholz (2012). Private Financing of Adaptation to Climate Change in Poor Countries? The German Development Institute, The Current Column, 26 November 2012. 119
Asian Tiger Capital Partners (2010). A Study to Engage the Private Sector in Climate Change Adaptation in Bangladesh. 120
Popp, D. (2011). International Technology Transfer, Climate Change, and the Clean Development Mechanism. Review of Environmental Economics and Policy, 5(1), pp. 131-152.

72
CHAPTER 2. PLANNING
2.1. CHAPTER SUMMARY
This chapter describes planning processes that are used to translate climate policy goals into actions
and development outcomes, taking into account the cross-cutting nature and long-term planning
horizon of climate change impacts. At the international level, the United Nations Framework
Convention on Climate Change (UNFCCC) consists of four key instruments relevant for planning: (1)
National Communications; (2) National Inventories, which are integrated into National Communications;
(3) National Adaptation Programs of Action and their successor, National Adaptation Plans; and (4)
Nationally Appropriate Mitigation Actions and the emerging practice of Low Carbon Development
Strategies. Starting from 2015, countries will also be expected to submit their Nationally Determined
Contributions (NDCs).
While NDCs are expected to form the basis of the climate regime after 2020, the exact information
requirements and parameters for NDCs are under discussion. It is expected that NDCs will seek to
achieve clarity, transparency, and understanding of countries’ contributions. These planning instruments
require substantial investments in data collection, analysis, and cross-governmental collaboration. While
they have been developed primarily to comply with international commitments, consensus has now
shifted toward integrating UNFCCC instruments in national planning and decision-making processes.
Moving forward, UNFCCC guidelines and technical assistance could contribute to shaping national
mitigation and adaptation strategies more directly.
At the national level, government responses to climate change are largely determined by the
institutional arrangements that support mainstreaming of climate change considerations and the
development of strategic and technical capabilities. While it is too early to identify best practices, some
country experiences and lessons from other cross-cutting planning exercises suggest four essential
capabilities:
Assessing climate change risks and vulnerabilities and using this information to inform decision-
making. Assessing the impact of projected climate changes on ecosystems and human activities is
the starting point for climate change policies. A risk and vulnerability assessment is typically
expensive and time consuming; it requires good historical and current hydro-meteorological
information as well as future climate change scenarios at as fine a resolution as possible and high
quality sector data. In addition, doing this work requires multidisciplinary teams. Governments have
only recently begun to develop climate change risk and vulnerability assessments, and poor data
availability has made it difficult for decision makers to use the information effectively. Most of the
detailed assessments undertaken to date have focused on particular sectors, regions, or projects.
Governments will have to build institutions and capacities to systemize the process of risk and
vulnerability assessments to ensure the information is updated and its quality is sufficient.
Setting a strategic direction. A national climate change strategy should signal climate change as a
priority and provide a framework for decision making. There is broad consensus in the literature in

73
favor of a statement of purpose and priorities that explicitly embrace competing policy objectives
and integrate priorities into national planning processes. While several countries have embarked on
this approach, many countries still develop national climate change plans apart from other plans.
Governments will need to continue providing high-level strategic direction so that climate change
considerations are fully mainstreamed into decision-making processes and sector planning routines
with the aim to incorporate climate change into the broader development agenda. To help this
process, central agencies should acquire an understanding of the operational aspects of agency
planning processes, and invest in the development of both technical capacity and staff.
Ensuring policy continuity. Climate change requires sustained commitments to policy objectives to
ensure long-term planning and investments continue through political transitions: for example,
through broad political endorsement, legislation (climate policies, acts and committees) and the use
of long-term, enforceable targets. Long-term goals complemented with short-term, sector targets
can ensure actions are not delayed and investments with long-term returns are supported.
Coordinating and consulting across government and with other stakeholders. Given the cross-
cutting nature of climate change, multiple agencies are involved at all levels of government. This
requires strong intra- and inter-ministerial coordination, and clarity of roles and responsibilities to
ensure climate change planning is well managed. Different institutional arrangements can be
adopted. In general, leadership may be assigned to an environmental agency, a sector agency with a
significant role in climate change policy, a newly established dedicated climate change agency, or
the central planning/finance agency (and support from the highest levels of government).
Consulting within the government, at different levels and across agencies, and consulting and
engaging nongovernmental stakeholders (e.g., the scientific community, civil society, and the private
sector) is essential for knowledge sharing, prioritization, and consensus building on climate change
policies and planning.
The development of a national capability for response to climate change is essential for effective
adaptation. This requires capabilities to assess risks and identify vulnerabilities to climate change;
reconcile these risks and vulnerabilities with development objectives; formulate appropriate policy
responses and translate them into action; engage with relevant stakeholders and influence their
behaviors; and mobilize and effectively deploy the resources needed for climate change mitigation and
adaptation. The appropriate institutional framework for this capability will depend on country context.
Considerations will include the nature of climate change risks and vulnerabilities, the configuration of
the existing development policy and planning processes, international commitments, and the level of
development.
Climate Change Public Expenditure and Institutional Reviews (CCPEIRs) should assess the extent to
which the institutional capability for response to climate change meets the country’s needs and is
effective in translating policy goals into development outcomes. This chapter reviews the key issues to
consider when undertaking such an assessment. It focuses on the institutional framework for climate
change policy making, planning, and monitoring. Section 2.2 provides an overview of the international
architecture for climate change planning that was put in place through the UNFCCC process and

74
recognizes that most developing countries are making significant investment in UNFCCC-mandated
processes. It argues that these processes can serve as a starting point and valuable resource for national
policy and planning processes. Section 2.3 identifies the key elements of the institutional framework for
national climate change policy and planning and the various versions of the framework adopted by
national authorities.
2.2. INTERNATIONAL FRAMEWORK
The United Nations Framework Convention on Climate Change (UNFCCC) constitutes a valuable
resource for policymakers and a useful starting point for a CCPEIR’s analysis of national climate
change policies. There are four key instruments: (1) National Communications; (2) National Inventories,
which are integrated into National Communications; (3) National Adaptation Programs of Action and
their successor, National Adaptation Plans; and (4) Nationally Appropriate Mitigation Actions and the
emerging practice of Low Carbon Development Strategies. In November 2013 in Warsaw, at the 19th UN
Conference of the Parties121 (COP 19), governments decided to either begin or intensify domestic
preparations for their Nationally Determined Contributions (NDCs) toward a global agreement so that
they are ready well before COP 21 in Paris in December 2015 (and ideally by the first quarter of 2015,
the year when countries will be expected to submit their Nationally Determined Contributions). They
agreed to identify the precise information that countries will provide when putting forward their
nationally determined contributions by the COP 20 in Lima at the end of 2014.
The preparation of these instruments requires a substantial effort by national authorities in data
collection, analysis, and inter-ministerial collaboration. While the consensus is now shifting toward
integrating the UNFCCC instruments into national planning routines and documents, the UNFCCC
guidelines and the technical assistance provided to support the UNFCCC processes will continue to play
an important role in shaping the national adaptation and mitigation strategies, (particularly in least
developed countries). Coordination between these initiatives can help reduce the burden on planning
staff and decision makers and reduce the risk of conflicting signals between policy instruments. The
ultimate objective of these planning exercises is to inform and influence government policy and action.
Reporting
UNFCCC requires Parties to report on their progress in the implementation of the Convention through
National Communications. UNFCCC differentiates between the responsibilities of Annex I
(industrialized) and non-Annex I (developing) countries. The reporting framework for Annex I countries
consists of the National Communications submitted every 4-5 years. Annex I countries submitted their
sixth National Communications by January 2014; they also submit their annual Greenhouse Gas
Inventories. Non-Annex I countries should submit their first Communication within three years of entry
into force of the Convention for that Party, or upon the availability of financial resources (except for the
121
The Conference of the Parties is the supreme decision-making body of the UN Frameworks Convention on Climate Change (UNFCCC). All countries that are parties to the Convention are represented at the COP, at which they review the implementation of the Convention and any other legal instruments that the COP adopts and take decisions necessary to promote effective implementation (including institutional and administrative arrangements). Further details can be found at the UNFCCC website, http://unfccc.int/2860.php.

75
least developed countries, who may report at their discretion). As of May 2014, 147 of 154 non-Annex I
countries had submitted National Communications. The 17th session of the COP, held in Durban in 2011,
decided that non-Annex I countries should also submit their first biennial update report by December
2014; the least developed countries (LDCs) and Small Island Developing States (SIDS) may submit
biennial update reports at their discretion. A subsequent COP decision (Doha 2013) called for developing
countries to provide information on the underlying assumptions and methodologies of their mitigation
actions as well as their financial and capacity-building needs to prepare measurable mitigation actions.
UNFCCC provides technical guidance and support for the preparation of National Communications,
with a view to encouraging the presentation of consistent and comparable information across
countries. Reporting for Non-Annex I countries is expected to be consistent with their capabilities and
the level of support provided. Non-Annex I countries may receive financial and technical support for the
preparation of national communications and biennial update reports directly from the Global
Environment Facility or through UNDP, UNEP, and the World Bank. Following UNFCCC’s technical
guidance, each national communication should provide a description of national circumstances,
including development challenges and policies; a national greenhouse gas inventory; a description of
steps taken or envisaged to implement the convention; measures to facilitate adequate adaptation to
climate change; measures to mitigate climate change; measures taken to raise awareness; steps taken
to integrate climate change into decision making; capacity building; and an assessment of constraints,
gaps, and related financial, technical, and capacity needs.
All non-Annex I National Communications provide an overview of the current and proposed climate
change policies for information purposes. Most give equal weighting to analysis of mitigation and
adaptation, whether or not the country is a significant source of emissions. Most of them simply list
policies by sector, with brief descriptions of their rationale. All non-Annex I National Communications
include a list of climate-change-related technologies that would support their mitigation and,
increasingly, adaptation efforts. However, there is little analysis of how these technologies will be
mobilized, deployed, or financed. Some (mostly Low Income Countries) include specific activities for
financing, many drawing on lists of projects for external financing presented in their National Adaptation
Programs of Action. These generally have rudimentary, if any, costing.
National Communications represent a significant investment in data collection, analysis, and inter-
ministerial collaboration. All of the National Communications are prepared by multi-disciplinary teams,
typically including representatives of the principal sector agencies and national universities. In many
countries, the National Communication has been the subject of consultations with civil society and the
private sector. The process is usually led by an environmental agency or the meteorological service.
Central finance planning and finance agencies are rarely involved in leading the National
Communications process; the exception is China, where the National Development and Reform
Commission coordinates preparation of the National Communication.
UNFCCC encourages national authorities to use the process of preparing National Communications as
an opportunity to consider the development implications of climate change in consultation with

76
stakeholders. UNDP advocates a systematic process to preparing a National Communication and
provides extensive examples of good practices.122 This starts with a preparatory or stock-taking stage
where basic information on climate change impacts and national policies is consolidated and the
authorities initiate engagement with a range of stakeholders. The subsequent implementation stage
entails undertaking of studies, particularly for the preparation of Greenhouse Gas Inventories, impact
assessments, and consultations on the appropriate policy response. The national inventory reporting
requirement for developing countries (non-Annex I) is a summary of anthropogenic greenhouse gas
emissions by sources and removals, including greenhouse gases not controlled by the Montreal Protocol
and greenhouse gas precursors, as well as of anthropogenic emissions of HFCs, PFCs, and SF6. The
reporting requirements are less stringent than for Annex 1 countries, and cover the major greenhouse
gases (see Box 2.1). Recent National Communications by Argentina and Belize, for example, drew on
ecosystem and sector climate change risk and vulnerability assessments conducted in the preparatory
stage. The final sustainability stage entails ongoing dissemination and use of the National
Box 2.1. National Greenhouse Gas Inventories: Anthropogenic Gases included in the UNFCCC Reporting Guidelines
The UNFCCC guidelines for reporting on anthropogenic emissions include the same greenhouse gases for both Annex I and non-Annex I countries. These are gases whose 100-year global warming potential (GWP) values have been identified by the IPCC and adopted by the COP: carbon dioxide (CO2), methane (CH4) and nitrous oxide (N2O), perfluorocarbons (PFCs), hydrofluorocarbons (HFCs) and sulphur hexafluoride (SF6). The guidelines also include the following indirect greenhouse gases: carbon monoxide (CO), nitrogen oxides (NOX), non-methane volatile organic compounds (NMVOCs), and sulphur oxides (SOx).
Greenhouse gas (antropogenic emissions) Sources of Anthropogenic Emissions
Carbon Dioxide (CO2) Energy, Industry, Buildings, Forest Fires, Peat Decay, Waste
Methane (CH4) Fuel Production and Use, Livestock, Forestry,Waste
Nitrous oxide (N2O) Agriculture, Forestry, Waste, Indirect
Hydrofluorocarbons (HFCs) Industrial Processes
Perfluorocarbons (PFCs) Industrial Processes
Sulphur hexafluoride (SF6) Industrial Processes (metal, halocarbons, electric equipment)
Carbon Monoxide (CO) Nitrogen Oxides (NOx)
Energy, Industrial Processes, Foresty, Waste Energy, Industrial Processes, Foresty, Waste
Non-methane volatile organic compounds (NMVOCs) Sulfur Oxide (SOx)
Energy, Industrial Processes, Foresty, Agriculture, Waste Energy, Industrial Processes, Foresty, Waste
Source: UNFCCC (2003). Report of the Conference of the Parties on its Eighth Session, held at New Delhi from October 23 to November 1, 2002.
122
The UNDP website, http://ncsp.undp.org/, provides examples of good practices. Some useful documents available on the site include the following: 1) National Communications Support Programme (2012). Lessons Learned and Experiences from the Preparation of National Communication; 2)National Communications Support Programme (2012). Country Papers: Preparation of National Communications from Non-Annex I Parties to the UNFCCC: A Complilation of Lessons Learned and Experiences from Selected Countries.

77
Communication so that it can serve a purpose beyond simply complying with an international obligation to becoming a valuable resource of information, analysis, and technical capacity to support ongoing policy and planning activities. Attention is now turning to the integration of National Communications more directly into governments’ planning routines.
National Greenhouse Gas Inventories provide information on sources and trends in emissions that can
be used to monitor and inform the design of national climate change strategies. The UNFCCC
mandates specific requirements for inventories that distinguish between Annex I and Non-Annex I
countries in terms of the gases covered, the methodologies required, and the frequency of reporting
(See Box 2.1).The UNFCCC guidance identifies six sectors for reporting: energy; industrial processes and
product use; solvent production and use; agriculture; land-use, land-use change, and forestry; and waste
management. This disaggregated information can be used to identify potential entry points for
mitigation strategies and to monitor progress in implementation.
UNFCCC encourages ongoing efforts by national authorities to improve the quality and coverage of
National Greenhouse Gas Inventories. UNFCCC’s 2005 review of the first 122 National Inventories
submitted by non-Annex I parties indicated that all but four of the countries had provided data on
emissions of the three direct GHGs for at least one year, and a total of 107 Parties (88 percent) provided
emissions estimates for some or all GHG precursors.123 UNFCCC recognizes the need for governments to
adapt methodologies for the estimation of emissions factors to the specific regional or country context
and to improve the quality of their activity data. This requires investments in data collection, field
studies and validation of emissions factors, surveys to reduce uncertainties in activity data,
improvements in forest data, and carbon sequestration studies—which in turn require investments in
the institutional capacity to undertake inventories on a routine basis. The IPCC provides technical
support to national authorities to help them develop these capabilities and provides access to a series of
tools and databases that facilitate inventory preparation. Some Annex I countries have raised concerns,
however, regarding the differential treatment of major non-Annex I emitters, particularly now that non-
Annex I countries have overtaken Annex I countries as the major source of global GHG emissions.
Inventories prepared by Annex I countries are subject to independent review by technical experts,
including a technical expert from a non-Annex I country, which serves as a rigorous quality assurance
process. Non-Annex I countries’ inventories are currently not subject to such independent review.
Measures to strengthen the quality assurance process are likely to figure prominently in future UNFCCC
negotiations.
Planning
UNFCCC launched the development of National Adaptation Programs of Action (NAPAs) as a means of
drawing attention to and mobilizing financing for Least Developed Countries’ immediate adaptation
needs. Launched by COP 7 in Marrakesh, 2001, the NAPA process was seen as complementary to the
National Communications process and a means for LDCs to submit adaptation projects for financing
123
UNFCC (2005). “National Inventory Submissions 2005.” Retrieved from https://unfccc.int/national_reports/annex_i_ghg_inventories/national_inventories_submissions/items/2761.php.

78
pending the completion of their first National Communication.124 UNFCCC guidelines stress the
importance of a consultative process for project identification and prioritization, supported by a team of
national experts. Projects should focus on urgent and immediate needs–those for which further delay
could increase vulnerability or lead to increased costs at a later stage–and prioritize the most vulnerable
populations. To this end, NAPAs must be action-oriented, use existing information, and reflect national
circumstances.
Financing for technical assistance to support the NAPA process and for projects is provided from the
Least Developed Countries Fund (LCDF) managed by the Global Environment Facility. As of May 2014,
50 Least Developed Countries have submitted NAPAs; the remaining NAPA is in the final stages of
preparation.125 While the selection, financing, and implementation of NAPA projects continues, selective
uptake on project proposals has meant that some countries or projects have yet to receive financing,
leading to some frustration with the NAPA process.
Reviews have found NAPAs to be successful in raising awareness, but recommend sustaining the
planning process. UNFCCC’s Least Developed Countries (LDC) Expert Group argued that planning should
not be seen as a one-off exercise; projects need to be revised and reprioritized to take into account
emerging information, lessons learned, and changing needs.126 Recent reviews by the Global
Environment Facility (GEF) demonstrate the considerable extent to which projects and programs
financed by the Least Developed Country Fund (LDCF) contribute towards strengthening institutional
and technical capacities for integrating climate change adaptation into development planning and
policy-making processes.127 Technical guidance for national authorities has shifted in this direction,
focusing attention on a longer-term planning process alongside the immediate adaptation needs.
Building on the NAPA experience, UNFCCC has launched National Adaptation Plans (NAPs). The
Cancun Adaptation Framework approved at the 2010 COP 16 in Cancun lays out a broad framework for
National Adaptation Plans that shifts attention from immediate needs identified under NAPAs to longer-
term development planning. It also calls for a country-driven, gender-sensitive, participatory approach
that takes into consideration the needs of communities and ecosystems; and encourages the integration
of adaptation into social, economic, and environmental policies.128 COP 16 emphasized the importance
of building on the NAPA process, integrating NAPs with development planning processes, arrangements
for periodic review, and the need for ongoing support.129 Subsequent COPs have asked the GEF, through
the LDCF, to support LDCs’ preparation of their NAP processes. Non-LDC developing countries have been
encouraged to participate in the NAP process and the GEF, through the Special Climate Change Fund
124
UNFCC Conference of the Parties (2002). Report of the Conference of the Parties on its Seventh Session Held at Marrakesh from 29 October to 10 November 2001, Addendum. FCCC/CP/2001/13/Add. 1. 125
Information on LDCF support for adaptation planning, including NAPAs, is given in Section 6.1 of the “Report of the Conference of the Parties on its Seventh Session.” 126
UNFCC LDC Expert Group (2009). “Least Developed Countries: Support Needed to Fully Implement National Adaptation Programmes of Action (NAPAs).” 127
GEF Independent Evaluation Office (2014). LDCF/SCCF Annual Evaluation Report 2013. GEF (2014). FY13 Annual Monitoring Review of the Least Developed Countries Fund and the Special Cliamte Change Fund. 128
UNFCCC Conference of the Parties (2011). Report of the Conference of the Parties on its seventeenth session, held in Durban from 28 November to 11 December 2011, Addendum. FCCC/CP/2011/9/Add.1. 129
Ibid.

79
(SSCF), has been invited to provide support to this end along with other relevant organizations.130 The
GEF, through the LDCF and the SCCF, currently supports two global projects that seek to advance the
NAP process in LDCs and non-LDC developing countries. The LDC Expert Group (LEG) has developed
technical guidelines for the NAPs as a basis for launching the NAP process in LDCs.
UNFCCC addresses climate change mitigation planning in developing countries through a parallel
process, Nationally Appropriate Mitigation Actions (NAMA). Initially proposed at COP 13 in Bali in 2007
as part of the Bali Road Map, the NAMA concept was refined at COP 15 in Copenhagen in 2009 as a
registry of mitigation actions. The goal is to encourage developing countries to implement mitigation
activities that will help them reduce the rate of growth of emissions below their business-as-usual
scenarios. Some NAMAs will be implemented by developing countries unilaterally (e.g., where co-
benefits exceed the cost of implementation). Others will only be implemented if there are adequate
incentives from external sources in the form of technology, financial, and capacity-building support. As
of June 2013, 57 non-Annex I countries had submitted NAMAs. Their content varies: most present broad
statements of policy priorities; some present lists of specific interventions; a few present specific
projects aimed at reducing emissions (though these are generally less developed than the projects
presented in NAPAs); and some present specific targets for emissions. UNFCCC has established the
NAMA registry as a clearinghouse to help match NAMAs with potential sources of funding, technology,
and capacity building.131
Low Carbon and Low Emissions Development Strategies (LCDS and LEDS) have been proposed as a
framework for mitigation actions. This approach mirrors, in some respects, the shift from NAPAs to
NAPs, and from immediate actions to a longer-term strategy. While COP 16 encouraged developing
countries to design low-carbon development strategies, it did not provide specific guidance. UNEP
argues that LCDS should be fully integrated into the national development strategy, presenting a
sustainable path to achieve established development goals. Doing so entails identification of national
and sector-specific actions for the reduction of GHGs, drawing on an assessment of GHG trends and
opportunities for low-carbon development alternatives. In this context, the NAMA became a registry of
the policy and project-level actions that were identified to implement in the LCDS.132 LEDS were
originally proposed in the context of UNFCCC in 2008 as a means of focusing attention on national
efforts in support of low-carbon development. The OECD has proposed a framework for LEDS which
builds on an assessment of major sources of emissions and the identification of emissions reduction
potential and climate vulnerability assessments. The framework draws on country experience in
developing national climate change strategies.133 The Nationally Determined Contributions decided at
130
UNFCC Conference of the Parties (2012). Report of the Conference of the Parties on its seventeenth session, held in Durban from 28 November to 11 December 2011, 5/CP.17 National adaptation plans, FCCC/CP/2011/9/Add.1. UNFCC (2013) Report of the Conference of the Parties on its eighteenth session, held in Doha from 26 November to 8 December 2012, 12/CP.18 National adaptation plans FCCC/CP/2012/8/Add.2. Also, NAP guidelines are available at http://unfccc.int/adaptation/workstreams/national_adaptation _programmes_of_action/ items/7279.php. 131
Registry of NAMAs is available at http://unfccc.int/meetings/cop_15/copenhagen_accord/items/5265.php. 132
UNEP Risø Centre (2011). Low Carbon Development Strategies: A Primer on Framing Nationally Appropriate Mitigation Actions (NAMAs) in Developing Countries. 133
OECD International Energy Agency (2010). Low-Emission Development Strategies (LEDS): Technical, Institutional, and Policy Lessons.
80
COP 19 in Warsaw (2013) then provide a further framework for identifying strategies and plans for
emissions reductions.
2.3. NATIONAL PLANNING
Much of the literature on climate change planning focuses on mainstreaming climate change in the
planning process throughout the public sector. Mainstreaming seeks to embed climate change policy
considerations into the routine decision-making processes at the heart of every public institution, so
that climate change considerations and policy priorities are reflected in policy making, planning,
budgeting, and implementation processes at the national, sectoral, and local levels. This addresses
concerns that, in the absence of specific mainstreaming measures, climate change issues and policies
will not be given appropriate consideration; that institutions will simply pay lip service to climate change
policy objectives; and that climate change planning will be undertaken in isolation and have little impact
on what the government actually does. To this end, the climate change literature develops a variety of
conceptual frameworks and practitioner guides for mainstreaming climate change in development
planning and project design.134 The concern with mainstreaming is not unique to the climate change
agenda. Indeed there is a long debate on how to mainstream environmental policy into the planning
process.135 Mainstreaming also figures prominently in the strategies used to address other cross-cutting
policy issues, such as gender and HIV/AIDs.
Rather than advocating for a particular model of climate change planning, this chapter focuses on the
institutional arrangements that countries have used to develop their climate change strategies and
plans. It is only over the last five to ten years that countries have started to put these institutions in
place; in most countries they are still evolving. There is therefore little evidence on which to draw
conclusions regarding the most important capabilities for climate change planning, let alone to prescribe
best practices. However, experience from other government-wide, cross-cutting planning exercises can
help identify institutional arrangements that are likely to be important in planning for climate change.
Evaluations of the Poverty Reduction Strategy initiative, for instance, have argued that attention should
focus on planning (systems) rather than plans (documents), invest in sound diagnostics, and avoid the
creation of parallel systems and policy processes.136 It is also important to bear in mind the specific
challenges that climate change poses as a policy agenda, in particular the long time frames over which
climate change will unfold and the disincentives for politicians, policymakers, and planners to prioritize
climate change when faced with more pressing development issues.137 Addressing these concerns, four
capabilities are highlighted here: (1) the capability to assess climate change risks and vulnerabilities and
to use this information to inform decision making; (2) the capability to set a strategic direction for
climate change policy; (3) the capability to install mechanisms that ensure policy continuity; and (4) the
134
Lebel, Louis et al (2012). Mainstreaming climate change adaptation into development planning. UNDP-UNEP Poverty-Environment Initiative (2011). Mainstreaming Climate Change Adaptation into Development Planning: A Guide for Practitioners. World Bank (2011) 135
Dalal-Clayton, Barry and Steve Bass (2009). The challenges of environmental mainstreaming: Experience of integrating environment into development institutions and decisions. 136
OECD (2004). Applying Strategic Environmental Assessment: Good Practices Guidance for Development Cooperation. DAC Guidelnies and Reference Series. 137
Meadowcroft, James (2009). “Climate Change Governance.” Background Paper to the 2010 World Development Report.

81
capability to coordinate across multiple levels of government and engage with stakeholders from civil
society and the private sector.
Capability to Assess
Formal planning processes typically start with problem definition, diagnostics, and assessments.
Formulating a shared understanding of the problem is a necessary step prior to deciding on the
appropriate policy response. For climate change mitigation, the starting point will usually be the
National Inventory and complementary assessments of the principal sources and sinks of GHGs at the
sector and industry levels. Building on this assessment, decision makers have to identify economic
activities that offer the greatest emissions reduction potential, the policy options available for achieving
these reductions and their relative cost effectiveness (see Chapter 3). For climate change adaptation,
the starting point is a risk and vulnerability assessment. Decision makers have to access and interpret
information on climate change scenarios, assess the impact of climate change on natural and human
systems, assess how these systems will adapt, and then identify residual vulnerabilities. The information
requirements for and complexity of these assessments make it important for the government to take
the lead. While major corporations may have the means to undertake assessments of climate change
mitigation potential and the risks and vulnerabilities that they face, households, communities, much of
the private sector, and many local authorities do not. They rely on government assessments to guide
their own decision making on the appropriate response to climate change. This is particularly true with
regard to adaptation, an area where market signals are often ineffective in guiding private decision
makers.
Risk and vulnerability assessments require information on future climate change scenarios. This
information is generated from Atmospheric-Ocean Global Circulation Models (AGCMs), mathematical
representations of the climate and ocean systems which forecast changes in global climate patterns
induced by increasing GHG gas concentrations.138 AGCMs typically have a horizontal resolution of 250-
600 km, which is too low for country-level analysis. Downscaling techniques have to be used to translate
AGCM results into more granular regional, country, and local-level projections; this can be done using
either dynamic downscaling, based on a regional climate model within a global model, or statistical
downscaling, which relates climate features to meteorological data from a particular region or country.
Regional modeling tools with fine resolutions are available (e.g. UK Meteorological Office’s PRECIS), but
these require significant computer capacity and skills in data interpretation.139
Access to climate change data at a resolution and in a form that can be readily used by decision
makers remains a challenge. This is true for both Annex I and non-Annex I countries. The U.S.
Government Accountability Office (GAO), for instance, has highlighted the difficulties decision makers
encounter in translating climate data into the site-specific information they need to make investment
138
IPCC provides access to the results of its modeling exercises through its Data Distribution Center, http://www.ipcc-data.org/ 139
Information on the UK Meterological Office Regional Climate Modelling System is available at http://www.metoffice.gov.uk/precis/intro.

82
decisions. The GAO has endorsed plans to develop a one-stop shop for climate change information.140
Some countries have made progress in this direction For example, the UK Climate Impacts Program,
administered on behalf of the government by Oxford University, provides extensive information on
climate change and a range of decision-making tools for local authorities and businesses.141 UNFCCC’s
Nairobi Work Program, which brings together national authorities, research institutions, civil society,
and others, provides a compendium of data sets, tools, and analytical approaches for developing
countries. Participants in the program have called for improvements in the quality of climate change
information for developing countries, emphasizing the need for policy-relevant and practical
information along with guidelines on how data should be applied.142 Indeed, the number of websites
trying to address this need have multiplied in recent years.143
High quality hydro-meteorological information is needed to understand and track climate change.
Current weather variability may be indicative of future change, revealing stress points and system
responses to changing temperature, precipitation, and extreme weather events. Consequently, an
assessment of the economic and social impact of current climate variability is a sensible starting point
when trying to understand future climate change. Unfortunately, the coverage and quality of
meteorological systems in many developing countries is poor. Many National Communications and
NAPAs highlight the need for investments to strengthen these systems and for the technical capacity to
interpret meteorological data. A challenge in many countries is to have access to such information.
Making the hydro-metrological data available for decision-making by various ministries, agencies, and
stakeholders is critical.
Risk and vulnerability assessments analyze the impact of projected climate change on ecosystems and
on human activity. Undertaking these assessments requires information on the degree of exposure of
natural and human systems, their ability to cope with climatic changes, and the structural changes that
climate change will bring about. Future climatic conditions vary among the multiple climate change
scenarios. In countries with diverse ecosystems, risk and vulnerability assessments at low levels of
resolution (i.e., at the national or regional levels) may be of limited value, requiring more detailed
assessments for each of the ecosystem types. Collecting and interpreting data on ecosystem
vulnerabilities, however, requires environmental expertise and interpreting and anticipating the impact
of ecosystem changes on human systems (e.g., on communities, social groups, economic activities and
public services) require input from sector and development specialists. Consequently, risk and
vulnerability assessments typically require multi-disciplinary teams and are expensive and time
consuming to develop.144 One pragmatic approach is to look at the risk from climate variability to GDP,
140
GAO (2013). Climate Change: Future Federal Adaptation Efforts Could Better Support Local Infrastructure Decision Makers. Report to Congressional Requesters. 141
United Kingdom Climate Impacts Programme http://www.ukcip.org.uk/. These include: a local climate impacts tool for local government; a tool for costing the financial impacts of climate change; a tool for assessing an organisations’ vulnerability to climate change and developing adaptation strategies to be drawn up; a business assessment fo the private sector. 142
Lu, Xianfu (2011). “Provision of climate information for adaptation to climate change.” Climate Research, vol. 47: 83-94. 143
See for instance World Bank http://sdwebx.worldbank.org/climateportal/index.cfm?page=climate_data and UNDP http://ncsp.undp.org/ 144
For an overview of the risk and vulnerability assessment process see Downing, Thomas and Anand Patwardhan (2003). Assessing Vunerability for Cliamte Adapation, AFP Techncial Paper 3, United Nations Development Programme.

83
consider the development scenarios, and then link these back to the potential vulnerabilities for the
country and its various key sectors.
Governments have started to turn their attention to the development of comprehensive, national-
level climate change risk and vulnerability assessments. The United Kingdom, which has been active in
developing policy responses to climate change over the last decade, completed its first comprehensive
national climate change risk assessment in 2012.145 National assessments help to build a broad picture of
the impacts, risks, and vulnerabilities. This assessment can then be used to assess the salience of climate
change adaptation in relation to other challenges and to identify priority areas for further analysis and
policy development. Most governments include a general overview of these risks in their National
Communications (but these are often very abstract); few, however, have undertaken systematic
assessments that draw on specific scenarios and map potential impacts. Most of the detailed
assessments undertaken to date are focused on particular sectors, regions, or projects. This can result in
a patchwork of studies using different climate change scenarios, providing snapshots rather than
capturing the broader picture. A review of the status of risk and vulnerability assessments in Bolivia,
Ireland, and Nepal, for example, revealed that there was no shortage of information but concluded that
the assessments failed to provide a comprehensive evaluation of the vulnerabilities at a national level.
Recognizing the limitations of this approach, both Nepal and Ireland launched national risk and
vulnerability assessment exercises.146 The countries that were selected for the Pilot Program for Climate
Resilience, meanwhile, have addressed risk and vulnerability assessments while developing their
Strategic Program for Climate Resilience (SPCR). These have brought together the best available
knowledge and assessed the risks, vulnerabilities and investment priorities in that context.147
Governments will need to build institutions and systematize the process of risk and vulnerability
assessment to address their longer term needs. Assessments will have to be updated periodically to
take into account evidence of climate change as it proceeds, improvements in scenario modeling, and
the understanding of risks and the adaptive capabilities of natural and human systems. Governments
will have to determine when assessments should be undertaken, the appropriate methodologies,
institutional responsibilities, and the role of nongovernmental stakeholders. Most important,
governments and their stakeholders need to connect the development plans and these assessments by,
for example, integrating climate considerations into development planning processes.
Most governments and development agencies already have mechanisms in place to address
environmental considerations in policy and project design. Environmental framework legislation
typically provides for one or more instruments: (1) Environmental Impact Assessments, usually a
mandatory ex-ante requirement for public and private sector projects undertaken at the project lead’s
expense; (2) Regulatory Impact Assessments, used selectively to inform the design of regulatory
145
UNDP and UNEP (2011) Applying Climate Information for Adaptation Decision-Making, National Communications Support Programme. 146
Dixt, Aarjan et al (2011). “Ready or Not: Assessing National Institutional Capacity for Climate Change Adaptation. Lessons for Planners from the Pilot Applications of the National Adaptive Capacity Framework”. WRI Working Paper. World Resources Institute, Washington DC. 147
More information is available at https://www.climateinvestmentfunds.org/cifnet.

84
instruments, including taxation, so as to mitigate environmental impacts and or improve the
effectiveness of environmental policy; and (3) Strategic Environmental Assessments (SEAs), also used
selectively (though mandatory in some countries, such as Vietnam) to integrate environmental
considerations into decision making upstream during the development of national, sectoral, and
regional development strategies when the options regarding the choice of policies, programs, and
projects are still under consideration. Environmental regulations typically require public disclosure,
opportunities for consultation, and, in many countries, public hearings to discuss results. An institutional
and legal framework should be put in place to support this process.
Adjustments will be needed if the institutional architecture put in place for environmental
assessments is to serve as an adequate basis for climate change risk and vulnerability assessments.
Environmental assessments have focused on man’s impact on the environment rather than on
identifying vulnerabilities to climate change; the extent to which the policies, programs, and projects
can lead to mal-adaption or miss adaptive opportunities; and complex adaptive interactions. Integration
of mitigation considerations (reductions in GHG emissions) is a natural fit in the current architecture, but
integration of adaptation represents more of a shift in focus. There is a growing body of guidance on
how environmental assessments can be used for analysis of climate change risks, vulnerabilities, and
adaptive planning.148 Most governments are now moving in this direction even if the process of
integration is still in its early days.149At a national level, environmental and specialist climate change
agencies are best placed to develop and oversee the implementation of this kind of guidance. Central
finance and planning agencies are best placed to ensure that the guidance is applied through the
planning and decision-making process. Audit authorities have also turned their attention to this issue,
verifying whether the systems are in place to address climate change considerations in decision making.
A recent coordinated audit of 12 European countries, for example, concluded that EU-level guidance
was needed to harmonize technical issues (e.g., the climate change scenarios used as the basis for
assessments).150
Reviews of international experience in conducting environmental assessments argue that assessments
are more likely to be effective if they are seen as an iterative process rather than simply a study
commissioned at a particular point in the decision-making process. While most planning and decision-
making systems assume a rational, linear decision-making process, the reality is usually messier.
Decision-making schedules may be compressed so that there is little opportunity to consider
environmental or climate change considerations. The information that is available is often contested by
different economic and political interests. Even in countries with robust planning procedures, such as
Botswana, environmental agencies report that decision makers have difficulty interpreting and weighing
148
OECD DAC Network on Environment and Development (2008) Strategic Environmental Assessment and Adaptation to Climate Change, Endorsed by Members of the DAC Network on Environment and Development Cooperation at their 8
th
Meeting on 30 October 2008. 149
For an overview, see Netherlands Commission for Environment Assessment (2011) Climate change adaptation and Strategic Environmental Assessment. 150
European Commission (2013). “Guidance on Integrating Climate Change and Biodiversity into Environmental Impact Assessment.”

85
environmental and climate change consideration.151 Consequently, reviewers argue that environmental–
and by extension climate change–considerations are more likely to be taken into account if this
information is used opportunistically at key decision points, when decision makers are focused on the
issues, and in a form and language that they can understand (and with a particular emphasis on
economic implications). Broad involvement of sectoral agencies and other stakeholders, including civil
society, the private sector, and the scientific community, can add credibility to the assessment process
and help link assessments to subsequent work on sector policy. Reviewers often also advocate for more
transparent open decision-making processes that provide opportunities for the views of stakeholder
groups to be heard, particularly those that are vulnerable to environmental and climate change
impacts.152
Strategic Direction
While there is little evidence to suggest that one particular approach to planning is more effective
than another, there is a broad consensus in the literature in favor of a statement of purpose and
priorities that explicitly embraces competing policy objectives and integrates priorities into national
planning processes. Reviews of the Poverty Reduction Strategy initiative have highlighted these
dimensions of successful strategies and encouraged governments to move in this direction. Assessments
of environmental and climate change policy implementation come to similar conclusions. This section
focuses on the challenges facing governments in developing a planning process that meets these
objectives.
A national climate change strategy can signal climate change is a priority and provide a framework for
decision making. High profile climate change strategies raise awareness. They demonstrate that climate
change is a government priority. They communicate the national authorities’ intentions to households,
the private sector, civil society, and local government, and in so doing help these actors to make
informed decisions regarding the measures that they should take to deal with climate change. Equally
important, they communicate the government’s policies to public sector agencies, informing them of
the policies that they are to implement and providing a common purpose around which agencies can
coordinate their efforts. The U.S. Government Accountability Office found that, in the absence of high-
level strategic direction on climate change policy from the center of government, agencies may ignore
the issue or pursue their own objectives, failing to identify opportunities to collaborate and potentially
working at cross purposes.153
Many countries have developed climate change strategies that set the broad direction for government
policy. Initially, Annex I countries took the lead with plans that focused on mitigation policies. More
recently, these plans have integrated adaptation considerations, with some countries developing
specific strategies to address adaptation concerns. A growing number of non-Annex I countries have also
taken the initiative in developing climate change strategies; Mexico, Brazil, India, and China are
151
Republic of Botswana Minstry of Environment, Wildlife, and Tourism (2011). Second National Communication to the UNFCCC. 152
World Bank Civil Society Team (2007). “Consultations with Civil Society: A Sourcebook.” Working Document. 153
GAO (2011). “Improvements Needed to Clarify National Priorities and Better Align Them with Federal Funding Decisions.”

86
prominent among them. These strategies have followed a similar trajectory, with an initial focus on
mitigation and then progressively shifting attention to a more comprehensive framework that includes
and, in some cases prioritizes, planning for adaptation.
National strategies have tended to deal with climate change in isolation. Single issue strategies serve a
useful purpose in focusing attention and allowing decision makers to consider policy issues in depth.
However, in the end, governments have to reconcile climate change, growth, and poverty reduction
policy objectives, identify synergies and where these objectives compete or are inconsistent, negotiate
the trade-offs between objectives, and then communicate their priorities clearly. Reviews of the Poverty
Reduction Strategy Papers (PRSP) Initiative make the same point: poverty reduction objectives have to
be reconciled with the need for economic growth if they are to provide a unifying framework for
government. This is not simply because growth can contribute to poverty reduction; it is also because
growth and job creation are usually seen as the higher-level objective. Strategies that fail to take these
higher-level objectives into account are likely to be marginalized in the decision-making process.
Some governments have sought to reconcile climate change, environmental, and growth objectives
through “green growth” strategies. The Republic of Korea launched its National Strategy for Green
Growth in August 2009. The strategy seeks to shift Korea toward a low carbon development path, build
resilience to cope with climate change, and also develop a new growth engine through the development
of green technology; the vision is to position Korea as a global leader in the field by 2020.154 Other
countries framing green growth strategies, including Ethiopia, Rwanda, Vietnam, and Cambodia, have
tended to emphasize the low carbon and sustainable development dimensions of the strategy, although
they too highlight the opportunities for technological transfer, the development of specific green
industries, and employment.
Most of the national strategies are rather abstract and have to be translated into other planning
instruments for implementation purposes. Climate change strategies identify objectives and policy
measures, they assign institutional responsibility for implementation, and sometimes they also identify
specific targets that the strategy is expected to meet. None of the strategies reviewed, however, was
developed within an explicit resource constraint; none systematically addresses the aggregate cost of
implementation; and only a few cost out specific policy measures (and then only in terms of short-term
costs, often geared to mobilizing external financing for specific projects). Implementation is left to other
planning instruments. In Rwanda and Ethiopia, where development of green growth strategies has been
led by environmental agencies, the strategy documents explicitly acknowledge the need to integrate the
strategy into a higher-level planning instrument led from the center of government for the purposes of
implementation. 155 156
Governments are gradually moving toward the integration of climate change into their development
planning processes. This is a necessary step in many countries to transition climate change from a
154
UNEP (2010). “Overview of the Republic of Korea’s National Strategy for Green Growth.” 155
Government of Rwanda (2013). Economic Development and Poverty Reduction Strategy 2013-2018: Shaping Our Development. 156
Federal Deomocratic Republic of Ethiopia (2010). “Growth and Transformation Plan (GTP) 2010/11-2014/15.

87
sectoral and primarily environmental issue to a component of the broader development agenda.
Integration is often a gradual process that builds on earlier climate change policy analysis and strategies.
China’s first national climate change framework, the National Climate Change Program, was approved in
2007. This was followed in 2008 by a more strategic instrument, Policies and Actions for Addressing
Climate Change, and a comprehensive Climate Change Resolution adopted by the People’s Congress in
2009. These instruments laid the foundation for the integration of climate change considerations,
including emissions reductions targets, in China’s 12th Five Year Plan, published in March 2011.157
Indonesia has followed a similar path. Indonesia’s National Development Planning Agency, BAPPENAS,
developed the National Development Planning Response to Climate Change (its “Yellow Book”) in 2009;
it provides guidance on the integration of the country’s Climate Change National Action Plan into the
2010–2014 National Mid-Term Development Plan.158 The Yellow Book provided a “road map” for sectors
on the integration of climate change policies, programs, and projects into their sector development
strategies in order to achieve mitigation and adaptation objectives.
Integration provides a framework for dealing with the more operational aspects of the planning
process and avoids the creation of parallel planning systems and the duplication of effort.
Development plans typically build on a bottom-up structure of sector and agency plans. The central
planning agency issues guidance on policy priorities and how these should be addressed by the sectors.
Policy guidance should, ideally, be accompanied by an indicative resource envelope. Traditionally,
development plans have focused on public investment and were geared to the identification and
programming of investment projects. Over the last 15 years, however, there has been a marked shift
toward sector strategies that are geared toward the achievement of sector development objectives and
results; these have typically been expressed in terms of the quality and level of service delivery and
improvements in the welfare of target populations. These sector strategies increasingly take into
account recurrent and investment expenditures, as well as domestic and external financing, thereby
allowing decision makers to make trade-offs between applications of funds. The sector strategies
provide guidance to agency managers in developing their own internal work programs and budgets.
They also include a reporting framework that allows agency management to track progress and report
to external audiences. Agencies use these sector strategies and plans to inform their input into the
national planning process. They also use sector plans to inform their budget proposals and medium-
term expenditure plans (see Chapter 7).
While integration encourages agencies to take climate change into account, it is best seen as a work in
progress. OECD identifies particular points in the sector planning process when climate change
considerations should be taken into account: in preparatory analytical and diagnostic work, notably
through tools such as ; in the formulation of sector policies; in the selection and formulation of
individual programs and projects; and in identifying potential cross-cutting activities.159 In principle,
integration of climate change considerations encourages agencies to identify climate change
157
National Developmend and Reform Commission, People’s Republic of China (2011). Twelfth Five-Year Plan. 158
National Development Planning Agency, Indonesia (2009). National Development Planning Response to Climate Change. 159
DAC Network on Environment and Development Cooperation (ENVIRONET), OECD (2008). Strategic Environmental Assessment and Adaptation to Climate Change. Endorsed by members of ENVIRONET at their 8th Meeting on 30 October 2008.

88
vulnerabilities, potential lock-ins, and co-benefits, thereby allowing them to address tradeoffs between
climate change mitigation and adaptation and development objectives. In practice, sector planning
processes often suffer from information constraints, difficulties in clarifying agency goals and objectives,
and difficulties in translating lofty objectives into work programs and budgets. Reviews of the
integration of climate change considerations in sector planning, both in Annex I and non-Annex I
countries, tend to confirm that these problems are compounded when it comes to new policy agendas,
including climate change.160 Capacity constraints come to the fore, with sector staff having limited
awareness of climate change issues and their implications and central planning agency staff equally ill-
informed and unable to adequately integrate these issues into their duties. It is still unclear what the
expectations are as regards climate change integration and how to measure progress against this goal.
Given the early stage of development of climate change planning, most countries will still need a
dedicated climate change planning process and increased capacity for some time to come. Climate
change is an emerging policy agenda. Not only is the future course and impact of climate change
uncertain, but so too is the effectiveness of mitigation and adaptation policy measures. Climate change
policies and strategies will have to be adjusted as decision makers learn from experience and gather
more information regarding future climate change impacts and adaptive capabilities. This will require
specialist skills and capacity to update strategies. The UNFCCC National Communications reporting
framework can contribute structure and discipline in this process at a national level. Periodic updating of
the climate change risk and vulnerability assessments provides an opportunity to update adaptation
strategies and national plans.
Policy Continuity
Climate change requires a much longer planning horizon than is typically used for routine
development planning: extending from 20 to 50 rather than five to 10 years. Over these extended
planning horizons governments will have to balance flexibility in implementation with policy continuity
and commitments to their policy goals. Households, communities, the private sector, and local
government will need to frame decisions regarding the appropriate response to climate change, taking
into account the government policy goals. If these diverse stakeholders are to make long-term
investments, and changes in their business practices, their livelihoods, and their way of life, they will
have to be reasonably confident that government policy can be predicted and that policy commitments
made today will be honored in the future. These commitments will have to extend well beyond the
usual political cycle. Policy statements and plans can signal this commitment, particularly where the
country has a track record of policy continuity through political transitions. Policy commitments can be
strengthened through the use of long-term targets where they can be monitored and enforced through
legislation. Targets have only been applied to mitigation objectives, largely due to the difficulties in
defining appropriate measures of adaptation.
Enactment of legislation signals a long-term commitment to policy both through broad political
endorsement at the time of approval and the constraints that it imposes on future administrations. In
160
Oates, Naomi et al (2011). “The ‘mainstreaming’ approach to climate change adaptation: insights from Ethiopia’s water sector.”

89
most countries, legislatures are consulted on major policy initiatives. As climate change has emerged on
the policy agenda, some legislatures have established climate change committees or working groups—
or added this mandate to existing environmental committees or working groups—to strengthen their
oversight over this agenda. Government policy documents, strategies, and plans may be subject to
review, debate, and endorsement by the legislature. Legislative approval of these instruments may not
have the force of law but it does serve a signaling function, highlighting policy objectives and
demonstrating political commitment beyond the executive. Legislation is required where policy creates
new or modifies existing institutions, binding targets, earmarked funding, taxes, regulations, and
sanctions.
Framework legislation typically lays out climate change objectives, in some cases with commitments
to specific targets, and puts in place the institutional, fiscal, and regulatory instruments needed to
achieve these objectives. While early examples of framework legislation were geared to the
achievement of mitigation objectives, more recent legislation also addresses adaptation (as in United
Kingdom and Mexico), and, in some non-Annex I countries, even primarily geared to adaptation (as in
the Philippines). The framework legislation typically assigns institutional responsibilities for policy
making and implementation. Among non-Annex I countries, the institutional framework has often
provided for the establishment of a national climate change fund, in some cases with earmarked
revenues and in others as the recipient of external climate change financing. Chapter 6 explores the
rationale for these arrangements and their implications for financial management.
Climate change policy also requires sector specific legislation. This typically includes energy efficiency
and renewable energy as well as laws governing forest, water, and land use management. Again, most
of these initiatives support climate mitigation objectives, in some cases as a secondary rather than the
primary objective of the legislation. Legislation that addresses adaptation objectives tends to focus on
disaster risk management (and, in particular, on the division of responsibilities and allocation of
resources between central and local authorities). In the Philippines, for example, the Climate Change Act
requires local authorities to prepare Climate Change Action Plans and set aside a portion of their
budgets for risk mitigation and as a contingency for disaster response. GLOBE reports that Bangladesh,
Brazil, Indonesia, Mexico, Nepal, and Vietnam have all put in place legislation to protect against
deforestation in support of their climate change policies. Costa Rica has legislated for payments for
ecosystem services since the mid-1990s.161 Other countries are now following suite in preparation for
REDD+ financing, with legislation recognizing services from protection of forests, soil conservation, and
water management. REDD+ legislation also has to deal with the assignment of property rights for carbon
and the rights of forest and indigenous peoples. Many of these issues are politically contentious. Brazil
established a multi-stakeholder commission in 2009 to develop REDD+ legislation; this commission
provides a framework to arrive to a broad consensus on the appropriate policy.162
161
Sánchez-Azofeifa, G.A., Pfaff, A., Robalino, J.A., Boomhower, J.P. (2007). Costa Rica’s payment for environmental services program: intention, implementation, and impact. Conservation Biology 21, 1165–1173. 162
Chagas, Thiago (2011). Carbon Rights in Brazil, Background Paper for the the World Bank.
90
Long-term GHG emissions reductions goals can also signal sustained commitment to a policy
objective, particularly where the long-term goals are accompanied by short-term targets that can be
both monitored and enforced. From a theoretical perspective, goals should be set over an extended
time frame, encouraging decision makers to take into account the widest possible range of options, with
short and extended returns, when planning emissions reductions. However, when faced with an
extended lead time, decision makers may be tempted to delay taking action. So, long-term goals (e.g., to
2050) have to be complemented by short-term targets (e.g., to 2020). Short-term targets alone may also
be inefficient because decision makers may opt for the least expensive solution that achieves the
immediate target regardless of longer-term consequences. This may lock in inefficient technology and
infrastructure, making it impossible to reach longer-term goals, or discourage investments that impact
on emissions over the longer-term (such as changes in land use and investments in mass transport and
renewable energy). Sectoral targets or other policy measures may be needed to promote investment
where the returns take longer to materialize and where decision makers are uncertain regarding the
government’s commitment to long-term policy.163
Box 2.2. U.K. Carbon Budgeting
The 2008 Climate Change Act provides for five-year carbon budgets which set annual levels for permissible emissions in CO2e tons. Consecutive budgets chart the course toward the long-term goal of an 80-percent reduction in GHG emissions by 2050. The first four carbon budgets have been set in law, covering the period 2008-2027, with a target of halving U.K. emissions relative to 1990 during the fourth carbon budget period (2023-2027). Budgets are divided into two parts: the traded sector, which covers power and heavy industrial activities that are reflected in the EU Emissions Trading System (EU ETS) limit; and the non-traded sector, which covers road transport, agriculture, and buildings. The Act requires the government to report annually on emissions and progress toward meeting the carbon budgets, following statutory carbon accounting procedures. The Act also requires the government to set out its policies for achieving these carbon budget targets. In compliance with this requirement, the 2011 Carbon Plan describes the government’s strategy sector by sector: in buildings, better insulation and energy efficient heating; in transport, substitution of the existing fleet with ultra-low emission vehicles; in energy generation, by shifting from coal to gas and renewables; and, in industry, through improvements in energy efficiency.
The Climate Change Act also establishes a Committee on Climate Change as an independent expert advisory body which can make recommendations to the government on climate change policy, budgets, and the appropriate balance between domestic action and international trading in carbon allowances. The Committee reports annually to Parliament. Reports review progress against targets, assess the effectiveness of government policy, and identify areas where the government may be able to take action to strengthen performance. The government is required to respond to its reports. The Committee also undertakes detailed sectoral studies to inform its policy advice. In addition, every five years the Committee must undertake a comprehensive assessment of progress toward the long-term targets.
Sources: Information regarding the Climate Change Act can be found at http://www.theccc.org.uk/. Details regarding U.K. carbon budgets can be found at https://www.gov.uk/government/policies/reducing-the-uk-s-greenhouse-gas-emissions-by-80-by-2050/supporting-pages/carbon-budgets.
Emissions reductions targets in some Annex I countries have incorporated some of these design
features. The European Union has used a combination of economy, sector, and country-specific targets.
163
Vogt-Shilb, Adrien, and Stephane Hallegatte (2011). “When starting with the most expensive option makes sense : use and misuse of marginal abatement cost curves.”

91
The climate change targets for 2020 commit all member states to a 20-percent reduction in EU GHG
emissions from 1990 levels, a 20-percent increase in the share of EU energy consumption produced
from renewable resources, and a 20-percent improvement in energy efficiency. In order to achieve the
GHG emissions reduction targets, an overall cap has been set on allowances under the European Trading
Scheme and reduced each year. Binding targets were set for each member state for emissions outside of
the ETS, taking into account their initial starting position and development requirements; these range
from -20 percent for Denmark, Ireland, and Luxembourg to +20 percent for Bulgaria. Targets for raising
the share of renewable energy are also distributed among member states, taking into account their
different starting points and the potential for increasing renewables production; these targets range
from 10 percent in Malta to 49 percent in Sweden. Progress against these targets is monitored annually
by the Commission and through a peer review process. The United Kingdom’s 2008 Climate Change Act
binds future governments to both short-term targets, a reduction of 26 percent in GHG emissions by
2020 (relative to 1990 levels), and a long-term goal of reducing GHG emissions by80 percent by 2050.
Carbon budgets are used to program and monitor progress toward these goals, with independent
oversight to ensure that the government is meeting its statutory commitments (see Box 2.2).
Non-Annex I countries have also committed to economy-wide emissions reductions targets. They have
done so in a variety of ways. Box 2.3 reflects four distinct formulations: as reductions in emissions in
comparison to a base year; as reductions in relation to a business-as-usual (BAU) scenario; as reductions
in emissions intensity; and as carbon neutrality. There are a number of methodological challenges in
interpreting these targets—the sectors and gases covered, the choice of base year, the treatment of
offsets, the nature of the business-as-usual scenario, and the means by which carbon neutrality will be
achieved (not to mention challenges related to the quality of GHG inventories)—which can have an
impact on the actual level of emissions reductions achieved.164 Mexico has enacted its targets in
legislation, albeit subject to financing and technology transfer. Other countries, including China, India,
Indonesia, and South Korea, have included commitments to emissions reductions in national planning
instruments. While several countries’ commitments extend to strengthening their GHG emissions
monitoring arrangements, they do not include mechanisms for independent review of progress on
reaching their targets. Nonetheless, the process of setting targets serves a useful purpose in signaling
the government’s commitment to reductions in emissions and providing national authorities with a basis
for monitoring progress against their goals.
The reality, of course, is that only a broad political consensus can sustain climate change policy
objectives beyond the current political cycle. The withdrawal of Canada from the Kyoto Protocol in
2011 and the repeal of the Kyoto Implementation Act of 2007 in June 2012 demonstrate that policy
commitments are not binding on future administrations even when enacted in legislation. Legislation
can be repealed, voluntary targets ignored, and binding targets revoked. Colin Challen, former chair of
the Parliamentary All-Party Climate Change Group in the United Kingdom, proposed taking the policy
process out of the hands of Parliament by establishing a permanent cross-party commission to agree on
a consensus climate change policy framework, with its discussions held in public and decisions subject to
164
Levin, Kelly and Jared Finnegan (2011). “Assessing Non-Annex I Pledges: Building a Case for Clarification.” WRI Working Paper. World Resources Institute, Washington DC.

92
a referendum to give the process legitimacy.165 However, these kinds of institutional arrangements pose
their own risks, in this case potentially limiting debate on climate change policy and discouraging more
radical ideas. In the end, there is no substitute for broad, bottom-up popular support for the climate
change agenda. Increasing awareness of the risks from climate change can help shift public opinion–and
politicians’ incentives–in favor of taking short-term action to address longer term needs and create
political space for policy debate over alternative strategies for achieving climate change goals.
Box 2.3. Examples of Non Annex I Climate Change Policy Targets
Relative to Base Year Relative to BAU Carbon Neutrality Carbon Intensity*
Antigua and Bermuda: 25% below 1990 levels by 2020
Belarus: 8% below 1990 level by 2020
Kazakhstan: Reduce emissions by 15% below 1990 level by 2020
Marshall Islands: 40% below 2009 levels by 2020
Moldova: no less than 25% below 1990 by 2020
Montenegro: Reduce emissions by 20% below 1990 by 2020
Brazil: 36.1-38.9% below projected emissions in 2020
Chile: 20% below the BAU in 2020, as projected from 2007
Indonesia: 26% below BAU by 2020
Israel: 20% below BAU by 2020
Mexico: up to 30% below BAU in 2020
Papua New Guinea at least 50% below BAU by 2030
Singapore: 16% below BAU by 2020
South Africa: 34% below BAU by 2020
South Korea: 30% below BAU in 2020
Bhutan: Intent to ensure that its emissions do not exceed its sequestration capacity
Costa Rica: Implement a long-term, economy-wide transformational effort to enable carbon-neutrality that will help to significantly deviate from BAU emissions scenarios until 2021 and beyond
Maldives: Intent to achieve carbon neutrality by 2020
China: 40-45% reduction in CO2 emissions per unit of GDP by 2020 compared with 2005 level.
India: Reduce emissions intensity of GDP by 20-25% by 2020 in comparison to the 2005 level
*ratio of GHG emissions to GDP
Business-as-usual is a hypothetical trend in GHG emissions in the absence of policy measures that are specifically intended to reduce emissions. BAU scenarios will vary depending on projections of future growth and the carbon intensity of this growth path, reflecting the structure of growth and technological developments. BAU may also incorporate the mitigation impact of policies introduced for other purposes. The emissions reductions achieved as a result of targets relative to BAU can only be understood in relation to the specific BAU scenario being used.
Carbon neutrality usually refers to the achievement of zero net anthropogenic carbon emissions by balancing the amount of carbon released with an equivalent amount sequestered. For Costa Rica, CO2e GHG emissions are balanced against the amount of CO2e GHG sequestered and emissions avoided through mitigation actions.
Sources: UNEP (2012). The Emissions Gap Report 2012: A UNEP Synthesis Report. Levin, Kelly and Jared Finnegan (2011). “Assessing Non-Annex I Pledges: Building a Case for Clarification.” WRI Working Paper. World Resources Institute, Washington DC.
Coordination and Consultation
Climate change is a cross-cutting policy issue that involves multiple agencies at all levels of
government. In South Africa, for example, a review conducted by the Department of Environmental
Affairs concluded that at least 21 of the 32 central government sectoral departments were directly
involved in the implementation of climate change policy at a national level. Of these, 13 departments
are considered as playing a key role in policy implementation, among these the central finance and
165
Giddens, Anthony (2008). “The Politics of Climate Change: National Responses to the Challenge of Global Warming.” Policy Network Paper.
93
planning agencies. In addition to these central government agencies, climate change policy development
and implementation involved agencies at all levels of local government.166 Reviews of the institutional
arrangements in other developing and developed countries paint a similar picture of institutional
complexity. The international dimensions of climate change adds further complication, requiring an
institutional structure to manage relations with the key international bodies, leading to the nomination
of national focal points, reporting entities, and designated national authorities.
Given this institutional complexity, coordination and clarity regarding institutional roles and
responsibilities figure prominently among the functional requirements of an effective climate change
planning system. Political leaders have proved critical in bringing institutions together around a
government-wide climate change agenda in Brazil, Mexico, the Philippines, Vietnam, and other nations.
However, responsibility for policy development and implementation and the coordination of agencies
cannot rely on high level leadership alone: these responsibilities have to be formally assigned to
institutions. The solutions have usually been the designation of a lead agency together with the
establishment of a formal cross-governmental coordination mechanism, typically a committee, and
networks of climate change focal points within government agencies.
Decisions regarding the appropriate institutional location of responsibility for climate change policy
will be influenced by policy and political considerations. Governments have typically adopted one of
these broad organizational models for the lead agency on climate change issues: assigning responsibility
to the environmental agency; assigning responsibility to a sector agency with a significant role in climate
change policy; establishing a dedicated climate change agency or authority; or assigning responsibility to
the central planning agency. Selection of the lead agency will have practical implications for the way in
which the policy process is managed, with institutions at the heart of government(e.g., cabinet office,
central finance and planning agencies) tending to have greater authority in relation to sector agencies,
not least owing to their control over resources. In selecting between alternatives, policymakers’ views
on the nature and purpose of climate change policy figure prominently. A key consideration here will be
the extent to which climate change continues to be seen as an environmental issue versus recognized as
part of a broader development agenda. Political considerations and interests will also weigh heavily as
agencies and their political leaders compete to secure access to resources and influence. Box 2.4
examines how these factors can impact on institutional arrangements.
Environmental agencies lead the climate change policy agenda in the majority of countries. To some
extent this is simply a legacy issue (climate change emerged as an environmental issue and so was
initially assigned to environmental agencies), but it also reflects a need for intellectual leadership on
climate change policy issues. Environmental agencies are well placed to play this role. Of all government
agencies they are the most likely to have the expertise needed to undertake climate change risk and
vulnerability assessments and the analytical work on the environmental dimensions of climate change
policy; they are also positioned to act as advocates, raising awareness. As climate change policy evolves
from an environmental issue into a mainstream development issue, however, the shortcomings of this
institutional arrangement become apparent. Most environment agencies are second-tier institutions:
166
Department of Environmental Affairs, South Africa (2011). National Climate Change Response White Paper.

94
technically the peers of other sector agencies, they generally have lower status owing to the limited
human and financial resources at their disposal. Consequently, environment agencies lack the authority
and means to integrate climate change considerations into other agencies’ plans, programs, and
projects. This is particularly true in developing countries where the institutional and legal framework for
environmental protection regulations tend to be less effective.167
Box 2.4. Institutional Politics of Climate Change
Policy processes aimed at strengthening the institutional framework for managing the response to climate change in Nigeria led to the development of two competing proposals: one, establishing a new National Climate Change Commission reporting directly to the president; the other, a national agency subordinate to the Federal Ministry of Environment (FMEnv).
The Ministry of Environment’s Special Climate Change Unit (SCCU) is the lead agency for climate change policy in Nigeria. The SCCU is responsible for preparing the National Communications, it is the CDM Designated National Authority, and it has convened the National Roundtable on Climate Change (NRCC), an advisory body comprising representatives from all relevant stakeholders including the businesses. Concerned that the existing institutional and legal arrangements do not provide an adequate framework for the implementation of climate change policy, SCCU has sought to bolster its authority through its elevation to the status of a national agency under the Ministry.
Civil society organizations argue that the FMEnv has been ineffective in coordinating climate change action across government and in mobilizing resources to tackle climate change issues. They have encouraged the National Assembly to take legislative initiative to raise the profile of the climate change agenda and have been active proponents of the commission as a multi-stakeholder body (including civil society representatives). The commission would strip the FMEnv of many of its powers and assume authority to coordinate climate change initiatives across government and with other stakeholders (including business and state and local government). The commission would replace FMEnv as the CDM Designated National Authority. The commission would address climate change as part of a broader development agenda and FMEnv would become just one of several government agencies represented.
The Nigerian National Petroleum Corporation (NNPC), a joint venture between Nigerian and foreign interests, has been actively involved in the climate change agenda. A former NNPC director has participated in Nigeria’s UNFCCC delegation. NNPC and civil society have differing views on mitigation policy. NNPC advocates the use of CDM financing to reduce gas flaring in the oil industry. Civil society organizations are critical of this approach, urging the government and the oil industry to use their own resources to tackle the problem. NNPC would be represented in the proposed commission but would only be one of many stakeholders. Donors, meanwhile, see FMEnv as playing a vital role but would like to strengthen government capacity on climate change issues and its influence on government policy. FMEnv has actively promoted Nigerian business engagement on climate change issues but, as yet, the sector has shown little awareness of climate change issues and opportunities.
Both bills were submitted to the National Assembly in 2009. The Commission Bill was approved in August 2010, thereby rejecting the proposed national agency. However, the legislation has been returned to the Assembly unsigned by the president for reconsideration, and a final choice between alternative institutional arrangements has yet to be made.
Source: Koblowsky, Peter and Chinwe Ifejika Speranza (2012). African developments: Competing institutional arrangements for climate policy: the case of Nigeria. Bonn: German Development Institute/Deutsches Institut für Entwicklungspolitik (DIE) (Briefing Paper 7/2012).
167
Madzwanuse, Masego (2010). Climate Change Vulnerability and Adaptation Preparedness in South Africa.
95
Assigning responsibility for climate change policy to a sectoral ministry can lend authority to the
agenda. This makes sense where this sector is critical to the government’s climate change policy
objectives. Some Annex I countries have given leadership on climate change to the energy agency,
recognizing that improvements in energy efficiency and the shift to renewables will be key mitigation
policies. Australia, for example, closed its standalone Greenhouse Office in 2008 and established a
Department of Climate Change and Energy Efficiency. The United Kingdom and Denmark have adopted a
similar agency structure. Among developing countries, leadership on climate change may be located in
the forestry agency or an agency that shares sectoral as well as environmental responsibilities (e.g.,
Bangladesh). In, Pakistan, climate change has been added to the mandate of an institution formerly
responsible for disaster risk management. While this approach can help focus the government’s climate
change strategy on priority sectors, it does raise potential conflicts of interest: the sector perspectives
may marginalize climate change policy concerns and the policy agenda may be captured by interest
groups in the sector, including those of the private sector.
Establishment of a dedicated climate change agency can signal the importance of climate change on
the policy agenda, particularly when this agency is located at the heart of government. The institutions
most frequently established are national climate change funds. These are usually simply funding vehicles
with earmarked funds and external financing for climate-change-related programs and projects. It has
been suggested, however, that these funds should assume a broader policy leadership and coordination
function. The literature is surprisingly ambivalent on the benefits of this approach. While acknowledging
the signaling effect and the contribution a well-resourced agency dedicated to the climate change
agenda can make to policy analysis and monitoring, studies also highlight the risks that a standalone
agency can isolate the climate agenda. Drawing on the experience of the introduction of environmental
issues into the policy agenda decades ago, some analysts have argued that introducing a new champion
can antagonize existing institutions by failing to take into account policy and institutional constraints—
thus reducing the climate change policy agenda to a zero-sum game. It may also lead line agencies to
downplay their own role in climate change, deciding climate change is their problem and not ours Hertin
et al. 2008).168 One approach has been to establish a dedicated unit, with a coordination function (rather
than policy development, implementation, and monitoring functions), in a central political office. In
Kenya, for example, the Office of the Prime Minister established a Climate Change Coordination Unit to
provide political support to climate change activities across government agencies. This is reported to
have had some success in raising the profile of the climate change agenda and encouraging agencies to
participate in coordination efforts.169
Giving a central planning agency leadership on the climate change agenda signals that climate change
is a government-wide development priority and helps to integrate climate change considerations into
the government’s planning and budgeting routines. This location is consistent with and enables the
shift from climate change as an environmental issue to part of a broader, mainstream development
agenda. This remains, however, a relatively rare institutional arrangement. China has followed this
approach. China’s National Development and Reform Commission, the central planning agency, has
168
Mickwitz, Per et al. (2009). Climate Policy Integration, Coherence, and Governance. 169
Government of Kenya (2010). National Climate Change Response Strategy.

96
created a Climate Change Department which takes the lead on climate change policy issues and
coordination across government with regard to national and international planning instruments. In
other countries with a strong central planning function (including Indonesia and Vietnam), the planning
agency has assumed a more prominent role in climate change strategies without taking on responsibility
for all climate change policy functions. Engagement of the planning agencies is essential to the effective
integration of climate change issues in routine planning instruments since they provide guidance to line
agencies on plan preparation and review agency proposals.
Central finance agencies are also beginning to assume a more prominent role within the climate
change agenda. As the policy agenda shifts from environment to development, and fiscal rather than
regulatory instruments are used to implement climate change policy, the role of the central finance
agency becomes more important. Some central finance agencies, such as in Indonesia, have
systematically assessed the policy instruments at their disposal and the agencies’ institutional role.170
Others have naturally assumed a more prominent role as climate change has risen to prominence on the
development agenda. There is growing recognition that they are critical players, not least in terms of
ensuring that climate change considerations are reflected in fiscal policy and in the budget and
expenditure planning process (Chapter 7).
Governments have established ministerial and technical committees to strengthen policy and
operational coordination between agencies on climate change issues. Typically, these committees
coordinate the preparation of government-wide climate-change-related policies and plans and oversee
their implementation. The lead climate change agency serves as secretariat to the coordinating body
and chairs meetings. Many of these coordinating arrangements have estabished subcommittees to
manage specific elements of the climate change agenda. In Mexico, for example, the Inter-Ministerial
Commission has subcommittees on program development, mitigation, emissions reduction, adaptation,
and deforestation.171 In India, subcommittees are structured around eight climate change missions:
solar; energy efficiency; sustainable habitat; water; Himalayan ecosystem; "Green India"; sustainable
agriculture; and strategic knowledge172. Participation of the key sector agencies is essential. Most
countries include the central finance and planning agencies as permanent members along with the line
agencies that are more directly involved with mitigation and adaptation policy (Box 2.5)
Agency climate focal points and technical groups reinforce policy level coordination efforts. Officials in
line agencies often have limited understanding of climate change and its implications. The
mainstreaming of environmental policies has led to a similar challenge. A review of Poverty Reduction
Strategies concluded that environmental issues were often omitted as a genuine oversight because
planners were unaware of the environmental risks and impacts of specific policies.173 Bangladesh has
sought to address this capacity challenge by identifying climate change focal points in each of the line
agencies. Where these focal points are sufficiently senior and placed in agency policy and planning
170
Ministry of Finance (2009), Ministry of Finance Green Paper: Economic and Fiscal Policy Strategies for Climate Change Mitigation in Indonesia, Ministry of Finance and Australia Indonesia Partnership, Jakarta. 171
http://www.cambioclimatico.gob.mx/index.php/politica-nacional-sobre-cambio-climatico.html#gt_pecc. 172
Government of India, Prime Minister’s Council on Climate Change (2009). National Action Plan on Climate Change. 173
World Resources Institute (2005). "Mainstreaming" the Environment in PRSPs: The Unfulfilled Promise.

97
functions, they may be able to influence agency strategy, programs, and projects. Over time,
investments in capacity building can help raise the overall level of awareness regarding climate change
and its implications for specific sectors.
Coordinating climate change policies and actions within, between, and across multiple levels of
government poses a particular challenge. Coordination arrangements will need to consider the
respective roles of central and local governments as part of a broader framework of intergovernmental
relations. In unitary states, climate change planning structures can be mandated at lower levels of
Box 2.5. Examples of Climate Change Coordination Arrangements
Country Coordination Body Est. Chair
Bangladesh National Steering Committee on Climate Change
Minister of Environment and Forests
Brazil Inter-Ministerial Commission on Climate Change
1999 Ministry of Science and Technology
Cambodia National Climate Change Committee 2006
China National Leading Group on Climate Change
2007 Premier
India Advisory Council on Climate Change
Prime Minister
Indonesia National Council for Climate Change
President
Mexico Inter-Ministerial Commission on Climate Change
2005 Ministry of Environment and Natural Resources
Nepal Climate Change Council 2009 Prime Minister
Nigeria National Roundtable on Climate Change
2008 Federal Ministry of Environment
Philippines Presidential Task Force on Climate Change
2007 President
Singapore National Climate Change Committee 2007
South Africa Inter-Ministerial Committee on Climate Change
2009
Vietnam National Steering Committee
Prime Minister
administration. In China, almost all provincial governments and many governments at the prefecture
and county level now have Leading Groups on Climate Change, headed by the respective heads of
administration. Provincial Development and Reform Commissions, functionally subordinate to China’s
National Commission, provide technical guidance and facilitate communication between the various
levels of administration. Nepal has launched a local adaptation planning exercise that seeks to empower
communities to develop bottom-up action plans that can be consolidated with and inform planning by
local authorities—and ultimately provide feedback to the national level (see Box 2.6). In states where
key government functions are delegated to autonomous administrations, formal coordination
mechanisms will generally be needed. In Spain, for example, the Climate Change Policies Coordination

98
Committee serves as the coordinating body between Spanish Government and the country’s
autonomous authorities. Where there are large numbers of autonomous local authorities (i.e.,
municipalities), coordination arrangements are likely to involve a patchwork of different models without
formal mechanisms for communication between and among them.
Box 2.6. Local Adaptation Planning
In 2010, the Government of Nepal launched a pilot Local Adaptation Plan for Action (LAPA) program in 13 districts. The LAPA framework seeks to integrate climate change adaptation planning into district planning activities through a bottom-up, inclusive process that identifies the most vulnerable people and enables them to make informed decisions about the priority adaptation actions. LAPAs are prepared using a simple, participatory methodology that draws on local knowledge as well as on scientific evidence of climate change. It seeks to empower the most vulnerable, typically lower castes and the poor, by providing them with a voice in decision making. Adaptation actions identified through participatory processes at the community level are consolidated by Village Development Committees and integrated into district-level plans. Water management is the major climate-related concern, and many of the actions identified relate to flood control and preparedness, water conservation, changes in cultivation practices, and accessing financial resources (e.g., micro-insurance and microcredit).
The government endorsed a National Framework for LAPA in 2011, announcing that 80 percent of future climate change finance will be allocated to support locally identified projects. It is now rolling out the LAPA process, with donor support, to new districts. Recognizing this as an important element of the climate change planning architecture, government agencies are now exploring how they can link the bottom-up planning process to top-down policy priorities, such as policies that seek to reduce the use of biomass for household energy through alternative, renewable energy sources.
Reviews of the LAPA process highlight the potential for bottom-up, participatory planning, but they also note that implementation faces significant institutional and social barriers. There are no elected officials at the district or village level in Nepal. Villagers complain that district officials are sometimes aloof and unresponsive, particularly to those from lower castes. Village Development Committees are often dominated by local elites who use access to information to maintain their control over resources. There are no mechanisms to channel resources directly to communities or to monitor projects and activities implemented at the local level; this raises concerns about bureaucratic and elite capture—and highlights the links between adaptation and the broader development process. It also highlights the need for specific measures to strengthen the design and targeting of adaptation programs and projects if resources are to reach the poor and vulnerable groups.
Source: Tiwari, Krishna R. et al (2014). Does Nepal’s Climate Change Adaptation Policy and Practices Address Poor and Vulnerable Communities? Watts, Robbie (2012). Linking National and Local Adaptation Planning: Lessons from Nepal, Case study 3. The Learning Hub, IDS, UK.
Coordination arrangements can facilitate and empower local authorities to take the initiative and
innovate in both mitigation and adaptation activities. To fulfill this role, central government has to
combine a “top-down” enabling policy environment which allows local governments room to innovate
and take the initiative on a wide range of climate change policy issues with a “bottom-up” experience
acquired through successful local programs to inform policymaking by the central government.174This
places a premium on sharing of information. Central governments are particularly important as a source
of information on climate change science, risk and vulnerability assessments, policy analysis, and tried
and tested tools for applying information in decision-making. Much of this information is likely to come
174
Corfee-Morlot, Jan et al. (2009). Cities, Climate Change, and Multilevel Governance. OECD Environment Working Papers, No. 14.
99
from climate change agencies. However, the agencies responsible for local government can also play an
important role, after all they are in regular contact with local authorities and are generally responsible
for providing guidance on local government planning, reporting and governance.
Engagement and consultation with stakeholders outside of the public sector is a critical element of
climate change governance. Consultation is increasingly seen as an integral part of the government’s
policy and planning process as it can improve the quality, relevance, and responsiveness of public
services. Advocates argue that consultation with stakeholders can access tacit knowledge and
experience that complements scientific information. Consultation also facilitates assessment of
adaptation capacities; increases awareness and builds a shared understanding among stakeholders
regarding impacts, risks, and vulnerabilities; helps to identify and prioritize mitigation and adaptation
measures that meet stakeholders’ needs; and helps policymakers anticipate the response of key
stakeholders to policy initiatives and to identify measures that can be taken to facilitate
implementation. Finally, consultation can achieve some measure of shared awareness of the importance
of taking action on climate change and building a consensus around the appropriate policy response.
Governments have undertaken broad consultations to inform development of climate change policies
and plans. Brazil, for example, created the Brazilian Forum on Climate Change to support the
preparation of the National Climate Change Plan. The forum brought together representatives from
central and local government, the private sector, universities, and civil society. The climate change plan
was subsequently the subject of a series of public consultations. Similar processes have been put in
place in Mexico, India, South Africa, and other countries. Consultations can take place at any level of
government—national, sectoral, and/or local—as long as they relate either to plans or to specific
policies, programs, or projects at that level of government. Indeed, consultation is best seen as an
ongoing, multi-layer process. Laying out a process can help government and stakeholders to structure
the flow of information and participants’ engagement. It can also help to manage expectations regarding
participants’ role in decision making. Setting out a process does not necessarily require formal rules; it
does, however, require the process to be predictable.175 Consultations have tended to be most effective
in mobilizing civil society, largely because the civil society organizations have actively pursued
opportunities to voice their concerns. Specific arrangements may be needed to facilitate engagement
with some other target groups, notably the scientific community and the private sector.
While organizations with an environmental focus dominated the agenda in the early years, civil
society organizations increasingly see their role as advocates for the poor and vulnerable (i.e., groups
that would otherwise be excluded from government decision-making processes). Civil society
organizations have promoted and provided opportunities for the poor and vulnerable groups to be
heard in policy and planning processes, particularly at the local level. They have influenced government
policy by supporting demonstration projects and using lessons from these to feed into wider policy
debates and decision-making processes. They have encouraged governments to engage in climate
change discussions and to launch climate change planning exercises. International Institute for
175
OECD (2001). The DAC Guidelines Strategies for Sustainable Development.

100
Environment and Development (IIED cites the case of Zimbabwe, where civil society organizations
successfully lobbied for the launch of a national climate change strategy process.176
Engagement with the scientific and academic community can strengthen the policy process, focus
attention on evidence, and lend credibility to policy initiatives. Some governments have established
permanent bodies to provide expert advice on scientific issues. India’s Advisory Council on Climate
Change, for example, includes the government’s principal scientific advisor. Mexico has set up a
consultative council for experts as part of the planning process. In the United Kingdom, the Committee
on Climate Change comprises independent experts and fulfills both an advisory and a quasi-oversight
function through its reports to Parliament. Beyond the decision-making process, the scientific
community can play an important role in interpreting, researching, and explaining climate change and
making information transparent and credible. In addition, independent researchers and analysts can
monitor progress toward the achievement of policy objectives. The scientific community also often
works through the media and stakeholder groups to raise awareness on climate change issues.
Development of this capability will require government support, including the financing of applied
research and the facilitation of collaboration with the international community. In developing countries,
development agencies can support these institutions by involving them in program and project appraisal
and evaluation.
Private sector engagement in the planning process is just as important but has received much less
attention. While international corporations may be well-informed, and industries most at risk (e.g.,
insurance) already factoring climate change into their planning, the broader business community’s
awareness of the implications of climate change may lag behind other actors or simply exceed their
planning horizon.177 Both policymakers and the private sector have tended to focus on the business
opportunities and cost implications of mitigation policy. In Korea, private sector representatives were
included in the development of its green growth strategy in order to help identify viable business
opportunities. In Mexico, private sector engagement in the development of climate change framework
legislation primarily focused on the implications of carbon pricing for business costs and investment in
oil and gas. Relatively little attention has been given to climate change impacts on the private sector and
the measures needed to help businesses adapt. Zambia’s Strategic Programme for Climate Resilience
stands out in this context: extensive consultations with local businesses during program preparation
lead to the inclusion of a specific program component to support adaptation initiatives in the private
sector.178 Attention is now turning to awareness-raising activities in other countries. More formal
consultations with the business community may provide a forum to highlight risks and vulnerabilities
and identify policies that support private sector adaptation.
176
Reid, Hannah et al. 2011. Southern Voices on Climate Policy Choices: Analysis of and lessons learned from civil society advocacy on climate change. 177
Agrawala, S. et al (2011). Private Sector Engagement in Adaptation to Climate Change: Approaches to Managing Climate Risks. OECD Publishing. 178
Government of Zambia (2011) Zambia: Strategic Programme for Climate Resilience (SPCR). Prepared for the Pilot Programme for Climate Resilience June 14, 2011.
101
CHAPTER 3. DECISION MAKING
3.1. CHAPTER SUMMARY
Governments face tough choices, competing priorities and constrained budgets. Using limited
resources wisely is essential to achieving fiscal efficiencies, to “climate proofing” investments in
physical infrastructure, and to maximizing the benefits of investments made to help society adapt to
the impacts of climate change. But making the right choices is not easy: measuring the desired
outcomes can be difficult and partly subjective; there are large risks in climate change that can be
difficult to measure; and there are uncertainties that may be completely unknown (“unknown
unknowns”) and thus impossible to measure.
Decision makers use analytical tools and processes to inform and guide the allocation of scarce
resources among competing policies, programs, and projects. Among them, these tools can facilitate
discussions on the most important factors to consider when formulating adaptation policies; select
among the most cost-effective options to achieve a specific outcome; and understand how sensitive
results are to factors such as future discount rates and carbon prices. The main decision-making tools
are:
Multi-criteria analysis, which requires stakeholders to list their main objectives in adaptation. This can
help to clarify preferences and priorities (e.g., a farmer, an economist, and a local government official
are unlikely to voice the same priorities) and facilitate communication and highlight common ground,
differences, and possible tradeoffs between stakeholders’ interests and perspectives. This approach is,
however, unitless (and thus difficult to measure) and subjective.
Cost-effectiveness analysis, which can be used to compare policies, programs, or projects in relation to
achieving a specific aim. This approach is often used to compare mitigation measures in the form of
marginal abatement cost curves, which show the cheapest way to reduce greenhouse gas (GHG)
emissions (although implementation time and other factors may make it optimal to begin with more
expensive options).
Cost-benefit analysis, which compares the cost of an investment with the projected return (benefit)
over some time period. This tool makes it possible to compare a broad range of interventions, even if
these target different outcomes (e.g., reducing flooding of houses versus protecting crops from
drought). It also allows social costs to be considered by integrating techniques that help to understand
the value society places on different outcomes (although these techniques themselves are imperfect). In
addition, this tool can be used to understand how sensitive the outcomes are to future discount rates or
the price of GHG emissions.
Whichever combination of tools is used, ensuring flexibility in the future will be important in most
cases, given the high level of uncertainty of the outcomes. This will help to reduce unnecessary
investments (e.g., building a dike too high) while also reducing the chance of regret (e.g., the dike should
have been higher). Several decision-making approaches can be combined with the decision-making tools

102
to assess options, even in uncertain environments. The main decision-making approaches used in
uncertain environments are:
Risk management, an approach that seeks to identify risks and the extent to which specific adaptation
interventions could reduce these risks. It thus focuses on identifiable risks (“known knowns”) and aims
to quantify the likelihood of the risk occuring and the potential consequences. This approach is useful
when there is a good understanding of potential outcomes of climate change thanks to past experience;
it is less useful in cases where the future is not easily predictable based on historical experience.
Robust decision making, an approach that seeks to identify adaptation measures that are most likely to
be successful in a range of possible future environmental conditions. This approach may involve complex
modeling of future environmental scenarios and finding adaptation measures that successfully reduce
the negative impacts of as many scenarios as possible.
Real options, an approach that seeks to identify small interventions to be made in the short-term that
can keep open options in the longer term. In doing so, it acknowledges the uncertainty of future climatic
conditions. Examples include building strong foundations on a small dike so that is can be raised later if
necessary and purchasing the land required to extend an airport runway if weather conditions later
make it useful to have a longer runway. This approach makes it possible to avoid large investments that
may or may not be required while making a smaller investment to keep open the option for the future.
As guardians of public spending efficiency and arbiters of competing choices, Ministries of Finance
should become adept at understanding the different tools and approaches. They should also know
how to use the outcomes of the related analyses and encourage wider governmental use of these tools
and approaches (including related analysis). These decision-making tools can be used as part of the
budget process both to help guide overall policy focus (e.g., is the most urgent adaptation required in
agriculture or flooding? what is the degree of flexibility that the country wants to maintain?) and in
selecting specific projects (which is the most efficient way to achieve a particular outcome?).
Public Expenditure and Institutional Reviews (PEIRs) can provide an opportunity to assess the quality
of the decision-making process. In particular, these reviews may be used to understand the extent to
which the decision-making tools and approaches discussed above are being used and support usage or
development of these tools. PERs can also show the costs of failing to use these decision-making tools
with examples of ‘locking in’ households, communities, the private and public sectors to situations that
limit their capability to adapt to climate change.
This chapter follows the mainstreaming approach discussed in Chapter 3, placing climate change
decision making in the context of a broader development planning process. Section 3.2 reviews the
principle tools used to inform decision making and how these tools can accommodate climate change.
These approaches are: multi-criteria analysis; cost-effectiveness analysis; and cost-benefit analysis.
Section 3.3 describes how uncertainty regarding the nature, timing, frequency, intensity, and location of
climate change impacts presents a significant challenge for decision makers. Section 3.4 examines the
tools that have been developed to inform decision making in the face of this uncertainty. Section 3.5

103
concludes with a review of a stylized decision-making process that addresses climate change and
uncertainty.
3.2. TOOLS USED FOR DECISION MAKING
Public expenditure reviews addressing climate change will need to take decision-making tools and
processes into account on two dimensions. First, PERs should determine whether the decision-making
processes within government adequately address the challenge of climate change and explore how
capability to adapt to climate change can be strengthened. Second, PERs may have to appraise or
evaluate specific policies, programs, or projects. This section highlights some of the issues to consider in
this analysis and identifies some of the tools that practitioners may wish to apply.
The key takeaway message is the need to build in flexibility in government policy, programs, and
projects. Flexibility is the hallmark of resilience. The government should enable social and economic
flexibility, creating and maintaining as many options as possible to allow all sections of society to adjust
to changing climatic conditions and structural changes in the economy. At a macroeconomic level, this
flexibility can be achieved through well-functioning markets. From the perspective of public
expenditures, flexibility requires the adoption of no-regrets interventions that are likely to be successful
in a range of climate scenarios and interventions that can be adjusted as climate change impacts
materialize.
Three analytical approaches are commonly used to support decision-making in relation to climate
change policies, programs and projects. These approaches are: multi-criteria analysis; cost-
effectiveness analysis; and cost-benefit analysis. The sourcebook is written with a strong preference for
cost-benefit analysis, while at the same time recognizing that this analytical tool is analytically
demanding, requires considerable information, and demands judgments that will influence (and, indeed,
may determine) the results. Much of the literature on climate change and guidance for practitioners, in
contrast, advocates for the use of some form of multi-criteria analysis. These approaches are not
mutually exclusive, and some central finance and planning agencies use a combination of these tools in
the formal appraisal process.179 The selection of the appropriate tool to use in any given context will
depend on judgments regarding the integrity of the methods, the quality of information available, and
the time and resources available to conduct analysis.
Measuring performance that can be ascribed to a specific policy is difficult and measuring outcomes of
climate adaptation interventions carries particular challenges. Measuring the performance of climate
adaptation interventions is a relatively recent art. Initial efforts (going back to 2004) took a post-facto
approach and focused on whether communities were able to continue to live with little or no impact
following a climactic shock (e.g., a flood).180 This had the advantage of being measurable but did not
179
UK HM Treasury (2011). The Green Book: Appraisal and Evaluation in Central Government. It discusses all of the techniques described in Section 5. 180
Gordon, E. and L. Dilling (2010). An Empirical Approach to Defining Success in Adaptation. Paper presented at Initiative on Climate Adaptation Research and Understanding Through the Social Sciences (ICARUS) Workshop on Climate Vulnerability and Adaptation: Theory and Cases, Champaign, IL.
104
measure the impact of one particular intervention. Later efforts focused more on the impact of a
particular intervention (e.g., a project or program) and relied on modeling a baseline scenario without
an intervention and comparing this with the outcome. At the same time, the assumptions used in the
modeling needed to be monitored over time to assess whether they were realized, and the indicators
adjusted accordingly.
Uncertainty adds a layer of complication. While it may be possible (if difficult) to model scenarios with
and without adaptation interventions, the significant degree of uncertainty means that climate change
may have consequences that are not foreseeable. Climate models discussed below show very different
impacts of climate change; the consequences for a small region are thus potentially highly variable. The
conclusion is not merely that it is difficult to attach a value or probability distribution to outcomes but
also that there are possibilities that we do not yet have sufficient understanding to foresee. This
uncertainty means that a degree of flexibility will also be required when monitoring results.
A further complication is that it may not be obvious what constitutes a climate adaptation
intervention. While some projects or programs may be clearly designed to counter the impacts of
climate change (e.g., sea walls), others may have multiple aims, only one of which is to help societies
adapt to climate change. Building social resilience is thus beneficial for climate adaptation. For example,
social protection or conditional cash transfers may moderate the impact of climate shocks. In some
cases, therefore, efforts to adapt to the impacts of climate change are, as Nicholas Stern noted, just
development in a harsher environment. 181
The availability of financial, institutional, and human resources may limit governments’ capacity to
monitor and measure performance of climate interventions—but options are available. Uncertainty, a
long-term time horizon, and modeling difficulties all pose challenges in measuring the performance of
interventions. The local nature of many interventions may also strain the capacities of local authorities.
Nonetheless, there are tools and approaches from which the performance indicators can be drawn.
Other guidance based on past experience and best practice is also available; the World Resources
Institute and GIZ, for example, provide a useful guide for monitoring and evaluating the impacts of
adaption interventions.182
Multi-Criteria Analysis
Multi-criteria analysis (MCA) facilitates the analysis of complex socioeconomic and environmental
impacts that are hard to measure in monetary terms. Typically, multi-criteria analysis (MCA) is
undertaken by multiple stakeholders through a participatory process. The process usually requires
stakeholders to define a set of objectives and the criteria that they will use to assess the extent to which
various interventions will achieve these objectives. Simply listing objectives and assessment criteria may
be a helpful process in itself because it makes explicit the various stakeholders’ distinct perspectives and
181
Stern, Nicholas (2009). A Blueprint for a Safer Planet: How to Manage Climate Change and Create a New Era of Progress and Prosperity. The Bodley Head, London, UK.
182 Deutsche Gesellshaft für Internationale Zusammenarbeit (GIZ) and World Resources Institute (2011). Making Adaptation
Count: Concepts and Options for Monitoring and Evaluation of Climate Change Adaptation.
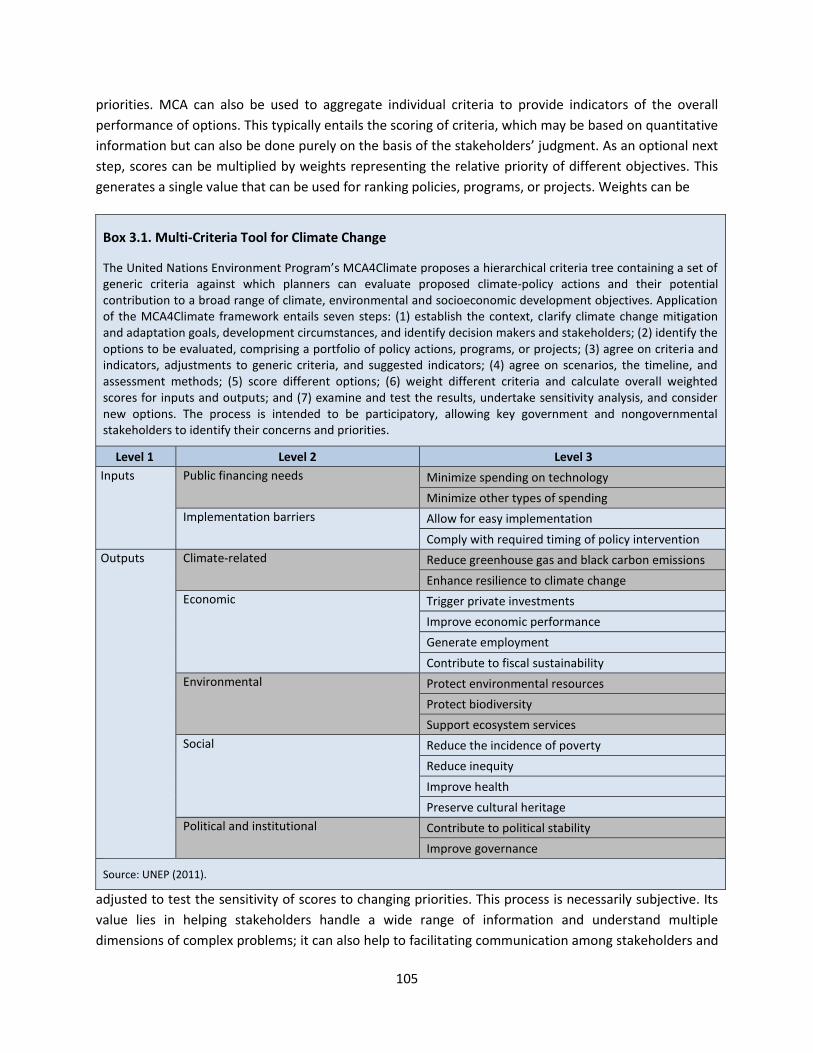
105
priorities. MCA can also be used to aggregate individual criteria to provide indicators of the overall
performance of options. This typically entails the scoring of criteria, which may be based on quantitative
information but can also be done purely on the basis of the stakeholders’ judgment. As an optional next
step, scores can be multiplied by weights representing the relative priority of different objectives. This
generates a single value that can be used for ranking policies, programs, or projects. Weights can be
Box 3.1. Multi-Criteria Tool for Climate Change
The United Nations Environment Program’s MCA4Climate proposes a hierarchical criteria tree containing a set of generic criteria against which planners can evaluate proposed climate-policy actions and their potential contribution to a broad range of climate, environmental and socioeconomic development objectives. Application of the MCA4Climate framework entails seven steps: (1) establish the context, clarify climate change mitigation and adaptation goals, development circumstances, and identify decision makers and stakeholders; (2) identify the options to be evaluated, comprising a portfolio of policy actions, programs, or projects; (3) agree on criteria and indicators, adjustments to generic criteria, and suggested indicators; (4) agree on scenarios, the timeline, and assessment methods; (5) score different options; (6) weight different criteria and calculate overall weighted scores for inputs and outputs; and (7) examine and test the results, undertake sensitivity analysis, and consider new options. The process is intended to be participatory, allowing key government and nongovernmental stakeholders to identify their concerns and priorities.
Level 1 Level 2 Level 3
Inputs Public financing needs Minimize spending on technology
Minimize other types of spending
Implementation barriers
Allow for easy implementation
Comply with required timing of policy intervention
Outputs Climate-related Reduce greenhouse gas and black carbon emissions
Enhance resilience to climate change
Economic Trigger private investments
Improve economic performance
Generate employment
Contribute to fiscal sustainability
Environmental Protect environmental resources
Protect biodiversity
Support ecosystem services
Social Reduce the incidence of poverty
Reduce inequity
Improve health
Preserve cultural heritage
Political and institutional Contribute to political stability
Improve governance
Source: UNEP (2011).
adjusted to test the sensitivity of scores to changing priorities. This process is necessarily subjective. Its
value lies in helping stakeholders handle a wide range of information and understand multiple
dimensions of complex problems; it can also help to facilitating communication among stakeholders and

106
bring to light common ground, differences, and possible tradeoffs among their perspectives and
interests.183 United Nations Environment Program (UNEP) argues that MCA is ideally suited for the
analysis of the complex social, economic, ecological, institutional, cultural, and ethical dimensions of
climate change and the multiple perspectives of distinct stakeholders. Box 3.1 outlines UNEP’s
MCA4Climate, which is intended as a formal framework for the appraisal and evaluation of climate
change mitigation and adaptation policies.184
Critics of MCA stress the subjectivity of criteria, scoring, and weights and the flawed aggregation
method. The selection of appropriate criteria will be subjective, even if informed by expert opinion,
depending on judgments regarding the appropriate dimensions of adaptation and other policy
objectives to consider.185 For example, an ecologist will produce a list of decision-making criteria quite
different to that compiled by an economist, a farmer, or a local government official. Each list is
subjective, determined by the particular worldview of the analyst, and so cannot be faulted in and of
itself. Advocates argue that this is one of the strengths of the approach, since it helps to frame a more
complete view of climate change impacts; the extent to which this is true, however, depends on the
range of stakeholders involved in the process. Where MCA lacks credibility is in the arbitrary and a
theoretical nature of selecting attributes, and assigning scores and weights, which ultimately generates
a unitless result. Notwithstanding these critiques, central finance and planning authorities recognize
that MCA can serve a useful role when used together with other, more analytically rigorous
techniques.186 The danger lies where MCA is seen as an alternative to, and crowds out, more rigorous
techniques. 187
Cost-Effectiveness Analysis
Cost-effectiveness analysis (CEA) can be used to rank a range of policies, programs, and projects in
terms of the cost of achieving a particular objective. Cost effectiveness is easily understood and serves
as a useful starting point for analysis. An important limitation, however, is that cost-effectiveness
analysis typically compares policies, programs, and projects in relation to a single criterion.
Consequently, measures of cost-effectiveness can be a useful tool for assessing mitigation actions,
where there is a single clearly defined primary objective (e.g., to reduce GHG emissions) and a single
performance measure (e.g., reductions in GHG emissions in tCO2e). Cost effectiveness is less helpful
when it comes to assessing adaptation actions where there may be multiple objectives and multiple
performance measures.
183
DCLG (2009). Multi-Criteria Analysis: A Manual. 184
UNEP (2011). A Practical Framework for Planning Pro-Development Climate Policy. 185
Bahadur, A., Ibrahim, M. and Tanner, T. (2010). The Resilience Renaissance? Unpacking of Resilience for Tackling Climate Change and Disasters. Discussion Paper no. 1. 186
UK HM Treasury (2003). The Green Book: Appraisal and Evaluation in Central Government. 187
Dobes, L. and Bennett, J. (2009). “Multi-criteria Analysis: 'Good Enough' for Government Work?” in Agenda: A Journal of Policy Analysis and Reform. 16(3), pp. 7-29.

107
The cost-effectiveness of alternative mitigation measures is usually presented in a marginal
abatement cost curve. The marginal abatement cost (MAC) presents the ratio of the net present value
of implementing a series of abatement measures over a given period-—such as the improvements in
energy efficiency, use of a renewable energy technology or changes in agricultural practices—to the
GHG abatement achieved by each measure during that period (Box 3.2). The marginal abatement costs
are presented in a curve which ranks options from those that have negative unit costs of abatement in
terms of tCO2e (signifying that the mitigation policy measure is cheaper than the current business-as-
usual scenario) to those options that have the highest unit costs of abatement. MAC curves can be used
to rank options at various scales: for national policy, for an industry, for a community, for or a project.188
MAC curves require careful interpretation since the choice of data and assumptions underlying the
analysis will have a significant impact on marginal abatement costs. Analysis starts from the
construction of an emissions baseline for the target year using business-as-usual policies and
technologies. Alternative mitigation policies and technologies are then identified, their abatement
potential determined, and an average cost calculated taking into account estimations of marginal costs
as technologies and investments are scaled up and assumptions regarding the appropriate level of
deployment. Data quality has to be considered at each of these points. The choice of a discount rate will
188
Casillas, C. and Kammen, D. (2010). “The Energy-Poverty-Climate Nexus” in Science. Volume 330, pp. 1181-1182.
Box 3.2. Marginal Abatement Cost Curve
Note: Each column is one of 123 abatement measures assessed (only the most significant ones are named). The height of the columns is the cost in € per abated tCO2e. The width of the column is the cumulative abatement potential through to 2030.
Source: World Bank (2011). Transition to a Low-Emissions Economy in Poland.

108
be critical. Use of the societal discount rate is likely to significantly underestimate the returns required
by investors, particularly in developing countries and in the use of high-risk technologies.
Furthermore, MAC curves do not take into account implementation constraints and scheduling
considerations that will impact on the relative merits of mitigation policy options. In principle, the cost
minimizing strategy would be to start with the lowest cost options and work through options
sequentially until the emissions reduction target is achieved. In practice, the MAC curve fails to capture
transactions costs and cultural and other factors that may constitute barriers to the adoption of a
particular policy measure. Indeed, this may explain why MAC curves identify policy options with
negative costs that have not yet been adopted under business-as-usual scenarios. In addition, it is
important to take into account path dependencies, the fact that not all options are open at any one
point in time because investments may already have been made in particular infrastructure and
technologies and are unlikely to be replaced until they have reached the end of their economic
lifetime.189 Moreover, cost may not be the most appropriate criteria for prioritizing investments where
some of the options that offer the greatest abatement potential will take considerable time to
implement. For example, early action is needed in urban planning and infrastructure development given
that investments in these areas may take many years to put in place. Consequently, it may sometimes
be necessary to start with the more expensive options first.190
Finally, some consideration may need to be given to co-benefits and the contribution of interventions
to multiple policy objectives. Policy makers are unlikely to select between options on the basis of only
one criterion. Where mitigation is concerned, they may also wish to understand the cost-effectiveness
of interventions in contributing to employment, growth, and social outcomes. The consideration of
multiple policy objectives is particularly important when assessing the performance of adaptation
interventions given that adaptation capability has multiple dimensions. The cost effectiveness of sea
dikes, for example, might be assessed in terms of lives, property, or agricultural output saved, giving
very different rankings depending on the measure used. Multiple cost-effectiveness measures can be
used to construct efficiency frontiers using data envelopment analysis. This highlights the tradeoffs
between interventions in relation to each of the outcomes; the relative weighting of the resulting
distributions of outcomes, however, remains a matter of judgment.191 Data envelopment analysis can
only provide an assessment of technical efficiency; it cannot answer the key question for decision
makers: Which intervention will maximize net benefits for society as a whole?
Cost-Benefit Analysis
Cost-benefit analysis (CBA) assesses the value for society as a whole derived from a particular policy,
program or project. Cost-benefit analysis affords policy makers an unambiguous decision criterion by
requiring that the present value of benefits to society as a whole exceed the present value of the social
189
Ekins, P., Kesicki, F. and Smith, A. (2011). Marginal Abatement Cost Curves: A Call for Caution. A report from UCL Energy Institute commissioned by Greenpeace. 190
Vogt-Shilb, A. and Hallegate, S. (2011). When Starting with the Most Expensive Option Makes Sense: Use and Misuse of Marginal Abatement Cost Curves. World Bank Policy Research Working Paper 5803. 191
Afonso, A., Schuknecht, L. and Tanzi, V. (2005). “Public Sector Efficiency: An International Comparison” in Public Choice. January, 123(3-4), pp. 321-347.

109
costs incurred. The economic rate of return of interventions can be compared against a threshold value
and ranked to guide the selection of the programs and projects that are expected to generate the
greatest overall benefit. Of all the analytical tools available, cost-benefit analysis alone permits the
comparison among a range of policy interventions seeking to achieve different policy objectives. CBA
has a long pedigree so that the methodology has been honed and refined over many years.192 It is widely
used in the economic analysis for World Bank projects.193 However, there are a number of challenges in
applying the technique to climate change mitigation and adaptation, and CBA frameworks that fully
integrate climate considerations and shadow pricing still need to evolve to the point when they can be
institutionalized.
Valuation of costs and benefits can pose a challenge in the absence of readily available market prices
or where market prices do not adequately capture value. This includes valuations of environmental
costs and benefits and intangibles such as the people’s well-being. The benefits of building a sea wall,
for example, are likely to be higher than the damage costs alone because of the suffering and
inconvenience involved. In this case, cost-benefit analysis requires the construction of “shadow” prices
that better reflect utility. One solution is to survey the affected population to find out their expressed
preferences. The affected population may be asked how much they would be willing to pay for the “use
value” of the sea wall. Alternatively, they may be asked how much they would be willing to accept in
compensation for being flooded. Obviously, surveys have limitations; in particular, respondents are
likely to overstate valuations when they know that they will not be asked to pay. One way of overcoming
these response biases is to use choice modeling to compare respondents’ relative preferences to a
range of scenarios in which the attributes change. Choice modeling allows valuation of all attributes as
long as one attribute has a market value.194 An alternative approach, which does not require survey
data, is to use hedonic pricing. This entails an assessment of the characteristics that affect the value of
marketed goods or assets. For example, the value assigned to flood protection could be estimated by
comparing the sales price of houses in areas that have flood protection with those that do not,
controlling for a range of other characteristics that affect value.195 All of these methods are data and
analytically intensive. Some governments avoid duplication of effort and facilitate the development of
databases with applicable plug-in values. While most plug-in values are likely to be country specific,
there may be scope for developing regional values.196
Governments will have to determine whether or not to incorporate the social cost of GHG emissions
into their analysis and, if so, how to determine the appropriate price. Internalizing the social costs of
GHG emissions will lead to the selection of policies, programs, and projects that generate lower levels of
emissions than would be the case if the social costs of GHG were not taken into account. If carbon
192
Various texts. Boardman et al (2010) provide a detailed explanation of the concepts and practice involved. 193
Belli, P. et al. (2001). Economic Analysis of Investment Projects: Analytical Tools and Practical Applications. World Bank Institute (WBI). 194
Bennett, J., van Buren, M. and Whitten, S. (2004). “Estimating Society's Willingness to Pay to Maintain Viable” in The Australian Journal of Agricultural and Resource Economics, 48: pp487-512. 195
Mahan, B. (1997). Valuing Urban Wetlands: A Property Pricing Approach. US Army Corps of Engineers. 196
For example, the Canadian government maintains EVRI, an international database of environmental value estimates; the New South Wales gvernment maintains Envalue, a similar database.
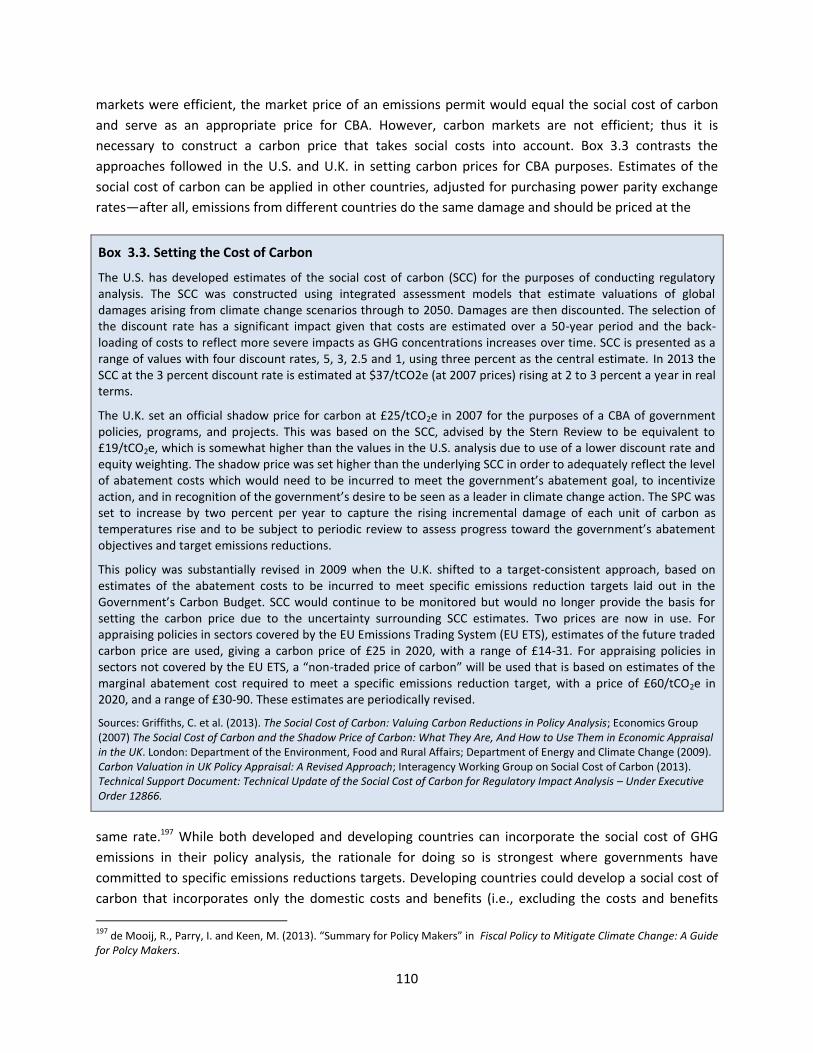
110
markets were efficient, the market price of an emissions permit would equal the social cost of carbon
and serve as an appropriate price for CBA. However, carbon markets are not efficient; thus it is
necessary to construct a carbon price that takes social costs into account. Box 3.3 contrasts the
approaches followed in the U.S. and U.K. in setting carbon prices for CBA purposes. Estimates of the
social cost of carbon can be applied in other countries, adjusted for purchasing power parity exchange
rates—after all, emissions from different countries do the same damage and should be priced at the
Box 3.3. Setting the Cost of Carbon
The U.S. has developed estimates of the social cost of carbon (SCC) for the purposes of conducting regulatory analysis. The SCC was constructed using integrated assessment models that estimate valuations of global damages arising from climate change scenarios through to 2050. Damages are then discounted. The selection of the discount rate has a significant impact given that costs are estimated over a 50-year period and the back-loading of costs to reflect more severe impacts as GHG concentrations increases over time. SCC is presented as a range of values with four discount rates, 5, 3, 2.5 and 1, using three percent as the central estimate. In 2013 the SCC at the 3 percent discount rate is estimated at $37/tCO2e (at 2007 prices) rising at 2 to 3 percent a year in real terms.
The U.K. set an official shadow price for carbon at £25/tCO2e in 2007 for the purposes of a CBA of government policies, programs, and projects. This was based on the SCC, advised by the Stern Review to be equivalent to £19/tCO2e, which is somewhat higher than the values in the U.S. analysis due to use of a lower discount rate and equity weighting. The shadow price was set higher than the underlying SCC in order to adequately reflect the level of abatement costs which would need to be incurred to meet the government’s abatement goal, to incentivize action, and in recognition of the government’s desire to be seen as a leader in climate change action. The SPC was set to increase by two percent per year to capture the rising incremental damage of each unit of carbon as temperatures rise and to be subject to periodic review to assess progress toward the government’s abatement objectives and target emissions reductions.
This policy was substantially revised in 2009 when the U.K. shifted to a target-consistent approach, based on estimates of the abatement costs to be incurred to meet specific emissions reduction targets laid out in the Government’s Carbon Budget. SCC would continue to be monitored but would no longer provide the basis for setting the carbon price due to the uncertainty surrounding SCC estimates. Two prices are now in use. For appraising policies in sectors covered by the EU Emissions Trading System (EU ETS), estimates of the future traded carbon price are used, giving a carbon price of £25 in 2020, with a range of £14-31. For appraising policies in sectors not covered by the EU ETS, a “non-traded price of carbon” will be used that is based on estimates of the marginal abatement cost required to meet a specific emissions reduction target, with a price of £60/tCO2e in 2020, and a range of £30-90. These estimates are periodically revised.
Sources: Griffiths, C. et al. (2013). The Social Cost of Carbon: Valuing Carbon Reductions in Policy Analysis; Economics Group (2007) The Social Cost of Carbon and the Shadow Price of Carbon: What They Are, And How to Use Them in Economic Appraisal in the UK. London: Department of the Environment, Food and Rural Affairs; Department of Energy and Climate Change (2009). Carbon Valuation in UK Policy Appraisal: A Revised Approach; Interagency Working Group on Social Cost of Carbon (2013). Technical Support Document: Technical Update of the Social Cost of Carbon for Regulatory Impact Analysis – Under Executive Order 12866.
same rate.197 While both developed and developing countries can incorporate the social cost of GHG
emissions in their policy analysis, the rationale for doing so is strongest where governments have
committed to specific emissions reductions targets. Developing countries could develop a social cost of
carbon that incorporates only the domestic costs and benefits (i.e., excluding the costs and benefits
197
de Mooij, R., Parry, I. and Keen, M. (2013). “Summary for Policy Makers” in Fiscal Policy to Mitigate Climate Change: A Guide for Polcy Makers.

111
incurred beyond their borders); the logic for such an approach would be to avoid incurring emissions to
the extent that they would damage the nation’s future welfare. There are ongoing debates regarding
the application of social cost of carbon in development assistance projects and whether such analysis
should consider global as well as domestic costs and benefits.
The choice of discount rate is a particularly contentious issue in the context of climate change. The
discount rate chosen is critical in determining the viability of climate change mitigation and adaptation
projects given that costs are incurred in the short-term and benefits may only arise in the distant future.
High discount rates will discourage investments. There is little agreement among economists, however,
as to the theoretically “correct” method of setting discount rates, particularly for programs and projects
that will generate costs and benefits over several generations. Most analysts use the social rate of time
preference (SRTP) for discounting intergenerational projects. This is significantly lower than the social
opportunity cost of capital (SOCC). Some have proposed that the SRTP discount rate should decline over
time, further raising the weight attached to the welfare of future generations. In practice, discount rates
are set by the central finance agency as a plug-in value for use in policy, program, or project appraisal.
Discount rates in developing countries tend to be higher than those in industrialized countries. Most
developed countries follow the SRTP approach and apply much lower discount rates, mostly in the range
of 3-7 percent, with many revising their rates downward in recent years. Developing countries tend to
follow the SOCC approach and apply a much higher rate (reflecting the higher opportunity cost of
capital), in the range of 8-15 percent. The multilateral development banks (MDBs) follow similar
practices with very high discount rates.198 When conducting a CBA, the discount rate itself may be a
moot point as the uncertainties associated with the science of climate change and the estimation of
costs and benefits will often overtake any differences due to different discount rates. In any case, simple
sensitivity analysis can reveal the extent of the importance of a discount rate in any particular study.
Additional analytical work will be needed to capture the distributional consequences of interventions.
CBA assesses costs and benefits to society as a whole, ignoring the distribution of costs and benefits
among different social groups since those bearing the costs can hypothetically be compensated by those
who benefit. In practice, it will rarely be the case that the beneficiaries of a government project will
actually compensate the losers. A separate distributional analysis which identifies the winners and losers
and the extent of their gains and losses can provide useful information to decision makers. CBA also
assumes that people value additional costs and benefits equally. This assumption (i.e., the marginal
utility of money is equal regardless of whether someone gains or losses) is particularly unrealistic in
societies where there are significant income disparities. Distributional weights can be used to adjust the
results of the analysis for different valuations of costs and benefits across social groups, but, as with
multi-criteria analysis, resorting to weights can produce arbitrary and subjective results. Given the many
potential perspectives on the issue of equity, it is unlikely that any particular evaluation tool can provide
a satisfactory resolution to the problem. It is typically recommended in CBA that an unweighted analysis
be carried out in addition to any weighting exercise.
198
Zhuang, J., Liang, J., Lin, T. and De Guzman, F. (2007). Theory and Practice in the Choice of Social Discount Rate for Cost-Benefit Analysis: A Survery. Asian Development Bank Economics Research Development Working Paper Seiries No. 94.

112
While cost-benefit analysis can be a challenge for countries with limited analytical resources and with
data constraints, some simplified and standardized approaches are available. The World Bank provides
a toolkit for community-based cost-benefit analysis of adaptation projects in the energy sector; this
approach has been successfully piloted in Albania and Uzbekistan.199 Even back of the envelope
qualitative analyses can provide a useful indication of whether an adaptation measure is likely to
improve the well-being of society as a whole. Regarding data constraints, various data techniques can be
used to verify and extrapolate data and to use proxies. Surveys can be employed to collect data and
statistical agencies’ capacity development can support analysis in the long run.
3.3. UNCERTAINTY IN CLIMATE CHANGE
Climate change is bedeviled by a cascade of uncertainties that preclude prediction of the precise
nature, timing, frequency, intensity, and location of climate change impacts. The chain of increasing
uncertainty can be considered to begin with assumptions about the socioeconomic characteristics of the
global population; these assumptions determine the specification of a range of possible emissions
scenarios. Estimates of climatic effects depend not only on the scenarios chosen but also on the
configuration of the climate models used and existing knowledge of biophysical responses. Typically, the
longer the time frame, the greater the uncertainty. Uncertainty is also compounded by geographical
resolution (i.e., downscaling) with uncertainty increasing progressively as global models are used to
identify regional, country, and local impacts (see Figure 3.4). 200 Even climate experts rarely agree on
their predictions of specific impacts of climate change.201 Some go even further, rejecting the
specification of probabilities for climate change impacts because of the lack of repeated experiments,
the lack of independent observations, and the fact that all probabilities are conditional on a multitude of
socioeconomic and other developments.
Uncertainty is thus the hallmark of climate change impacts and should be accounted for at the very
basis of climate change adaptation policy. Continued efforts by climate scientists and others to resolve
modelling uncertainties and to increase knowledge about the climate and future climate scenarios are
valuable. However, there are diminishing returns in tying adaptation policies too closely to the hope of
improving predictions significantly, especially because the underlying assumptions and parametric
conditions will continue to change over time. It is more helpful to accept the fact that uncertainty about
the future climate will likely remain and to formulate adaptation policy on this basis. Ultimately,
adaptation to climate change is a socioeconomic issue, not a scientific one.
Economists have traditionally distinguished between Knightian risk and Knightian uncertainty. In his
1921 textbook on decision making by competing firms, Frank Knight defined risk to involve knowledge of
an event and its probability of occurrence, and uncertainty as a unique event whose probability
199
World Bank (2012). Hands-on Energy Adaptation Toolkit (HEAT). 200
See, for example, Roe, G.H., and M.B. Baker (2007). “Why is Climate Sensitivity So Unpredictable?” in Science. 318, pp. 629-632; Gay, C. and F. Estrada (2010).”Objective Probabilities About Future Climate Are A Matter Of Opinion” in Climate Change. Ii, pp. 27-46. 201
Arnell, N.W., E.L Tompkins and W.N. Adger (2005). “Eliciting Information From Experts On The Likelihood Of Rapid Climate Change” in Risk Analysis. Volume 25 No.6, pp. 1419-1431.

113
distribution could not be quantified. This distinction is routinely made by economists and other
professionals.202
Figure 3.1. Uncertainty in Climate Change Modelling
Percentage change in annual mean precipitation in 2050 compared with the 1971-2000 average in selected climate models.
Top left: Essence (MPI/ECHAM5); top center: 3 4AR (MPI/ECHAM5); top right: GFDL CM2.0; bottom left: GFDL CM2.1; bottom center: CCCMA CGCM3.1; and bottom right: CCMA HadGEM1.
Source: Royal Netherlands Meteorological Institute.
In Knightian terms, the impact of climate change lies squarely at the uncertainty end of this
dichotomy. Assessment of future climate risks requires forecasting of elements in a causal chain from
emissions to climate change, environmental and social impacts of climate change and the responses of
202
Randall, A. (2011) Risk and Precaution. Cambridge University Press, UK., and Standards Australia/Standards New Zealand (2009). AS/NZS ISO 31000:2009. Risk Management – Principles and Guidelines.

114
actors to these impacts. The sources and nature of uncertainty differ at each step and their interactions
will differ as a result of initial conditions. Consequently, each step in the chain magnifies the uncertainty;
the uncertainty is further magnified the longer the time frame under review. Ultimately, the probability
distribution of climate change risks often defies quantification
Knight’s dichotomy of risk and uncertainty is, however, an inadequate characterization of the
potential uncertainties of future climate change. Climate change can be thought of as a pervasive
economic shock that will potentially affect all sectors of the economy. It is not just the probability of
occurrence that is unknown; the set of events itself cannot be predicted because it has never been
experienced and is therefore totally unknown (and possibly inconceivable). Apart from the inherent
unpredictability of the future, human psychological mechanisms and social factors are likely to affect
perceptions of threats and impacts associated with climate change.203 Even if each specific impact were
known and predictable, the interactions between them may not be, an aspect emphasized by the Royal
Academy of Engineering (2011). Notwithstanding the mirth of the media, U.S. Defense Secretary Donald
Rumsfeld in 2002 drew attention to the “unknown unknowns” aspect of uncertainty. An established
term in defense circles, this category is sometimes referred to as ignorance or deep uncertainty.204 By
definition, events falling within this category become apparent only after the fact, once they have
occurred and their nature has been revealed to the world at large.
Figure 3.2. Known and Unknown Aspects of Climate Change: A Synoptic Perspective
Known Consequence or Probability
Unknown Consequence or Probability
Known Event
(I) Known Knowns
E.g., increased local temperatures for longer periods will affect crop cycles
(II) Known Unknowns
E.g., rising ocean temperatures may increase the intensity of cyclones, but the frequency of occurrence is not known
Unknown Event
(III) Unknown Knowns
E.g., a farmer knows of a rare pest that will thrive in a warmer climate but has not told the responsible authorities about it
(IV) Unknown Unknowns
E.g., ex-post only: drought resulted in corroded sewer pipes in Melbourne due to reduced water flow
Potential uncertainties of climate change are better captured in a framework that integrates the
Knightian dichotomy of risk and uncertainty with the Rumsfeldian categorization of known and
unknown. Figure 3.2 presents this framework schematically. Quadrant I (known knowns) corresponds
most closely to Knight’s concept of risk because both the nature of the event and its probability are
known. Higher temperatures, for example, will extend crop cycles in higher latitudes, allowing farmers
203
Swim, Janet, Paul C. Stern, Thomas J. Doherty, Susan Clayton, Joseph P. Reser, Elke U. Weber, Robert Gifford and George S. Howard (2011). “Psychology’s Contributions to Understanding and Addressing Global Climate Change.” American Psychologist. Volume 66 No. 4, pp. 241-250. 204
See, for example, Kerwin, A. (1993). “None Too Solid. Medical Ignorance” in Knowledge: Creation, Diffusion, Utilization. Volume 15 No. 2, pp. 166-185., and Aven, T. (2011). “On Different Types of Uncertainties in the Context of the Precautionary Principle” in Risk Analysis. Volume 31 Issue 10, pp. 1515-1525.

115
to plant crops earlier. The concept of Knightian uncertainty is reflected by quadrant II (known
unknowns), because the event and its circumstances are known or apparent but their probability of
occurrence is not known (or at least imperfectly known). Higher sea temperatures may be conducive to
the formation of cyclones, for example, but there may be little or no knowledge about the likelihood of
any increase in the actual frequency of their occurrence.205 A climate-related example of an unknown
known (quadrant III) might be indigenous knowledge of a rare pest that may thrive in a warmer climate
while the rest of society remains ignorant of the threat. On a collective level this category might be
thought of loosely as a form of social cognitive dissonance whose reduction can be achieved by
governments collecting and disseminating information about climate change and adaptation strategies.
Unknown unknowns (quadrant IV) can by definition only be known once they occur and are revealed to
those affected. They cannot be predicted and may not even be consciously conceived as possible events.
A climate-relevant example of an unknown unknown is the unanticipated corrosion of some Melbourne
sewer pipes (Box 3.4).
Box 3.4. Melbourne’s Sewers: An Unknown Unknown?
Melbourne’s sewers were designed with specific gradients to operate at a certain flow rate. Although the design engineers may have been aware of some risk at the time, there does not seem to have been any possibility that the water-saving campaigns that resulted from a prolonged drought could have the unintended consequence of reducing flow rates below the minimal self-cleaning transmission velocities.
The unforeseen outcome of greater deposits of biological matter has been an “increased risk of sewer corrosion (from hydrogen sulfide gas build-up) and odors due to more concentrated and warmer sewage” (Melbourne Water 2011). Although the possibility of greater deposits may well have been appreciated by design engineers who assumed a certain flow rate, it is less likely that they would also have considered the further possibility of corrosion due to the production of hydrogen sulfide gas due to more concentrated and warmer sewage. The outcome of corrosion could therefore be classified as an unknown unknown.
Source: Dobes, Leo (2012). Adaptation to Climate Change: Formulating Policy under Uncertainty. CCEP Working Paper 1201.
Public sector decision making is poorly equipped to deal with uncertainty. Public sector decision-
making processes aim to promote long-term, prospective planning, particularly around public
investments. Where analytical tools are used, analysts have to draw on historical data and data
describing current conditions to predict the future stream of costs and benefits. The assumption is that
the past and present are reasonable guides to future conditions. Public investment management good
practice calls for the full costing of projects to be up-front, and project management focuses on
implementation through to project completion. For infrastructure projects, this means project
completion will generally coincide with the end of construction, at which point the project is handed
over to the unit responsible for operation. Adjustments to program and project design have cost
implications and are thus generally minimized. Institutional incentives encourage managers to deliver
policies, programs, and projects as originally planned, on time and on budget.
205
IPCC (2012). Managing the Risks of Extreme Events and Disasters to Advance Climate Change Adapatation. Speical Report. p. 160.

116
Failure to take into account uncertainty regarding future climate conditions can have serious
consequences. At the very least, it can result in inefficient and ineffective public interventions. At worst,
it can hinder effective adaptation and lead to maladaptation (i.e. social and economic outcomes that are
worse than if the intervention had never taken place). Inefficiency may arise from under-adaptation,
where the intervention fails to take into account future climate conditions or does not adequately
address the conditions exposing the population to adverse impacts. On the other hand, inefficiency may
also arise from over-adaptation, where the intervention leads to unnecessary actions. Construction of a
dike offers a simple example, since the construction could prove to be either too low (under-adaptation)
or too high (over-adaptation). It is also possible for interventions to lead to incorrect adaptation, where
the intervention is subsequently found to have no or a counter-adaptive impact. This may occur where
interventions cause irreversible harm to people or ecosystems as a result of unforeseen circumstances,
or where interventions encourage actors to make decisions that reduce their ability to adapt. For
example, building dikes may encourage settlement and investment in the protected area, potentially
locking them into a high-risk situation if it turns out that sea level increases make it impossible to
continue to offer protection despite future increases in the height of the dike.
Uncertainty should not be grounds for ignoring the implications of climate change and inaction.
Decision makers cannot simply wait for better information. Decisions are constantly being taken that
could increase vulnerability to climate change or restrict opportunities to reduce future impacts or
maximize future benefits. These risks are particularly acute for interventions that are long-lived, such as
investments in infrastructure, or that lock in actors over the long-term. Therefore, while ignoring climate
change is a policy choice, it is not a wise one. The challenge for decision makers is to accommodate
uncertainty in the decision-making process.
3.4. UNCERTAINTY AND DECISION MAKING TOOLS
The analytical tools that have been developed to support decision making in the context of
uncertainty are likely to be most useful in the appraisal of large infrastructure projects and long-term
sector planning, particularly in climate sensitive sectors such as water management, land use
management, and agriculture. The techniques are, for the most part, analytically demanding and data
intensive. Only rarely will they be applied in the context of a public expenditure review. However, they
could be useful where there is a need to appraise an investment program for infrastructure
development for water, agriculture, or urban development as these investments have substantial sunk
costs and potentially lock-in adaptation options. The key analytical tools are reviewed briefly in this
section to ensure that practitioners are aware of the techniques, their limitations, and potential
applications at the country level.
The risk management approach seeks to identify risks and the extent to which specific adaptation
interventions succeed in reducing these risks. This is often the approach of choice in framing policy on
adaptation to climate change.206 It involves the identification of risks–focusing on known knowns– facing
206
Jones, R. N. and Preston B. L. (2011). “Adaptation and Risk Management” in Wiley Interdisciplinary Reviews: Climate Change. 2(2), p. 296.
117
an individual, organization, or community, the quantification of the likelihood of the risk, the
specification of the potential consequences, and the implementation of action to reduce the risk. The
approach draws on the experience of disaster risk management (Chapter 4), where the risk profiles are
typically defined in probabilistic terms and the policy choice is defined in terms of the level of acceptable
risk. There is a danger that the risk management approach leads to “bell-curve thinking” because it
focuses on the known knowns and most likely outcomes, whereas climate change outcomes are more
realistically represented as skewed, extreme-value, fat-tail distributions that are not captured in the
current data. Furthermore, the risk management approach provides no guidance on the decision-rule to
determine the extent to which any identified risk should be reduced. The risk management approach
has to be used in conjunction with cost-benefit analysis to provide guidance as to the socially optimal
reduction in risk.
The robust decision making (RDM) approach seeks to identify the adaptation measures that are likely
to be most successful in a range of scenarios of future conditions (Box 3.5). The approach extends the
analysis to unknown knowns. The usual steps in this process are: (1) to define the problem and desired
response, selecting a set of likely adaptation measures or strategies to address the problem; (2) to
create plausible multiple future states of the world using Monte Carlo simulations 207 or dedicated
computer modeling; (3) to assess the performance of the selected adaptation measures in each of the
states of the world against a range of criteria specified by the analyst. The adaptation measures that
perform best across the range of scenarios are considered robust and, therefore, preferred.208 The
analysis can be further developed by introducing hedging strategies to see if they can improve the
performance of the strategies that have not performed as well. Several iterations of the analysis thereby
result in a progressively more robust selection of adaptation measures.
The advantage of RDM in avoiding reliance on probability estimates is offset by some resulting
disadvantages (i.e., the risk of selectivity bias and the complexity and black box nature of the
modeling). Since the selection of adaptation responses depends on the historical knowledge and
experience of the analyst and the performance criteria are chosen by the analyst, the RDM technique is
a subjective one. Further, the “distinction between plausible and implausible simulation models and sets
of inputs to those models often represents an inference about prior probabilities.”209 In addition, it is
not always clear to what extent the black boxes of computer models include realistic behavioral
parameters that allow for social and economic adaptation over time. Practical applications are still
limited by data, the ability to construct a large range of plausible future scenarios, and the need for
207
A Monte Carlo approach involves simultaneously taking random samples of values from all key variables. Each draw produces a different combination of values for the variables that are sampled, so that the calculated net present value will be different each time. The process is repeated hundreds, sometimes even thousands, of times, yielding a distribution of net present values rather than a single number. In one sense, this approach simulates uncertainty. However, it is necessary to specify the type of probability distribution that is applied to each variable to employ the Monte Carlo approach, implying an unwarranted knowledge or certainty about the future. 208
See, for example, Ranger, Nicola, Antony Millner, Simon Dietz, Sam Frankhauser, Ana Lopez and Giovanni Ruta (2010). Adaptation in the UK: A Decision-Making Process. Grantham Research Institute on Climate Change and the Environment and the Center for Climate Change Economics and Policy. p. 39. 209
Robert J. Lempert et al. (2006). "A General, Analytic Method for Generating Robust Strategies and Narrative Scenarios" in Management Science. 52(4), p. 518.

118
complex analytical models and computing. Although still a largely experimental technique, Box 3.6
illustrates how the process can be used to help decision makers identify solutions in the face of
considerable uncertainty with regards to climate change impacts.
Box 3.5. Robust Decision Making for Water Planning in Southern California
The RAND Corporation piloted the RDM tool in the Southern California region in collaboration with the Inland Empire Utilities Agency (IEUA). The utility was seeking to incorporate the impacts of climate change into its planning but was hampered by the uncertainty in future climate forecasts. The results of 21 atmosphere-ocean general circulation models scaled down to the Southern California region indicated that the climate could range from 0.1-2.1°C warmer and there could be a -19 to +8 percent change in wintertime precipitation. The RAND Corporation study sought to explore ways to encourage decision makers to plan adaptations for climate change without precise ranges of future climatic conditions.
The RAND Corporation worked in collaboration with IEUA to assess the efficacy of the utility’s Urban Water Management Plan (UWMP) in relation to future climate scenarios. The RDM analysis evaluated the UWMP against a set of 200 scenarios with different assumptions regarding the extent of climate change, management plan, and costs. Under this analysis, the cost was 20-percent greater than expected in 120 of the 200 scenarios. The UWMP was particularly vulnerable to future conditions that were drier, with reduced access to imported water and when natural percolation of the ground water basin decreased. Eight additional management strategies beyond the UWMP were analyzed to assess their ability to reduce vulnerabilities under a wide variety of climate scenarios. Strategies varied from increasing water use efficiency, recycling storm water for ground water replenishment, and developing the region’s water recycling program. In all cases, augmenting the UWMP with additional management strategies led to lower costs and reduced vulnerability. When water managers were presented with these results, surveys indicated greater confidence that they could adequately plan for the effects of climate change despite the uncertainty in the forecasts.
Source: Feifel, K. (2010). Using Robust Decision Making as a Tool for Water Resources Planning in Southern California: http://www.cakex.org/case-studies/1029.
The real options approach incorporates uncertainty about future costs and benefits into cost-benefit
analysis by setting up options to be exercised in the future. In finance, an option is a contract that gives
the buyer the right (but not the obligation) to purchase an asset at a future point in time at a specific
price; the contract is acquired through the payment of a fee. The option may be realized against the
payment of the balance of the agreed price, allowing the option holder to make a profit if market prices
for the asset rise above the price of the option. The option holder is not required to exercise the option
and can therefore limit losses if the market price falls below the price of the option to the amount of the
fee paid to acquire the option. Akin to financial options, ‘real options’ help decision-makers minimize
the cost of taking inappropriate action. In the case of building a dike, for example, there is likely to be a
high opportunity cost if community resources are used to build a substantial structure prematurely,
before climate change occurs. Undue procrastination, on the other hand, could result in costs from flood
damage. If only preparatory work is undertaken (e.g., acquisition and preparation of land), this creates
the option (but not the obligation) to build the dike in the future.
The real options approach has three key elements: uncertainty, flexibility, and learning. Uncertainty is
incorporated through the identification of a series of possible scenarios for future climate change
impacts. Flexibility is incorporated through adjustable design so that the project can be redesigned as
circumstances change. Learning is incorporated through monitoring, through continually reviewing

119
evidence regarding climate change impacts, and through improvements in modeling over time so that
decision makers can determine whether and when to exercise the real options incorporated in the
design.
The real options approach is attractive from a fiscal perspective because it is likely to avoid
expenditures on projects that may prove to be unnecessary and delay expenditures which are
premature in the face of uncertainty. Some lower level prudential expenditure that is adequate to
protect people or infrastructure in the near future can be undertaken, leaving decisions for greater
expenditure to the medium and longer term. However, the real options approach requires additional
analysis that is above and beyond what would normally be required in a standard project appraisal. As
such, this approach should be used selectively in the development of sectoral plans and appraisals of
major infrastructure projects that are likely to entail substantial sunken costs, where investments are
long-lived, where long lead times are involved in the generation of outputs and outcomes, or where
interventions are sensitive to climate change impacts. That being said, the underlying principles of real
options have much broader application in the planning process and in program and project design.
The cost-benefit approach can also incorporate uncertainty by taking into account the probabilities of
future costs and benefits; this can be combined with the real options approach to guide investment
decisions. The cost-benefit approach allows decision makers to appraise options in relation to a range of
scenarios, and decisions are made in relation to a preferred or most-likely scenario based on current
knowledge, with the possibility of embedding additional costs related to options that may be exercised
in the future. Where probabilities of certain scenarios are known with reasonable confidence (e.g.,
known knowns), – the values of costs and benefits are adjusted by their probability of occurrence,
yielding an expected net present value after discounting. A degree of uncertainty regarding the
distribution of these probabilities can be incorporated into conventional cost-benefit analysis using
Monte Carlo simulation methods. The result of a CBA will typically depend on a range of different
variables (e.g., initial cost, projected population growth, the incidence of benefits, and so forth), each of
which can be expected to vary over time. An example of the application of real options would be the
development of sea defenses in Campeche, Mexico, through the calculation of net present values and
options values for building a sea wall and restoring a mangrove forest. The analysis found that
construction of a high sea wall would be uneconomical for several decades. However, the cost of
planting and maintaining a bioshield represents an option premium that creates the opportunity to
delay the building of an expensive seawall until it is required.210 Box 3.6 describes how real options are
embedded into the strategic planning exercise.
210
Scandizzo, Pasquale L.(2011). “Climate Change Adapatation and Real Option Evaluation” in Social Science Research Network Scholarly Paper. ID 2046955. Rochester, NY.

120
Box 3.6. Real Options and Planning for the Thames Estuary
The U.K. Treasury’s Green Book (guidance for policy, program, and project appraisal) cites the planning for the Thames Estuary 2100 as an application of the real options approach to climate change. The Thames estuary floodplain contains 1.25 million people, about £200 billion in property, key transport and infrastructure assets, 16 hospitals, and eight power stations. The planning process followed a 5-stage approach:
Stage 1: Assessing Climate Risks. A series of sea-level rise and storm surge scenarios were identified, including a central “most likely” scenario.
Stage 2: Designing Adaptation Options. A comprehensive range of options were identified, including raising river walls, adapting or building flood barriers or flood storage areas, and applying resistance and resilience measures to buildings. These were assembled into portfolios of actions (i.e., High Level Options (HLOs)) which were combined to deal with differing levels of water rise.
Stage 3: Appraising Options to Address Most Likely View of Risk. All of the HLOs were subjected to cost-benefit analysis under the central sea-level-rise scenario to select the best generic option to promote under current knowledge of the most likely climate change outcome.
Stage 4: Appraising Options Under Other Scenarios. Cost-benefit analysis was repeated for the different climate change scenarios. This demonstrates the potential weaknesses in options as interventions to deal with an uncertain future and highlights critical points in key variables (such as sea-level rise) at which a different option may be preferred.
Stage 5: Monitoring and Strategic Review. A system of monitoring key climate change indicators (such as sea-level rise) is put in place. The strategy will be revisited every 5-10 years. If climate change happens more quickly (or slowly) than predicted, decision points may be brought forward (or put back) as appropriate. At each review, the whole strategy may be reappraised in light of new information, which could include a switch to one of the other High Level Options if recommended as a result of the cost-benefit analysis.
The figure shows HLOs and pathways developed by TE2100 (on the y-axis) shown relative to threshold-level increases in extreme water levels (on the x-axis). The blue line illustrates a possible route where a decision maker would initially follow HLO 2 then switch to HLO 4 if the sea level were found to increase faster than predicted.
Sources: HM Treasury and Department for Environment, Food and Rural Affairs (2009). Accounting for the Effects of Climate Change – Supplementary Green Book Guidance; Reeder, Tim and Nicola Ranger (2011). “How Do You Adapt in an Uncertain World? Lessons From the Thames Estuary 2100 Project” in World Resources Report Uncertainty Series.

121
3.5. FLEXIBILITY AND THE DECISION-MAKING PROCESS
Real options build on an intuitive way of thinking about and addressing uncertainty by creating
flexibility to respond to changing circumstances. The benefits of keeping options open are reflected in
metaphors such as “buying time” and “not putting all your eggs in one basket.” It is a strategy employed
by communities, engineers, and businessmen without entering into complex economic analysis (see Box
3.7).
Box 3.7. Flexibility as an Adaptive Strategy
In the early 20th
century, Australian cattle king Sidney Kidman concentrated his land holdings in the dry, drought prone ”dead heart” of Australia rather than diversifying them to include more expensive properties in high rainfall areas. By acquiring properties in chains along rivers and stock routes, he was able to move cattle to market even during droughts when there was insufficient feed and water on the stock routes to support competing herds of cattle. By not fully stocking his properties he paid an option premium in terms of lost production; he also created a real option that allowed him to market his cattle even during severe regional droughts.
Flexibility can be built into engineering solutions. The Stormwater Management and Road Tunnel (SMART) that runs under the financial district in Kuala Lumpur to relieve traffic congestion offers one such example. The tunnel has three levels: two for road traffic and a lower level for carrying flash floods from the Klang river under the city and diverting them out to the Kerayong River. During major storms, cars are excluded from the two traffic lanes and gates are opened to allow stormwater to flow through the upper levels of the tunnel. Traffic can enter again within about 48 hours of closure. The additional construction cost of the multi-purpose tunnel and the surface congestion costs during closure represent an option premium. The cost of the multipurpose tunnel is, however, less than a traffic-only tunnel combined with a duplicate tunnel dedicated solely to channeling intermittent floodwaters.
Sources: Dobes, Leo (2010). “Sir Sidney Kidman: Australia’s Cattle King as a Pioneer of Adaptation to Climatic Uncertainty” in The Rangeland Journal. Vol 34(1).
The challenge for the public sector is to incorporate the key elements of the real options approach —
uncertainty, flexibility, and learning—into routine decision-making processes. A survey of managers in
the private sector found that those who had previously used decision analysis techniques “indicated
that the real options mindset makes them think more about downstream decisions, about breaking
down and measuring uncertainty, and about splitting up decision into several stages.”211 These concepts
can be built into expenditure analysis and planning routines to guide decision making, even in countries
that lack data and analytical expertise.
A number of structured decision-making approaches have been proposed in the literature as a means
to help guide decision makers. The framework presented in Figure 3.3 draws on this literature.212 The
approach seeks to integrate risk-informed decision making into the broader development planning
211
Triantis, A.J and A. Borison (2001). “Real Options: State of the Practice” in Journal of Applied Corporate Finance. Volume 14(2), pp. 11-12. 212
The framework presented here draws in particular on Ranger et al (2010) and World Bank (2012). Ranger et al.(2010). Adaptation in the UK: A Decision-Making Process. Granthan Research Instituter on Climate Change and the Environment and Centre of Climate Change Economics and Policy, Policy Brief September 2010. Ranger and Garbett-Shiels. (2011) How Can Decision Makers in Developing Countries Incorprate Uncertainty About Future Climate Risks Into Existing Planning And Policy Making Processes?
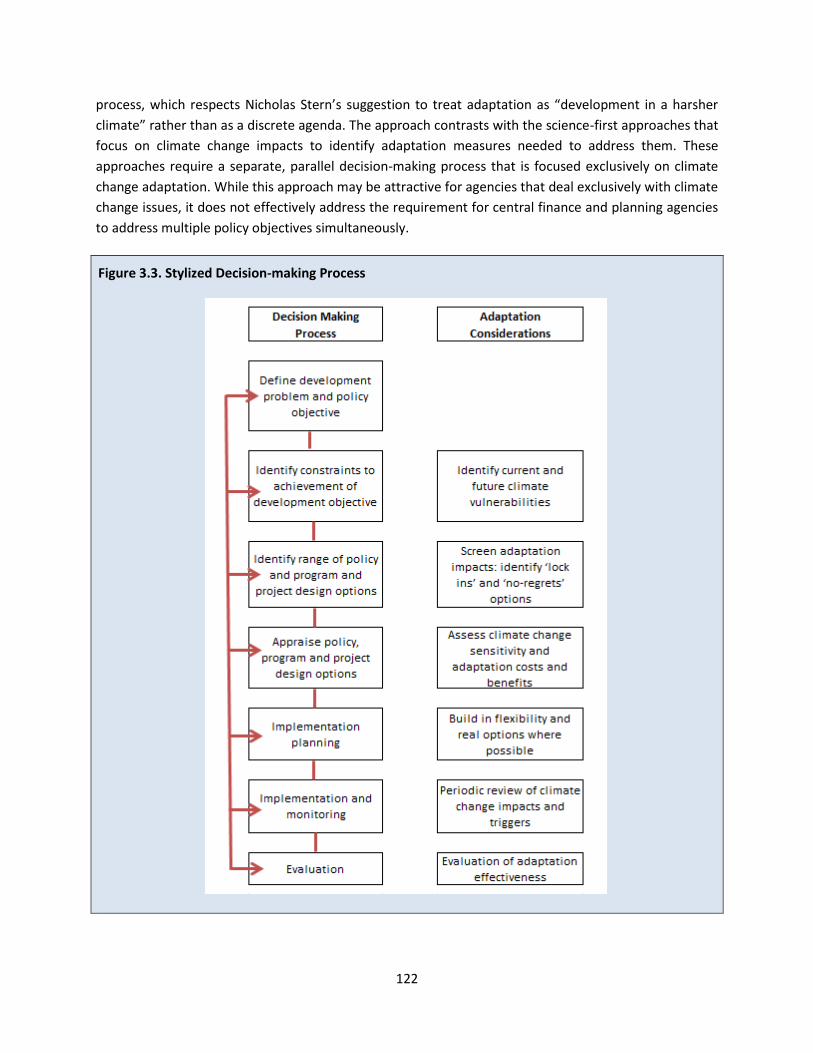
122
process, which respects Nicholas Stern’s suggestion to treat adaptation as “development in a harsher
climate” rather than as a discrete agenda. The approach contrasts with the science-first approaches that
focus on climate change impacts to identify adaptation measures needed to address them. These
approaches require a separate, parallel decision-making process that is focused exclusively on climate
change adaptation. While this approach may be attractive for agencies that deal exclusively with climate
change issues, it does not effectively address the requirement for central finance and planning agencies
to address multiple policy objectives simultaneously.
Figure 3.3. Stylized Decision-making Process

123
The starting point for structured decision making is the definition of the development objectives for
the particular policy, program, or project. These objectives will generally be driven by the development
goals expressed (e.g., economic growth and poverty reduction). Interventions aimed at improving
efficiency, correcting market failures, or promoting innovation, economic diversification, job creation,
and poverty reduction, together with improvements in health care, education, and sanitation, not only
increase welfare and human development but also promote resilience and facilitate adaptation. A
healthy, well-educated, economically empowered population with access to social protection will be
better able to cope with the shocks and stresses of climate change than a population that does not have
these traits. For the most part, development policies are adaptation policies. Many development
interventions may be considered as no-regrets interventions which will bring benefits under any climate
scenarios. They can also be considered as facilitating reactive adaptation, by building the capacity of
individuals, communities, and the private sector to undertake adaptive actions of their own in response
to climate change.
In assessing the constraints that policies, programs, and projects will need to address to achieve their
objectives, decision makers should consider current and future vulnerabilities. While current climatic
conditions may not be a good guide to the future, interventions that facilitate reactive adaptation to
climatic vulnerabilities, and climate variability in particular, will likely facilitate adaptation to climate
change. These no-regrets interventions may include measures aimed at developing warning systems,
insurance markets, social protection, and diversification of crops and income sources. Future
vulnerabilities can be assessed based on high-level data about potential climate changes drawn from the
available models. While it is not possible to map these impacts with any precision, the information
available is generally sufficient for the purposes of identifying those environmental systems and human
activities that are most sensitive to climate change under a range of scenarios. Broad consultations with
stakeholders on the vulnerabilities can help increase the range of impacts from those that are known
knowns, to known unknowns to some unknown knowns (see Figure 3.2).
Once the constraints have been identified, it is possible to identify a range of policy, program, and
project design options to achieve policy objectives and screen these options to assess their adaptation
impact. At a policy level, the options will include actions undertaken by a range of actors: households,
communities, the private sector, and local and central governments. Government may influence these
actors through policy levers (i.e., regulation, taxation, and public spending). Some basic information is
needed to frame the various options, including the nature of the intervention, the expected outcomes,
the expected costs and benefits and their distribution across social groups, and the implementation time
frame. Once the options have been framed, it is possible to assess the expected adaptation impacts. It is
particularly important at this stage to identify potential lock-ins, interventions that will encourage actors
to make decisions that reduce their ability to adapt. Examples include development of flood prone areas
or irrigation in areas that are likely to suffer increasing water scarcity. While it may not be possible to
avoid lock-ins, or economically desirable to do so, the potential consequences of these interventions
need to be clearly flagged for decision makers. Consideration needs to be given to how flexibility can be
built into the design or real options created to facilitate adaptation to changing circumstances in the
future.

124
Appraisal of the policy, program, and project design options should take into account the adaptation
benefits and sensitivity of costs and benefits to climate change risks. Ideally, those options that are
considered feasible are subjected to a cost-benefit analysis and the economic rate of return serves as a
guide for project selection. Probabilistic risk-management analysis can be used to test sensitivity of the
results to climate change scenarios, while robust decision making can be used to strengthen design
elements so that the benefits accrue through a range of climate scenarios, and real options can be used
to build in flexibility and facilitate adaptation as conditions change. Where adaptation costs and benefits
are identified and quantified, these can be incorporated into the cost-benefit analysis. This rigorous,
quantitative approach is justified in the case of policies, programs, and projects that entail substantial
sunk costs, where investments are long-lived and the stream of costs and benefits is sensitive to climate
change. Examples include major investment programs and projects in water management, agriculture,
transport, and energy. In practice, however, many policy decisions are taken without rigorous
quantitative analysis. In these cases, information on the climate change sensitivity of each of the options
and adaptation costs and benefits can be incorporated into background information for decision makers
(i.e., laying out the development rationale for the various interventions). The extent to which these
issues are addressed should be proportionate to the potential climate change impacts on the policy,
program, or project’s effectiveness.
Implementation planning can build in flexibility and real options to accommodate uncertainty
regarding climate change risks and impacts. Some degree of flexibility can be created by designing
interventions to cope with a wider range of possible climate conditions, such as using asphalt that is
suitable for higher air temperatures or culverts that can accommodate higher levels of runoff. This may
make sense where the costs for over-adaptation are low. Where the costs are high, flexibility can be
built in through modular design and the incorporation of real options, such as larger foundations so that
dike walls can be increased if sea levels rise or acquiring additional land so that airport runways can be
extended. Flexibility can also be built in by sequencing a series of interventions, starting with no-regrets
interventions and progressively introducing higher-cost and climate-specific interventions as conditions
change.
Monitoring of climate change impacts and adaptation effectiveness is critical. At the central
government level, periodic assessments of climate, climate change impacts and risks, and ecosystem,
social, and economic vulnerabilities are needed to detect early warning signals that policies and
strategies may need to be adjusted (see Chapter 4). At the policy, program, and project levels,
monitoring is needed to determine whether the interventions remain robust and/or whether some
adjustment is necessary. Where sequencing or options have been built into the design, changing climatic
conditions may trigger a change in approach or exercise of an option. This will generally entail further
analysis to test whether additional investments are warranted. This close, extended monitoring will
need to focus on policies, programs, and projects that have been identified as sensitive to climate
change. Evaluations can help close the feedback loop so that lessons learned about adaptation
effectiveness inform the design and appraisal of new policies, programs, and projects.
125
Structured decision-making processes facilitate stakeholder engagement and promote transparency
and accountability. Stakeholder engagement is particularly important in the response to climate
change. Within governments, the skills needed to identify climate change vulnerabilities and assess the
sensitivity of policies, programs, and projects to climate change are in short supply. They are more
commonly found in environment agencies than the central finance and planning agencies that typically
lead the decision-making process. A structured decision-making process can help specialist agencies
prioritize where they intervene in the design, appraisal, and monitoring of policies, programs, and
projects undertaken by other agencies. Where consultations are built in at critical points in the process
(such as during the definition of objectives and appraisal), they can also provide opportunities for a
wider range of stakeholders, including specialist nongovernmental organizations and academic
institutions, to provide technical input and knowledge.
Public expenditure reviews provide an opportunity to assess the quality of the decision-making
process. The extent to which decision-making processes take climate change into account will be critical
in determining the public sector’s adaptive capability. Where climate change issues are marginalized in a
parallel process or simply not considered, the decision-making process is not only missing opportunities
for adaptation but may in fact be systematically undermining adaptive capacity by locking in households,
communities, and the private and public sectors to situations that limit their capability to adapt. Central
finance and planning agencies would do well to be receptive to suggestions that help integrate climate
change considerations into existing decision-making processes.
126
CHAPTER 4. DISASTER RISK MANAGEMENT
4.1. CHAPTER SUMMARY
This chapter explored the importance of disaster risk management (DRM) in expenditure policy and
analysis within developing countries. The frequency and severity of disasters stemming from natural
hazards have been increasing, with global losses amounting to $380 billion in 2011—the costliest year
on record.213 Policy makers are already examining ways to structure financing and risk in the face of
potential catastrophes. Effectively dealing with disasters in a low-cost fashion requires a framework
focused on risk reduction, risk retention, and risk transfer in the context of budget constraints. The first
step, risk reduction, requires hard and soft investments in infrastructure. The balance between steps
two and three, risk retention and risk transfer, forms a central part of a country’s disaster management
financing strategy. Cost-effective financing strategies make the tradeoff between risk retention and risk
transfer by using proper risk identification and risk layering to match the cost profiles of financing
instruments to the characteristics of different hazards. When properly implemented, DRM strategies
help countries build the necessary fiscal space for managing the impact of disasters.
Disaster risk management is an important element of expenditure policy and analysis in developing
countries. In emerging economies in particular, the rising concentration of population and economic
assets in urban areas, accompanied by poor urban planning, result in rising disaster risks. Until recently,
most disaster-related spending was funded from government resources. The bulk of it is directed
toward post-disaster response and recovery, though there is now a trend toward funding risk reduction
measures (which is more cost-effective in the long term). To effectively deal with disasters in a low-cost
manner, policy makers will need to determine the appropriate policy framework of risk reduction, risk
retention, and risk transfer in the context of budget constraints. A proper financing strategy using all
three instruments can be made based on rigorous risk identification and risk layering. 214
The World Bank’s Global Fund on Disaster Reduction and Recovery (GFDRR) advocates a systematic,
comprehensive approach to determine the appropriate DRM policy framework. It recommends bringing
together households, communities, local authorities, the private sector, and international partners to
reduce risks, protect populations, assets, and livelihoods, and prepare for disasters. The key elements of
the GFDRR framework include risk identification, risk reduction, preparedness, financial protection,
and resilient reconstruction.215
Risk identification consists of risk assessments and risk communication. Risk assessment helps to
improve understanding of the nature of hazards and exposure and vulnerability to them. Assessments
tend to focus on major urban areas, where populations and assets exposed to risks are concentrated.
The information made available through assessments has grown more detailed with the use of modern
geographic information systems; however, there are still challenges gaining access to information on
213
The World Bank and Global Facility for Disaster Reduction and Recovery (GFDRR) (2012). The Sendai Report: Managing Disaster Risks for a Resilient Future. 214
Ibid. 215
Ibid.

127
historic weather and hazard data, assets, and socioeconomic activities. Once a risk assessment is
completed, interactive communication among local communities, governments, and experts help
everyone work together to build resilience and promote prevention.
Risk reduction comprises prevention and disaster risk mitigation measures from both structural and
non-structural categories. Investments in risk reduction can be either hard or soft, with hard
investments being more visible and politically attractive but offering lower rates of return. From lowest
to highest returns, hard investments include enhancing vulnerable structures, building protective
infrastructure (e.g., dikes), and providing environmental solutions (e.g., coastal reefs and mangroves).
Soft investments include development planning and code enforcement.
Preparedness refers to investments in hydro-meteorological and early warning systems, emergency
measures, and contingency planning. Effective early warning systems require a combination of
observing networks, appropriate forecast data and models, and the capacity to manage the information
effectively. Barriers to investments in early warning systems include problems with cost
recovery/financing for long-term maintenance, decentralization and connecting with local communities,
and interagency collaboration.
Financial protection seeks to ensure timely, cost-effective access to disaster relief funds and efficient
execution of the funding. The first step in preparing a financial protection strategy for disasters is
assessing contingent liabilities. This assessment should explain that, in addition to explicit liabilities,
governments after a disaster may also face many implicit liabilities of uncertain level. Once the
assessment is complete, the government must select a mix of financing instruments to structure risk
management in a cost-effective way. Different instruments come with different opportunity costs, and
different types of disasters come with different intensity/frequency profiles. Therefore, a mix of ex-ante
and ex-post financing instruments that would match the type of disaster, as forecasted, is key. Recent
financing and insurance innovations, such as insurance pools and event-based risk transfer products,
have improved governments’ disaster management capacities.
Resilient reconstruction requires a well-formulated policy framework that promotes timely and
effective interventions when disasters occur. Ex-ante design of institutional structures, clear rules for
the allocation of funds, and well-established institutional arrangements for planning and coordination
are all essential. Moreover, to ensure accountability at a time of distress and increased inflows of
external aid, specific arrangements should be made ahead of time for monitoring and coordinating
external funding. Civil society can play an important role in ensuring accountability.
The rest of this chapter consists of the following sections: Section 4.2 provides a general overview of
public disaster risk management and touches on risk management strategy and expenditure
management. Section 4.3 reviews disaster risks and impact on developing countries, including types of
risks and levels of losses. Section 4.4 describes risk management strategies and the elements of the
World Bank’s Global Fund on Disaster Reduction and Recovery – risk identification, risk reduction,
preparedness, financial protection and resilient reconstruction. Section 4.5 has a discussion of such
financial protection strategies as assessing financial exposure, mobilizing financing, and using different

128
disaster risk financing frameworks and instruments. Section 4.6 deals with resilient reconstruction and
related institutional issues.
4.2. DISASTERS: AN OVERVIEW
Disaster risk management is a complex contingent liability for governments. Successful risk
management involves not only post-disaster recovery efforts, but also ex-ante reduction and climate
resilient programs to curb the human and financial impact of hazard events. Dealing with contingent
disaster liabilities requires: (1) managing the liability through fiscal and risk transfer instruments; and (2)
setting out clear roadmaps to reduce liability through hard and soft risk reduction activities. Hard risk
reduction activities include strengthening vulnerable structures and constructing protective
infrastructure, while soft ones include development planning and building code enforcement. Funds set
aside for such liabilities must not only be available during hazard events but also be efficiently executed.
An appropriately executed disaster risk assessment is crucial to planning efforts as well as to
government and donor initiatives to help communities build the capacity and knowledge for risk
management.216
Efficient financing of disaster risk management requires proper assessments of risk and effective risk
layering. Risk assessments examine the frequency and intensity of hazards and a population’s exposure
and vulnerability. These factors directly determine disaster impact and, therefore, the correct
management strategy. For example, some disaster risks may be larger but also unfold at a slower pace,
making them easier to manage. Risk layering allows governments to structure risk management so that
the most efficient financial instruments can be used based on the nature of a particular hazard. This is
essential for cost-effective management, as different financial instruments present different opportunity
costs. Disaster contingency funds, for example, must be liquid and are therefore held in high liquidity,
low yield assets. When properly implemented, disaster management strategies build fiscal space for
governments to maneuver in the event of a natural disaster.
Over the last decade, governments have begun to apply risk management strategies to meet the
challenge of natural hazards. Until recently, governments and development agencies treated disasters
as unforeseen, exogenous shocks—interruptions in the normal process of development to be addressed
as they occurred. Attention was focused on disaster response and recovery with the objective of rapidly
resuming the normal development trajectory. It is now generally recognized, however, that natural
hazards are common and recurring events. While the timing and scale of individual hazard events may
be unpredictable, probabilistic risk assessments allow decision makers to anticipate disaster impacts.
This knowledge facilitates planning, preparedness, and disaster risk management. In forming a
successful DRM strategy, decision makers must use available information to decide how much risk to
reduce, how much to retain, and how much to transfer to the markets.217 They also have to adequately
fund emergency preparedness measures and seek support for resilient recovery efforts.
216
Ibid. 217
Ibid.

129
Disaster risk management is an important element of expenditure policy and analysis in developing
countries. Developing countries, given their geographical location and limited financial capacity, are
particularly vulnerable to natural hazards—and climate variability and change is likely to increase their
exposure. Moreover, the economic cost of disasters is significant and will increase as countries develop,
making risk management, disaster response, and recovery higher priorities for central planning and
finance agencies. Surprisingly, disasters have not been considered in past public expenditure and
institutional reviews, even in countries that are exposed to frequent disasters with acute development
impacts.
4.3. DISASTER RISKS AND IMPACTS
Disasters affect all regions but have the greatest impact on developing countries. From 1970-2008, 95
percent of disaster-related deaths occurred in developing countries, largely due to the greater
vulnerability of their populations.218 Droughts in Africa result in the greatest death tolls, followed by
storms in South and East Asia. Economic losses, on the other hand, are concentrated in developed
countries, which are characterized by a high density of economic assets. The economic impacts are more
acute, however, in developing countries. All of the 25 countries that have suffered cumulative disaster-
related losses in excess of one percent of GDP are developing countries, and 12 of them are small island
states. St. Lucia tops the list with cumulative losses in excess of 10 percent of GDP. This is largely due to
a single, devastating disaster--Hurricane Gilbert in 1988, which caused damages three and a half times in
excess of the country’s GDP. While a larger country–such as the Philippines—may suffer more disasters
with greater cumulative losses, individual disasters in countries with bigger territories typically affect
only a part of it and losses from one disaster in larger economies are typically less devastating for
national economic performance than in smaller nations. The exception is droughts, which may have a
national impact in even the largest countries.
The frequency of some extreme events is increasing and is likely to continue to increase due to
climate change. The Intergovernmental Panel on Climate Change (IPCC) reports that changes in the
intensity and frequency of some extreme weather events are already taking place and will accelerate in
the future.219 Increases in the frequency of heat waves and more heavy precipitation are expected in
many areas of the world. Rising sea levels are likely to make coastal areas more exposed to storm
surges. Damaging storms are likely to become more frequent in warmer climates.
The economic costs of disasters are increasing due to (1) population growth in exposed areas; (2)
haphazard development planning; and (3) economic expansion, with associated increases in gross
fixed capital formation.220 From 1980-2012, estimated total reported disaster-related losses add up to
218
IPCC (2012). The IPCC Special Report on Managing the Risks of Extreme Events and Disasters to Advance Climate Change Adaptation. A Special Report of Working Groups I and II of the Intergovernmental Panel on Climate Change. 219
IPCC (2014). Climate Change 2014: Impacts, Adaptation, and Vulnerability - Summary for Policy Makers. A Contibution of Working Group II to the Fifth Assessment Report of the Intergovernmental Panel on Climate Change. Fifth Assessment Report of the Working Group II. 220
World Bank (2013). Main Report Vol. 1 of Building Resilience: Integrating Climate and Disaster Risk into Development - the World Bank Group Experience.

130
$3.8 trillion.221 Estimates of annual losses during this period have ranged widely, from a few billion
dollars in some years to over $200 billion in 2005 when Hurricane Katrina hit the U.S.222 Overall, annual
economic losses averaged $12 billion per year in the 1970s and have grown to $88 billion in the 2000s
(Figure 4.1 and Figure 4.2).223 This is largely due to increases in the population and value of assets
exposed to natural hazards. Rapid urbanization presents a particular challenge. By 2050, the UN
estimates, 70 percent of the world's rising population will live in cities and, as a result, the urban
population exposed to earthquakes and cyclones is expected to double.224 This concentration of
population, assets, and economic output increases the risk that any single event will have national-level
impacts.
Figure 4.1. Disaster Losses from 1970 to 2009225 Estimated direct losses (in 2009 USD) from natural disasters as defined by CRED in the CRED EMDAT
database.
221
World Bank (2014). Managing Disaster Risks for Resilient Development. Retrieved June 21, 2014, from http://www.worldbank.org/en/results/2013/04/12/managing-disaster-risks-resilient-development. 222
IPCC (2012). Managing the Risks of Extreme Events and Disasters to Advance Climate Change Adaptation. 223
World Bank and GFDRR (2013). Disaster Risk Management in South Asia: A Regional Overview. All data on Emergency Events Database (EM-DAT: The OFDA/CRED International Disaster Database); All figures are in real 2010 USD. 224
Food and Agriculture Organization of the United Nations (2009). How to Feed the World 2050. 225
World Bank (2013). Building Resilience: Integrating Climate and Disaster Risk into Development - the World Bank Group Experience.

131
Figure 4.2. Average Annual Direct Losses from Natural Disasters as Shares of GDP 226 Estimated direct losses (in 2009 USD) from natural disasters as defined by CRED in the CRED EMDAT
database.
Note: These figures exclude epidemics, insect infestations, slides, and wildfire.
Disasters have long-term impacts on development prospects. At the household level, damages from
disasters are particularly acute for poor households. Loss of assets, disruptions in schooling, ill health,
and malnutrition all lead to lasting damage to earning potential and well-being. The evidence regarding
the impact of disasters on economic growth, however, is more ambiguous. A 2009 working paper by
World Bank staff concludes that disasters may or may not have a negative impact on output growth in
the medium term (5 years) depending on the type of hazard, its severity, and the affected area’s level of
economic development. The impact also depends on the particular economic sector under
consideration.227
Disaster type. Storms and droughts have systematic negative impacts on medium-term growth
prospects; floods and earthquakes do not.
Severity. Disasters that rank in the top 10 percent for severity have adverse effects on medium-term
output regardless of their type.
Level of economic development. Developing countries suffer more severe reductions in output than
higher income countries due to such factors as poorer infrastructure.228
Economic sector. Droughts are likely to significantly affect agriculture but not industry; earthquakes
have bigger impacts on industry.
The ability to mobilize financing has an important impact on the effectiveness of post-disaster
economic recovery. A recent study using data from high and middle income countries from 1975-2008
226
Ghesquiere, Francis and Olivier Mahul (2010). Financial Protection of the State against Natural Disasters: A Primer. World Bank Policy Research Working Paper 5429. 227
Loayza, Norman, Eduardo Olaberria, et al (2009). Natural Disasters and Growth: Going beyond the Averages. World Bank Policy Reesearch Working Paper 4980. 228
World Bank and United Nations (2010). Natural Hazards, Unnatural Disasters. p.57.

132
concluded that countries with more developed financial and insurance markets suffer lower post-
disaster falls in output than countries with less developed markets. The study observed that deficits
increased by 75 percent in financially developed countries (as opposed to 10 percent in others). This
reflects the greater increase in post-disaster government spending in the former group—a mobilization
enabled by their more-developed financial markets. More financially developed countries also see no
significant loss of output, while less financially developed ones see output reductions ranging from 2-10
percent of GDP. Countries with developed insurance markets manage to avoid significant reductions in
output without engaging in deficit financing of expenditures.229
A significant part of the domestic and external financing for post-disaster response and recovery
comes from the reallocation of routine and development expenditures. Post-disaster budget
reallocations are difficult to track because many reassign resources to new activities under the same
administrative and line item categories. It is clear, however, that reallocations come in part from
planned capital expenditure budgets, largely because these are small budgetary components that are
easier to reallocate than personnel or social safety net expenditures.230 The resulting fall in capital
investments stymies the long-term growth trajectory.
Similarly, aid flows are not increased or decreased, but rather reallocated after disasters. Donors
respond to disasters by reallocating resources and bringing forward existing commitments.
Consequently, while total aid commitments may increase immediately following a disaster, over the
medium-term the level of external financing remains largely unchanged.231
Disaster-related activities account for a significant part of World Bank assistance.232 From fiscal year
2010-2013, the World Bank spent a total of $11.6 billion on its disaster risk-management-related
portfolio.233 Disaster-related funds are allocated for two main categories: (1) ex-ante disaster risk
management, and (2) ex-post reconstruction. Over 95 percent of the Bank’s investment is channeled
toward the latter category. However, an independent evaluation of World Bank assistance notes that
investments with the most impact for reducing vulnerability and risk are actually ex-ante activities—
precisely those for which countries are least likely to borrow. Emphasizing risk management in the
context of public expenditure and institutional reviews can help raise awareness of the need to change
the focus of disaster-related public expenditures.
229
Melecky, Martin and Claudio Raddatz (2011). How Do Governments Respond after Catastrophes? Natural-Disaster Shocks and the Fiscal Stance. World Bank Policy Research Working Paper 5564. 230
Fonden, GFDRR and World Bank (2012). Fonden: Mexico’s Natural Disaster Fund – A Review. 231
Benson, Charlotte and Clay, Edward (2004). Understanding the Economic and Financial Impacts of Natural Disasters. World Bank Disaster Risk Management Series No. 4. 232
Estimating flows in global disaster-related development assistance is very difficult. Statistics on overseas development assistance do not earmark financing for post-disaster response and recovery. Data is available on humanitarian relief–which accounts for nine percent of total ODA in the period 2004-2010–but this includes assistance unrelated to disasters. Rough estimations from the Sendai Report suggest, however, that out of the $91 billion spent on disaster aid in 2009, 69.6 percent went toward emergency response, 24.8 percent toward reconstruction, and only 3.6 percent toward prevention and preparedness. 233
World Bank Independent Evaluation Group (2006). Hazards of Nature, Risks to Development: An IEG Evaluation of World Bank Assistance for Natural Disasters.

133
4.4. RISK MANAGEMENT STRATEGIES
Policy makers have to determine the appropriate balance between risk reduction, risk retention, and
risk transfer. Traditionally, governments have retained a significant part of their exposure to disaster
risks. A recent study of public expenditures on disasters in Colombia, Mexico, and Nepal concluded that
governments consistently spend less on ex-ante risk reduction and transfer than they do ex-post on
disaster recovery and response. The study notes, however, that risk reduction spending has risen over
the past decade.234 Donors have also tended to spend more on disaster response than on disaster risk
reduction, though here again the share of resources allocated to risk reduction is increasing. At an
international level, there is agreement that risk reduction and transfer should be addressed more
effectively in national DRM strategies (Box 4.1).
Box 4.1. Hyogo Framework for Action
The Hyogo Framework for Action (HFA), developed following the 2004 Indian Ocean tsunami, lays out a framework for assembling a comprehensive risk management strategy. The framework has three strategic goals:
1. Integration of disaster risk reduction into planning and sustainable development policies.
2. Development and strengthening of institutions, mechanisms, and capacities for resilience.
3. Systematic incorporation of risk reduction approaches into programs of emergency preparedness, response, and recovery.
HFA identifies priority action items for 2005-2015 and encourages countries to establish institutional frameworks for follow-up. Most countries now have a HFA Focal Point; 72 countries have also established National Platforms.
Consultations for a new, post-2015 framework are also underway, as detailed at http://www.preventionweb.net/posthfa. A framework for continued post-2015 action will be discussed at the World Conference on Disaster Risk Reduction in Sendai, Japan, in March 2015.
Source: United Nations (2005). Hyogo Framework for Action 2005-2015: Building the Resilience of Nations and Communities to Disasters. Extract from the final report of the World Conference on Disaster Reduction (A/CONF.206/6); United Nations (2011). Hyogo Framework for Action 2005-2015: Building the Resilience of Nations and Communities to Disasters. Mid-term Review 2010-11.
The Global Fund on Disaster Reduction and Recovery (GFDRR) advocates a systematic, comprehensive
approach to determine the appropriate DRM policy framework. An effective strategy has to involve
central and local authorities, households, communities, the private sector, and international partners. It
must reduce risks, protect populations and assets, and prepare for disasters. While the GFDRR creates
the policy framework, regional DRM teams must follow the framework to implement rapidly expanding
portfolios of risk reduction and recovery measures. The key elements of the GFDRR approach, illustrated
in Figure 4.3 and reviewed in the rest of this chapter, include:
Risk identification. Assessment and communication of risk.
234
de la Fuente, Alejandro (2010). Government Expenditures in Pre and Post-Disaster Risk Management. Background Note for World Bank–U.N. Assessment on the Economics of Disaster Risk Reduction (2010). Natural Hazards, Unnatural Disasters: The Economics of Effective Prevention.

134
Risk reduction. Reduction of risk through prevention and disaster risk mitigation measures,
including both structural and non-structural measures (e.g., infrastructure, land use planning,
policies, and regulations).
Preparedness. Investment in early warning systems and contingency planning.
Financial protection. Managing the financial impact of natural disasters, assessing and reducing
contingent liabilities, creating financing instruments for managing retained risks and risk transfer.
Resilient reconstruction. Ex-ante design of policies and institutional arrangements for post-disaster
response, recovery, and reconstruction, incorporating measures that reduce the risks from future
events.
Figure 4.3. Comprehensive Disaster Management Strategy235
235
World Bank and GFDRR (2012). The Sendai Report: Managing Disaster Risks for a Resilient Future.

135
RISK IDENTIFICATION
Risk identification begins with a risk assessment, which is constructed by assessing hazards, exposure,
and vulnerability—the three components that interact to create risk:236
Hazard. Hazard assessments provide information on the frequency and intensity of hazards, drawing
on historical data and probabilistic modeling. Population pressures and poor natural resource
management, such as uncontrolled deforestation and urban expansion, create environmental stress
that can lead to more floods, landslides, and other hazards. Hydro-meteorological hazards are also
likely to increase due to climate change.
Exposure. Assessing exposure means identifying the people and assets that are exposed to hazard
events. Population and economic growth have been the main drivers for increasing exposure,
pushing up the potential for loss.
Vulnerability. Vulnerability denotes the ability of people and assets exposed to hazards to withstand
the impact of a hazard event. This is driven by several factors--physical, social, economic,
governance, and environmental--that increase the susceptibility of a community to the impact of a
natural hazard. Examples of elements increasing susceptibility include unplanned human
settlements, unsafe building practices, and high population densities (particularly in growing urban
areas).
Disaster risk assessments have tended to focus on major urban areas, where populations and assets
exposed to risks are concentrated. Risk assessments are often undertaken at the municipal level, or are
focused on one specific hazard posing a particular threat to the city. As a result, the overall regional or
national picture is often missing, complicating efforts to see how hazards, exposure, and vulnerability
relate to development plans at a broader level.
Modern geographic information systems facilitate the development of scalable multi-hazard, multi-
purpose disaster risk assessments. These tools support land use, infrastructure, and sector planning and
have been developed at the urban, national, and regional levels. Examples include projects like
GeoNode, national-level initiatives like InaSAFE, region-wide programs like CAPRA, and worldwide
databases like the World Bank’s Climate Change knowledge Portal (Box 4.2).
The principle challenge in the development of these systems is access to information. This includes
historical data on weather and hazard events, as well as data on assets and socioeconomic activity. The
data problem can be tackled by developing hydro-meteorological systems and by consolidating the
information available from cadastral registers, municipal property tax registers, business licensing, and
other databases.
Appropriate risk communication must follow risk assessment. Communications must be built upon
active input from the local community, experts, and the government.
236
Ibid.

136
Box 4.2. Geographic Information Systems for Disaster Risk Assessments
Modern geographic information systems (GIS) support disaster risk assessments that simultaneously address multiple hazards and multiple planning initiatives. Examples of such systems exist at the urban, national, and regional levels; some systems are created at the regional level to rationalize the costs for their construction. Some prominent projects include the following:
GeoNode. Provides an open source geospatial content management platform for developing GIS and for deploying spatial data infrastructures (SDI).
1
InaSAFE. A national-level spatial data infrastructure platform created by Indonesia, Australia, and the World Bank. A free software, it allows disaster managers to study realistic natural hazard impacts.
2
CAPRA. A free, modular, open-source, and multi-hazard tool for risk assessment covering Central America. CAPRA applications consist of (1) a risk map tool which visualizes hazard impacts and compares their distributions with a wide range of other indicators to assess exposure and vulnerability; (2) a cost-benefit analysis tool for risk prevention and mitigation; and (3) programs that assist in the design of risk financing strategies.
3
Climate Change Knowledge Portal (CCKP). A centralized source of information, data, maps, and reports about climate change and climate-related information for countries and regions around the world. The CCKP provides environmental, disaster risk, and socio-economic datasets. It also includes Climate Adaptation Country Profiles, which presents synthesized climate information and maps cities, infrastructure, and geographical features for each country.
Sources: GeoNode : http://geonode.org/; InaSAFE: http://inasafe.org/en/; CAPRA: http://www.ecapra.org; Climate Change Knowledge Portal: climateknowledgeportal.worldbank.org, and countryadaptationprofiles.gfdrr.org.
RISK REDUCTION
Risk reduction strategies pose up-front costs to governments, but provide medium term savings. Risk
reduction plans are often politically unpopular because they entail up-front costs whose returns will not
be realized until the medium term. Risk reduction is important in reducing both the fiscal impact and
social disturbance caused by disasters, however, so governments should consider funding such
strategies.237
Investments in risk reduction can be divided into two categories—hard and soft. Hard investments
give visible returns that can be quantified in financial terms. They include process improvements that
generate cost savings that fit identifiable, measurable metrics. Because of their visibility, hard
investments are also less subject to the tradeoff between rent seeking/lobbying groups and sound
development planning and execution. In the context of DRM, they tend to have the effect of reducing
physical risk (e.g., through construction of new dikes). Soft investments, on the other hand, are less
directly visible; their results are also harder to quantify or measure financially. In DRM, they tend to
have the effect of ensuring future risk is not built into the capital stock (e.g., through upgrading the
building code).
237
Ibid.

137
Hard investments have much lower rates of return but are more politically attractive because they
produce visible results, are not subject to strong incentives for rent-seeking, and do not pose difficult
tradeoffs in development planning. Hard investments in DRM fall into the following categories:
Strengthening, or “hardening,” vulnerable structures. Many hard investments in infrastructure
involve strengthening existing infrastructure to decrease vulnerability to hazards. This has the
lowest rates of return but is straightforward and desirable for areas with wind and seismic risk. Once
hardening is complete, funding must be provided for maintenance so that the infrastructure can be
expected to withstand hazard events of the magnitude prescribed in its design standards.
Building protective infrastructure. The construction of protective infrastructure has higher rates of
return than strengthening vulnerable structures because the value of assets protected will grow
over time as the capital stock increases. Protective infrastructure is well suited to flood and other
hydromet risks; examples include dikes, seawalls, and river management. Here, again, project
maintenance is crucial.
Providing environmental solutions. Construction and implementation of environmental buffers—a
type of protective infrastructure—provide the highest return of any type of hard infrastructure.238
This solution is rarely considered, however, because governments find it difficulto manage
ecosystems. The challenge for central finance and planning agencies is to ensure that alternatives to
engineering solutions are given adequate consideration. Practitioners argue that these alternatives
are more likely to be considered when communities are involved in risk assessment, planning, and
project design. Furthermore, environmental buffers are more likely to prove successful where
communities have rights over these assets and are involved in the protection of ecosystems. See
Box 4.3 for examples of environmental buffers.
Box 4.3. Environmental Buffers
Enviromental buffers vary based upon location, as each geographic area possesses its own set of ecosystems. In tropical areas, coral reefs or coastal mangroves offer protection against storm surges and tsunamis. Protection of these natural assets can offer significant economic returns. A study from Malaysia estimates that mangroves have an economic value of $300,000 per kilometer, based on comparisons with engineering alternatives. Another study, from Vietnam, estimates that an initial investment of $1.1 million in protective mangrove forests saved approximately $7.3 million a year in sea dyke maintenance. For watershed areas, reforesting can delay runoff and reduce flood risks. Areas prone to landslides and avalanches can reduce the occurrence of such events by reintroducing vegetation onto steep slopes.
Sources: United Nations Educational, Scientific, and Cultural Organization, United Nations Water, and World Water Assessment Programme (2012). Managing Water Under Uncertainty and Risk: The United Nations World Water Development Report 4.
Soft investments include development planning and code enforcement. The most prominent of these
is the implementation and environmental assessment of building codes and land use plans. These plans
must trade off the increased cost of constructing more resistant infrastructure against the economic
benefits of asset protection. Examples of development planning include the designation of “critical
infrastructure”—infrastructure considered crucial because it is part of civil defenses or provides
238
Renaud, Fabrice G., Karen Sudmeier-Rieux and Marisol Estrella (2013). The Role of Ecosystems in Disaster Risk Reduction.

138
essential services in a post-disaster context (e.g., access roads, bridges, and hospitals). Although soft
investments are difficult and costly both politically and institutionally, they produce very high returns.
Like most risk reduction measures, they have up-front costs and results that will only be visible starting
in the medium term. Overall, government decision makers must both reduce liabilities, as discussed in
this section, and manage retained liabilities as discussed in the next section.
PREPAREDNESS: EARLY WARNING
Investments in weather forecasting and early-warning systems save lives and help protect assets at
relatively low cost. Flood warnings, for example, are a high-return method for protecting assets. A
significant proportion of household and business assets can be moved out of harm’s way given adequate
flood warnings; a study from Germany noted that one-third of household assets and 80 percent of
manufacturing assets could be protected this way.239 In the case of tsunamis and cyclones, a few
minutes’ warning can allow people to move to safer ground. Cyclone warnings allow people to batten
down and protect their homes. Such weather forecasting and early-warning systems also have other
benefits. They help farmers, for example, to decide when to plant, sow, and harvest; they help
electricity and water utilities manage demand; they help airlines and shipping companies to plan routes.
All things considered, studies suggest benefit-cost ratios for weather forecasting fall between 2 and 14
in European and Asian countries.240
Weather forecasting and early warning capabilities form a chain, which is only as strong as its weakest
link. The links in this chain include a local observation system for hydro-meteorological and other hazard
risks; the capability to translate observation data into forecasts using appropriate models; the capability
to translate forecasts into appropriate warnings; the communications capability to make sure that
warnings reach those that are responsible for prevention measures (e.g., evacuation); and awareness
among public officials and the broader public of the appropriate response to warnings. Barriers
impeding a proper uninterrupted functioning of any link in the chain can greatly disrupt the work of the
overall early warning system. A 2006 World Meteorological Organization survey distributed to its 187
members, to which 139 responded, revealed weaknesses in many of these links. Eighty developing
countries and 22 LDCs reported that they lacked appropriate observing networks, the ability to maintain
them, and the capacity to maintain their databases. About three quarters of developing countries and
nearly all LDCs reported that forecasters’ lack of training was a limiting factor in their ability to support
disaster risk reduction. Most respondents identified the need to strengthen their operational forecasting
capabilities, coordination with other agencies that gather hydro-meteorological data (e.g., airports,
agro-meteorological stations, and local authorities), and coordination with emergency response
agencies. 241
239
For an overview, see Hallegate, Stephane (2012). Cost Effective Solution to Reduce Disaster Losses in Developing Countries: Hydro-Meteorological Services, Early Warning, and Evacuation. World Bank Policy Research Working Paper 6058. 240
World Bank–U.N. Assessment on the Economics of Disaster Risk Reduction (2010). Natural Hazards, Unnatural Disasters: The Economics of Effective Prevention. p.14. 241
World Meterological Organization (2008). Capacity Assessment of National Meteorological and Hydrological Services in Support of Disaster Risk Reduction: Analysis of the 2006 WMO Disaster Risk Reduction Country-level Survey.

139
The following elements are critical for a reliable well-functioning weather forecasting and early
warning system:
Sustainable financing. Hydro-meteorological services and other early warning systems are usually
considered a public good and depend entirely on budgetary allocations for cost recovery.242 This
approach is justified by the social returns these systems provide. Governments may be tempted to
ask hydro-meteorological agencies to raise revenues and contribute to cost recovery by selling
forecast services; after all, some European agencies (e.g., Météo-France and the United Kingdom’s
Met Office) do so. However, a for-profit approach, especially in developing countries, may
discourage the agencies from releasing information with commercial value to those who are unable
to pay, such as small-scale farmers. A national hydro-meteorological system that would reliably
provide information to meet the needs of all constituencies requires long-term financing to
guarantee its sustainable functioning and should be funded from the budget.
Decentralization and connection to local communities. For warning systems to work effectively,
there must be ways to reach those exposed to hazards and mobilize collective action. A
decentralized agency with staff in local communities can help increase connectivity between central
warning systems and populations in affected areas. Many existing systems rely on radio and
television broadcasts to disseminate information about hazards, and some countries also use
volunteer networks to mobilize communities. Bangladesh, for example, operates a cyclone
preparedness program center that alerts a network of volunteers through HF/VHF radio broadcasts;
the volunteers in turn pass the warnings through to their communities. These efforts to spread
warnings must, however, be complemented by disaster awareness on the part of the affected
community and knowledge regarding best responses.
Inter-agency collaboration. Meteorological organizations must not only strengthen their
operational forecasting capabilities, but they must also coordinate with other agencies that gather
hydro-meteorological data (e.g., airports, agro-meteorological stations, and local authorities).
Further, they must coordinate with emergency response agencies to plan early warnings and help
responders anticipate the recovery needs of affected areas.243 National level systems can also work
with sources of global meteorological forecasts to track weather patterns, such as cyclones, and
seasonal weather conditions, such as El Nino. Global data can also be used by national authorities
for short-term forecasting; local data, however, is particularly important for forecasting and
monitoring of droughts, flash floods, and other extreme weather events.
4.5. FINANCIAL PROTECTION
Financial protection strategies are meant to ensure (1) timely, cost-effective access to disaster
response funds; and (2) efficient execution of the funds. These strategies must address a range of
disaster risks, from low impact high frequency events like landslides to high impact low frequency
242
For the discussion on development of hydro-meterological systems and financing, see World Bank (2010). Weather and Climate Services in Europe and Central Asia A Regional Review. World Bank Working Paper No. 151. 243
World Meterological Organization (2008). Capacity Assessment of National Meteorological and Hydrological Services in Support of Disaster Risk Reduction: Analysis of the 2006 WMO Disaster Risk Reduction Country-level Survey.

140
events like earthquakes. The key to a successful disaster risk financing strategy is matching the nature of
the risk with the appropriate mix of financing instruments. When executed well, this minimizes financing
costs while optimizing the timing of finance mobilization.
Disaster risk management has to be addressed as part of the government’s overall fiscal risk
management strategy. The direct economic losses from natural disasters often exceed 10 percent of
GDP in developing countries. However, governments can also be faced with comparable or greater fiscal
risks from unexpected economic developments (e.g., exchange rate depreciation, changes in commodity
prices) and contingent liabilities (e.g., guarantees, local government bailouts, calls on government
following banking crises). A comprehensive approach to fiscal risk management allows the government
to determine its overall exposure, taking into account positively correlated or mutually reinforcing risks.
Major disasters pose particular challenges for central planning and finance agencies. Because timely
responses are so essential, governments have to expedite budget execution and procurement in
response to disasters. They are often faced with significant inflows of resources from multiple agencies,
much of it in-kind and off-budget. Reallocations and mobilization of existing government resources
occur alongside the receipt of external resources. At the same time, the government has to maintain
fiscal discipline and meet fiduciary standards throughout the process.
Publication of the government’s fiscal risk profile and risk management strategy is now considered
good practice, even though it is still the exception rather than the rule. International Public Sector
Accounting Standards (IPSAS) for accrual accounting require disclosure of contractual contingent
liabilities in notes to financial statements when the possibility of payment is “not remote.” There is no
such obligation under cash accounting, used in most developing countries, but disclosure is
recommended. The IMF Code of Good Practices on Fiscal Transparency also encourages governments to
disclose contingent liabilities and the government’s gross and budgetary exposure.244 Budget framework
legislation in some countries requires disclosure of government contingent liabilities; in a few countries
this requirement extends to comprehensive reporting of all risks that could affect the fiscal outlook. In
practice, however, reporting on fiscal risks is still far from systematic. A survey conducted by the IMF in
2008 identified seven countries that consolidated information on risks into a single document–usually
part of budget documentation–and only two of these countries (New Zealand and Indonesia) include
natural disasters in their “comprehensive” risk assessment.245 That said, the practice of consolidated risk
reporting is gaining ground.
ASSESSING FINANCIAL EXPOSURE
The starting point for the government’s financial protection strategy is an assessment of financial
exposure. Exposure should take into account both potential revenue losses and the costs of disaster
response and recovery. Note that the fiscal impact of disasters on governments can also vary
dramatically due to the presence of implicit liabilities. Government liabilities are either explicit or
244
IMF (2007). Code of Good Practices on Fiscal Transparency. 245
For a review of fiscal risk management practices, see Cebotari, Aliona et al (2008). Fiscal Risks: Sources, Disclosure, and Management. IMF Fiscal Affairs Department.
141
implicit. Explicit liabilities are specified by laws and contracts, and the liability is usually defined as lump
sum or capped payouts of grants or loans to distinct categories of beneficiaries. Implicit liabilities are
specified by moral or political obligations and are often not officially recognized until a trigger event,
such as a disaster, occurs. In the case of implicit liabilities, the trigger event, the value at risk, and the
required size of government outlays are less certain.246
Assessments of financial exposure usually draw on historical data. Assessment of the costs incurred by
governments in previous disasters can provide a starting point for an estimation of future costs. The full
cost of disaster response and recovery are often difficult to assess because some activities are financed
by simply shifting staff and budgets from routine and development activities to post-disaster activities.
Often these reallocations go unrecorded in budgets and accounts, which will only provide information
on expenditures specifically appropriated for disaster response and recovery. Examination of historical
data should also account for the frequency and intensity of different types of disasters (i.e., a recent
history of high frequency, low impact events provides little guidance on the likely cost of low frequency,
high impact disasters). Given the likely changes in climate extremes, a different approach is needed to
ensure adequate assessment of financial exposure.
Probabilistic risk assessments can complement this historical analysis. Probabilistic risk assessment
was originally developed by the insurance industry to determine risk exposure on a portfolio of assets.
Modern disaster risk assessments usually incorporate an assessment of the government’s exposure and
can generate loss metrics for different classes of assets, hazards, and probabilities of event recurrence.
For public assets, valuations of loss are straightforward—they can be built from a record of assets, their
construction cost, expected useful life, and current reconstruction cost. The problem lies in the
availability of data; many countries will have little or no information on public infrastructure, land, or
moveable assets. The loss valuation process is more complicated for households, the private sector, and
local governments.
In principle, households, the private sector, and local governments should assume responsibility for
losses incurred during disasters and make appropriate provisions by saving and purchasing insurance.
More than 40 percent of direct losses from natural disasters are insured in developed countries, usually
through compulsory insurance. In contrast, it is estimated that less than 10 percent is covered by
insurance in middle-income countries and less than 5 percent in low-income countries. This is largely
due to the lack of adequate insurance markets (except for life insurance).247
In practice, governments are often called upon to help the victims repair and replace private assets
damaged or destroyed by disasters. This often creates implicit liabilities, in addition to the explicit ones,
as governments are pressured to provide more resources to victims than defined by law. In Vietnam, for
246
Response and recovery typically include the following cost elements: (1) the cost of direct and in-kind transfers to the most vulnerable of the affected population (explicit and implicit); (2) the cost of reconstruction or replacement of damaged public infrastructure (explicit); and (3) the cost of statutory transfers to households and the private sector to support recovery and restoration of destroyed or damaged assets (implicit). 247
Cummins, David and Olivier Mahul (2009). Catastrophe Risk Financing in Developing Countries: Principles for Public Intervention.

142
example, the law stipulates that rural households receive a lump sum for the destruction of their house
by a natural disaster (explicit liability). However, this amount is generally considered insufficient and the
government often increases the amount after a disaster (implicit liability). In Colombia, the government
is not required by law to provide financial assistance for the reconstruction of private dwellings but does
so in practice. These implicit liabilities often pose the greatest fiscal risk to governments: the event
triggering the liability is uncertain, the value at risk is difficult to evaluate, and the government’s
exposure is difficult to predict. 248 Policies that make government’s liability explicit help cap the
government’s overall exposure and facilitate the calculation of potential losses.
Policies laying out the government’s post-disaster liabilities should allocate risk to the entity best able
and most incentivized to manage that risk. Moral hazard arises when government absorbs the losses of
households, the private sector, and local governments by financing the replacement of assets damaged
or destroyed in disasters. Doing so reduces incentives for risk avoidance, risk reduction, and risk
protection. Governments rectify this by providing subsidies and regulations that support risk avoidance,
reduction, and protection. Where governments do absorb losses, they should do so in such a way that
leaves some risk at the margin, for instance by limiting government payouts to only part of the value of
lost assets.
FINANCING STRATEGY
Estimating the gap between funding availability and the financing needs of disaster response and
recovery will help determine the amount of financing that governments must mobilize. The Inter-
American Development Bank developed the Disaster Deficit Index as the standard methodology for
assessing potential funding gaps in Latin American and Caribbean countries. This represents a static
assessment of financing requirements for disaster response and recovery (see Box 4.4). The World Bank
has undertaken a dynamic disaster funding gap analysis for Vietnam. The study reviewed government
financing for natural disasters and compared it with an analysis of the impact of natural disasters on the
government’s fiscal balance from 2000-2009. This showed that the government had usually been able to
finance post-disaster recovery activities out of its short-term fiscal resources. However, significant
funding gaps followed high impact events. Estimates of the probable maximum losses over 10-year and
50-year periods also identified significant funding gaps.249 Both static and dynamic methods highlight the
challenge governments face in mobilizing financing for low frequency, high impact disasters.
To meet these needs, the design of the financing strategy has to account for financing requirements.
Low-impact disasters occur with such frequency that they may be considered normal environmental
conditions. These expenditures should be covered from annual appropriations as part of the normal cost
of government operations. Governments should also be able to finance the immediate response to
higher impact disasters from liquid resources. On the other hand, the bulk of expenditures following
higher impact events are likely to arise several months later as recovery and reconstruction programs
begin. This is the point when the financing requirements to meet liquidity constraints are most acute.
248
Ghesquiere, Francis and Olivier Mahul (2010) Financial Protection of the State against Natural Disasters: A Primer. World Bank Policy Research Working Paper 5429. 249
World Bank (2010). Weathering the Storm: Options for Disaster Risk Financing in Vietnam.

143
Box 4.4. Measuring Financing Gaps
The Disaster Deficit Index (DDI) measures the economic loss a country could suffer from a catastrophic event and the resources the public sector must expend to cover those losses. Government responsibility is restricted to the sum of losses associated with public sector buildings and housing for the lowest income population. Losses are calculated for 500-, 100- and 50-year return periods. Also given is the annual expected loss value (i.e., the annual average investment or savings a country must make to cover losses associated with future major events). Losses are compared with the internal and external resources available to the government. A DDI greater than 1.0 indicates a country is unable to cope with extreme disasters even when exhausting its borrowing capacities.
Data from fourteen countries in 2000 reveal DDIs greater than one for three countries for 50-year events, eight countries for 100-year events, and 13 countries for 500-year events. The bar chart on the left shows the DDI calculated in 2000 for events with a 100-year return period. The chart on the right shows the maximum loss for the government during the same period. Peru is in the most critical situation, with a DDI of 3.5 and estimated losses of over $4 billion for a 1‐in‐100 year event.
Source: InterAmerican Development Bank (2008). Indicators of Disaster Risk and Risk Management, http://www.iadb.org/exr/disaster/.
FINANCING INSTRUMENTS
Use of a blend of ex-ante and ex-post financing instruments allows governments to structure risk
management so that relatively low-cost instruments are used to finance low impact, high frequency
events and transfer part of the risk for financing higher impact, less frequent disasters (Box 4.5).
GFDRR recommends a tri-level, bottom-up risk layering approach. This method builds on a country’s
understanding of its own exposure to adverse natural events, and signals a proactive stance toward
disaster risks. From the base to the top, the method consists of the following:
Contingency budgets for financing risks from low impact, low frequency disasters (base layer).
Contingency budgets come from a country’s own resources and are therefore usually the cheapest
source of government financing.
Budget reallocation, borrowing, and contingent credit for intermediate risks (middle layer).
Contingent debt provides a flexible mechanism to manage risk at relatively low cost.
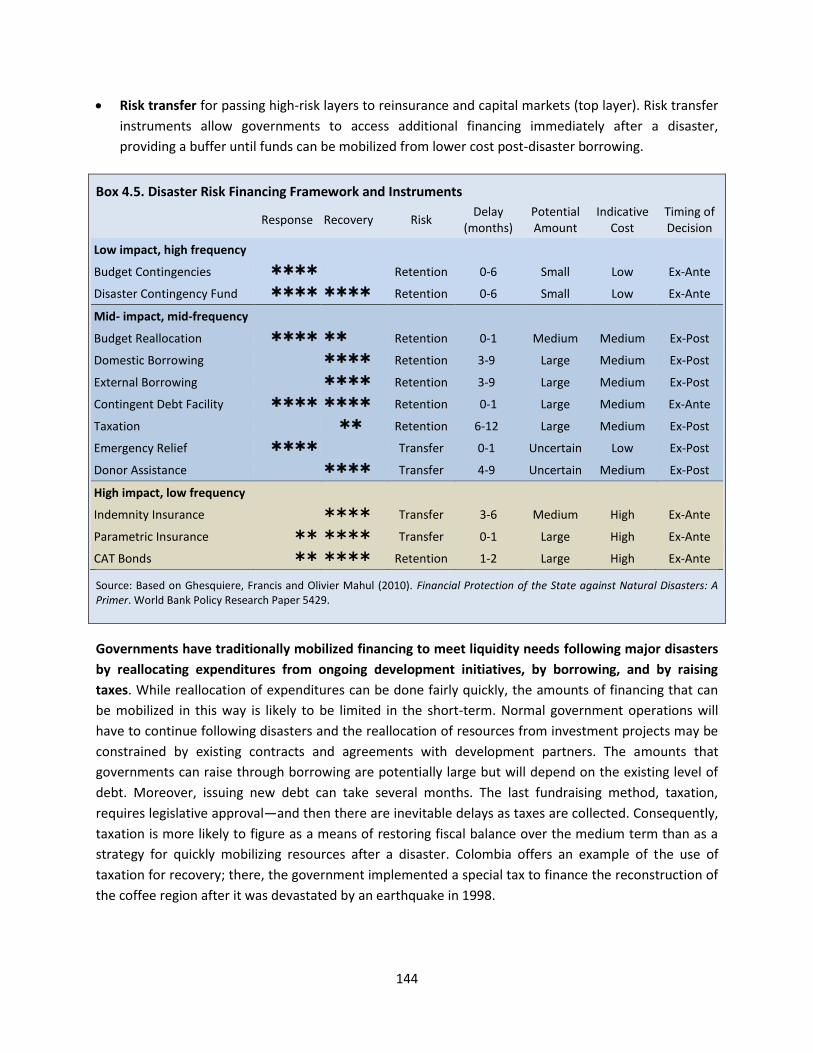
144
Risk transfer for passing high-risk layers to reinsurance and capital markets (top layer). Risk transfer
instruments allow governments to access additional financing immediately after a disaster,
providing a buffer until funds can be mobilized from lower cost post-disaster borrowing.
Box 4.5. Disaster Risk Financing Framework and Instruments
Response Recovery Risk
Delay (months)
Potential Amount
Indicative Cost
Timing of Decision
Low impact, high frequency
Budget Contingencies Retention 0-6 Small Low Ex-Ante
Disaster Contingency Fund Retention 0-6 Small Low Ex-Ante
Mid- impact, mid-frequency
Budget Reallocation Retention 0-1 Medium Medium Ex-Post
Domestic Borrowing Retention 3-9 Large Medium Ex-Post
External Borrowing Retention 3-9 Large Medium Ex-Post
Contingent Debt Facility Retention 0-1 Large Medium Ex-Ante
Taxation Retention 6-12 Large Medium Ex-Post
Emergency Relief Transfer 0-1 Uncertain Low Ex-Post
Donor Assistance Transfer 4-9 Uncertain Medium Ex-Post
High impact, low frequency
Indemnity Insurance Transfer 3-6 Medium High Ex-Ante
Parametric Insurance Transfer 0-1 Large High Ex-Ante
CAT Bonds Retention 1-2 Large High Ex-Ante
Source: Based on Ghesquiere, Francis and Olivier Mahul (2010). Financial Protection of the State against Natural Disasters: A Primer. World Bank Policy Research Paper 5429.
Governments have traditionally mobilized financing to meet liquidity needs following major disasters
by reallocating expenditures from ongoing development initiatives, by borrowing, and by raising
taxes. While reallocation of expenditures can be done fairly quickly, the amounts of financing that can
be mobilized in this way is likely to be limited in the short-term. Normal government operations will
have to continue following disasters and the reallocation of resources from investment projects may be
constrained by existing contracts and agreements with development partners. The amounts that
governments can raise through borrowing are potentially large but will depend on the existing level of
debt. Moreover, issuing new debt can take several months. The last fundraising method, taxation,
requires legislative approval—and then there are inevitable delays as taxes are collected. Consequently,
taxation is more likely to figure as a means of restoring fiscal balance over the medium term than as a
strategy for quickly mobilizing resources after a disaster. Colombia offers an example of the use of
taxation for recovery; there, the government implemented a special tax to finance the reconstruction of
the coffee region after it was devastated by an earthquake in 1998.

145
Contingency budgets have traditionally been the principal means used by governments as provisions
for disasters and other unforeseen events (see Box 4.6 for one example). Commercial contingent
financing and insurance products tend to be prohibitively expensive for governments. In recent years,
however, multilateral development banks have introduced a range of contingent financing and risk
transfer products to meet the needs of developing countries.
Box 4.6. FONDEN, Mexico’s Fund for Natural Disasters
FONDEN, Mexico’s Fund for Natural Disasters, was established as a mechanism to support rapid rehabilition of federal and state infrastructure after hazard events. The program was first created in 1996 as a budget line in the federal expenditure budget, and became operational in 1999.
Originally FONDEN funds were targeted toward reconstruction and rehabilitation of (1) federal, state, and municipal public infrastructure; (2) low-income housing; and (3) environmental areas (such as forests and lagoons). This is still the primary FONDEN program. A secondary portion of FONDEN, called FOPREDEN Program for Prevention, was introduced in the early 2000s. This program promotes ex-ante DRM through funding of risk asssment, risk reduction, and disaster prevention capacity building.
Fiduciary responsibility for the financial accounts of both programs lie with Mexico’s state-owned development bank, BANOBRAS.Funding for the programs, however, still comes directly from the federal budget, as federal law requires that at least 0.4 percent of the annual federal budget be devoted to FONDEN, FOPREDEN, and the Agricultural Fund for Natural Disasters.
Source: Global Facility for Disaster Reduction and Recovery, World Bank (2012). Mexico’s Natural Disaster Fund—A Review.
Budgets can include a general contingency appropriation to cover unforeseen costs without relying on
reallocation of resources from other priorities or legislative approval for supplementary
appropriations. General contingency appropriations are usually around three percent of total
expenditure, ranging from 0.05 percent of expenditures in Japan to five percent in Armenia, France, and
Nigeria. (Limits on contingency appropriations may also be fixed in terms of projected revenues or GDP.)
General contingency budgets typically address a wide range of risks aside from disasters, including
provisioning for shortfalls in revenues, expenditures arising from new legislation, financing for
guarantees, and other liabilities.
Some countries include specific contingency budgets for disasters. These budgets lay out how
responsibility for disaster risk management should be shared between central and local governments.
The risk of moral hazard exists when the availability of funding for disaster response from the central
government discourages local governments from making adequate provisions. To address this,
legislation establishing disaster contingency budgets generally requires local government to co-finance
disaster response and recovery. Moreover, such legislation usually limits central government financing
to cases where the response is beyond the capacity of local authorities. Most countries also require local
authorities to establish contingency funds of their own. In the Philippines, for example, local authority
contingency funds are mandated at five percent of revenues. Vietnam has a similar requirement. Some
countries also provide specific funds to co-finance–and thereby create incentives for–local disaster
preparedness efforts. Central government disaster contingency funds are generally financed through
appropriations as part of the budget process. In the U.S., for example, appropriations are based on a 5-
year moving average of fund disbursements. Supplementary appropriations are sought when additional

146
funds are needed to deal with major disasters. In India, the CRF appropriation is based on a 10-year
average and funds are released upon a request by local authorities. Funding is usually provided on a co-
financing basis, either at flat rate or, as in Canada, on a sliding scale with the central government
absorbing a larger share of higher intensity events.250
Procedures for post-disaster budgeting, budget execution, and procurement will usually be laid out in
legislation and supporting regulations. This may be in the form of specific emergency powers legislation
or as references in budget framework laws that remove administrative constraints that would impede
timely disaster response and recovery. These measures have to be balanced against the need to
maintain adequate expenditure control and accountability. Typically, this entails provisions strictly
limiting the scope and duration of emergency powers. Emergency powers may include:
Authority for budget holders to reallocate funds between budget categories, or reassign staff and
financial resources toward disaster response pending the approval of supplementary budgets.
Streamlined procedures for the preparation of supplementary budgets and approval of
supplementary appropriations by the legislature.
Relaxation of the duration of market consultation for procurement, including provision for shopping
and direct contracting during the immediate post-disaster period.
Accelerated procedures for customs clearance for goods and equipment required for emergency
response and recovery efforts.
Clarity on the policy framework for post-disaster recovery and reconstruction facilitates timely and
effective interventions when disasters occur and improves accountability. Safety nets should be
designed before disasters strike, with flexible financing and contingent targeting, so they can be rapidly
expanded to provide assistance following a disaster. For example, the Productive Safety Net in Ethiopia
combines permanent social assistance, a longer-term workfare program targeted at six million food-
insecure households, and scalable safety nets that can be rapidly expanded to help millions during a
drought.251 Policies can also be put in place to guide recovery and reconstruction efforts (e.g., by laying
out the criteria and procedures for allocation of funds after disasters).
Ex-post financing leaves the government exposed to potentially huge financial liabilities. The
opportunity cost of diverting resources from development to disaster recovery and reconstruction is a
reduction in the credit available to the private sector at precisely the time when it needs to finance its
own recovery and reconstruction activities. Ex-post financing also leaves the government exposed to
substantial liabilities when low frequency, high impact events occur. Following these events, the
government may not be able to borrow enough to meet immediate needs, or may do so on such a scale
or at such unfavorable rates that it undermines fiscal sustainability. International disaster relief may
250
Organization of American States (2010). Caribbean Emergency Legislation Project: Improving the Legal and Institutional Framework Related to State of Emergency. 251
Pelham, Larissa et al (2011). Natural Disasters: What is the Role for Social Safety Nets? World Bank Social Protection Discussion Paper No. 1102.

147
relieve part of the burden, as may external financing of recovery and reconstruction activities. But these
sources are uncertain and development financing for recovery and reconstruction may take months to
materialize. Besides, donors’ contributions are often modest in relation to needs: OECD DAC data for the
period 1990-2003 suggest that development assistance and humanitarian relief, though increasing,
usually offsets less than 10 percent of developing countries’ disaster losses in any given year.252.
Contingent debt facilities, which disburse once a specific condition, such as a disaster, is met, are
intended to secure timely access to funds in a post-disaster period. In contrast to insurance products,
which transfer risk, contingent debt facilities simply ensure that funding will be available should it be
needed. The entity guaranteeing access to funds generally requires payment of a commitment fee.
When funds are disbursed, the draw down becomes debt, which has to be repaid according to the terms
of the credit agreement. Commercially available contingent debt facilities are usually too expensive for
governments. In order to help the countries to repay this debt, the World Bank now offers a
Development Policy Loan with Catastrophe Risk Deferred Drawdown Option (DPL with CAT DDO) for
IBRD-eligible countries. The instrument is designed to provide bridge financing while other sources of
funding are being mobilized. In order to access the contingent credit, countries must show that they
have engaged in a comprehensive disaster management program. This addresses potential moral hazard
in financing disaster recovery. First introduced in 2008, as of the end of FY 2012 the World Bank had
approved eight CAT credits with a total value of $1.27 billion and disbursed $814 million in contingent
credits.
Governments are increasingly turning to risk transfer instruments to manage liabilities and short-term
liquidity needs arising from high impact, low frequency events. Risks are transferred through insurance
and related products. Economic theory suggests that governments should behave as if they are
indifferent to risk. A risk-neutral entity should purchase insurance only if the premium is lower than the
probability times the expected loss. This leaves no margin for the costs of a commercial insurer. It is thus
cheaper for governments to finance their post-disaster liabilities directly through borrowing and
taxation than to purchase commercial insurance. However, governments may be risk adverse when the
potential impact of disasters is large relative to the economy. Small island states, for example, may be
risk averse, as are countries exposed to disasters with national impact (e.g., droughts and cyclones).
These governments may be prepared to bear the costs of insurance in order to have timely access to
financing in case of disasters.
Commercial indemnity insurance has been used on a limited scale in the public sector, usually where
governments require managers of public assets to insure these assets against loss or damage. Mexico,
for example, requires all federal, state, and local agencies to insure public buildings. Another example,
from Turkey, is illustrated in Box 4.7. Indemnity insurance pays the insured the approved cost of repair
or the depreciated cost of an asset. Commercial indemnity insurance products are expensive,
particularly when purchased on a retail basis. In some countries, government consolidates this insurance
through a public insurance company. However, government-financed indemnity insurance can only
protect public assets, not contingent liabilities arising from the losses incurred by the third parties.
252
Cummins and Mahul (2009).

148
Box 4.7. Turkish Catastrophe Insurance Pool
Approximately 70 percent of Turkey’s population and 75 percent of its industrial facilities are exposed to large-scale earthquakes. However, only about three percent of residential buildings purchased earthquake insurance, because households relied on the government to fund private property reconstruction for major natural disasters. This imposed a large burden on government budgets during catastrophes (when damages frequently exceed $5 billion).
To address this problem, the Turkish government mandated compulsory earthquake insurance for all residential buildings constructed on registered urban land. In conjunction, the World Bank worked with Turkey to create the Turkish Catastrophe Insurance Pool (TCIP), which provides earthquake insurance coverage to small and medium businesses and to homeowners. Premium rates are actuarially sound and unsubsidized. Pooling across the entire country allows for economies of scale that results in more affordable premiums.
TCIP’s risk financing strategy is based on risk retention as well as reinsurance:
Risk retention. TCIP retains the first $80 million in losses through its own reserves.
Reinsurance. Losses beyond the first $80 million are transferred to international reinsurance markets.
TCIP can currently withstand damages resulting from a 1-in-350 year earthquake. The Turkish government covers any losses exceeding TCIP’s claims-paying capacity.
Source: Global Facility forDisaster Reduction and Recovery, The World Bank (2011). Turkish Catastrophe Insurance Pool: Providing Affordable Earthquake Risk Insurance.
Recent innovations include the development of parametric insurance and regional risk pooling. In
contrast to indemnity insurance, which requires loss assessments that increase administrative costs and
cause delays in payouts, parametric insurance pays out immediately when an objectively measurable
event occurs (e.g., a specific wind speed, level of rainfall, or severity of earthquake). Careful modeling is
needed to ensure that the scale of the event is proportional to the scale of the losses. There remains a
residual “basis risk” whereby losses are incurred even though the measured event does not trigger a
Box 4.8. The Caribbean Catastrophe Risk Insurance Facility
The Caribbean Catastrophe Risk Insurance Facility (CCRIF) was established in June 2007 to provide Caribbean island states with access to immediate liquidity in the aftermath of a disaster. It operates by allowing member countries to collectively purchase parametric insurance. Donors provided $67 million in start-up capital. The 16 member governments contributed $22 million. Governments’ premiums for $450 million in parametric insurance coverage amounted to about $20 million. CCRIF retains responsibility for the first $20 million of payouts (backed by its capital) and transfers the remaining exposure through reinsurance and catastrophe swaps intermediated by the World Bank.
CCRIF payouts are proportional to the estimated fiscal impact of an event. Estimates are based on a probabilistic catastrophe risk model developed specifically for CCRIF. Countries pay an annual premium based on their specific risk exposure and, upon the occurrence of a trigger event, receive compensation based on the level of coverage set in the insurance contract. By the end of 2013, CCRIF had made eight payouts totaling $32.2 million to seven member governments following earthquakes and tropical cyclones. Its success helped catalyze the formation of a regional catastrophe risk pool in the Pacific and informed discussions among Indian Ocean island countries regarding disaster risk financing.
Sources: CCRIF website: http://www.ccrif.org.; GFDRR (2011). Caribbean Catastrophe Risk Insurance Facility (CCRIF): Pooling Risk to Protect Against Natural Disasters; and CCRIF (2011). Annual Report 2010-2011.

149
payout, or conversely a payout is triggered even though the insured suffers no losses. Risk pooling draws
on commercial insurance practices that seek to protect individual companies against the liabilities
arising from catastrophic events. By offering coverage as a group, companies can spread losses among
all members, thereby protecting individual members of the risk pool from massive claims. Multilateral
development banks have been able to facilitate risk pooling for member countries. The World Bank
facilitated the establishment of the Caribbean Catastrophe Risk Insurance Facility in 2007; it was the first
multi-country risk pooling facility (Box 4.8). Since then, a number of other regional initiatives have been
launched.
Box 4.9. Event-Based Risk Transfer Products in Mexico and Malawi
Two prominent innovations in event-based risk transfer products include CAT bonds and weather derivative contracts.
Mexican CAT Bonds
Mexico issued its first catastrophe (CAT) bonds in 2006 to provide liquid funds immediately in the event of a major disaster. CAT bonds are structured as reinsurance contracts between the party seeking protection and a special purpose vehicle (SPV). The SPV obtains the capital necessary to underwrite the reinsurance contract by selling a bond to capital market investors, such as pension and hedge funds. Since the debt is held by the SPV, the bond is not considered government debt. Investors are compensated by receiving a spread above the risk-free interest rate. As with parametric insurance, payouts are triggered by specific events. Bonds typically have maturities of 3-5 years. Mexico renewed its CAT bond in 2009 under the MultiCat Mexico program and expanded coverage to include additional cyclone risks. It renewed in October 2012 for three more years, again under MultiCat Mexico. The 2012 program bond was also expanded to include some other earthquake and hurricane events. As of the end of 2013, no payments had been made. Malawi Weather Derivative Contract
Weather derivatives are financial contracts based on underlying weather indices, and are used to transfer the risk of severe weather events to international markets. In Malawi, where droughts risk is severe, the government purchased a weather derivative contract based on an index that accounts for daily rainfall during the country’s agricultural season. The contract’s maximum payout was $4.385 million. It was designed to give the government more flexibility in drought planning and response by helping the government to quickly and reliably access contingency funds in the case of a contractually specified catastrophic shortfall in precipitation during the agricultural season. The counterparty to this transaction was the World Bank Treasury, and the premium was paid for by the UK Department for International Development (DfID). The Malawi government first purchased this contract for the 2008/2009 agricultural season; it was renewed three times through 2010/2011. The trigger rainfall level was not reached, so there was no payout in any of the four years.
Sources: Government of Mexico (2012). Disaster Risk Management in Mexico: from response to risk transfer, pp. 211-221 in G20 (2012). Improving the Assessment of Disaster Risks to Strengthen Financial Resilience: A Special Joint G20 Publication by the Government of Mexico and the World Bank; World Bank Treasury (2011). MultiCat Program Product Note; Syroka, Joanana and Nucifora, Antonio (2010). National Drought Insurance for Malawi. World Bank Policy Research Working Paper 5169; Clarke, Daniel (2012). Cost-Benefit Analysis of the African Risk Capacity Facility: Malawi Country Case Study; Dana, Julie (2010). Brief on Drought Risk Management work in Malawi-2005-2010; Conversations with Oscar Ishizawa, Julie Dana, and Daniel Clarke.
Event-based products have also been developed to transfer risks to capital and insurance markets.
Box 4.9 lists two examples. There is considerable potential for further innovation in the use of these
market-based financing products.253
253
For an overview of market-based financial products, see Cummins, David and Olivier Mahul (2009). Catastrophe Risk Financing in Developing Countries: Principles for Public Intervention, World Bank; and Swiss Reinsurance Company. Ltd. and

150
4.6. RESILIENT RECONSTRUCTION
In the immediate aftermath of disasters, the priority of disaster response is to secure access to the
affected population and make sure their basic needs are met. As disaster relief transitions to
reconstruction, attention shifts to the restoration of pre-disaster livelihoods and living conditions.
Reconstruction includes rebuilding damaged and destroyed infrastructure. Reconstruction ultimately
blends into longer-term development interventions.
Choices have to be made in allocating public funds between households, businesses, and public
infrastructure. Public sector recovery efforts will typically include three elements: direct and in-kind
transfers to the affected population to meet subsistence needs; transfers to households and the private
sector to support their recovery efforts and contribute to the restoration of destroyed or damaged
assets (such as housing and businesses); and the reconstruction or replacement of damaged public
infrastructure. Typically, transfers to households and businesses do not fully compensate for their
losses, so households, communities, and the private sector bear much of the burden of recovery.
Inevitably there will be competition for resources allocated toward transfers, and in the choice of which
public infrastructure to rebuild. Studies from both developing and developed countries confirm that
both the amount of spending and the distribution of benefits are strongly influenced by political
considerations. Relief and recovery efforts focus on disasters where there is media attention, an election
cycle, and where those affected both vote and have political voice (i.e., the non-poor generally tend to
receive the greatest share of benefits).254
Clear institutional arrangements for disaster recovery and reconstruction facilitate planning and
response. =Responsibility will typically be shared between central and local governments and between
specialized civil disaster relief agencies and institutions responsible for routine government functions.
Clarity in responsibilities creates incentives for institutions to take adequate steps for disaster
prevention and preparedness. In some countries, such as Australia and India, responsibility for disaster
response is given to state and local government. Federal authorities reimburse local authorities for part
of their expenses incurred in disaster relief.255 In others, such as Honduras, a central disaster relief
agency serves as a coordinating body, working with emergency committees at the regional and local
levels.
The response to high-intensity disasters is shaped by post-disaster needs assessments. Where
governments intend to seek international support for their recovery efforts, post-disaster needs
assessments (PDNA) are usually undertaken in collaboration with international agencies. PDNAs are led
and owned by national authorities and supported by a multi-agency team comprising the World Bank,
the Global Facility for Disaster Reduction and Recovery (GFDRR), UN agencies, and other relevant
stakeholders. Assessments follow a standardized methodology, reporting the following:
Inter-American Development Bank (2011). Natural Disasters Financial Risk Management: Technical and Policy Underpinnings for the Use of Disaster-linked Financial Products in Latin America and the Caribbean. 254
World Bank and United Nations (2010). Natural Hazards, UnNatural Disasters: The Economics of Effective Prevention. 255
Attorney General’s Office, Government of Australia (2011). Natural Disaster Relief and Recovery Arrangements.
151
Damage, loss, and macroeconomic impacts;
Impacts on livelihoods and human development;
Short, medium, and long-term recovery and reconstruction needs;
Measures addressing disaster risk reduction in post-disaster recovery and reconstruction plans.256
While damage assessments provide a starting point for recovery and reconstruction planning, they are not necessarily a guide to actual costs or resource allocations. Planners will need to decide whether, when, and how to rebuild.
International practice favors the use of existing government structures for post-disaster recovery and
reconstruction planning and management. Immediate disaster relief and longer-term recovery and
reconstruction efforts require different technical skills, management skills, and institutional
arrangements. Relief efforts are organized and implemented by specialized civil defense or
humanitarian agencies, working with international relief agencies and nongovernmental organizations.
External financing for these activities is rarely channeled through government since assistance is
provided in-kind. As disaster relief transitions to disaster recovery, responsibility for planning and
implementation generally passes to the central planning and finance agencies, sector agencies, and local
government. While development agencies and nongovernmental organizations may continue to provide
funding and implement projects directly, an increasing share of financing will flow through development
assistance modalities and the government’s own budget.
Where there is a major national disaster, the area impacted is remote or local capacity is particularly
weak, national authorities may establish dedicated agencies or coordinating bodies to manage the
recovery and reconstruction process. The functions of these bodies vary: in some cases they are
responsible for planning and coordination of the national and international reconstruction efforts, in
others their responsibilities extend to implementation of reconstruction projects. For example, the
Haitian government created the Interim Haiti Recovery Commission (IHRC), a joint Haitian-international
entity, to coordinate donors, conduct strategic planning and approve reconstruction projects. In
contrast, in Indonesia, the Badan Rehabilitasi dan Rekonstruksi (BRR), or Agency for the Rehabilitation
and Reconstruction of Aceh and Nias, not only coordinated actors and projects but also implemented
recovery and reconstruction activities. While more specialized reconstruction agencies may be able to
accelerate the pace of reconstruction through the use of streamlined procedures and dedicated
capacity, there is a risk that their activities are poorly coordinated with central agencies and local
government responsible for longer term development257.
Government agencies generally respond to disasters by adjusting existing plans and budgets. While
there may be limited discretionary resources in the recurrent budget, staff and program activities can
often be shifted to the areas affected by disasters. Similarly, funding for new infrastructure can be 256
For more information on the tools and methodology for the damage, loss and needs assessment, see http://www.gfdrr.org/gfdrr/Track-III-TA-Tools. For detailed guidance on damage assessment, see UN-ECLAC (2003). Handbook for Estimating the Socio-economic and Environmental Effects of Disasters. 257
Fengler, Wolfgang et al (2008). Managing Post-Disaster Reconstruction Finance: International Experience in Public Financial Management. World Bank Policy Research Working Paper 4475.

152
shifted to rehabilitation. Procurement can be expedited by extending existing work contracts. The World
Bank and other donors commonly undertake portfolio reviews following disasters, restructuring projects
so that they can meet recovery and rehabilitation needs under existing financing agreements and front-
loading disbursements. This is often the quickest way to respond to short-term needs. While
reallocation of resources may come at the expense of future development, these opportunity costs can
be minimized by careful prioritization (.g., reallocating funds from development projects disrupted by
the disaster).258
Specific arrangements may have to be put in place to monitor and channel external financing. A
sudden increase in the number of international agencies operating in post-disaster situations, often
providing services in kind which are not recorded through the government’s budget process, make
monitoring particularly difficult. In Aceh and Nias, for instance, more than 300 institutions managed
1,500 projects as part of the 2004 tsunami recovery and reconstruction program. Some countries have
tried to consolidate external funding through multi-donor trust funds, either managed by national
authorities or, more frequently, by an international agency such as the World Bank or the UN (e.g., Haiti
in 2011).259 These arrangements facilitate coordination and monitoring and tend to improve
transparency of reconstruction efforts simply by consolidating information. Even when the majority of
funding is centralized, however, international organizations and nongovernmental organizations
continue to play an important role since they contribute additional capacity for project implementation.
Civil society engagement strengthens accountability in post-disaster reconstruction spending and can
facilitate program implementation (Box 4.10). An important part of this accountability framework is
ensuring that citizens and communities are informed of their rights and have adequate grievance
redress mechanisms.260 In Pakistan, for example, the Omar Asghar Khan Development Foundation
worked with communities to document mismanagement of earthquake reconstruction funds and used
this information to promote timely release of funds and accelerate reconstruction.261 Recovery and
reconstruction programs increasingly include social accountability mechanisms as part of the design of
decision-making, monitoring, and evaluation systems.
258
Benson, C. and Clay, E. (2004). Understanding the Economic and Financial Impacts of Natural Disasters. World Bank Disaster Risk Management Series. 259
Global Humanitarian Assistance (2011). Pooled Funding Mechanisms and Large-Scale Disasters: Case Studies of Haiti and Pakistan. For rationale for MDTFs, see Leonie Guder (2009). Multi-Donor Trust Funds: Instruments of first choice for post-crisis situations?. 260
The Humanitarian Accountability Partnership (2010). The 2010 HAP Standard in Accountability and Quality Management Standards Principles . 261
The Budget Transparency Initiative, World Bank (2013). Global Stock-Take of Social Accountability Initiatives for Budget Transparency and Monitoring.

153
Box 4.10. Post-Disaster Reconstruction: Lessons from Hurricane Mitch
Hurricane Mitch struck Honduras in October 1998, resulting in 5,750 deaths, nearly half a million displaced persons, and economic losses of about $4 billion (equivalent to 40 percent of GDP). Agricultural losses amounted to 70-80 percent of production. Following an international relief effort, development agencies pledged $2.7 billion for reconstruction in May 1999. A 2004 evaluation of these reconstruction efforts highlighted a number of lessons.
While existing development plans may need to be reviewed following a disaster, they should be the starting point for any recovery effort. Key elements of complementary post-disaster recovery planning include clear criteria identifying who should benefit from post-emergency assistance and deciding whether to opt for interim or permanent solutions.
Coordination and harmonization help reduce duplication and transaction costs and strengthen national control over decision making. Clear priorities for the allocation of external resources and selectivity in the kind of assistance to accept provide a framework for coordination (the “all aid is welcome” approach that followed Mitch led to a supply-driven response). Proposed measures for strengthening harmonization include joint financing for major reconstruction projects; establishing joint donor-government monitoring and control units; using flexible instruments during post-emergency phase; and avoiding time limitations on the application of recovery funds, since recovery projects may take longer than expected to implement.
Municipal and community participation is critical to effective recovery efforts. Mayors and community leaders were often able to provide practical assistance and guide relief and reconstruction efforts so that they met locally identified needs. Local authorities can respond quickly and mobilize participation. Support to and participation of local authorities and community organizations are indispensable elements in priority setting, monitoring, accountability, and financial control. Continuity of support through recovery and back to development helps strengthen local capacity, bringing longer-term benefits.
Measures are needed to ensure that recovery assistance is provided in a fair, transparent, and balanced manner. The public should be aware of recovery program entitlements and procedures for accessing support. This should be complemented by social monitoring and audit of recovery efforts.
Source: World Bank (2004). Learning Lessons from Disaster Recovery: The Case of Honduras. Hazard Management Unit Working Paper Series N0.8.

154
CHAPTER 5. INTERNATIONAL PUBLIC CLIMATE FINANCE
5.1. CHAPTER SUMMARY
This chapter reviews the emerging trends in international public climate finance and their implications
for policy and institutional arrangements in developing countries. It provides an overview of major
UN-organized funding sources as well as non-UN instruments (such as the Climate Investment Fund).
Market-based instruments are also discussed. By and large, international climate finance sources are
designed to be accessed by governments rather than directly by private enterprises’. Having a good
understanding of the existing sources can thus benefit public financial management. While this chapter
aims at providing such understanding, it does not provide guidance on how to access these funds.
There is no single internationally accepted definition of climate finance. In this publication, climate
finance is defined as capital flows that target low-carbon and climate-resilient development with
direct or indirect greenhouse gas mitigation or adaptation objectives. This definition is accepted by
several international organizations that have done much to advance global understanding of the subject,
including the OECD, the World Bank262 and other multilateral development banks (MDBs), and the
international research body Climate Policy Initiative (CPI). The data estimates below are based on this
definition. The guidelines for what counts as mitigation and adaptation are also generally agreed upon
by these groups.263
International public climate finance instruments described here include (1) UNFCCC financing
mechanisms, uses the following mechanisms, (2) finacing outcide of the UNFCCC, (3) climate change
related development assistance and (4) market based climate finance.
1. UNFCCC financing mechanisms include the following:
Global Environmental Facility (GEF). In terms of its role for the UNFCCC specifically, the GEF has
responsibilities for the implementation of Article 11 of the Convention stipulating “the provision of
financial resources on a grant or concessional basis, including for the transfer of technology.
The Least Developed Countries Fund (LDCF) and the Special Climate Change Fund (SCCF) were
established under UNFCCC in 2001, both with a priority to finance climate change adaptation.
The Adaptation Fund was established to finance projects and programs in developing
countries that are parties to the Kyoto Protocol.
The UNFCCC is setting up a new Green Climate Fund (GCF) through which it expects to channel
a large share of future climate finance for developing countries.264 The Green Climate Fund will adopt a
country-driven approach encouraging the participation of relevant stakeholders, including vulnerable
groups, and addressing gender concerns.
262
The World Bank Group is a member of the Joint MDB Tracking Effort on Climate Finance which has been instrumental in forging common norms. 263
Climate Policy Initiative (CPI) (2013). The Global Landscape of Climate Finance. 264
See UNFCCC Decision 3/CP.17 FCCC/CP/2011/9/Add.1.

155
2. A major part of public climate finance is provided through multilateral and bilateral funds operating
outside the UNFCCC. These funds include the following:
Established in 2008, the Climate Investment Funds (CIF) are a partnership among five major
multilateral development banks, including the World Bank Group. The partnership brings together the
48 countries in which CIF is operating, 14 contributing countries, and other stakeholders to promote
innovative country-led investments in clean technology, renewable energy, sustainable management
of forests and climate-resilient development.
Multilateral climate funds also include programs aimed at Reducing Emissions from
Deforestation and Forest Degradation plus conservation (REDD+). REDD+ is an international process
under the UNFCCC that seeks to avoid further deforestation and enhance carbon sinks.
Bilateral funds are likely to evolve as important sources of climate finance in the future. To
date, many of the bilateral funds channel their resources through multilateral climate funds (e.g., CIF,
UN REDD, and PCPF).
3. Climate change-related development assistance. Beyond UNFCCC mechanisms and non-UNFCCC
climate funds, developed country governments provide international climate finance through their
general development assistance programs. Roughly half of public climate finance is channeled this way,
with most of this from the MDB core resources and program budgets of bilateral development agencies
(e.g., U.S. AID, AfD).
4. Market-based mechanisms currently exist for tradable carbon credits, which facilitates financing for
mitigation projects. The Kyoto Protocol under UNFCCC establishes the framework for market
mechanisms that supports developed countries’ efforts to limit or reduce greenhouse gas emissions.
The purpose of the national carbon markets is to facilitate the efficient distribution of mitigation efforts
within national economies. Under an Emissions Trading Scheme (ETS), emitters are given emissions
allowances, and they can adjust their operations to these limits by adopting low-carbon means of
production, by purchasing allowances, or by purchasing carbon credits/offsets from others.
Future financial support under UNFCCC for mitigation and adaptation actions will be subject to new
monitoring, reporting, and verification (MRV) requirements that are still under development. The
MRV framework is expected to link to the reporting arrangements for financial contributions from
developed countries. While MDBs, donor governments, and research bodies have been working in
parallel to harmonize their measurement of climate finance flows, there is yet to be agreement at the
UNFCCC on a MRV framework. Whatever the eventual MRV requirements for climate finance,
developing countries should endeavor to have compatible national systems for reporting on mitigation
and adaptation projects. At a minimum, authorities will need a more systematic and centralized tracking
system than is currently in place in many recipient countries.
This chapter is divided into three sections. Section 5.1 presents an overview of the international
architecture of public climate finance, distinguishing mechanisms established under the UNFCCC,

156
climate finance from multilateral and bilateral sources, and general development financing with climate
change elements (i.e., climate-related development assistance). Section 5.2 examines market-based
mechanisms for climate finance, including mechanisms established under the UNFCCC and carbon
markets and payments for environmental services. Section 5.3 addresses the implications of the
emerging international architecture for developing countries’ policies and for the institutional
arrangements they are creating for managing climate change finance.
5.2. PUBLIC CLIMATE FINANCE: AN OVERVIEW
This section provides a brief overview of the emerging architecture of international public climate
finance. It reviews the global funds established under the UNFCCC and non-UNFCCC funding initiatives
for climate change established with multilateral or bilateral support. The section identifies broad trends
in the structure of public climate finance and seeks to familiarize readers with the principal climate
change funds. The purpose here is not to provide guidance on how to access these funds. Readers
seeking such guidance should refer to the joint World Bank and UNDP Climate Finance Options Platform
website, which provides up-to-date information on international funding sources.265
Public Climate Finance Flows
When developed countries provide climate finance to developing countries, the funds originate
mostly from the public sector and tend to be passed through multilateral structures or bilateral
finance institutions. Developed countries provide $39-63 billion annually in climate finance to
developing countries. This funding comes through three sources. The first and largest source is
governments, and this funding is channeled through MDBs and bilateral finance organizations; it
amounts to about $35-49 billion. The second, smaller source is also governments, and this funding
channeled through UN organizations and bilateral aid agencies; it amounts to approximately $4-11
billion. The third and smallest source, from non-UN climate funds, amounts to roughly $1.4 billion.266 It is
important for developing countries to be familiar with multilateral and bilateral institutions
intermediating these funding flows.
To put these funding numbers into perspective, note that global climate financing totaled $359 billion
in 2012. Breaking this down by origin shows that 61 percent, or $218 billion, came from OECD
countries and 39 percent, or $141 billion, originated in non-OECD countries (Figure 5.1). Breaking the
total down by destination reveals that 49 percent, or $177 billion, was channeled to OECD countries and
51 percent, or $182 billion, to non-OECD countries. Figure 5.1 also shows that approximately 76.5
percent of the total climate funding received by non-OECD countries originated from non-OECD states.
Of this, 71% is spending by a non-OECD country within its own borders, while the remaining funding
flows between non-OECD states. On the other hand, roughly 23.5 percent of climate funding received by
non-OECD states, or $43 billion, came from developed countries. This smaller but still significant part of
climate financing—from developed to developing countries (which is mostly public sector funding
channeled through international structures)—is the subject of this chapter.
265
See the joint World Bank and UNDP Climate Finance Options website: http://www.climatefinanceoptions.org/cfo/index.php. 266
Ibid.

157
Figure 5.1. Climate Finance Flows between OECD and non-OECD Countries by Origin and Destination
Source: Climate Policy Initiative (CPI) (2013). The Global Landscape of Climate Finance. A CPI Report.
Public climate finance should not be associated solely with public works and government programs.
Globally, as much as one-third of the funding is in profit-generating projects. There is also evidence
that, on average, a government’s direct investment is made in conjunction with a more sizeable amount
of private financing. The “public” role in promoting climate finance therefore has much to do with
financial mobilization and is wider in scope than policy making and regulations. This financial
mobilization is often accomplished through direct investment. Data shows that, globally in 2012, $135
billion in climate finance came from public sources, of which slightly over one quarter (about $37 billion)
was put into private investments, including renewable energy and sustainable transport that generate a
commercial return. In many instances the public sector was not a majority owner of the private
investment structures and private financing is still dominant.267
Private owners of capital have also become a new and important source of global climate finance. In
2012, private sources of capital provided $224 billion, or 62 percent, of total global climate financing.
Most of this occurred in developed countries. Thus, while there is no shortage of private sector interest
or private capital, this has yet to benefit developing countries in a significant way.
267
Ibid.
158
Many discussion papers have approached climate finance from the perspective of the 2010
Copenhagen Accord, where developed countries pledged to provide $100 billion a year in financing to
developing countries by 2020. This figure of $100 billion has become a focus of subsequent UNFCCC
negotiations and is an important symbol of commitment by developed countries. It has also created
divisions between developed and developing countries, however, over what sources or forms of
financing should count toward this figure. The divisions have overshadowed some useful lessons (e.g.,
FastStart financing), and financing trends. Moreover the long-term requirements of climate finance are
estimated to far exceed $100 billion, and policy makers and financial planners would do well to look
beyond this figure. The intent of this sourcebook is to facilitate financial management and planning for
those long term needs (i.e., beyond the Copenhagen Accord target).
At the same time, policy makers and financial planners cannot afford to disregard developments at
the UNFCCC and negotiated outcomes. The UNFCCC is the body that must reconcile the different views
on how the financing burden is to be shared among countries, informed by economic, equity, and
ethical considerations. The manner in which this is eventually resolved will have a major influence on
the design of future financing instruments, whether within the UN system or outside. Finance ministries
must pay attention to these developments.
UNFCCC Financial Mechanisms
The Global Environment Facility (GEF) was established to provide grants and concessional funding to
cover the incremental costs associated with projects that generate global environmental benefits in
addition to national and local benefits. The GEF serves as a financial mechanism for the three Rio
Conventions: the United Nations Framework Convention on Climate Change (UNFCCC), the Convention
on Biological Diversity (CBD), and the United Nations Convention to Combat Desertification (UNCCD). In
terms of its role for the UNFCCC specifically, the GEF has responsibilities for the implementation of
Article 11 of the Convention stipulating “the provision of financial resources on a grant or concessional
basis, including for the transfer of technology.”268 As one of the operational entities of the UNFCCC’s
financial mechanism, the GEF functions under the guidance of, and is accountable to, the UNFCCC
Conference of Parties, which provides guidance on its policies, program priorities, and funding eligibility
criteria.269 Financing from the GEF Trust Fund (the main trust fund managed by the GEF) is provided
within a four year programming cycle, with the total level of financing available determined by
replenishments. GEF Trust Fund financing for climate change has been focused on climate change
mitigation efforts. For the GEF fifth replenishment (GEF-5) period (from July 2010 through June 2014),
26 donor countries committed $1.36 billion for the GEF’s climate change focal area. For the GEF sixth
replenishment period, donors committed $1.26 billion to this focal area. The GEF concluded its fifth
cycle of programming in June 2014. Between 1994 and 2012, the GEF delivered $2.7 billion from the GEF
Trust Fund to 746 climate change projects, almost all of which was for climate mitigation.270
268
GEF also has discrete funding windows for the other Rio Conventions on Biodiversity and Desertification. See http://unfccc.int/resource/docs/convkp/conveng.pdf. 269
For more details, see http://unfccc.int/cooperation_and_support/financial_mechanism/items/2807.php. 270
For a list of these projects, see http://www.thegef.org/gef/project_list.

159
Since 2002, ten multilateral agencies, called the GEF Agencies (including the World Bank, Inter-
American Development Bank, African Development Bank, Asian Development Bank, UNDP, and UNEP)
have been able to access resources to implement GEF projects and are engaged in GEF policy making
processes (known as “corporate activities.) Since 2012, four new GEF Project Agencies have been
accredited to implement GEF projects under the pilot GEF Accreditation Process. These Agencies are:
WWF-US, Conservation International, IUCN and the Development Bank of Southern Africa). GEF Project
Agencies have the same roles and responsibilities as the 10 GEF Agencies, except that they are not
required to undertake and are not compensated for any involvement in GEF corporate activities. The
pilot Accreditation Process to expand the GEF partnership began in 2012 after 16 agencies submitted
Stage I applications. Eleven of these applicant agencies were found to add value to the GEF partnership
and received approval to move on to Stage II of the process which involves the assessment of applicants
for compliance with the GEF's minimum fiduciary as well as environmental and social safeguards
standards, including gender mainstreaming. As of June 2014, 4 of the 11 applicants have received Stage
II approval for accreditation, two have been rejected, and the rest are currently under further review. 271
The Least Developed Countries Fund (LDCF) and the Special Climate Change Fund (SCCF) were
established under UNFCCC in 2001, both with a priority to finance climate change adaptation. The
LDCF has supported the development of national adaptation programs of action in all eligible least
developed countries and has subsequently financed projects identified in these national programs. The
SCCF has a broader mandate with four windows on adaptation, technology transfer, economic
diversification, and projects related to energy, forestry, and agriculture. Subsequent COP guidance has
identified adaptation and technology transfer as priorities for SCCF financing. All non-Annex I countries
are eligible to apply for funding from the SCCF. Since their inception, as at June 30, 2014, the GEF,
through the LDCF, has approved $836 million towards 205 projects in 51 LDCs and, through the SCCF,
$296 million towards 66 projects in 75 countries. As with the GEF Trust Fund, funds are accessed
through accredited implementing agencies.272
The Adaptation Fund was established to finance projects and programs in developing countries that
are parties to the Kyoto Protocol. The Fund, established in 2001 but only launched in 2007, is financed
by the 2-percent levy on the issuance of certified emissions reductions (CERs) that results from projects
under the Kyoto Protocol’s Clean Development Mechanism (CDM). This was expected to provide a more
reliable source of funding than pledges of finance from developed countries. In practice, the
capitalization of the Fund from CER revenue has been less than anticipated due to the declining market
price for CERs. By the end of 2012, the total amount of the Adaptation Fund is between $300 and 500
million. Fund allocation criteria take into account vulnerability, urgency, and risks arising from delay of
action, possible co-benefits, and adaptive capacity.273
271
For more details, see http://www.thegef.org/gef/agencies_accreditation. 272
GEF (2014). Report of the Trustee. 273
See http://www.climatefinanceoptions.org/cfo/node/147.

160
The UNFCCC is setting up a new Green Climate Fund (GCF) through which it expects to channel a large
share of future climate finance for developing countries.274 The Green Climate Fund will adopt a
country-driven approach encouraging the participation of relevant stakeholders, including vulnerable
groups, and addressing gender concerns. Of major importance to policy makers and financial planners is
the UNFCCC’s intention that GCF support national climate change strategies and plans, including
UNFCCC-recognized planning instruments. These include low-emissions development strategies (LEDS),
nationally appropriate mitigation actions (NAMAs), national adaptation plans of action (NAPAs), and
national adaptation plans (NAPs). The GCF is currently working to finalize its business model, and aims to
provide simplified and streamlined access to climate finance through public and private sector facilities.
Other design elements to be finalized include a mechanism for capitalizing the GCF which primarily aims
at making it easier for governments to pledge capital to the fund. If capital is expected to come mainly
from voluntary contributions, the GCF will need to exhibit unique strengths over the other climate funds
(discussed in the next section) that serve as alternative channels for donor governments.
Financing Outside the UNFCCC
A major part of public climate finance is provided through multilateral and bilateral funds operating
outside the UNFCCC. In absolute terms, the volume of finance from these channels is greater than all
financing through UNFCCC mechanisms since the establishment of the GEF in 1994 (not counting market
mechanisms). These dedicated climate funds have multiplied in number since 2007; moreover, each is
governed by its own criteria and procedures, creating high user transaction costs and resource
fragmentation. This trend toward single-topic funds, even when individual funds may be small, is partly
driven by developed countries’ interest in making climate change more visible in their development
assistance contributions. Many such funds work in conjunction with multilateral institutions like the
World Bank, and these partnerships reduce transaction costs and bring the additional value of parallel
co-financing, innovative structures to secure better performance, and private investment mobilization.
Established in 2008, the Climate Investment Funds (CIF) are a partnership among five major
multilateral development banks, including the World Bank Group. The partnership brings together the
48 countries in which CIF is operating, 14 contributing countries, and other stakeholders to promote
innovative country-led investments in clean technology, renewable energy, sustainable management
of forests and climate-resilient development. As of December 2013, the CIF had received pledges
amounting to approximately $8 billion for two sub-funds: the Clean Technology Fund (CTF) and the
Strategic Climate Fund (SCF). The SCF, in turn, comprises the Forest Investment Program (FIP), the Pilot
Program for Climate Resilience (PPCR) and the Scaling up Renewable Energy in Low-income Countries
Program (SREP). The $5.5 billion CTF supports 16 investment plans in middle-income countries--
including one regional program--with highly concessional resources to scale up the demonstration,
deployment, and transfer of low carbon technologies in renewable energy, energy efficiency, and
sustainable transport.275 On the other hand, the $639 million FIP supports the efforts of eight
274
See UNFCCC Decision 3/CP.17 FCCC/CP/2011/9/Add.1. 275
CTF supports programs in the following countries : Chile, Colombia, Egypt, India, Indonesia, Kazakhstan, Mexico, Morocco, Nigeria, Philippines, South Africa, Thailand, Turkey, Ukraine, Vietnam, and the Middle East and North Africa Region (Egypt, Jordan, Morocco, Tunisia).

161
developing countries in reducing deforestation and forest degradation, as well as in promoting
sustainable forest management which reduces emissions and enhances forest carbon stocks (REDD+).276
As for the $1.3 billion PPCR, it supports 11 investment plans in developing countries--including two
regions—for the integration of climate resilience into development planning and additional funding for
public and private sector investments for implementation.277 The $551 million SREP supports eight
investment plans to stimulate energy access and economic growth by working with governments to
build renewable energy markets, attract private investment, and target renewable energy technologies
that allow for the generation and productive use of energy in households, businesses and community
services.278 All data is as of December 2013. The CIF delivers its resources in a programmatic approach
through an investment plan. Developed by the pilot country in partnership with World Bank Group or
other regional development banks, and various other stakeholders, the plan identifies a coherent set of
climate change interventions.279
To access CIF resources, countries work with the World Bank Group or regional development banks to
design an investment plan to provide the basis for funding. Each investment plan should demonstrate
how investments would have a “transformative” impact in light of the country’s major sources of GHG
emissions, development opportunities, and vulnerability to climate change. Each plan should also
identify complementary financing from government, other development agencies, and the private
sector. CTF resources have been allocated on a "first come, first served" basis, and the proponent MDBs
have sought to build on ongoing programming in the energy and transport sectors in key countries.
Multilateral climate funds also include programs aimed at Reducing Emissions from Deforestation and
Forest Degradation plus conservation (REDD+). REDD+ is an international process under the UNFCCC
that seeks to avoid further deforestation and enhance carbon sinks. Launched in 2008, the UN REDD
program is managed by UNDP, UNEP and the FAO, and supports efforts to develop and implement
national REDD+ programs in 16 countries with a $67 million fund. 280 The program is currently focused
on REDD+ readiness: Phase 1, the development of national REDD+ strategies or action plans; and Phase
2, capacity building, technology development and transfer, and results-based demonstration activities.
These will prepare for the results-based actions that should be fully measured, reported and verified in
Phase 3.281 Another fund for REDD+ is the World Bank-administered Forest Carbon Partnership Facility
(FCPF), a $825 million fund launched in 2008. Through its Readiness Fund ($360 million), the FCPF
supports 44 participating countries as they prepare for REDD+ by developing the necessary policies and
systems; adopting national strategies; developing reference emission levels; designing measurement,
276
FIP supports programs in Brazil, Burkina Faso, Democratic Republic of Congo, Ghana, Indonesia, Lao People's Democratic Republic, Mexico and Peru. 277
PPCR supports programs in Bangladesh, Bolivia, Cambodia, Mozambique, Nepal, Niger, Tajikistan, Yemen, Zambia, Caribbean Region (Dominica, Grenada, Haiti, Jamaica, Saint Lucia, Saint Vincent and the Grenadines), and Pacific Region (Papua New Guinea, Samoa, Tonga). 278
SREP supports programs in Ethiopia, Honduras, Kenya, Liberia, Maldives, Mali, Nepal, Tanzania; Reserve Countries: Armenia, Mongolia, Yemen, and the Pacific Region (Solomon Islands, Vanuatu). 279
Climate Investment Fund (2013). CIF Annual Report 2013. 280
The REDD+ pilot countries are Bolivia, Cambodia, Democratic Republic of the Congo, Ecuador, Indonesia, Nigeria, Panama, Papua New Guinea, Paraguay, the Philippines, Republic of Congo, Solomon Islands, Sri Lanka, Tanzania, Vietnam, and Zambia. 281
UN-REDD Programme (2011). The UN-REDD Programme Strategy 2011-2015. p.3.

162
reporting, and verification systems; and setting up REDD+ national management arrangements. On the
other hand, the FCPF’s Carbon Fund (currently about $465 million committed or pledged) was launched
in May 2011 and will provide performance-based payments for verified emission reductions from REDD+
programs to about 5 countries that have made significant progress in their REDD+ readiness.282 The FCPF
and UN REDD program have separate governing committees and governance structures, but collaborate
closely to ensure that these programs are complementary and use compatible standards and
approaches.
Other donors have established their own dedicated climate funds for REDD+ and, without attempting
to be exhaustive, a selection of them are mentioned here as illustration. In 2010, Norway directed
$676 million of climate finance through bilateral channels, including its International Climate and Forest
Initiative (NICFI). Phase 3 REDD+ has been the primary focus of this funding, particularly in Brazil,
Indonesia, Tanzania and Guyana.283 These funds are to be disbursed against progress in achieving
emissions reductions, safeguarding of forest cover, and specific institutional milestones. Others climate
funds have been established as contributions to “Fast Start Finance” commitments; these include the
UK’s International Climate Fund, jointly administered by its Department for Energy and Climate Change,
Department for International Development, and Department of Environment, Food and Rural Affairs,
the U.S. Global Climate Change Initiative, AUSAID’s International Forest Carbon Initiative, and an
International Climate Change Adaptation Initiative.
Bilateral funds are likely to evolve as important sources of climate finance in the future. To date, many
of the bilateral funds channel their resources through multilateral climate funds (e.g., CIF, UN REDD, and
PCPF). An area that will be closely watched is whether donor governments will limit their contributions
through multilateral instruments to give more prominence to their bilateral funds. A shift in this
direction would allow various contributions to be consolidated under the Annex I banner in the interest
of UNFCCC negotiations, while also producing technical benefits (i.e., by way of cost efficiency and GHG
impact).
Climate Change-Related Development Assistance
Beyond UNFCCC mechanisms and non-UNFCCC climate funds, there is another channel that developed
country governments use to provide international climate finance. This is through their general
development assistance programs, under which some supported activities either primarily target
climate change or encompass climate change as one of their development goals. Roughly half of public
climate finance is channeled this way, with most of this from the MDB core resources and program
budgets of bilateral development agencies (e.g., U.S. AID, AfD).
The World Bank Group and the regional development banks have collectively delivered $26.8 billion in
climate-change-related development assistance, the majority of it from core resources. Figure 5.2
shows the breakdown of this financing: the World Bank (WB) provided 41 percent of the total; the
282
For more information, please see https://www.forestcarbonpartnership.org/fcpf. 283
Overseas Development Institute and Heinrich Boll Stiftung North America. (2011). The Evolving Global Climate Finance Architecture.p.3
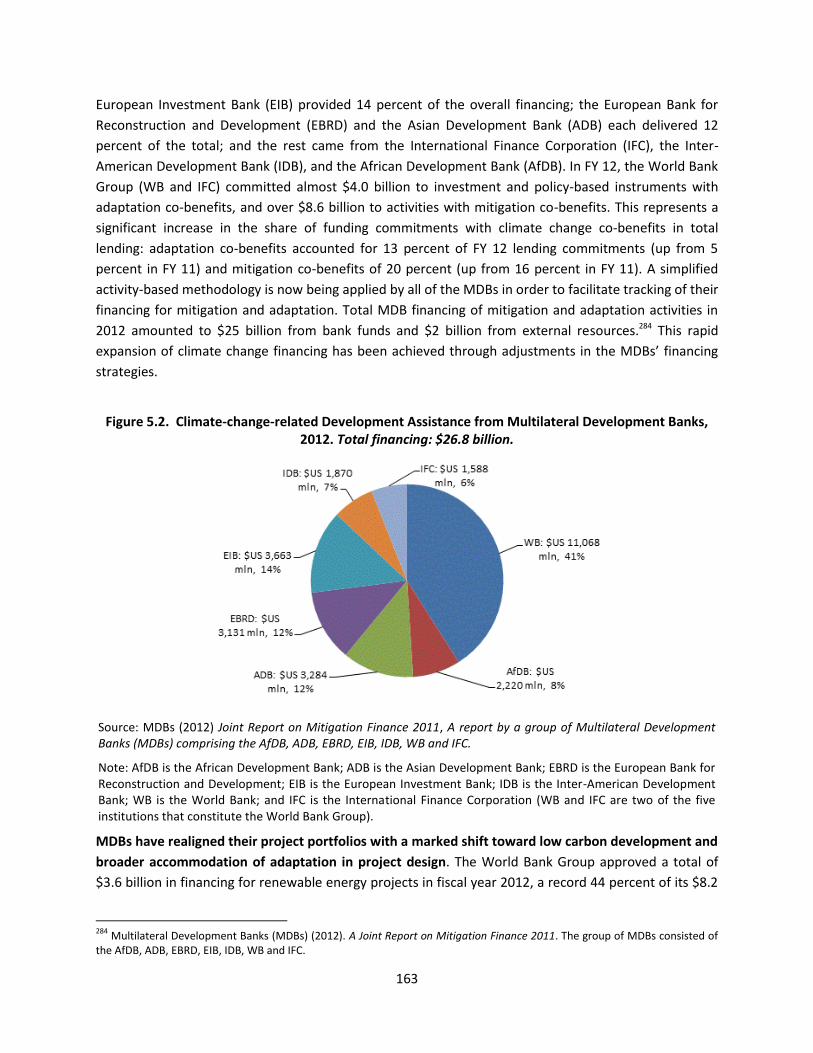
163
European Investment Bank (EIB) provided 14 percent of the overall financing; the European Bank for
Reconstruction and Development (EBRD) and the Asian Development Bank (ADB) each delivered 12
percent of the total; and the rest came from the International Finance Corporation (IFC), the Inter-
American Development Bank (IDB), and the African Development Bank (AfDB). In FY 12, the World Bank
Group (WB and IFC) committed almost $4.0 billion to investment and policy-based instruments with
adaptation co-benefits, and over $8.6 billion to activities with mitigation co-benefits. This represents a
significant increase in the share of funding commitments with climate change co-benefits in total
lending: adaptation co-benefits accounted for 13 percent of FY 12 lending commitments (up from 5
percent in FY 11) and mitigation co-benefits of 20 percent (up from 16 percent in FY 11). A simplified
activity-based methodology is now being applied by all of the MDBs in order to facilitate tracking of their
financing for mitigation and adaptation. Total MDB financing of mitigation and adaptation activities in
2012 amounted to $25 billion from bank funds and $2 billion from external resources.284 This rapid
expansion of climate change financing has been achieved through adjustments in the MDBs’ financing
strategies.
Figure 5.2. Climate-change-related Development Assistance from Multilateral Development Banks, 2012. Total financing: $26.8 billion.
Source: MDBs (2012) Joint Report on Mitigation Finance 2011, A report by a group of Multilateral Development Banks (MDBs) comprising the AfDB, ADB, EBRD, EIB, IDB, WB and IFC.
Note: AfDB is the African Development Bank; ADB is the Asian Development Bank; EBRD is the European Bank for Reconstruction and Development; EIB is the European Investment Bank; IDB is the Inter-American Development Bank; WB is the World Bank; and IFC is the International Finance Corporation (WB and IFC are two of the five institutions that constitute the World Bank Group).
MDBs have realigned their project portfolios with a marked shift toward low carbon development and
broader accommodation of adaptation in project design. The World Bank Group approved a total of
$3.6 billion in financing for renewable energy projects in fiscal year 2012, a record 44 percent of its $8.2
284
Multilateral Development Banks (MDBs) (2012). A Joint Report on Mitigation Finance 2011. The group of MDBs consisted of the AfDB, ADB, EBRD, EIB, IDB, WB and IFC.

164
billion annual energy lending. Of the power generation projects approved in 2012, renewables
accounted for an even larger share (84 percent).285 There has been a similar focus on low-carbon
investments in transport. Projects in the water, agriculture, rural, and urban development sectors have
tended to focus on the adaptation dimensions of climate change. Attention is now turning to the
procedural changes needed to accommodate climate change considerations across the portfolio.
The MDBs have used development policy operations (DPOs) to scale-up support to climate-change-
related reforms and programs. The World Bank has taken the lead with climate change DPOs in the
Philippines, Mexico, Colombia, Brazil, and Mozambique. In FY 12, DPOs accounted for one third of World
Bank mitigation-related lending, amounting to $1.2 billion. DPOs have tended to focus on the
institutional framework for climate change, the development of national, sectoral, and regional planning
instruments, and policy changes that facilitate adaptation and mitigation. This financing modality offers
important advantages for developing country partners. The funds are quick in disbursing transfers to the
treasury, usually in a single tranche on completion of agreed prior actions, and can be applied toward
the government budget rather than tied to specific activities. So far, none of the UNFCCC financial
mechanisms or multilateral climate funds have been able to offer this flexibility, nor have they achieved
the same impact.
The MDBs have sought to scale up project financing by blending their own resources with climate
change finance and partnering with the private sector. CIF funds in particular have typically been
blended with MDBs’ own funds, including financing on grant, IDA, and IBRD terms depending on the
country context. In some cases, the leverage is significant: in the Bangladesh Pilot Program on Climate
Change Resilience (2010), for example, climate finance in the form of grants constituted less than 10
percent of the financing while concessional loans from ADB and World Bank made up the rest. The Clean
Technology Fund, working with the IFC, has also been leveraging significant private financing into clean
energy projects. Indeed, the ability of climate funds to scale up their resources with third-party financing
is one of the strengths of implementation through MDBs.
5.3. MARKET-BASED CLIMATE FINANCE
Market-based mechanisms currently exist for tradable carbon credits, which facilitates financing for
mitigation projects. Market-based mechanisms can be expected to allocate resources to the lowest-cost
emissions reductions, thereby achieving emissions reduction targets efficiently. Primarily tapping private
capital, these mechanisms reduce the burden on public finances and work best when other policies
address market failures and environmental externalities to create the economic incentive for the entry
of the private sector. They can also be a potential revenue channel for national or local authorities
regulating the markets.
The international policy framework is central to generating adequate demand for international carbon
credits. The Clean Development Mechanism has been successful in generating a supply of carbon credits
from developing countries. Unfortunately, however, the limited number of national carbon markets and
285
World Bank (2012). World Bank Financing for Renewable Energy Hits Record High. World Bank website, October 16, 2012.

165
the oversupply of domestic emissions allowances in those limited markets have suppressed demand for
international carbon credits. The market may revive with measures to control allowance allocations
under the Kyoto Protocol’s second commitment period (2013-2020). Ultimately, confidence in carbon
markets in the medium-to-long term can only be restored with a robust successor to the Kyoto Protocol.
Market-based climate finance remains an important instrument for developing countries. The Clean
Development Mechanism provides a framework for project certification and verification of emissions
reduction. This process can support efforts to track progress in emissions reductions through National
Inventories. The CDM provides an additional channel of revenue for projects sponsored by national
authorities. Where economic and political conditions permit, as in China, India, and possibly also Brazil
and Mexico, the development of national or regional carbon markets offers huge potential. Market-
based financing can also be targeted to support local development efforts through payments for eco-
system services.
UNFCCC-Mandated Market Mechanisms
The Kyoto Protocol under UNFCCC establishes the framework for market mechanisms that supports
developed countries’ efforts to limit or reduce greenhouse gas emissions. The protocol, which came
into force in 2005, sets a target for industrialized countries of a 5-percent reduction in emissions against
1990 levels over the period 2008-2012, the first commitment period.286 The second commitment period
for the Kyoto Protocol will start in 2013, with an end date in 2020. Market-based mechanisms have been
created under the UNFCCC that allow parties to meet emissions targets more cost-effectively and
flexibly by buying carbon credits. There are currently three UNFCCC market mechanisms: International
Emissions Trading, Joint Implementation, and the Clean Development Mechanism.
International Emissions Trading (IET) is a cap-and-trade mechanism that allows Annex I countries to
buy unused allowances from other Annex I countries with spare allowances. Caps were set for its first
5-year compliance period, 2008-2012, expressed as levels of allowed emissions (“assigned amounts”)
that are divided into ”assigned amount units” (AAUs). National authorities maintain registries of their
emissions, and the UNFCCC Secretariat maintains a registry of international transactions. With the
exception of a small number of Eastern European countries that are also Annex I countries, the IET is not
a source of climate finance for developing countries. (For a majority of developing countries, IET can
serve as a reference point in the design of domestic emissions reduction regimes with an option of
interchangeable emissions allowances between countries).
Joint Implementation (JI) is a project-based, credit-and-trade scheme that allows Annex B countries to
generate emissions reduction units (ERUs) from mitigation and sequestration projects in another
Annex B country. JI projects must also meet the additionality test and are subject to stringent methods
and protocols similar to those of the Clean Development Mechanism. Most JI projects are located in
transition economies, with Ukraine and Russia accounting for well over half of all registered projects.
The Kyoto framework does not allow ERUs to be created from 2013 onward in the absence of new
quantified emissions targets in place for host countries.
286
The text of the Kyoto Protocol is available at http://unfccc.int/resource/docs/convkp/kpeng.pdf.

166
The Clean Development Mechanism (CDM) is a project-based, credit-and-trade mechanism that allows
entities in Annex I countries to meet part of their emissions reduction targets under the Kyoto
Protocol by buying certified emissions reduction (CER) units from registered CDM mitigation and
sequestration projects in developing countries. CERs are issued for each ton of CO2 equivalent (tC02e)
emissions reductions against a baseline value of emissions. Annex I entities, whether public or private,
can secure CERs directly from project developers or any of the international markets where CERs are
traded. CER proceeds give projects a stream of income over their lifetime, ranging from seven years to a
maximum of 21 years depending on the crediting period chosen (and with the income level depending
on the quantities issued and contract value of the CERs). CDM projects must be approved by the host
country’s Designated National Authority (DNA) and validated by a certified Designated Operating Entity
(DoE). Validation requires verification of the project’s additionality, an assessment that the project will
reduce emissions by more than it would in the absence of CDM financing. CERs can only be issued once
the project begins operating and are subject to monitoring and verification to ensure that emissions
reductions are actually realized.287
The CDM has thus far achieved most of the market-based transfer of climate finance from developed
to developing countries. As of May 2014 there were 7500 registered CDM projects and issuance of
more than 1.4 billion CERs. As of 2011, $28 billion worth of pre-2013 CERs have been contracted
forward. If all the underlying projects are implemented, these contracts will have supported additional
investments of more than $130 billion in developing countries.288 Most of this financing is from domestic
sources, although the share of foreign direct investment has been increasing.
While over two-thirds of CDM projects and issued CERs originate in just two countries, China and
India, recent trends point to greater geographic diversification. There are concentrations of CDM
projects in Brazil, Mexico, Vietnam, Malaysia and other middle-income countries. Most LDC countries, in
Africa and in other regions, have only one or two registered projects, and LDCs account for just one
percent of issued CERs. Although project activity is low overall, recent changes in the European Union
Emission Trading Scheme (EU ETS) restricting access to new-project CERs beyond 2013 unless they are
from LDCs or can be swapped for CERs from LDCs, can be expected to create more activity in LDCs in
Africa and other regions. In 2011, Africa accounted for 21 percent of post-2012 primary CERs as
compared with just four percent of the pre-2013 CERs. New projects have been registered in countries
that are so far underrepresented, including Nigeria, the Democratic Republic of Congo, and Burundi—
and there is a growing pipeline of projects from LDCs.289
CDM financing is now concentrated in the energy sector. Early CDM projects were heavily concentrated
in reductions of industrial emissions (super-GHGs), mostly in China (see Box 5.1)—and they still account
for the majority of CERs. These projects are largely exhausted, however, and they face regulatory
hurdles in major carbon markets. The largest CDM project category is now large-scale renewable energy
(notably hydropower, wind, and biomass), with a relatively small but growing portfolio for energy
287
More information on the CDM project cycle and methodologies are available at http://cdm.unfccc.int. 288
World Bank (2012). State and Trends of the Carbon Market Report 2012. 289
UNEP Risoe compiles information on CDM pipeline projects from validation, drawing on UNFCCC data. It contains information on the credits issued to each project and the purchasing entity. See http//cdmpipeline.org.

167
efficiency and fuel-switching projects. The CDM also includes afforestation and reforestation projects,
but these account for less than one percent of the overall number of projects.
Mitigation potential is the main determinant of CDM country distribution, with the general
investment climate and government support for project development being important enhancing
factors. Countries that account for a large share of global emissions are usually the same set of countries
that have a large share of CERs. CDM projects are concentrated in large economies, with rapidly growing
demand for energy and significant emissions. Other variables, such as share of foreign direct
investment, also have a statistical relationship (though not as significant as the share of emissions).
Since the unfunded part of CDM projects are met using domestic financing, having a relatively
developed corporate and project finance industry is key. Poorer countries are much more constrained
by inadequate technical expertise for CDM project design and development capital.290 Development of
capacity to manage the CDM process within the Designated National Authority and among firms
providing technical services to CDM projects can help overcome these project development constraints.
China was particularly proactive in developing this capacity.
Box 5.1. China and the Clean Development Mechanism
The Government of China adopted a proactive approach to the development of the CDM. The Chinese National Development and Reform Commission (NDRC) regulated the CDM project cycle at an early stage. It issued Measures on the Operation and Management of CDM Projects in 2005 (updated in 2010), standardized the approval process, and set limits on project approval times. It also established a CDM management center to provide technical support to project developers and offer grants to support climate-related capacity building, public awareness activities, and investments in industrial climate change mitigation activities. These facilities are largely funded through taxes on CER revenues.
Taxation of CERs was motivated by the massive rents generated by the difference between CER prices and the cost of abatement of industrial gases (i.e., hydrofluorocarbon and nitrogen dioxide). The tax rate or “allocation ratio” varied depending on the return from abatement activities and was as high as 60 percent for industrial gas projects. Revenues are earmarked to the China Clean Development Mechanism Fund to support climate change mitigation activities. By the end of 2012, accumulated project revenues were estimated at $8.5-10 billion, generating government revenues amounting to $1.9 billion.
China’s Designated National Authority has also used pricing policies to promote CDM projects, reviewing and approving the terms at which CERs are sold to foreign companies. The government effectively set a “minimum floor price” for the sale of CERs which reduced the risks for Chinese investors. The floor price was established after China had already captured a substantial share of the CDM market, at around $10/ton in 2005. With the global carbon market prices falling, the floor price has begun to restrict investment.
Source: China Climate Fund (2012). CDM and China CDM Fund.
Streamlined procedures for programmatic approaches have facilitated implementation in LDCs.
Programs of Activities (PoA), first approved in 2007, allow for a private or public entity to register a
voluntary coordinated action implementing a policy, a measure or a goal that leads to emission
reduction, and to add component activities as long as they comply with the PoA-related procedures and
design. This expands the possible scope for applying CDM to smaller projects at the household level –
290
Clean Development Mechanism (CDM) (2012). Assessing the Impact of the Clean Development Mechanism Report, Report Commissioned by the High Level Panel on the CDM Policy Dialogue.

168
such as programs for energy efficient light bulbs, household solar panels and micro-hydroelectric power
– that would otherwise be unlikely to receive the CDM financing.291 Africa accounts for 28 percent of
the 269 registered PoAs, as compared to just three percent of registered projects. CDM is currently
reviewing the feasibility of standardized approaches that would further reduce up-front costs of project
design and testing of additionality.
The future of CDM as a provider of market-based climate finance depends on the demand for CERs
from major carbon markets. The European Union’s Emissions Trading Scheme (EU ETS) is by far the
most important source of market-based financing for CDM. However, it is currently facing an oversupply
of credits, which is expected to dampen CER prices in the next few years. Projects currently operating
and in the pipeline may already meet demand through to 2020, possibly meaning that no more CDM
projects will be financed before then. Possible measures to revive the CDM include stringent Annex I
emissions targets to strengthen demand for CERs and voluntary cancellation of CERs accrued from
previous compliance periods. 292
National Carbon Markets
Carbon markets are the product of international, national, and sub-national policies and regulations.
Their purpose is to facilitate the efficient distribution of mitigation efforts within national economies.
Under an Emissions Trading Scheme (ETS), emitters are given emissions allowances, and they can adjust
their operations to these limits by adopting low-carbon means of production, by purchasing allowances,
or by purchasing carbon credits/offsets from others. Some carbon markets (e.g., EU ETS) may also allow
entities to exchange carbon units with entities in other countries.
The EU ETS covers two billion tons of CO2 per year and is the largest regional market in the world. By
enabling the import of international credits from developing countries, the EU ETS is also among the
main sources of market-based financing for these countries. While, few other national or sub-national
carbon markets accept the import of international credits, there are some that do. New Zealand’s
national market has been operational since 2008. California launched its emissions reduction scheme in
2013, which covers major sources of GHG emissions in the state (e.g., refineries, power plants, industrial
facilities, and transportation fuels). Other carbon markets are the Regional Greenhouse Gas Initiative,
covering emissions from power plants in eastern U.S., Switzerland, and Australia, new schemes
operating in six Chinese cities, Switzerland, Australia, the province of Quebec, Kazakhstan, and sub-
national jurisdictions in Japan. The rules for these markets are such that they will not bring about a
significant increase in demand for international credits before 2020.
The EU ETS covers more than 13,000 factories, power stations, and other installations in 31 countries
(all 28 EU member states plus Iceland, Norway, and Liechtenstein). Installations receive European
Union Allowances (EUAs) through their national allowance plans, administered by the governments of
participating countries. Based on World Bank data from 2012, EUAs used to account for 97 percent of
291
UNEP (2009). Primer on CDM Programme of Activities. p.17 It can be downloaded from www.cd4cdm.org. 292
CDM (2012) Climate Change, Carbon Markets and the CDM: A Call to Action, Report of the High-Level Panel on the CDM Policy Dialogue.

169
the global carbon market. The prolonged economic downturn in Europe and the consequent decline in
GHG emissions have substantially reduced demand for EUAs and international credits. Increased
investment in renewable energy generation and expected incremental energy efficiency measures have
further suppressed demand for credits. Therefore, despite planned adjustments to rebalance supply and
demand in Phase III of EU ETS (2013-2020), most analysts expect carbon prices to remain depressed.
Voluntary markets operate on a relatively small scale but offer greater flexibility in the projects that
they can support. This is a niche and illiquid market, with about 70 MT CO2 transacted in the voluntary
carbon market in 2013 at an average price of $5 per ton. Most credits are purchased in order to meet
corporate GHG emissions targets and targets for green supply chains. The bulk of this market is in the
U.S., Europe, and Japan.
Reducing Emissions in Deforestation and Forest Degradation plus Conservation (REDD+) is an
international process under UNFCCC to avoid further deforestation and enhance carbon sinks. REDD+
is currently supported by a handful of donor countries, principally Norway, but also Australia, the UK,
and the U.S. It has targeted forested countries like Brazil, Indonesia, and Guyana. While the geographic
coverage is so far limited, about $3.58 billion has already been pledged, notably from the Norway
International Climate and Forest Initiative ($1.6 billion), the Amazon Fund ($1 billion), the Forest
Investment Program ($612 million), the Forest Carbon Partnership Facility ($450 million), the Australia
International Climate and Forest Initiative ($216 million), and UN REDD ($151 million). The eventual goal
is for REDD+ projects to access global carbon markets and to reduce the share of donor government
financing. REDD+ funds today build on a phased approach to finance, up-front investments of scale, and
performance-based and/or carbon-based payments.
Development of market financing arrangements for REDD+ is attractive because smaller projects can,
in theory, be bundled into portfolios that are substantial enough to access market capital. Countries
that benefit from REDD+ can therefore spread beyond heavily forested countries. REDD+ itself is a
mitigation activity increasingly linked to socioeconomic co-benefits in some of the poorest communities;
it thus serves more than one development objective. UNFCCC has signaled its interest in market-based
approaches to support results-based REDD+ activities.293 But REDD+ is still relatively unproven from the
regulatory and commercial standpoint, so it is too early to predict if market-based financing will happen.
The existing carbon markets are themselves in a process of maturation and are not yet ready for
widespread application. In the case of REDD+, the current practice is still to pay on the basis of agreed
performance indicators.
The CDM recognizes afforestation and reforestation projects, but not yet REDD+. The EU-ETS excludes
forestry credits altogether. Consequently REDD+ carbon transactions have been limited to the
Voluntary Carbon Market, where primary and secondary transactions amounted to about $178 million
in 2010. Demand is driven by corporate social responsibility investments, largely focused on Latin
America, where underlying policy frameworks and land and forest tenure regimes are more established.
293
UNFCCC (2010). Decision 1/CP.16. paragraph 73.

170
For now, developing countries that are REDD+ eligible must rely on the non-market channels mentioned
earlier.
Revenues can also be generated for land-use projects from Payments for Environmental Services.
These payments arise when a service buyer enters into a contract with a landowner to manage the land
in such a way as to generate one or more ecosystem services. An example would be a water supply
company that contracts with landowners to maintain forest cover in a catchment area in order to better
regulate water flow and reduce pollutants. When the environmental service reduces costs more than an
alternative solution, there is an interest to pay for the environmental service. Commercial interests may
be complemented by corporate social responsibility considerations, such as engaging with local
stakeholders and bolstering a company’s green image.
Land-based environmental payments are not yet a significant source of climate finance, but they have
potential. Examples include two government-led forestry programs in China, the Natural Forest
Protection Program (NFPP) and the Forest Ecosystem Compensation Fund (FECF). After 2 years of
piloting, the NFPP was implemented between 2000 and 2010, covering 17 provinces and 68.2 million
hectares. The total program budget is RMB 96.2 billion, which supported program areas such as logging
restrictions, protected areas, replanting, and a range of other policies aimed at safeguarding the forests
and reducing the risk of erosion and flooding.294 The FECF provided payments to farmers, communities
or local governments to manage standing forest area deemed as “key public benefits forests.” A total of
181.9 million hectares of national- and provincial-level forest area enrolled by 2007, with cumulative
total investment of RMB 13.34 billion by the end of 2007.295
5.4. IMPLICATIONS FOR DEVELOPING COUNTRIES
The emerging architecture for climate finance has implications for developing countries’ policy and
institutional arrangements. For development practitioners in recipient countries, such as financial
planners, the important trend to note is that dedicated climate funds (both multilateral and bilateral)
will continue to play a dominant role in external climate finance. But many of these funds have not
converged on a single model of governance structure and operating modalities; this applies equally to
UNFCCC financial mechanisms and non-UNFCCC funds that are either multi-donor or single donor. One
vision of the future is that a mammoth climate vehicle like the GCF will eventually become the main
conduit for climate finance, and that recipients will have to deal with fewer variations in governance
systems, allocation strategies, and administration. This vision will not be realized in the short term as the
GCF’s operating model is still under development. In the meantime, recipient governments must be
prepared to continue accessing the various bilateral and multilateral funds in a diverse and complex
funding environment.
294
State Forestry Administration of P.R.China.(2011). China’s National Progress Report to the UNFF Secretariat on the Implementation of NLBI and Other Relevant Resolutions; and Forest Trends. (2009).Markets for Ecosystem Services in China: An Exploration of China’s “Eco-Compensation” and Other Market-based Environmetnal Policies. 295
Ibid.
171
Development assistance financing that is broader in scope (i.e., focusing on sectoral issues like energy
access, food security, and natural resource management) will continue to feature elements of climate-
eligible support. Wherever functional capabilities have been built-up in government to manage these
development assistance flows, this will benefit the management of climate finance specifically and
development finance more broadly. This is largely helped by recent progress on the aid effectiveness
agenda, where there is now a consensus and a commitment to use existing government systems to
disburse and manage external financing (instead of donor-specific systems).296 However, climate finance
delivered through broadly-labeled development assistance is anticipated to be less important in the
future, as donor countries gradually funnel their climate support either into dedicated climate funds or
through their MDB contributions. The alignment of these channels with national financial systems is still
in progress, and where it does occur it has been negotiated for each fund. “Direct access” criteria were
developed for the purpose of the Adaptation Fund, but these have not been entirely replicated at the
GCF and the new requirements have not been agreed upon.
Given that the external funding environment will continue to feature a variety of requirements,
governments must maintain their core domestic capabilities and institutional arrangements and also
complement these with more specific “readiness” for administering international climate finance.
What follows is a discussion of some of the required elements of the emerging climate finance
architecture, from readiness as a concept to the use of national systems in climate finance
administration under “direct access,” to the implications that monitoring, reporting, and verification
regimes have on national systems. From this discussion, the advantages of Climate Change Public
Expenditure and Institutional Reviews (CCPEIRs) can be seen, as well as the value of assigning the central
financial agency a key role in implementing national climate actions.
Readiness
The concept of “readiness” originates from the development of institutional frameworks to support
REDD+ programs. Readiness entails the development of national REDD+ policies and strategies;
reference emissions levels; measurement, reporting and verification systems; and management and
safeguards arrangements. In a similar vein, climate finance “readiness” entails the development of an
institutional framework that enables the recipient to use climate change finance effectively. UNDP has
further elaborated on this theme, arguing that readiness includes the capability to (1) plan for finance;
(2) access finance; (3) deliver finance; (4) implement/execute activities; and (5) monitor, report, and
verify the application of funds.297 The concept of readiness entered the mainstream with provisions
introduced into the Green Climate Fund to finance readiness activities. These include the development
of UNFCCC-mandated planning instruments, such as NAPs and LEDs, strengthening of capacities for
country coordination, and fiduciary, environmental, and social safeguards.
296
For more information on the OECD Second and Fourth High Level Forum on Aid Effectiveness (Paris, 2005; Busan, 2011), see http://www.oecd.org/dac/effectiveness/thehighlevelforaonaideffectivenessahistory.htm 297
UNDP (2012). Readiness for Climate Finance: A Framework for Understanding What it Means to be Ready to Use Climate Finance.

172
An important element of readiness is clarity regarding the policy objectives that authorities are trying
to achieve when mobilizing external finance. A clear articulation of policy objectives—supported by
well-developed climate change strategies and implementation plans—help to provide a solid basis for a
portfolio of possible projects. Projects formulated through such a process demonstrate “readiness” in
terms of cohesion between policy and finance, which is among the elements sought in NAMAs
requesting support from Annex I countries. Attention should also be given to how to match these
national priorities with the financing sources available.
Developing countries may also seek to demonstrate the extent that public finance will be used to
leverage private investment in climate change mitigation. As many countries, both developed and
developing, are currently fiscally constrained, there has been strong interest in ways to leverage scarce
public financing with private financing. To achieve this, developing countries may turn to the experience
of MDBs, whose portfolios show significant levels of private leverage factors (depending on the type of
public financing, sector, technology supported, and so forth). In a report to the G20, the MDBs
estimated leverage factors in the range of 3-6 for non-concessional lending and 8-10 (or even higher)
when public finance is in the form of concessional lending, grants, or equity. Leveraging private
investment involves more than collaboration with MDBs; it also requires governments to create the
right enabling environment, including policies and regulations to attract the private sector and the
institutional capacity to engage it.
Another critical element of readiness is the capability to coordinate flows of climate change finance.
The proliferation of financing instruments, each with its own counterpart institutions, funding criteria,
and procedures, has put a premium on effective coordination. (In Peru, for example, the number of
externally financed climate change projects increased by a factor of 12 and the amount of financing by a
factor of 160 over the five years up to 2011.298) Resources are likely to flow to those countries that are
able to navigate the procedural requirements and demonstrate that they will be able to use resources
effectively. Coordination is also needed to allow the national authorities to track what climate change
activities are in preparation or underway. The coordination function should also help match priority
projects with the appropriate financing sources. While international institutions have developed
platforms that provide information that support this function–the joint World Bank and UNDP Climate
Finance Options site, for example, describes over 50 dedicated-climate change sources of funding–this is
no substitute for national capacity. Ideally coordination should also help avoid duplication of efforts and
ensure an orderly process in mobilizing financing in line with national policy priorities.
While many countries have assigned this coordination function to specialist environmental agencies, a
case may be made for placing the function closer to decision making for the whole of government
(i.e., within central finance and planning agencies). Climate finance is used across a wide range of
sectors and across levels of territorial administration, often playing a complementary role alongside
development assistance or private financing. Climate initiatives undertaken by the public sector may
create obligations for future investment, operations, and maintenance or contingent liabilities on the
government balance sheet due to the use of guarantees and other instruments. Consequently,
298
Swiss Cooperation et al. (2012). Climate Finance Readiness: Lessons Learned in Developing Countries.

173
managing climate finance is likely to demand a broader policy perspective and institutional mandate
than typically seen in environmental agencies. The functional requirements for the management of
public climate finance are similar to those for development assistance management: coordination with
international institutions; project selection and appraisal; monitoring and reporting on financial flows
and their application; and integration of external financing into national decision-making, planning, and
budget processes. These functional requirements point to a more significant role for central planning
and finance agencies since these agencies are mandated to gather financial information and allocate
public funds.
Consideration will also need to be given to the extent to which climate finance is allocated and
applied using national rather than parallel systems. Both developed and developing countries have
expressed the intention to strengthen developing country control and ownership over public climate
finance. For the time being, the international discussions on financial management of climate funds
have yet to fully converge with the approach taken toward other development topics. The Busan
Partnership for Effective Development Cooperation commits development partners to the use of
country systems as the default modality for development assistance. It also advocates that climate
finance “ensure that, where appropriate, these measures are financed, delivered, and monitored
through developing countries systems.”299 For now, however, the institutional arrangements necessary
to access the major climate funds tend to be parallel systems with dedicated management structures
and reporting arrangements.
Direct Access
From the very start, UNFCCC financing mechanisms sought to channel resources to developing
countries through accredited international implementing entities such the World Bank, regional
development banks, and UN agencies. This required recipient governments and civil society
organizations to apply for project funding through one of the accredited international entities. These
international entities assumed responsibility for project appraisal, disbursement of funds, and
supervision—and included their own management and fiduciary frameworks. Consequently projects
were designed and implemented following the procedures of the international implementing entity;
these systems are still the default today. In the last two years, however, a “direct access” concept is
being introduced in climate funding, with fiduciary and management requirements set for national
governments to meet as a condition for receiving funds directly. The adoption by national authorities
has been gradual; more importantly, the requirements have been different between the pioneering
funds. Recipient governments are still unable to determine whether and how much longer they will have
to operate under multiple sets of rules of the parallel management systems (the system of direct access
and of access through accredited international agencies).
The Adaptation Fund initiated its move toward “direct access” by putting in place a process for the
accreditation of national implementing entities (NIEs). The accreditation process, launched in January
2010, seeks to determine whether prospective national implementing entities meet the appropriate
299
OECD Fourth High Level Forum On Aid Effectiveness (2011). Busan Partnership For Effective Development Co-Operation. Busan, Republic Of Korea, 29 November-1 December 2011.
174
fiduciary standards. Accreditation requires an assessment of financial management capacity, project
appraisal and management capacity, transparency, and anti-corruption measures, as well as an internal
audit. An Environmental and Social Policy was approved in November 2013. Accredited NIEs are
authorized to submit project proposals prepared by executing entities to the Adaptation Fund, serving
as the intermediary between the Fund and national institutions. Once projects are approved by the
Adaptation Fund Board, funds are released to the NIE for subsequent implementation by executing
entities. The NIE also monitors implementation. The implementing and executing entities both recover
administrative costs (eight and nine percent respectively of project costs) from the Fund. Regional and
multilateral implementing entities (RIE and MIE, respectively) can also be accredited.300
Progress in establishing the institutional framework for direct access has been slow, partly because of
processing requirements. As of May 2014, there are 16 accredited NIEs, four accredited regional
institutions, and 11 accredited multilateral institutions.301 Five grants for $44 million total have so far
been approved through NIEs. The average time taken for accreditation is just under six months,
requiring three meetings of the review panel and rounds of clarifications and requests for additional
information. The Adaptation Fund has recently launched a new readiness program to build the capacity
of implementing entities.
Central planning and finance institutions could play an important role in supporting direct access.
Nomination of central finance and planning agencies as the national implementing entity or equivalent
would facilitate integration of climate finance from UNFCCC-related funds into national planning and
budgeting systems. Central agencies can always delegate responsibility for elements of project selection,
appraisal, monitoring, and oversight to specialist environmental agencies while retaining overall
responsibility for these functions. Where NIE functions lie outside of the central finance and planning
agencies, specific procedures may need to be put in place to ensure that information is captured by and
resource allocation decisions taken within the framework of the government’s expenditure plans and
budgets.
Measurement, Reporting, and Verification
Future financial support under UNFCCC for mitigation and adaptation actions will be subject to new
monitoring, reporting, and verification (MRV) requirements that are still under development. The
MRV framework is expected to link to the reporting arrangements for financial contributions from
developed countries. Whatever the eventual MRV requirements, this will likely influence the kind of
national reporting systems needed in recipient countries. This is especially relevant to countries seeking
support for the new class of nationally appropriate actions on mitigation and adaptation (NAMAs and
NAPAs).
One of the provisions of the Cancun Agreement is for the measurement, reporting, and verification of
support provided to developing countries, with the intent that MRV will improve transparency
regarding financial flows, strengthen the accountability of developed countries for resource
300
More details of the process can be found at https://www.adaptation-fund.org/page/accreditation-process. 301
A list of the accredited entities can befound at https://www.adaptation-fund.org/page/implementing-entities.
175
mobilization, and strengthen the accountability of developing countries for the application of these
funds. This framework will have implications for the national accounting systems for managing climate
finance in developed and developing countries. While these arrangements may have similarities with
those currently in place for managing development assistance, the tracking, reporting, and institutional
arrangements are likely to be different.
There are conceptual and practical issues when applying the MRV concept to climate finance. While
MDBs, donor governments, and research bodies have been working in parallel to harmonize their
measurement of climate finance flows, there is yet to be agreement at the UNFCCC on a MRV
framework. Many aspects of finance measurement are still being debated, including (1) which flows of
public and private finance should be included; (2) how these flows should be reported and monitored;
(3) how these flows should be accounted so as to demonstrate additionality to development assistance;
(4) how these flows and the additionality of finance can be verified; and (5) the extent to which the
application of funds will also be subject to verification.302
The national communications and national inventories formats will probably be one constituent
element of the MRV framework, as they are already required of UNFCCC parties. Developing countries’
national inventories provide comparable information for the purposes of tracking mitigation progress at
a national level and consolidating information at a global level. In terms of funding, developing countries
are also required to provide information in their biennial reports on climate finance received. One of the
expectations under MRV is that UNFCCC will have to agree on a standardized reporting framework so
has to have a consistent classification of financing categories and where funds have been applied.
Clearly the national communications and national inventory reports will not be adequate for this
purpose. Financial reporting by Kyoto signatories are not standardized in scope and structure. To date,
only Norway and Switzerland have provided information on financing against a baseline for public
finance; none of the Annex II countries are able to provide consistent information on private sector
financing.303 Requirements for communications from developed non-Annex II countries are less
demanding and coverage is uneven. Developing non-Annex I countries are supposed to report on the
assistance that they receive and their financing requirements; again, they usually provide limited
quantitative information and the format is not consistent across countries.
As MDBs and research bodies have found, multiple data sources and reporting regimes have to be
integrated for this purpose. The OECD’s Credit Reporting System’s Rio Markers for official development
assistance is a key reporting system specifically designed to track climate change finance. This can be
complemented by the financing data from MDBs, which report under a Joint MDB Reporting Initiative on
Climate Finance, and by data from national development banks and from bilateral development
agencies that are also major providers of climate finance and report on their climate finance flows.
There is ongoing dialogue across these efforts to explore synergies. Consistent reporting on market-
303
UNFCCC Subsidiary Body for Implementation (2011). Compilation and Synthesis of Fifth National Communications, and Addendum. FCCC/SBI/2011/INF.1 and FCCC/SBI/2011/INF.1 /Add.2.

176
based finance and private investment is another challenge; the work of Bloomberg New Energy Finance
and the OECD provide good starting points, on top of which foreign direct investment data from the
United Nations Conference on Trade and Development (UNCTAD) will have to be added. And whether
for public or private sources of finance, there are differences in accounting standards, and data
segmentation according to sectors, regions, and financing modalities, that will all have to be reconciled.
In implementation, tracking financial flows against emissions could involve the UNFCCC as a central
point of review and reconciliation. Verification for the purposes of testing the relevance and
effectiveness of financing will entail greater engagement with developing country authorities, possibly
through a formal UNFCCC review or expert review process to determine the consistency of financing
with national climate change objectives. This approach would be consistent with a shift to financing
delivered through budget support, programmatic instruments, and enhanced direct access. Alternative
means for verification have been proposed, including a centralized registry system.
Box 5.2. Additionality of Climate Finance
The Cancun Agreement commits developed countries to provide new climate change finance that will be additional to existing transfers of resources from developed to developing countries. Measurement of additionality requires agreement on a series of definitions. These may include the following:
The nature of existing transfers, generally taken to include official development assistance from bilateral sources, although this may or may not include development assistance financing climate-change-related activities.
Baseline values for existing transfers, which may be taken as the value of assistance at a particular date or as a share of GDP, such as the 0.7 percent of GNI target agreed to in the Millennium Development Goals.
New climate change finance, which may or may not include finance from carbon markets, private investment, and public finance generated to finance the Green Climate Fund through new instruments established by international agreement.
The level of resolution at which additionality will be measured, which may be seen as a collective commitment of developed countries or an individual commitment to be monitored country-by-country.
While the definition of additionality in climate finance is being discussed, donors and recipients are working to improve consistency in the way that activities supported by climate change finance and development assistance are reported. The OECD and other international bodies, meanwhile, are harmonizing methodologies in tracking and reporting flows of official climate finance and official development assistance.
Source: Brown et al (2010). Climate Finance Additionality: Emerging Definitions and Their Implications. ODI and Heinrich Boll Stiftung Climate Policy Brief No. 2.
Whatever the eventual MRV requirements for climate finance, developing countries should endeavor
to have compatible national systems for reporting on mitigation and adaptation projects. At a
minimum, authorities will need a more systematic and centralized tracking system than is currently in
place in many recipient countries. Information on financing for public institutions may be dispersed
among executing agencies or the designated authorities for international mechanisms (e.g., GEF).
Financing may be channeled directly to local authorities, to semi-autonomous public entities, or to
public enterprises and civil society organizations so as to escape central government reporting channels.
China has established a mechanism for tracking CERs, which are subject to tax’; most developing

177
countries, however, have no means to track carbon financing flows to the private sector. Reporting on
private investment is a particular challenge, requiring dedicated surveys. Consolidation of information is
another major challenge, more so even than the reporting of development assistance, as that at least
has a common reporting framework.
Climate Change Public Expenditure and Institutional Reviews (CCPEIRs) can assess the effectiveness of
the institutional framework for climate change monitoring and reporting. The priority for most
countries is to put in place systems to consolidate information across the public sector that national
authorities need for management purposes and to satisfy international reporting requirements. A basic
requirement is that reporting systems facilitate monitoring of the implementation of national climate
change strategies. Ideally, these systems should also present information in such a way as to facilitate
public investment programming and budget management. This will be particularly important if MRV
requirements extend to the application of funds. Countries that are debating carbon pricing instruments
(whether tax or cap-and-trade) should make timely decisions during the instrument design stage. The
classification and reporting requirements for covered emitters under a given pricing scheme should
ideally dovetail with future management systems for climate financing and development assistance.
While it is difficult for recipient countries to assess if financing has been additional (Box 5.2), national
authorities need to find ways to correctly classify what counts as climate finance within the overall
development assistance they receive.
Given the range of public agencies that have to report and the links to planning and budgeting,
responsibility for climate finance reporting may have to be located close to the center of government.
Specialist environment agencies will be important as a source of information, and also for enforcing
performance at the implementation level. However, they are unlikely to be able to fulfill all of the
functional requirements of an effective reporting system.

178
CHAPTER 6. FINANCIAL MANAGEMENT
6.1. CHAPTER SUMMARY
This chapter reviews the process of climate budget and expenditure planning and provides a
framework for the alignment of climate-related public spending with public policy. The budget
process combines a top-down, whole-of-government policy framework led by the central finance and
planning agencies with a bottom-up process of expenditure planning by the spending agencies. During
the budget process, the central finance and planning agencies (the guardians) pursue government-wide
policy objectives, including expenditure constraints, while the spending agencies (the advocates) seek to
maximize the resources available for agency-specific policy and institutional objectives. Climate change
mitigation and adaptation differs from many other policy objectives in that there is no single
institutional advocate. Spending agencies may pursue climate change policies where these are aligned
with agency objectives and interests, but this will not always be the case. Environmental agencies may
be expected to serve as advocates for mitigation, but they lack effective levers to influence other
spending agencies’ resource allocation decisions.
Central finance and planning agencies’ engagement is essential if climate change policies are to be
reflected in budgets. These agencies review spending agency budget proposals and expenditure plans to
determine whether whole-of-government policy objectives, such as climate change, are adequately
addressed and resourced. This review or challenge function can be formalized by issuing specific
guidelines on how climate change issues should be addressed in agencies’ budget proposals (e.g.,
requiring a description of climate change policy objectives and an explanation of how these are reflected
in the budget proposal). Consolidating this information in the final budget documentation further
emphasizes this policy priority and forces central agency staff to pay particular attention to climate
change policies. Specialist climate change policy units or committees can support this review or
challenge function.
If central finance and planning agencies are to scale-up climate change expenditures, they have to
create incentives for spending agencies to realign both ongoing and new programs and projects with
the government’s climate change objectives. Earmarks, allocation targets, and virtual funds could
create such incentives. Use of these tools to promote climate change interventions is not without risks,
however, and particularly risks to the quality of spending. In order to mitigate these risks, central
finance and planning agencies need to set expectations on the performance of climate-change-related
programs and projects in relation to the performance expectations of programs and projects supporting
other policy objectives.
For most developing countries, the expenditure planning horizon is restricted to the annual budget
and the 3-5 year period covered by the medium-term expenditure framework. However, climate
change expenditure planning has a long-term horizon. Some OECD countries are now considering the
long-term fiscal impacts of climate change. For most governments, the first step in any long-term
expenditure planning exercise is to take stock of climate change impacts, the fiscal risks that may arise
and their implications for policy today. Estimation of the costs of adaptation poses significant challenges

179
for financial planners given uncertainty regarding future impacts, the nature of the policy response, and
the implications for policy today.
Many public sector resource allocation decisions that are relevant to climate change are made outside
of the budget process. These typically include externally financed expenditures, both from
development assistance and climate change finance; mandatory expenditures; expenditures of
autonomous entities, state-owned enterprises, and local government; and off-budget expenditures
related to quasi-fiscal operations, government guarantees, and tax expenditures. Climate change
expenditures may be significant in all of these categories. The challenge for central finance and planning
agencies is first and foremost to track and report on these expenditures, ideally in budget
documentation. Once information is available in a context which reveals the financial implications of
allocation decisions taken outside of the budget, decision makers are better placed to assess the
tradeoffs between alternative applications of funds and align resources with government policy
objectives.
For many developing countries, a substantial part of public expenditures is externally financed,
usually from official development assistance but increasingly also from dedicated climate funds. In
practice, external financing makes extensive use of parallel budget systems. Public finance theory
suggests that the application of resources will be more efficient if made on the basis of comprehensive
information and without earmarking of funds. External financing, however, will not be captured on
budget unless specific procedures are put in place. The requirements to include external financing in the
budget should be laid out in the organic budget law. In addition, dedicated information systems are
needed to capture information that flows through these external channels, using information reported
by both beneficiary and financing entities.
Autonomous agencies and state-owned enterprises may be responsible for an important part of the
public sector’s climate-change-related expenditures. SoEs may report on their environmental impacts
and related financial transactions on a voluntary basis or where instructed to do so by their government
shareholders. Local governments are responsible for a significant share of climate change expenditures;
these will not be reflected in the central government’s budget and financial reports. State, municipal,
and local government may report on climate-change-related expenditures on a voluntary basis for their
own purposes, at the request of statistics agencies, or to comply with national regulatory requirements.
Off-budget expenditures, such as quasi-fiscal operations, government guarantees, and tax
expenditures, allow governments to subsidize activities without revealing their costs or naming
beneficiaries. This leads to policies whose fiscal impact will only be felt later, when quasi-fiscal
operations have to be covered by government, when taxes are due, and when guarantees are called.
The lack of transparency around off budget expenditures increases fiscal risks. Solutions lie in making
these subsidies explicit, whether through periodic reporting or, better still, by replacing them with
transfers that are reported as expenditures. Costing of off-budget expenditures, however, can be
technically challenging. Where such analysis is not possible, simply listing the quasi-fiscal operations, tax
expenditures, and guarantees may be sufficient to provoke debate on their policy relevance.

180
National climate change funds, extra-budgetary funds that have emerged as an important part of
climate change finance, can be used effectively. While proliferation of extra-budgetary funds should be
discouraged because they undermine effective resource allocation, expenditure control, and cash
management, there is a case for their selective use in addressing such policy issues as climate change. If
national climate change funds are to function effectively, however, they have to be embedded in the
broader climate change policy, planning, and financial management structure. The starting point must
be to ensure that there is a clear rationale for the national climate change fund, identifying where the
fund adds value in relation to the existing institutional structure and ensuring clarity of roles and
responsibilities.
Environmental auditing has emerged as an important field of work for supreme audit institutions,
which is now being applied to the challenge of climate change. Financial audits of climate change
assess the authorities’ reporting on climate-change-related transactions, assets, and liabilities and how
funds are applied to support climate-change-related policies and programs. Compliance audits assess
the extent to which public institutions undertake their activities in accordance with environmental laws,
standards, and policies. Performance audits assess the efficiency and effectiveness of climate change
policies and institutions. In practice, the financial, compliance, and performance dimensions of audits
are combined as part of an audit plan that focuses on risks.
The rest of the chapter is structured as follows. Section 6.2 reviews the budget and expenditure
planning process and identifies the entry points for climate change policy. It also highlights the
difficulties that policy makers are likely to encounter in shifting resources in support of emerging policy
objectives (such as climate change) and shows how a medium-term expenditure planning perspective
and a strengthened budget review process can help address these constraints. Section 6.3 discusses how
many if not most of the expenditure decisions that impact on climate change are made outside of the
budget and expenditure planning process. Section 6.4 discusses National Climate Change Funds and
provides recommendations on their design to increase their functional efficiency. Finally, Section 6.5
provides a brief review of climate change auditing.
6.2. BUDGETING AND EXPENDITURE PLANNING
Main Issues
The budget process combines a top-down, whole-of-government policy framework led by central
finance and planning agencies with a bottom-up process of expenditure planning by spending
agencies. Box 6.1 provides an overview of a stylized budget process. The institutional dynamics
underlying the process may be characterized by tension between the central finance and planning
agencies, pursuing government-wide policy objectives (including expenditure constraints to meet fiscal
sustainability objectives), and the spending agencies, seeking to maximize the resources available for
agency-specific policy and institutional objectives. This tension between “guardians” and “advocates” is
resolved through negotiations that lie at the heart of the budget process.
Climate change mitigation and adaptation differs from many other policy objectives in that there is no
single institutional advocate. Spending agencies may pursue climate change policies where these are
181
aligned with agency objectives and interests—but this will not always be the case. Environmental
agencies may be expected to serve as advocates for mitigation but they lack effective levers to influence
other spending agencies’ resource allocation decisions. Environmental agencies may be able to offer
incentives for spending agencies to undertake climate-change-related expenditures through earmarked
funding, but this will not impact on base expenditures and the level of funding is likely to be modest in
relation to the overall budget.
Central finance and planning agencies’ engagement is essential if climate change policies are to be
reflected in the budget. The instruments available to the central finance and planning agencies to
influence resource allocations are reviewed below. The effectiveness of these instruments depends in
part on structural features of the budget process. Central finance and planning agencies will tend to
have greater influence over resource allocation when resources are consolidated under their
management in a common pool as opposed to in cases when spending agencies have access to
alternative sources of funding (e.g., earmarked revenues or external assistance) and have power to
allocate these in line with their own institutional objectives, which can contradict those of the central
agencies. Consolidation of parallel - both recurrent and investment - budgeting processes under a single
central agency bolsters the central finance agency’s authority. So too does the enforcement of agency-
level budget ceilings at the start of the budget process, statutory requirements for agencies to report on
off-budget expenditures, and the adoption of a medium-term perspective to expenditure planning.
These controls are regarded as necessary features of modern budget systems. Institutional
arrangements will also play a role. Where the government’s decision making is hierarchical and resource
allocations are negotiated bilaterally between the central finance agency and individual spending
agencies, the central agency will tend to have greater authority than in governments, where decisions
are made by consensus.
Where climate change is an important policy agenda, climate policy measures will typically be laid out
in pre-budget statements, the budget circular, and administrative guidelines issued at the start of the
budget process. In the U.K., for instance, the Treasury’s Pre-Budget Report highlighted revenue and
expenditure measures in support of environmental and climate-change-related policies.304 In South
Africa, policy commitments (such as the proposed carbon tax and establishment of a fund for green
economy initiatives) are announced in the medium-term budget statement.305 The budget circular,
meanwhile, supports implementation of these policies by providing guidance on the presentation of
climate-change-related expenditures in the agency budget proposals. The Philippines Budget Circular,
for example, requires agencies to categorize programs according to the government’s five priority
spending areas, one of which corresponds to environment and climate change mitigation and
adaptation.306
304
See, for example, HM Treasury (2009). Pre-Budget Report 2009: Securing the Recovery: Growth and Opportunity. See specifically Chapter 7: Supporting Low Carbon Growth. 305
See, for example, National Treasury (2011). Medium Term Budget Policy Statement 2011. Republic of South Africa. 306
Department of Budget and Management (2012). National Budget Circular, No. 543, October 10, 2012. Republic of the Philippines.

182
Box 6.1. A Stylized Budget Process
1. The central finance and planning agencies initiate the budget process 6-9 months before the start of the fiscal year by preparing a pre-budget policy document that lays out the macroeconomic framework and proposes the broad allocation of resources in line with government plans and policies.
2. This policy statement is generally approved by the government.
3. The central finance and planning agencies issue a budget circular which contains instructions and policy guidance based on this policy statement. This document will lay out the resource allocations that agencies should use for budget formulation; this is typically an agency budget ceiling broken down by major categories of expenditure (i.e., capital investment, payroll, and other recurrent expenditures). In some cases, central agencies may specify allocations related to major government policy objectives or for major programs, and to distinguish the expenditures for ongoing and new policy initiatives.
4. Agencies prepare budget proposals that allocate resources between departments, programs, and projects in line with sectoral policy and submit these to the central agencies.
5. The central finance and planning agencies assess whether each agency’s proposal is within expenditure limits and aligned with the government’s policy objectives. Since agency proposals often exceed budget ceilings or differ in their interpretation of the government’s priorities, each agency’s final budget is usually the product of negotiations between the central agency and the spending agency.
6. The central finance agency consolidates agency budgets into a state budget.
7. The state budget is approved by the government.
8. The state budget is submitted to the legislature appropriations committee for legal authorization to spend funds. In most parliamentary systems, the legislature has limited authority to alter the budget proposal submitted by the executive. In many congressional systems, the legislature may adjust agency and program allocations, usually within the overall expenditure limits set by government.
9. Once the budget is approved, the central finance agency releases funds to spending agencies according to the availability of funds in the central treasury account, rationing funds allocated to spending agencies as necessary.
10. Spending agencies execute the budget and implement plans, providing periodic reports on progress. These reports should include information on any expenditure that is not executed through the central treasury account. Some countries have institutionalized a formal mid-year budget review to adjust allocations across the whole of government. Others adjust agency allocations on an ad-hoc basis as needs arise. Adjustments to the legislature’s appropriations require a legislative budget amendment.
11. Final accounts are usually prepared within 3-6 months of the end of the fiscal year.
12. Final accounts are subject to an independent audit within 6-12 months of the end of the year.
1: Central agencies propose macro and budget framework
2: Government
approves guidelines
and ceilings 4: Spending agencies prepare expenditure
plans
5: Central agencies & spending agencies negotiate budgets
6: Central agencies consolidate State
Budget
8: Legislature debates, (amends) and approves State Budget
7: Government
approves Budget and
submits to Legislature
9: Central agencies
release funds to
spending agencies
10: Spending agencies execute budget & report
12: Audit Authority reports on financial
statements
11: Central finance
agency prepares financial statements
3: Central Agencies
issue budget circular
and ceilings
183
Annual budgets offer limited scope for adjusting resource allocations in line with emerging policy
priorities. Budgets normally evolve incrementally over the years, given that the bulk of resources are
effectively committed to ongoing programs, contractual obligations, debt servicing, and mandatory
expenditures. How much fiscal space is created for discretionary spending is set by the rate of growth in
revenues and the sustainable level of financing. Limited resources can be released from base
expenditures as ongoing programs have legal obligations to staff and suppliers. Annual budgets,
therefore, offer little room for maneuver when resources are needed for emerging priorities.
Medium-term expenditure frameworks (MTEFs) facilitate adjustments in resource allocations and
their alignment with new policy priorities (such as climate change), and they provide a predictable
basis for agency expenditure planning. MTEFs have become widespread since the mid-1990s, and 132
countries have introduced some form of medium-term expenditure plan. In its simplest form, currently
found in 71 countries (and 18 of 33 low income countries), a top down medium-term fiscal framework
lays out allocations to spending agencies over a 3-5 year period. These top-down expenditure ceilings
provide the basis for agencies’ expenditure planning. In its more sophisticated form, currently found in
42 countries (and 14 of 33 low income countries), a medium-term budget framework reconciles top-
down expenditure limits with agencies’ bottom-up expenditure plans.307
Box 6.2. Creating Fiscal Space for Green Growth in the Republic of Korea
In February 2009, President Lee Myoung Bak announced a Green Growth Vision as a guiding framework for the Republic of Korea’s development. A Presidential Green Growth Committee, chaired by the prime minister and with representatives from key government agencies and the private sector, was appointed to oversee development of the green growth strategy and its implementation. Sector agency staff were appointed in key agencies to identify suitable projects. In July 2009, the government approved a Green Growth Plan (GGP) proposing 117 trillion South Korean won (SKW)* of investment over a 5-year period (2009-2013) for 678 fiscal supporting projects implemented by 26 agencies; the plan included both new projects and ongoing projects redesigned to bring them in line with the green growth strategy. The proposed investments amounted to 7-8 percent of public spending, or 1-2 percent of GDP annually during the plan period.
Mobilization of resources on this scale without increasing the deficit posed a significant challenge. Korea’s budget flexibility is constrained by statutory payments, with approximately 40 percent of revenues earmarked for local government and education authorities and a similar amount assigned to social welfare transfers. The bulk of the funds were mobilized through an expenditure review process, cutting expenditures in programs with low execution rates, programs identified as poor performers by the Board of Audit and Inspection Review, and those considered low priority by the Office of the Prime Minister. Additional resources were mobilized by a 10-percent cut in general government administration expenses and a 2-year freeze on government officials’ pay. The medium-term expenditure framework allowed the government to program these adjustments over a 5-year period, making further adjustments in allocations each year. As a result, the government was able to deliver resources broadly in line with the original Green Growth Plan, even slightly exceeding targets in the final years of the plan period.
* Annual average exchange rate, SKW to 1 $US: 1,275 (2009); 1,155 (2010); 1,107 (2011); 1,126 (2012); 1,094 (2013). Source: Young-Kyu Kang (2013). Financing South Korea’s Green Growth Plan. World Bank.
A medium-term perspective is particularly important where the government seeks to shift resources
toward emerging policy priorities including climate change. Fiscal space increases in the out years of
307
World Bank (2012). Beyond the Annual Budget: Global Experience with Medium Term Expenditure Frameworks.
184
the medium-term expenditure framework as base revenues increase and commitments lapse. Funds can
be moved from lower priority sectors and programs by holding allocations constant or by cutting
spending in the out years of the planning horizon. Armed with information on resource allocations two
or more years ahead, decision makers can plan adjustments in programs to accommodate increases and
decreases in funding. Box 6.2 illustrates how the Republic of Korea shifted resources in support of its
green growth strategy.
A medium-term perspective also helps instill discipline in sector-level expenditure planning. Sector
plans translate policy objectives into program and project level resource allocations by linking
expenditures to the intended outputs and outcomes of public policy. Rigorous costing of programs helps
focus attention on what can realistically be delivered, forcing sector-level decision makers to consider
tradeoffs, priorities, and the appropriate sequencing of interventions. MTEFs facilitate this process by
setting a ceiling to budget projections, which then imposes on agencies the need to identify priorities
that come on line if additional resources are made available. In the absence of resource constraints set
by MTEFs, sector plans can turn into wish lists offering possible interventions that provide little useful
guidance to decision makers.
The challenge for sector agencies is to link climate change policies and expenditure planning to their
operational work. Some countries simplify their planning and budgeting processes by applying
standardized costs or norms, such as a unit cost per student for schools or unit costs per kilometer for
road construction and maintenance. Where this is the case, standardized costs need to be updated to
reflect climate change policy (e.g., increasing the unit costs for road construction to take into account
more frequent and more intense storms). Realistic costing of climate change-related programs and
projects is more likely to result from planning processes that bring together sector agency planning
units, operational departments, and finance agencies’ staffs. This has been the experience from poverty
reduction planning. Also important are processes that link agency-level negotiations on resource
allocations to reviews of program and project-level performance and to the expected results of public
spending (Alonso et al. 2005).308
Central finance and planning agencies review spending agency budget proposals and expenditure
plans to determine whether whole-of-government policy objectives, such as climate change, are
adequately addressed and resourced. Typically, central agencies focus on the policies, projects, and
programs where the agency proposes to increase expenditures. As a result, base expenditures (i.e.,
those related to current policy) may not be subject to review unless there are pressures to curtail
expenditures. Spending agencies are usually required to highlight and justify expenditures arising from
new policy initiatives in their budget submissions. Central agencies tend to react to the spending
agencies’ proposals rather than actively promoting policy objectives. Consequently, central agency staff
are unlikely to promote the reallocation of resources toward climate change objectives unless there are
specific instructions to do so. The review or challenge function can be formalized by issuing specific
guidelines on how climate change should be addressed in agencies’ budget proposals, such as requiring
308
Alonso, Rosa, Lindsay Judge, and Jeni Klugman (2005). PRSPs and Budgets. A Synthesis of Five Case Studies.

185
a description of climate change policy objectives and an explanation of how these are reflected in the
budget proposal. Consolidating this information in the final budget documentation further underlines
the policy priority and forces central agency staff to pay particular attention to climate change policies.
The requirement for formal approval of new projects provides an opportunity to integrate climate
change considerations into the project selection and appraisal process. This generally runs parallel to
the budget process, notably so where a country operates dual budgets (i.e., an investment or
development budget managed by a central planning agency and a recurrent budget managed by the
central finance agency). Where dual budgets are in place, as is the case in most of South Asia, the
central planning agency will issue specific guidance and oversee project screening and appraisal.
Projects are identified and designed by the spending agencies. They are then reviewed by the planning
agency to determine whether they satisfy selection and appraisal criteria; if approved, the projects will
be included in the public investment program (PIP), which schedules project financing from domestic
and external sources over a 3-5 year period. The PIP may include a pipeline of projects that have yet to
be financed. The central finance agency then allocates resources to priority projects in the PIP through
the annual budget. Even when the investment and recurrent expenditures are consolidated in a unified
budget, managed by the central finance agency, investment and development projects are still subject
to specific review procedures which typically take place outside of the budget process. Specific
screening and appraisal criteria can be used to ensure that the climate change dimensions of investment
projects are taken into consideration. This may include criteria that address low carbon objectives,
climate change risks, and uncertainty. Assessment of climate change risks is particularly important to
identify to avoid maladaptive “lock-ins” for major programs or investment projects (see Chapter 3).
Specialist climate change policy units or committees can support this review or challenge function.
Central finance and planning agency officials’ limited capacity to understand climate change policy
issues and their implications for particular sectors may hinder effective integration of climate change
policies. Awareness raising and training can strengthen this capability. Central finance and planning
agencies can also involve specialist climate change institution in the review process. This may range
from advisory support, such as commenting on a budget policy or on budget proposals’ review criteria
from a climate change perspective – to more formal involvement in the review of specific programs and
projects (see Chapter 7). Inter-ministerial arrangements for coordinating climate change strategy
significantly differ by country. The coordinating committees on climate change can be headed by the
prime minister, by the minister of environment, or by the head of another government agency, and can
include different ministries and government agencies (Table 6.1)

186
Earmarking, Budget Targets, and Virtual Funds
Central finance and planning agencies can create incentives for the financing of climate change
interventions by earmarking specific resources for this purpose. In Vietnam, the Ministry of Finance
and the Ministry of Natural Resources and Environment (MONRE) have set aside part of the external
finance provided as budget support under the Support Program to Respond to Climate Change to
finance climate change projects identified by spending agencies and local governments. For this
additional availability to translate into actual climate expenditures, MONRE has established an inter-
ministerial council to select investment projects based on the climate action criteria approved by the
prime minister. 309 The requirement for programs and projects to be approved for financing provides an
opportunity for the gatekeeper (the central finance or planning agency, specialist climate change
agency, or committee established for this purpose) to verify that applicants comply with the criteria
used by the government to select and prioritize climate change interventions. However, since the review
mechanism applies only to new programs and projects, there is little incentive for agencies to
restructure their base expenditures (i.e. ongoing programs and projects). Furthermore, the level of
financing available for climate change initiatives from budgetary support operations may be modest as it
will be part of the overall development assistance financing envelope. Funding from domestic resources
to complement external financing could come from earmarking revenues from carbon pricing initiatives
and green taxes.
309
World Bank (2011). Program Document Vietnam First Climate Change Development Policy Operation. Report 59493-VN.
187
If they are to scale up climate change expenditures, central finance and planning agencies have to
create incentives for the spending agencies to realign both ongoing and new programs and projects
with the government’s climate change objectives. Setting budget targets for the level of climate change
spending is one way of achieving this goal. Budget targets provide a basis for negotiating agency
allocations in support of these objectives through the budget preparation and review process. The
overall budget target for climate change expenditures will reflect political rather than technical
considerations, since there is no technical means of determining an optimal allocation. As such, the
targets serve partly as a signaling device, demonstrating the government’s commitment to climate
change objectives and setting expectations for agencies to restructure their ongoing programs. The
higher the target is set above the projected growth in fiscal space, the deeper the required restructuring
of base expenditures. The European Council has set a target of having 20 percent of the resources
allocated through its 2014-2020 Multi-Annual Financial Framework being used to support climate
change initiatives. Rather than allocating these resources through specific programs, the Council argues
that climate change action should be mainstreamed across its interventions “to ensure that they
contribute to strengthening energy security, building a low-carbon, resource efficient, and climate
resilient economy that will enhance Europe's competitiveness and create more and greener jobs.”310
In order for climate change budgetary targets to be effective, the central and spending agencies have
to put in place systems for target setting and monitoring. The extent to which these systems are
compliance oriented will depend on whether the targets are “hard” (enforced throughout the budget
process with little room for adjustment) or “soft” (open to negotiation and adjustment during budget
preparation and execution). The systems needed to support this function comprise four elements:
The central finance and planning agencies have to determine how targets should be applied across
government so that the sum of agency climate change expenditures equals the aggregate target.
Because some programs will have closer alignment with climate change objectives than others, a
single target across all agencies and programs is not recommended. Decisions will need to be taken
regarding the appropriate climate change targets at agency and program level. This may be
informed by assessing the alignment between agency and program expenditures and the
government’s climate change objectives.
The central finance and planning agencies have to determine the criteria that define climate change
expenditures and provide guidance on the presentation of these expenditures in the budget
submission and budget documents used for the government’s decision making and in
communications with the legislature. Some of the methods used to classify climate-related
expenditures are addressed in Chapter 7.
Central and finance authorities have to put in place a robust budget review process to ensure that
the spending agencies are applying the climate change criteria appropriately. While targets may
provide an incentive for agencies to restructure ongoing programs and projects, they also create a
temptation for agencies to “green-wash” programs so that they appear to be aligned with climate
310
European Council (2013). European Council, 7/8 Feburary 2013, Conclusions: Multi-Annual Financial Framework. EUCO 37/13.

188
change objectives without actually contributing to these ends. Climate change criteria and guidance
can mitigate this risk, but the fact that climate change interventions are often embedded in
programs with other objectives means that decisions regarding the policy alignment of programs
and projects will often be a matter of judgment.
The government’s financial reports will need to generate information that allows the central finance
and planning agencies to monitor resource allocations during budget execution and for the end-of-
year reporting.
Virtual fund arrangements have been used to reallocate resources in support of cross-cutting poverty
reduction objectives and could be applied to climate change. Virtual funds formalize the systems used
to set and monitor hard budget targets in support of a particular policy objective. They are managed by
central finance and planning agencies through the existing budget process and do not require specific
legislation. In Uganda, a virtual fund proved to be an effective tool for shifting resources to poverty
reduction objectives (Box 6.3), albeit in the context of a rapidly growing budget base and the earmarking
Box 6.3. Virtual Poverty Fund
The Government of Uganda established a Poverty Action Fund (PAF) in 1998 to redirect expenditures in support of its Poverty Eradication Action Plan (PEAP). The PAF fulfilled the Government’s commitment to earmark resources mobilized through debt relief under the Highly Indebted Poor Countries (HIPCs) initiative to directly benefit the poor.
The reallocation of resources was achieved by creating a “virtual poverty fund” which tagged specific poverty reduction expenditures in the budget documents and reports while consolidating all budgetary resources for the purposes of treasury management and budget execution. Eligible expenditures had to meet PAF criteria: they had to be directly poverty reducing, they had to deliver a service to the poor; and they had to be based on a well-developed plan. Five areas of spending were selected: primary education; primary health care; water and sanitation; rural roads; and agriculture extension. The budget documents distinguished allocations to these PAF programs from HIPC, from donors, and from the government’s own resources. PAF resources were shown as additional to the government’s own budget allocations to PAF programs in the 1998 budget, and the Government committed to increase its PAF allocations as a proportion of the overall budget starting in 2002. The Government also committed to protecting PAF expenditures from budget cuts during budget execution, provided that performance was on track. Government departments were required to report on the implementation of PAF expenditures and budget execution. Funding was set aside for monitoring and auditing activities.
PAF successfully delivered against these commitments. PAF expenditures increased from 19 percent of the budget in 1998 to 36 percent in 2003. PAF also attracted significant additional external financing. PAF expenditures were protected from in-year budget cuts. They were subject to enhanced budget reporting and review with a greater focus on results. PAF did create some rigidity and inefficiency, however, in resource allocations. By focusing on a narrow range of expenditures, PAF may have increased spending in some sectors at the expense of expenditures that would have generated higher economic returns and poverty reduction impacts. Since PAF programs were protected from cuts, any cash flow constraint fell disproportionately on other areas of expenditure, thus impacting their performance.
The PAF model was adopted by other HIPCs, albeit with some adjustments. Tanzania, for example, replaced a rigid definition of eligible PAF expenditures with a more flexible definition that allowed all spending agencies to identify their poverty reduction expenditures. This allowed HIPC resources to be shared more broadly across the government. While it could be argued that the poverty reduction impact of these expenditures was uneven, the broader base of PAF expenditures allowed greater flexibility in resource allocation and reduced the impact of any in-year cash-flow constraints at agency level.
Source: Sudharshan Canagarajah and Tim Williamson (2006). Uganda’s Virtual Poverty Fund: Pro-Poor Spending Reform, World Bank PREM Note No. 108, March 2006.

189
of significant external and domestic financing to the fund. The particular advantages of the virtual fund
approach in the context of climate change are that it can increase the visibility of climate change
expenditures throughout the budget process and thereby facilitate monitoring of budget allocation
commitments. The extent to which a virtual fund can provide incentives to restructure ongoing
programs in support of climate change objectives will depend on the share of overall expenditures
allocated to the virtual fund (i.e., the larger the share the stronger the incentive) and the robustness of
the review process (to avoid green-washing of the programs).
Use of earmarks, allocation targets, and virtual funds to promote climate change interventions is not
without risk, particularly to the quality of spending. Allocations in support of policy objectives such as
climate change can exceed the supply of viable programs and projects. This can, in turn, lead agencies to
undertake climate change activities that have a lower economic return than alternative applications of
funds. Inefficiencies in the allocation of resources are more likely when the share of aggregate
expenditures that is targeted to one particular policy objective is high. Inefficiencies in resource
allocations tend to be exacerbated where the flow of funds during budget execution is unpredictable
and financing constraints fall disproportionately on particular programs. In order to mitigate these risks,
central finance and planning agencies need to set expectations on the performance of climate-change-
related programs and projects in relation to the performance expectations of programs and projects
supporting other policy objectives.
Long-Term Expenditure Planning
For most developing countries the expenditure planning horizon is restricted to the annual budget
and the 3-5 year period covered by the medium-term expenditure framework. The expenditure
planning process focuses attention and resources on problems that can be readily identified and on
implementation and results that can be delivered in the short-to-medium term. This time frame
coincides with the political cycle. Decision makers throughout the budget and expenditure planning
process have little incentive to shift their attention from immediate problems to those that might occur
in the long-term, just as they have little incentive to incur short-term costs for uncertain long-term
gains.
When longer-term fiscal forecasts are prepared, they are usually for the purpose of assessing fiscal
sustainability, which is narrowly defined in terms of financial solvency. The World Bank and
International Monetary Fund generate forecasts over a 30-year period, and sometimes longer, for the
purpose of assessing debt sustainability. Forecasts for these purposes tend to be limited to projections
of aggregate revenues, expenditures, and financing. They may use stress tests to assess the impacts of
adverse economic scenarios and incorporate some of the major expenditure and revenue developments
that can be factored in with some certainty. Otherwise, they assume that the underlying fiscal policies,
expenditure allocations, and policy context will remain unchanged.
This short-to-medium-term perspective fails to capture the fiscal implications of economic, social, and
environmental challenges that will emerge over the long-term (such as demographic, climate, and
technological changes). This may lead governments to underestimate future financial obligations and,

190
as a result, make inadequate provisions or adopt overly optimistic expenditure plans. Policies and
activities undertaken today may impose costs on future generations, raising intergenerational equity
concerns. Governments may make decisions that inadvertently expose future generations to greater
risks by locking-in unsustainable development paths. They may miss the opportunity to adjust current
policies in such a way as to mitigate risks and reduce future costs. The government’s failure to address
long-term challenges may also influence the behavior of other actors. Households, communities, and
businesses may also ignore these challenges, or they may overcompensate, anticipating that the state
will fail to address challenges when they arise. For all of these reasons, there is a strong case for
governments to adopt a longer-term perspective in financial planning.311
All OECD countries now undertake long-term fiscal forecasting focused on the major risks to fiscal
sustainability. This is a relatively new development for most OECD countries (started in the mid-1990s).
About half of these planning exercises are conducted annually; most of the remainder are undertaken
every 3-4 years. The time frames used fall between 25-70 years. The forecasts are almost exclusively
focused on demographic changes and the implications for health, education, pension, and welfare
expenditures. 312
A handful of OECD countries have recently started to consider the long-term fiscal impacts of climate
change. The central finance agencies of the United Kingdom and Australia each discussed climate change
risks in long-term forecasting exercises prepared in 2010.313 Both forecasting exercises acknowledged
the importance of taking action on mitigation now to reduce GHG emissions and argued that market-
based policies, notably carbon pricing, will promote significant investment in low-carbon technologies
and infrastructures (with the costs covered largely by the private sector). Public sector spending in
support of mitigation is expected to be modest, focused on research and development, awareness
raising, and behavioral change. Where the strategies differ is in their treatment of adaptation, reflecting
differences in the expected climate change impacts. The U.K. Treasury anticipated that increased
investments will be needed to protect the economy from more extreme events; these were not
considered a significant cost. The costs of failing to adapt were not assessed. Australia is one of the
driest in the world and the impact of climate change will be severe. The Australian Treasury drew on the
results of the Garnaut Climate Change Review, arguing that “unmitigated climate change would leave
Australian GDP in 2100 approximately eight percent lower than the level it would be in the absence of
climate change, with even greater impacts on consumption and real wages. This is equivalent to losing
around $17,000 per person (in current prices) from the Australian economy in 2100. Moreover,
unmitigated climate change involves significant risks and non-market costs not captured by such
estimates.” While Australia attempted to quantify the potential economic costs, the long-term public
finance report did not mention provisions for additional public spending on adaptation.
311
For an overview, see Heller, Peter (2003). Who will Pay? Coping with Aging Societies, Climate Change and other Long-Term Fiscal Challeng. IMF. 312
Anderson, Barry and James Shepherd (2009). “Fiscal Futures, Institutional Budget Reforms, and Their Effects: What Can Be Learned?” OECD Journal on Budgeting, Volume 2009/3, pp. 7-117. 313
HM Treasury (2010.) Long-term Public Finance Report: An Analysis of Fiscal Sustainability., and Commonwealth of Australia (2010). Australia to 2050: Future Challenges.

191
For most governments, the first step in any long-term expenditure planning exercise is to simply take
stock of climate change impacts, the fiscal risks that may arise, and their implications for current
policy. Risk assessment is a useful exercise in itself, identifying the areas where the government has to
take action today to address long-term challenges. The U.S. Government Accountability Office (GAO)
added climate change to its “High Risk List”–a list of 30 current issues that have significant fiscal
implications and merit immediate attention–for the first time in 2013.314 The GAO assessment identified
five issues: lack of a strategic and coordinated approach to climate change across government; risks to
the government as a property owner (including extensive land and forest holdings); risks to the federal
flood and agricultural insurance programs arising from the changing frequency and intensity of extreme
weather events; risks arising from unfunded contingent liabilities related to disaster relief; and risks
Box 6.4. Estimation of Climate Change Impacts on Infrastructure Replacement Costs in Alaska
The impact of climate change on the replacement costs of infrastructure in Alaska was modeled for the periods to 2030 and 2080, drawing on climate change projections and data on the stock of public infrastructure (covering transport, water, energy, communications, social services, and law enforcement). The model assumes that the stock of infrastructure remains constant, that infrastructure is replaced as it wears out, and that no new infrastructure is built. Climate change will damage the infrastructure through the thawing of permafrost, increased flooding, and coastal erosion. Replacement costs included both increased maintenance and accelerated replacement.
Replacement costs were estimated under three scenarios: (1) the costs without climate change; (2) the costs under each of the climate change projections and assuming that infrastructure is replaced reactively to meet the needs of prevailing conditions as climate change takes place (and assuming no strategic adaptation in anticipation of climate change); and (3) the costs under strategic adaptation scenarios, with changes in the design of infrastructure taking into account projected climate change throughout the life of the infrastructure. The model calculated the net present value of the additional replacement costs for public infrastructure through 2030 and through 2080 under each of these scenarios. Repeated model runs were used to estimate the range of possible costs.
The model highlights the substantial replacement cost of infrastructure even without climate change, estimated at $32 billion to 2030 and $56 billion to 2080. Climate change could add 10-20 percent to replacement costs by 2030 depending on the climate change projection and the extent to which replacements incorporate design adaptations. Additional replacement costs actually drop to 10-12 percent by 2080 because agencies have more time to adapt. Investments that anticipate adaptation requirements are found to offer significant savings in the longer term, reducing replacement cost by up to 13 percent to 2030 and 10-45 percent to 2080. Most of the additional replacement costs are incurred in relation to transport infrastructure and water and sewer systems.
Additional Replacement Cost for Infrastructure, US$ Billions, Net Present Value
Period No
Climate Change
Warm Warmer Warmest
No Adaptation
With Adaptation
No Adaptation
With Adaptation
No Adaptation
With Adaptation
2006-30 32 3.6 3.6 6.1 6.0 7.0 6.1
2006-80 56 6.2 5.6 10.6 7.6 12.3 6.7
Source: Larsen, Peter and Scott Goldsmith (2007). How Much Might Climate Change Add to Future Costs for Public Infrastructure? University of Alaska Research Summary No. 8, Institute of Social and Economic Research University of Alaska Anchorage.
314
Government Accountability Office (GAO) (2013). High-Risk Series: An Update. Report to Congressional Committees.

192
arising from a lack of adequate, site-specific information for decision makers at all levels of government.
Risk identification does require an understanding of the climate change impacts and their implications,
but it does not necessarily require the government to quantify these risks and their expenditure
implications.
Estimating the costs of adaptation poses significant challenges for financial planners given uncertainty
regarding future impacts, the nature of the policy response, and the implications for current policy.
Various estimation exercises have been undertaken (many at a global level, with some focusing
regionally or on specific sectors). Most of these forecast the economic cost of adaptation rather than the
financial costs to the public sector. Box 6.4 illustrates a bottom-up approach to the estimation of climate
change impacts on the replacement cost of infrastructure in Alaska. This approach is closer to the kind
of costing exercise that agencies undertake in developing their medium-term expenditure plans. In
order to conduct this analysis, agencies need information on the most likely climate change scenarios;
an analysis of the implications of these scenarios for the supply and demand of government services;
and an analysis of the design considerations that are likely to impact on costs. Simply identifying these
cost drivers is an important step in understanding the likely climate change impacts on program costs.
There are significant data constraints for this kind of exercise, however, and not only related to climate
change. The Alaska study had a variety of data issues, including a lack of complete inventories of public
infrastructure and a lack of information on original cost, current value, replacement, and life-cycle costs
for the infrastructure that could be identified. Lack of accurate cost information for assets and services
adds an additional margin of error to forecasts that are already very broad.
6.3. RESOURCE ALLOCATION OUTSIDE THE BUDGET PROCESS
Many public sector resource allocation decisions that are relevant to climate change are made outside
of the budget process. These typically include externally financed expenditures, both from development
assistance and climate change finance; mandatory expenditures; expenditures of autonomous entities,
state-owned enterprises, and local government; and off-budget expenditures related to quasi-fiscal
operations, government guarantees, and taxes. Climate change expenditures may be included, and
indeed may be significant, in all of these categories. The challenge for central finance and planning
agencies is first and foremost to track and report on these expenditures, ideally in budget
documentation. Once information is available in a context which reveals the financial implications of
allocation decisions taken outside of the budget, decision makers are better placed to assess the trade-
offs between alternative uses of funds and to align resources with government policy objectives.
External Finance
For many developing countries, a substantial portion of public expenditures are externally financed,
usually from official development assistance but increasingly also from dedicated climate funds.
External financing was less than one percent of gross national income (GNI) on average in 2000-10 for all
developing countries and nearly 10 percent of GNI for the Low Income Countries (and substantially more
for post-conflict countries and small island states). Over the same 10-year period, however, external
assistance averaged 67 percent of GNI in Liberia. Since an important and growing share of the external
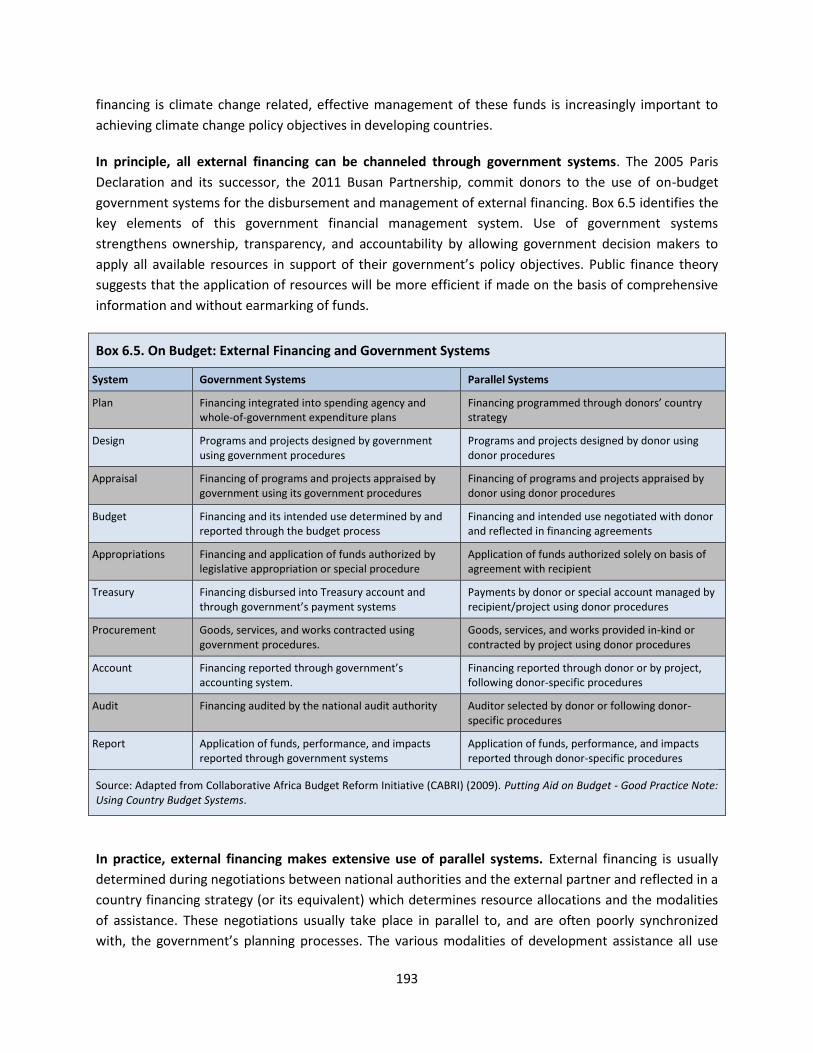
193
financing is climate change related, effective management of these funds is increasingly important to
achieving climate change policy objectives in developing countries.
In principle, all external financing can be channeled through government systems. The 2005 Paris
Declaration and its successor, the 2011 Busan Partnership, commit donors to the use of on-budget
government systems for the disbursement and management of external financing. Box 6.5 identifies the
key elements of this government financial management system. Use of government systems
strengthens ownership, transparency, and accountability by allowing government decision makers to
apply all available resources in support of their government’s policy objectives. Public finance theory
suggests that the application of resources will be more efficient if made on the basis of comprehensive
information and without earmarking of funds.
Box 6.5. On Budget: External Financing and Government Systems
System Government Systems Parallel Systems
Plan Financing integrated into spending agency and whole-of-government expenditure plans
Financing programmed through donors’ country strategy
Design Programs and projects designed by government using government procedures
Programs and projects designed by donor using donor procedures
Appraisal Financing of programs and projects appraised by government using its government procedures
Financing of programs and projects appraised by donor using donor procedures
Budget Financing and its intended use determined by and reported through the budget process
Financing and intended use negotiated with donor and reflected in financing agreements
Appropriations Financing and application of funds authorized by legislative appropriation or special procedure
Application of funds authorized solely on basis of agreement with recipient
Treasury Financing disbursed into Treasury account and through government’s payment systems
Payments by donor or special account managed by recipient/project using donor procedures
Procurement Goods, services, and works contracted using government procedures.
Goods, services, and works provided in-kind or contracted by project using donor procedures
Account Financing reported through government’s accounting system.
Financing reported through donor or by project, following donor-specific procedures
Audit Financing audited by the national audit authority Auditor selected by donor or following donor-specific procedures
Report Application of funds, performance, and impacts reported through government systems
Application of funds, performance, and impacts reported through donor-specific procedures
Source: Adapted from Collaborative Africa Budget Reform Initiative (CABRI) (2009). Putting Aid on Budget - Good Practice Note: Using Country Budget Systems.
In practice, external financing makes extensive use of parallel systems. External financing is usually
determined during negotiations between national authorities and the external partner and reflected in a
country financing strategy (or its equivalent) which determines resource allocations and the modalities
of assistance. These negotiations usually take place in parallel to, and are often poorly synchronized
with, the government’s planning processes. The various modalities of development assistance all use

194
parallel systems to some extent. Budget support is considered the modality that conforms to the ideal,
since funds are disbursed through the treasury (and thus are spent using government systems), but even
budget support may not be on plan or even on budget if the external financing has not been committed
at the time of budget preparation. External financing for projects may use government or parallel
systems, depending on the donor’s procedural requirements and the extent to which the donor’s
assessments point to fiduciary risks in a particular project context. Loan financing is usually on budget
because the legislature’s approval is generally required to incur debt. Grant financing, particularly for
technical and in-kind assistance, is more likely to use parallel systems. External financing to
nongovernmental, private sector, and local government recipients will use parallel systems since the
government is not the intended beneficiary.
Government practices may not facilitate the integration of external financing with government
systems. Responsibility for the management of external financing is often divided among agencies: the
central finance agency generally assumes responsibility for loan-financed activities; the planning agency
or a dedicated cooperation agency assumes responsibility for grant-financed activities; and, in some
countries, a third specialized climate change agency assumes responsibility for climate finance as the
designated national authority. Coordination and information sharing between these agencies is often a
challenge. Spending agencies can further complicate coordination, particularly where external partners
enter into agreements with spending agencies directly (without informing the coordinating agencies).
Public entities should report all external financing disbursed through government and parallel systems in
their budget and financial reports. For in-kind assistance that is not reported, the implications to on-
budget funding can be unpredictable.
External financing will not be captured in the budget unless specific procedures are put in place. These
requirements should be laid out in the organic budget law and should spell out responsibility for
approval and reporting on external financing. Reporting requirements for borrowing are usually
rigorous, requiring central finance and planning agency approval and, in many countries, also ratification
of financing agreements by the legislature. They tend to be less rigorous for grant financing, where
authority for approval of grant-financing agreements may be delegated to the cooperation agency or
the climate change designated authority. Dedicated information systems are needed to capture
information that flows through these channels, using information reported by the beneficiary entities
and the sources of financing. Ideally, information from both the funding source and the beneficiary
entity is reconciled. In practice, coverage is often incomplete, particularly with regard to reporting of
external financing by entities that do not have in-country representation or that use parallel approval
and reporting channels. This is typically the case where dedicated climate change funds report through
environmental agencies as their designated national authorities. The UNFCCC is attempting to agree on
a supervised monitoring, reporting and verification framework for climate change finance. If designed to
cover all external sources of climate finance, the framework would effectively systematize reporting for
every developing country and ensure that comprehensive information on external sources will be
available to central finance and planning agencies.

195
Mandatory Expenditures
In many countries a substantial number of the expenditures reported in the budget are mandatory
expenditures: the purpose of the expenditure and its amount are determined not by the budget
process but by separate legislation. Mandatory expenditures account for over 60 percent of primary
government expenditures across the OECD, and this percentage is trending up. 315 The rationale for
establishing mandatory expenditures lies in ensuring predictability of funding for program beneficiaries.
Payments are made to eligible beneficiary entities using a set formula. Most mandatory expenditures
are entitlement programs: health care and welfare payments to households. However, legislative action
may lead to a wide range of mandatory expenditures including such things as transfers to regional and
local authorities; funding for infrastructure, nutrition, and education; subsidies to the agricultural sector
and for private sector development; and various forms of household and business insurance. Some of
these expenditures are likely to be sensitive to climate change; others may support mitigation or
adaptation policies. Examples include transfers to households under stress, insurance and transfers to a
range of actors following extreme weather events, and subsidies to promote new technologies. While
these expenditures are characteristic for the OECD countries, they also exist in developing countries
(albeit on a more limited scale and generally related to transfers to public institutions and pension funds
rather than to households).316
Mandatory expenditures undermine effective budget management. Mandatory expenditures are
incurred independent of prevailing budget conditions and irrespective of the amount provided for in the
budget. As a result, unplanned increases in mandatory expenditures and other revenue shortfalls will
lead to cuts in discretionary spending or increases in the budget deficit. Mandatory expenditures can be
revoked, revised, or adjusted by legislative action. (Indeed, some may be subject to annual
appropriation, though more often they are permanent appropriations or housed in a statutory fund that
is executed independently of the budget process.317) In practice, however, mandatory expenditures tend
to be left on auto-pilot, and efforts to amend them often prove politically contentious.
From a public financial management point of view, there is a strong case for introducing decision
points in the design of mandatory expenditure programs, including conditional provisions, triggers,
and sunset clauses. Since mandatory expenditures are an important component of public expenditure
and can serve a legitimate purpose, it is important for decision makers to consider how they can be
designed so as to mitigate the risks they pose to fiscal sustainability and effectiveness. Entitlements can
be made conditional on the beneficiary behaving in such a way as to reduce risk exposure. Examples
include using agricultural subsidies to promote crop and income diversification or post-disaster transfers
to promote relocation from flood zones, thereby reducing vulnerability to climate change shocks (see
Box 6.6). Legislation can set triggers, levels of program expenditure which require the legislature to take
action, such as requiring the appropriation of additional expenditures or program reviews to determine
315
Francesco Molteni (2012), Discretionary versus Automatic Public Expenditure, Paris School of Economics, October, 2012, and D. Andrew Austin and Mindy R. Levit (2012) Mandatory Spending Since 1962, Congressional Research Service, March 23, 2012. 316
CABRI and ADB (2008). Budget Practices and Procedures in Africa. 317
William C. Fay and Michelle D. Rodgers (2008). Appropriations for Mandatory Expenditures, Harvard Law School Federal Budget Policy Seminar Briefing Paper No. 17.
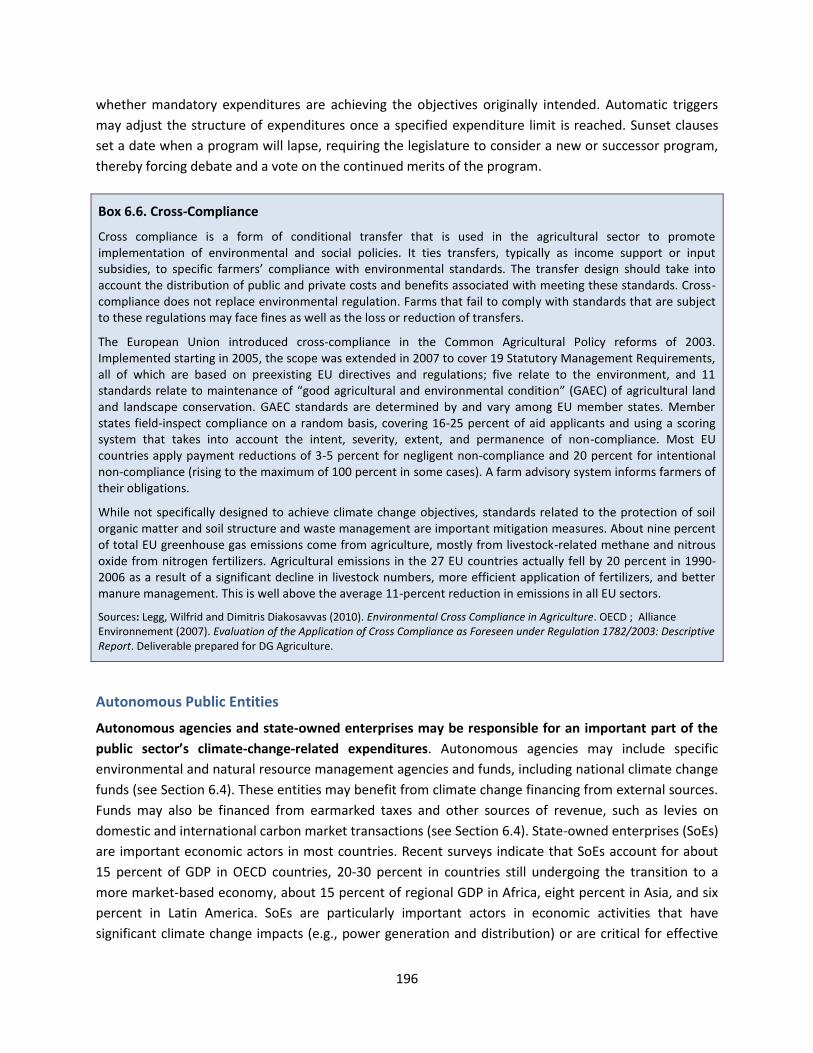
196
whether mandatory expenditures are achieving the objectives originally intended. Automatic triggers
may adjust the structure of expenditures once a specified expenditure limit is reached. Sunset clauses
set a date when a program will lapse, requiring the legislature to consider a new or successor program,
thereby forcing debate and a vote on the continued merits of the program.
Box 6.6. Cross-Compliance
Cross compliance is a form of conditional transfer that is used in the agricultural sector to promote implementation of environmental and social policies. It ties transfers, typically as income support or input subsidies, to specific farmers’ compliance with environmental standards. The transfer design should take into account the distribution of public and private costs and benefits associated with meeting these standards. Cross-compliance does not replace environmental regulation. Farms that fail to comply with standards that are subject to these regulations may face fines as well as the loss or reduction of transfers.
The European Union introduced cross-compliance in the Common Agricultural Policy reforms of 2003. Implemented starting in 2005, the scope was extended in 2007 to cover 19 Statutory Management Requirements, all of which are based on preexisting EU directives and regulations; five relate to the environment, and 11 standards relate to maintenance of “good agricultural and environmental condition” (GAEC) of agricultural land and landscape conservation. GAEC standards are determined by and vary among EU member states. Member states field-inspect compliance on a random basis, covering 16-25 percent of aid applicants and using a scoring system that takes into account the intent, severity, extent, and permanence of non-compliance. Most EU countries apply payment reductions of 3-5 percent for negligent non-compliance and 20 percent for intentional non-compliance (rising to the maximum of 100 percent in some cases). A farm advisory system informs farmers of their obligations.
While not specifically designed to achieve climate change objectives, standards related to the protection of soil organic matter and soil structure and waste management are important mitigation measures. About nine percent of total EU greenhouse gas emissions come from agriculture, mostly from livestock-related methane and nitrous oxide from nitrogen fertilizers. Agricultural emissions in the 27 EU countries actually fell by 20 percent in 1990-2006 as a result of a significant decline in livestock numbers, more efficient application of fertilizers, and better manure management. This is well above the average 11-percent reduction in emissions in all EU sectors.
Sources: Legg, Wilfrid and Dimitris Diakosavvas (2010). Environmental Cross Compliance in Agriculture. OECD ; Alliance Environnement (2007). Evaluation of the Application of Cross Compliance as Foreseen under Regulation 1782/2003: Descriptive Report. Deliverable prepared for DG Agriculture.
Autonomous Public Entities
Autonomous agencies and state-owned enterprises may be responsible for an important part of the
public sector’s climate-change-related expenditures. Autonomous agencies may include specific
environmental and natural resource management agencies and funds, including national climate change
funds (see Section 6.4). These entities may benefit from climate change financing from external sources.
Funds may also be financed from earmarked taxes and other sources of revenue, such as levies on
domestic and international carbon market transactions (see Section 6.4). State-owned enterprises (SoEs)
are important economic actors in most countries. Recent surveys indicate that SoEs account for about
15 percent of GDP in OECD countries, 20-30 percent in countries still undergoing the transition to a
more market-based economy, about 15 percent of regional GDP in Africa, eight percent in Asia, and six
percent in Latin America. SoEs are particularly important actors in economic activities that have
significant climate change impacts (e.g., power generation and distribution) or are critical for effective

197
adaptation (e.g., water supply management). In OECD countries, about half of SoEs by value are
engaged in these activities, and SoEs are the dominant or sole provider of electricity and water in many
countries.
Autonomous agencies and SoEs are usually subject to specific legislation laying out their governance
and financial management arrangements. Governance arrangements will usually hold autonomous
agencies and state-owned enterprises accountable to a board appointed by the executive.318 The central
finance agency and/or the agency responsible for that sector is usually represented on the board and is
tasked with representing the state’s interests. The boards will typically be responsible for operational
management within a broad policy framework defined by the government.
The basis for financial management and reporting for autonomous agencies and state-owned
enterprises is typically laid out in legislation. The law usually requires that the central government’s
budget and financial reports include transactions between the central government and autonomous
agencies and SoEs on a gross basis, distinguishing receipts and expenses. Central government expenses
will be reported as transfers, sometimes with designation for a specific purpose (such as to support
subsidies for electricity pricing) and sometimes not. It is good practice for budget documents to include
summary financial statements for autonomous agencies and SoEs for information purposes. The basis
for accounting and financial reporting by autonomous agencies and SoEs is typically laid out in specific
legislation. This legislation usually requires agencies and SoEs to follow private sector accounting
standards. With some exceptions, these standards do not however facilitate the identification of
expenditures related to specific climate change and environmental objectives.
SoEs may report on their environmental impacts and related financial transactions on a voluntary
basis or where instructed to do so by government shareholders. Framework legislation for the SoEs
generally requires the publication of annual, and possibly, interim financial statements following private
sector accounting standards. These standards typically require reporting environmental issues that are
material to the entity’s financial performance. This usually includes a statement regarding compliance
with regulatory emissions restrictions, and possibly also includes an assessment of the costs of
compliance. SoE boards may decide to provide additional information on environmental activities
following accounting and reporting practices used in the private sector. In July 2012, South Africa’s
Department of Public Enterprises announced that state-owned enterprises would develop a climate
change response plan with the objective of reducing emissions and promoting development of a green
economy. SoEs were asked to set emissions reductions targets that would not compromise their
financial viability. As part of this commitment, the department became a signatory to the UN Global
Compact, a corporate social responsibility initiative that includes environmental goals (see Box 6.7).
Local governments are responsible for a significant share of climate change expenditures that are not
reflected in the central government’s budget and financial reports. Local governments are generally
responsible for urban services, disaster risk management, and natural resource management functions,
all of which can have significant implications for climate change mitigation and adaptation. These and
318
World Bank. State-Owned Enterprise Toolkit

198
other climate-change-related expenditures may be reflected in central government budgets in unitary
states, where local government is administratively dependent on the central government or where
there are earmarked transfers from the central government treasury to finance specific functions or
services provided by local government. Where local authorities are administratively autonomous,
climate change expenditures are financed from local revenues or general fiscal transfers, and the central
government will not have direct access to information on climate-change-related expenditures at the
local level.
Box 6.7: Environmental Accounting and Reporting Standards in the Private Sector
The International Federation of Accountants has issued guidance on environmental management accounting which addresses the use of accounting information to manage environmental impacts, costs, and earnings related to production processes. The guidance advises practitioners to ensure that internal accounting systems generate information that is consistent with UN Standards for Environmental-Economic Accounting requirements. Applications include assessment of potential environmental cost savings, compliance costing, and management of environmental liabilities.
Entities may also adhere to voluntarily reporting standards. The UN Global Compact is the largest voluntary corporate responsibility initiative in the world, with over 10,000 corporate participants and other stakeholders from over 130 countries. Businesses are asked to adhere to 10 principles, three of which relate to environment. Businesses should support a precautionary approach to environmental challenges; undertake initiatives to promote greater environmental responsibility; and encourage the development and diffusion of environmentally friendly technologies. Participating businesses are required to publish an annual Communication on Progress (COP) which explains how the business is implementing the principles. Seventy-seven percent of participating companies are in compliance with this requirement.
An alternative corporate social responsibility framework, the Global Reporting Initiative (GRI), requires more detailed reporting against commitments under its Sustainability Reporting Guidelines. Reporting protocols require disclosure of direct and indirect GHG emissions, initiatives to reduce emissions, and the reductions achieved. GRI currently covers nearly 4,800 organizations, mostly in high-income countries but including some from developing countries. Just over 80 percent of participating entities report on performance indicators for energy generation and production-related GHG emissions (EN16). Reporting on other relevant GHG emissions (EN17) drops to just over 50 percent.
Where applied, these reporting frameworks capture information on mitigation activities and their costs. These reporting frameworks do not, however, generate information on the costs of climate change adaptation.
Sources: International Federation of Accountants (2005). International Guidance Document: Environmental Management Accounting; Global Reporting Initiative (2011). Sustainability Reporting Guidelines; UN Global Compact (2012). Annual Review of Business Policies and Actions to Advance Sustainability: 2011 Global Compact Implementation Survey.
State, municipal, and local governments may report on climate change-related expenditures on a
voluntary basis for their own purposes, at the request of statistics agencies, or to comply with
national regulatory requirements. Local authorities have been proponents of environmental
management accounting and environmental reporting. These tend, however, to be isolated initiatives.
Gathering information on local government climate change expenditures poses a significant challenge
where there is no standardized reporting requirement as a result of differences in the treatment of
climate change expenditures and the fact that multiple authorities at multiple administrative levels may
be responsible for these expenditures. Central statistics agencies may have an interest in standardizing

199
reporting requirements, but they lack authority to enforce reporting. Central finance and planning
agencies, working with the agencies responsible for coordination with territorial administration, can
make transfers conditional on the submission of financial reports. This may improve the quality and
coverage of reporting. However, capacity constraints in local government may limit the extent to which
local authorities are able and willing to generate the detailed financial reports needed to isolate climate-
change-related expenditures.
Off-budget Climate Change Expenditures
Climate change policy may use instruments that have financial implications for government but are
not reflected in budget and financial statements. There are three categories of off-budget expenditures
that are likely to be relevant to climate change expenditure policy analysis: quasi-fiscal operations; tax
expenditures; and contingent liabilities.
Quasi-fiscal operations occur where state-owned banks and enterprises, and sometimes private sector
companies at the direction of the government, use prices that are not “market rate” in their sales and
purchasing in order to achieve a government policy objective. An energy utility may charge the same
price for electricity from renewable energy as it does for electricity from cheaper traditional sources,
effectively cross-subsidizing the provision of renewable energy. A public enterprise may provide non-
commercial services financed from revenues, such as subsidized access to water for irrigation or
household consumption. A national development bank may offer financing for renewable energy
projects or for improvements in energy efficiency at a lower rate of interest than other projects in its
portfolio. These subsidies could be financed directly through transfers from the government budget. In
some cases the government may choose not to do so, however, leaving the state-owned bank or
enterprise to cover the costs. This will impact on financial performance and be reflected in the utility’s
profit-loss account and balance sheet; the cost of the subsidy, however, is not made explicit. There are
two approaches to estimating the cost of this subsidy, one requiring detailed financial analysis and the
other comparing product prices with benchmark prices. A study using the latter method estimated that
the cost of quasi-fiscal operations from the major state-owned banks and enterprises in Ghana
amounted to about 2.5 percent of GDP in 2004.319 Including quasi-fiscal operations gives a more
accurate picture of the overall fiscal and financial position of the banks and enterprises concerned. It
also helps to identify subsidies that may eventually have to be incorporated into the budget and to
enable adequate analysis of their impacts and policy consistency.
Tax expenditures are revenue losses that result from tax concessions. These include tax deductions,
tax credits, and concessional rates or rules (such as the accelerated depreciation of assets). Tax
expenditures are used by governments as incentives to encourage the private sector and households to
behave in a particular way. They are frequently used to promote commercial investments in particular
industries or technologies. Examples include accelerated depreciation allowances on investments in
renewable energy and tax allowances for households to encourage energy saving improvements. The
fiscal impact of tax expenditures can be substantial. In the U.S., for example, the revenue losses
319
Chivakul, Mali and Robert York (2006). Implications of Quasi-Fiscal Activities in Ghana. IMF Working Paper WP/06/24.

200
associated with the 11 climate-change-related tax expenditures and energy grants amounted to $7.23
billion in 2010, almost as much as the reported funding of $8.8 billion for climate change programs and
activities.320 Programming of tax expenditures is challenging. Tax expenditures are often authorized by
agencies responsible for investment promotion, without a hard constraint on the aggregate value of the
tax expenditures that they should offer. In the absence of such a constraint, institutions seeking to
maximize the investments have every incentive to offer tax concessions as widely as possible (without
considering the marginal costs). Further complicating the problem is the fact that estimating the future
cost of tax expenditures related to commercial investments is particularly difficult because the
profitability and scale of operations of the investment at the time when the tax expenditure will need to
be authorized is unknown.
Defining clear policy objectives and performance metrics for tax expenditure programs can help
improve targeting. In addition to review processes for eligibility, a requirement to report on tax
expenditures, beneficiaries, and fiscal costs can improve transparency. Some governments include tax
expenditures in their budgets and financial statements on a routine basis; others issue periodic reports.
Evaluations of the effectiveness of tax expenditure programs can help policy makers determine whether
the benefits arising from tax expenditures justify their costs and make decisions regarding the scaling
up, scaling down, or termination of tax expenditure programs.
Contingent liabilities are amounts that the public sector may owe if certain events occur. Contingent
liabilities may arise where a government leaves open-ended its commitments to provide relief to
households, the private sector, and local governments when natural disasters occur (Section 6.2).
Contingent liabilities may also arise where a government provides a guarantee to the private sector to
reduce the risk inherent in certain mitigation and adaptation activities. Guarantees are an implicit
subsidy since they transfer risk from the investor to the public sector—and, in so doing reduce the cost
of capital. Guarantees are commonly used to encourage investment in high-risk, start-up industries such
as renewable energy. Guarantees may be tied to specific investment costs or they may guarantee prices
by setting a floor price (effectively passing the demand-side risk of investments on to the government).
The potential costs of poorly designed guarantees can be significant. Some governments have included
guarantees in their periodic budget reports, identifying the beneficiaries and estimating the likely risk
exposures and implicit subsidies.
Off-budget expenditures allow government to subsidize activities without revealing their costs or the
beneficiaries. Policymakers may argue that this lack of transparency enables them to implement
politically unpopular but beneficial policies. Quasi-fiscal operations, tax expenditures, and guarantees
also allow policymakers to initiate policies whose fiscal impact will only be felt later, when quasi-fiscal
operations have to be covered by government, when taxes are due to be paid, and when guarantees are
called. This makes off-budget expenditures a particularly attractive policy tool when budgets are
constrained. However, the lack of transparency around off-budget expenditures increases fiscal risks.
Decision makers may assume expenditures and liabilities without taking their cumulative exposure into
320
GAO (2011). Climate Change: Improvements Needed to Clarify National Priorities and Better Align Them with Federal Funding Decisions, GAO-11-317.
201
account. It also raises governance concerns, since in the absence of systematic reporting it is not
possible to test the policy rationale of these implicit subsidies and their targeting.
Solutions lie in making these subsidies explicit, whether through periodic reporting or by replacing
them with transfers that are reported as expenditures. Costing of off-budget expenditures can be
technically challenging. Public Expenditure and Institutional Reviews provide an opportunity to conduct
the necessary analysis to quantify the potential impacts. Such analysis can focus on the off-budget
expenditures directly related to climate change. It is helpful, however, to take a whole-of-government
approach so as to understand the government’s overall exposure and the trade-offs between climate
change and other policy objectives. Where such detailed analysis is not possible, simply listing the quasi-
fiscal operations, tax expenditures, and guarantees may be sufficient to provoke debate on their policy
relevance.
6.4. NATIONAL CLIMATE CHANGE FUNDS
National climate change funds have emerged as an important part of the institutional architecture for
the management of climate change expenditures. National climate funds can vary in their institutional
mandates and governance arrangements (see Box 6.8), and there are examples covering both
adaptation and mitigation needs. Some build on existing environment funds, others have been created
as new institutions dedicated to climate change. Proponents of national climate change funds have
advocated that these institutions should address climate change policy functions, putting them at the
center of climate change planning, decision making, and coordination.321 This sourcebook contends that
the funds can play a complementary role in the management of climate change expenditures as part of
a broader institutional framework centered on the government’s core budget and planning systems.
Extra-budgetary Funds
National climate change funds ring-fence resources so that they can be managed outside of the
government’s budget process. Extra-budgetary funds are public sector entities with a separate legal
identity, distinct governance arrangements, their own revenue sources, and substantial autonomy over
the application of the resources that they manage. The Government Financial Statistics Manual argues
that “these entities should be treated as separate government units if they maintain a full set of
accounts, own goods or assets in their own right, engage in non-market activities for which they are held
accountable in law, and are able to incur liabilities and enter into contracts.”322 Extra-budgetary funds
retain and carry over the balances on their accounts rather than surrendering them to the treasury at
the end of the fiscal year. They are usually financed by the earmarking of specific revenues. They may
also receive financing from external sources and transfers from the government budget. Typically, the
governance arrangements for extra-budgetary funds are statutory, established in framework legislation
which lays out their purpose and the kinds of activities that they may finance, their management
structure, reporting requirements, and oversight arrangements.
321
UNDP (2011). Blending Climate Finance Through National Cliamte Funds: A Guidebook for the Design and Establishment of National Funds to Achieve Climate Change Priorities. 322
IMF (2001). Government Financial Statistics Manual. See paragraph 2.24 on page 9.
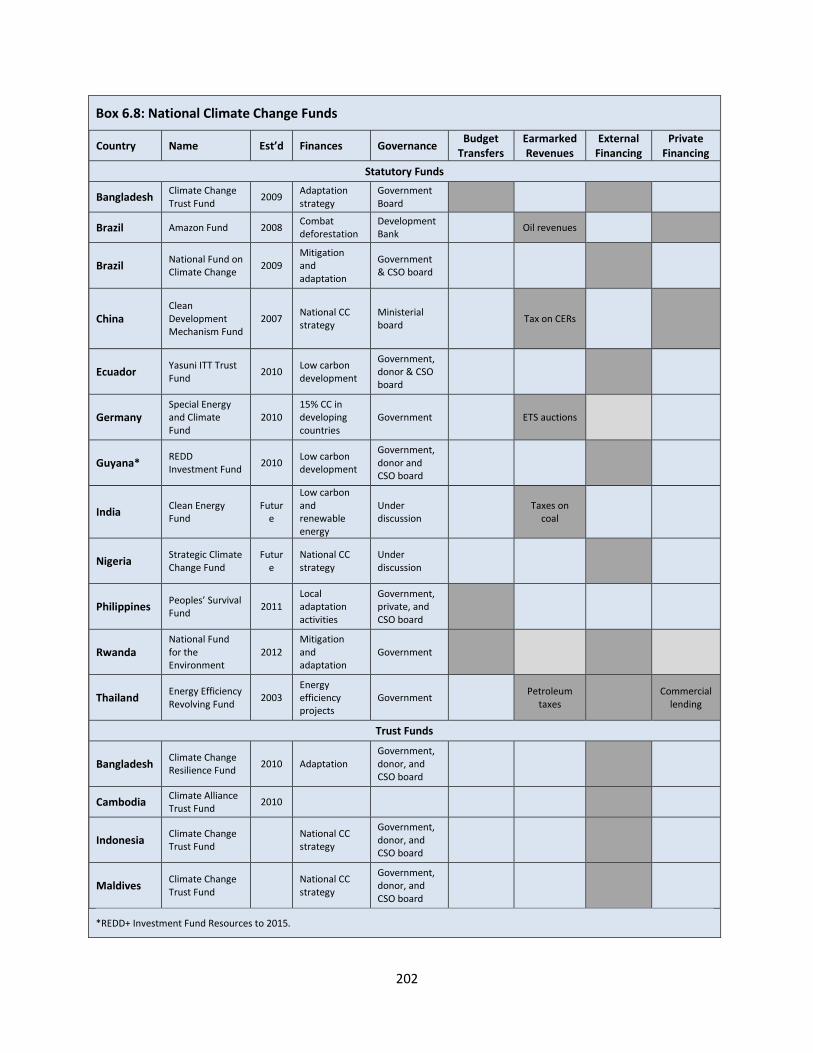
202
Box 6.8: National Climate Change Funds
Country Name Est’d Finances Governance Budget
Transfers Earmarked Revenues
External Financing
Private Financing
Statutory Funds
Bangladesh Climate Change Trust Fund
2009 Adaptation strategy
Government Board
Brazil Amazon Fund 2008 Combat deforestation
Development Bank
Oil revenues
Brazil National Fund on Climate Change
2009 Mitigation and adaptation
Government & CSO board
China Clean Development Mechanism Fund
2007 National CC strategy
Ministerial board
Tax on CERs
Ecuador Yasuni ITT Trust Fund
2010 Low carbon development
Government, donor & CSO board
Germany Special Energy and Climate Fund
2010 15% CC in developing countries
Government
ETS auctions
Guyana* REDD Investment Fund
2010 Low carbon development
Government, donor and CSO board
India Clean Energy Fund
Future
Low carbon and renewable energy
Under discussion
Taxes on coal
Nigeria Strategic Climate Change Fund
Future
National CC strategy
Under discussion
Philippines Peoples’ Survival Fund
2011 Local adaptation activities
Government, private, and CSO board
Rwanda National Fund for the Environment
2012 Mitigation and adaptation
Government
Thailand Energy Efficiency Revolving Fund
2003 Energy efficiency projects
Government
Petroleum taxes
Commercial
lending
Trust Funds
Bangladesh Climate Change Resilience Fund
2010 Adaptation Government, donor, and CSO board
Cambodia Climate Alliance Trust Fund
2010
Indonesia Climate Change Trust Fund
National CC strategy
Government, donor, and CSO board
Maldives Climate Change Trust Fund
National CC strategy
Government, donor, and CSO board
*REDD+ Investment Fund Resources to 2015.

203
Public financial management theorists and practitioners tend to discourage extra budgetary funds,
arguing that they undermine effective resource allocation, expenditure control, and cash
management. Extra-budgetary funds may lead to an inefficient allocation of resources for two reasons.
First because allocation decisions are taken outside of the budget process, activities financed by extra-
budgetary funds do not have to compete with other government programs for resources. Second,
because extra-budgetary funds can only finance mandated activities, they will finance these activities
even if their social rate of return is lower than alternative uses of these resources. Lack of information
on the intended and actual resource allocations may exacerbate these problems, potentially giving rise
to inconsistencies between government and extra-budgetary funds resource allocation decisions.
Expenditure control may be undermined for much the same reason: extra-budgetary funds may not be
aware of and are not bound by the government’s fiscal targets. Cash management is hampered because
the cash holdings of extra-budgetary funds are not available to the government. This can give rise to
situations where extra-budgetary funds have idle balances while government programs may be unable
to proceed for lack of funds.
The literature also argues that extra-budgetary funds can undermine good governance. There are
strong incentives for institutions to transform budgetary programs into extra-budgetary funds, even at
the risk of adverse impacts on overall budgetary performance. These incentives may arise from a
legitimate concern that high priority programs might be cut if they are subject to the competition of the
budget process. Such arguments suggest a degree of bureaucratic capture, with officials assuming that
they are better placed to make resource allocation decisions than the legislature. Officials may also be
motivated by self interest in securing greater discretion in the application of funds. This discretion often
allows extra-budgetary funds to offer better employment terms than the public sector.323
While the proliferation of extra-budgetary funds should certainly be discouraged, there is a case for
their selective use in addressing such policy issues as climate change. Rationales for the creation of
climate change funds and their implications for fund design are explored below. The decision to
establish a national climate change fund should be based on a judgment regarding the value-added that
a fund offers over and above the existing on-budget arrangements and a clear understanding of the
problems that the national climate change fund should resolve. These considerations will impact on the
design of the fund and assessments of its financial and institutional feasibility.
Rationales
National climate change funds can be used to commit resources over extended time horizons beyond
the annual budget. This is important when policy decisions taken today have expenditure implications in
the distant future. One of the rationales for the creation of road funds, for example, is that the decision
to build a road entails a commitment to finance its future maintenance. It is also important where there
is a need to signal policy continuity. This is particularly true for climate change, where investments in
adaptation and mitigation may generate benefits only in the long term. Investors need to be reassured
that the government will fulfill future expenditure commitments and that these commitments will not
323
See, for example, Allen and Radev (2010). Extrabudgetary Funds. IMF Technical Notes and Manuals.

204
be subject to changing government priorities. Extra-budgetary funds can make long-term commitments
because they have their own sources of revenues. These may be revenues earmarked to the fund,
income from an endowment, or the repayment of funds disbursed as credits.
National climate change funds can be used to establish financing mechanisms that would not be
possible within the government’s budget. There are three distinct fund types.
Revenue funds are financed from revenues or contributions from third parties which may only be used
for a specific purpose and are intended to be fully disbursed to beneficiaries. The fund structure allows
these assets to be held by the fund across budget years and disbursed as needed. Once the assets are
disbursed or the flow of revenues stops, the fund is closed.
Endowment funds are managed so as to generate income either for a specified period or in perpetuity.
Only the investment income is used to finance disbursements to beneficiaries. Endowment funds may
be capitalized by government or by contributions from development partners. Endowment funds are
best suited to financing of activities that require a fairly constant flow of funds, such as small grants
programs or the operations and maintenance of protected areas. The Government of Ecuador, for
example, has established the Yasuni Ishpingo Tambococha Tiputini (ITT) Trust Fund to be capitalized by
development partners as compensation for its commitment to permanently forego the extraction of the
Yasuni ITT oil fields. Endowment funds require long-term investment management capability. In the case
of the ITT Fund this capability is provided by UNDP.
Revolving funds seek to maintain assets in perpetuity; distinct from endowment funds, however, capital
is disbursed to beneficiaries as loans and is replenished as the loans are repaid. Revolving fund
arrangements are largely restricted to the financing of private-sector investments through lending on
commercial or subsidized terms. Revolving funds are often managed by commercial or development
banks (who are able to assess the commercial viability of lending). Examples include Thailand’s Energy
Efficiency Revolving Fund, initially capitalized by the government, which provides a line of credit to
commercial banks who in turn on-lend through zero-interest loans to energy efficiency projects. The
commercial banks are responsible for project selection and the banks and project promoters assume the
risks associated with project development.324
National climate change funds can be used to earmark revenues, linking taxes to the benefits that
they finance or the negative externalities that they offset. In Thailand, a vehicle fuel tax is earmarked
to the Energy Conservation Promotion Fund used to promote energy efficiency projects. China has
allocated taxes on income from carbon emissions reductions to the Clean Development Mechanism
Fund. Brazil has used windfall taxes on its oil industry to finance the creation of its National Climate
Change Fund. India has proposed to finance its Clean Energy Fund from taxes on coal consumption. Such
earmarking can help generate the political support needed to secure legislative approval for otherwise
unpopular revenue measures. Economic theory suggests that earmarking may also help improve
efficiency. Earmarked taxes serve as a proxy price. The level of an earmarked tax reflects politicians’
324
APEC (2005). Thailand’s Energy Efficiency Revolving Fund: A Case Study. It was prepared for the APEC Energy Working Group by the Energy Futures Australia and Danish Management Group.
205
understanding of the level of climate change expenditures that taxpayers are willing to finance and
sends a demand signal to the public sector about how much to spend on climate change.
National climate change funds can play a role in mobilizing, coordinating, and blending climate change
financing. Proponents of national climate change funds argue that they allow devolution of
responsibility for the management of climate change finance from international to national
institutions.325 External financing can be disbursed to an extra-budgetary fund rather than to individual
projects where the objectives of the fund are clearly defined and aligned with those of the financing
entity and the fund meets the financing parties’ fiduciary and project management requirements. This
helps lower transactions costs for governments and external partners by reducing the number of
intermediaries and blending financing from various sources. Trust fund arrangements are commonly
used precisely for this purpose, allowing external partners to pool development assistance finance.
These arrangements are not yet available for climate change finance, which can as of now only be
disbursed to specific projects and implementing entities. However, national climate change funds could
provide an institutional framework that would enable international climate change financing entities to
offer direct access to their funds.
National climate change funds can follow procedures that meet the specific requirements of climate
change finance. This may be necessary where specific appraisal criteria have to be used to ensure
effective targeting of climate change finance, such as verification of GHG additionality for mitigation
projects, or to satisfy the monitoring, reporting, and verification requirements of international climate
change finance mechanisms. Specific administrative procedures may be also used in response to
perceived weaknesses in the government’s fiduciary framework or project management arrangements.
These may be addressed through targeted advisory services to deal with specific weaknesses in national
systems (such as contracting independent technical appraisals). Alternatively, they can be addressed by
engaging multilateral agencies as administrators of trust funds for the start-up phase (pending a gradual
transition to national administration within the framework of an extra-budgetary fund). Examples
include the World Bank-administered Maldives Climate Change Trust Fund, the Guyana REDD+
Investment Fund, UNDP- administered trust funds for Indonesia, and Ecuador’s Yasuni ITT.
National climate change funds can give voice to important stakeholders. The governance
arrangements of extra-budgetary funds can be structured in such a way as to ensure that specific
stakeholders (e.g., the private sector, civil society, and government agencies) are given voice in decision
making regarding the application of funds; this usually occurs by including representatives on a
governing board. For example, Brazil’s Amazon Fund, created by the government and managed by a
state-owned bank, is accountable to a multi-stakeholder committee organized in a 3-chamber system
with representatives from local government, national ministries, and civil society (including indigenous
peoples, traditional communities, NGOs, industry, and the scientific community).326 In other countries,
as well, external partners and civil society feature prominently in the governance of national funds.
325
Gomez-Echeverri, Luis (2010). National Funding Entities: Their Role in the Transition to a New Paradigm of Global Cooperation on Climate Change. European Capacity Building Initiative Policy Report. 326
Zadek, Simon, Maya Forstater, Fernanda Polacow and Joao Boffino(2009). Radical Simplicity in Designing National Climate Institutions: Lessons from the Amazon Fund. AccountAbility.

206
Involvement of stakeholders with a direct interest in the fund’s policy objectives can lead to better
informed decision making and protect the fund from diversion to other purposes. Stakeholder can also
instill confidence that funds will be used for the purposes intended and so offer some encouragement
for the repayment of credits to the private sector and/or to households.
While national climate change funds can play a useful role, they can only manage a relatively small
share of climate-change-relevant expenditures as most climate change activities are financed from the
national budget and are embedded across a wide range of programs and projects. Nor are climate
change funds quick fixes. It takes several years to put the legal and institutional frameworks for funds in
place and several more to build up technical and managerial capacity. Contracting a third party fund
manager or trustee, such as the World Bank or UNDP, may accelerate disbursements, but in the end
capacity has to be transferred to the national institution.327 Even when capacity has been put in place,
government budgets are more likely to be able to manage significant increases in the volume of climate
change finance than stand-alone national climate change funds simply because governments can call on
the institutional capacity of the whole-of-government. In addition, national climate change funds have
to operate within the constraints of the broader institutional framework. Channeling international
climate change finance through national climate change funds offers no guarantee that this will increase
the overall level of climate change expenditures. Additional financing through climate funds may simply
be offset by reductions in financing through the budget. Similarly, extra-budgetary funds cannot
separate climate change financing from the fiduciary and management environment in which the funds
operate, since activities will ultimately be implemented by national institutions.
Design Considerations
If national climate change funds are to function effectively, they have to be embedded in the broader
climate change policy, planning, and financial management structures. Creation of separate funds can
distract attention from the task of integrating climate change in core planning and budgeting systems–
indeed they may provide a justification for not doing so–and thereby undermine climate change
objectives. Funds tend to “projectize” spending, rather than to adopt a programmatic approach which
embeds climate change objectives in government planning and budgeting processes. To avoid these
risks, the role of a climate change fund and its relationship to a government’s climate change financial
management strategy should be clearly defined.
The starting point in designing a well-functioning climate change fund is to ensure that there is a clear
rationale for the national climate change fund, identifying where the fund adds value in relation to
the existing institutional structure and ensuring clarity of roles and responsibilities. The institutional
framework will generally depend on the fund’s mandate and functional focus: those that are primarily
geared to adaptation are typically overseen by environmental agencies (in Bangladesh, for example, the
Ministry of Environment and Forests oversees the Climate Change Trust Fund) and those that are
focused on mitigation are typically overseen by agencies in the energy sector (in Thailand, for example,
the Ministry of Energy oversees the Energy Conservation Promotion Fund). Occasionally, funds are
327
UNDP (2012). National Climate Funds: Learning from the Experience of Asia-Pacific Countrie. Environment and Energy Discussion Paper.

207
Box 6.9: Design Considerations for National Climate Change Funds
Mandate and Objectives
The purpose of the fund, the nature of the activities that it is authorized to undertake, and the development objectives that it is to achieve, including:
Intended beneficiaries
Financing and implementation modalities that the fund may employ
Results against which performance will be assessed
Institutional Arrangements
Roles and responsibilities of the fund in relation to other government institutions, planning and policy processes, including:
Policy framework that guides the fund’s operations and resource allocation decisions
Role of government institutions in the fund’s policy and operational decision making
Authority to engage with nongovernmental entities and external partners
Administrative regulations to which the fund is subject
Financing Financing framework for the fund’s operations in relation to government budget and financial management systems, including:
Eligible sources of financing: government budget, earmarked revenues, external financing
Basis of transfers from the budget, if any
Basis for the fund: revenue (capital expended), endowment (capital maintained), and revolving (capital replenished by recovery from beneficiaries)
Terms for disbursement of funds (credits, grants, and grant component)
Organizational Structure
Internal arrangements for ensuring effective management of the fund and the roles and responsibilities of:
Governing board (composition, stakeholder participation, and selection process)
Management and functional departments
External agent or trustee, if any
Project Management
Implementation arrangements, including:
Eligibility and selection criteria for fund-financed activities
Project appraisal process
Safeguards and gender mainstreaming procedures
Project monitoring, reporting, and oversight
Role of stakeholders and intermediaries in project implementation
Accounting and Reporting
Financial mangement arrangements, including:
Accounting and financial reporting standards
Internal controls
Reporting requirements for the government budget, financial reports, and statements
Reporting requirements related to international agreements (MRV)
Oversight External accountability to:
External financial, compliance, and performance audits
Legislature
Local authorities and stakeholders
overseen by central planning and finance agencies (for example, China’s Clean Development Mechanism
Fund). Where funds have a role in the mobilization of resources from external partners and the
coordination of external financing, these responsibilities will need to be clearly demarcated (in relation
to the central finance and planning agencies) so as to ensure a consistent approach to external partners.
Ideally, the relevant government institutions, including the central planning and finance agencies,
should have a role in decision making. One approach is through representation on the fund’s policy-
setting bodies.
The institutional architecture and purpose of the climate change will influence fund design. Box 6.9
identifies some of the key design considerations. Attention tends to focus on the fiduciary framework, in
208
particularly ensuring that robust systems are in place to manage and account for the money. While
financial management is an important consideration, poor expenditure decisions are the greater risk.
Rigorous project appraisal and monitoring procedures should be put in place to ensure that a fund
selects projects with the highest social return. These procedures should allow the comparison of
projects financed by the fund with alternative applications of resources across government so as to
allow the authorities to test the continued relevance of the earmarking arrangements.328 Reporting
arrangements will need to be put in place to ensure that the relevant government institutions are
informed regarding the fund’s financing decisions and progress in their implementation. Financial
reporting should follow the government accounting and reporting procedures so that financial data can
be consolidated across government. Periodic evaluations and audits should assess whether the fund
meets its objectives.
Many of the functional benefits of national climate change funds could be achieved through
arrangements that do not require the segregation of funds and that do work within the government’s
budgetary system. For instance, earmarking and virtual funds used to signal long-term expenditure
commitments can be tied to specific revenues; consultative bodies can advise on the allocation of funds
to climate change activities; and climate-change-relevant projects can be subject to special appraisal
arrangements. The national climate change funds, however, are more visible and offer opportunities for
stakeholder engagement that may make them more attractive solutions from a political perspective. As
legislative approval is usually required for the establishment of extra-budgetary funds, the design of
national climate change funds will ultimately also reflect political considerations.
6.5. CLIMATE CHANGE AUDITING
Audits provide legislatures and society with information they need to hold public institutions to
account. Supreme audit institutions’ (SAI) mandates and institutional frameworks are usually defined by
the constitution. Their responsibilities encompass financial audits (assessing the accuracy and fairness of
public institutions’ financial statements and the adequacy of financial management practices);
compliance audits (assessing public institutions’ compliance with national laws and international
agreements); and performance audits (analyzing the economy, efficiency, and effectiveness or "value for
money" of public institutions and their programs). Audits make recommendations on how to improve
financial management practices, compliance, and performance drawing on objective, evidence-based
assessments. Public institutions must respond to audit findings and propose measures to address issues
raised during the audit process. SAIs subsequently follow up to assess implementation. The extent of the
SAI’s authority varies. In India, for example, the SAI audits national, state, and local governments. In
other countries, the audit authority may be limited to federal government and compliance with federal
legislation. Most SAIs report to the legislature and audit reports are usually published. The legislature
holds public institutions accountable and, where it deems necessary, enforces audit recommendations.
328
For a discussion of issues in fund design see Gyana Ranjan Panda and Narendra Jena (2012), “Evaluating the Performance of the National Clean Energy Fund,” Economic & Political Weekly, September 15, 2012, Vol xlviI no 18.
209
In some countries, notably in much of continental Europe and Latin America, the SAI is a tribunal that
forms part of the judiciary and may enforce its decisions directly.
Environmental auditing, which is now being applied to the challenge of climate change, has emerged
as an important field of work for SAIs. Between 1993 and 2011, national audit offices in over 100
countries conducted more than 3,200 financial, compliance and performance audits related to the
environment.329 The International Organization of Supreme Audit Institutions (INTOSAI) has established
a Working Group on Environmental Auditing to share experience and develop technical guidance on
these issues. The Working Group maintains a searchable database of environmental audits. It has
recently issued guidance on audits related to climate change that draws on the experience of a
coordinated audit undertaken by 14 member countries.330 Climate change audits apply the same
approach as other audits, with distinct focuses on financial management, compliance, and performance.
However, climate change mitigation and adaptation pose distinct challenges for auditors.
Financial audits of climate change assess the authorities’ reporting on climate-change-related
transactions, assets, and liabilities and how funds are applied to support climate-change-related
policies and programs. Audits seeking to assess the alignment of climate-change-related expenditures
with policy objectives run into the problem of defining climate change expenditures. The U.S.
Government Accounting Office, for instance, found that inconsistencies in the definition of climate-
change-related expenditures and the wide range of climate-change-related programs make it difficult to
form a coherent view of climate change expenditures.331 Audits should address the use of public funds
by the private sector, verifying that subsidies and incentives have been used for the purposes intended
and in compliance with industry-specific regulations.332 They should also address the adequacy of
reporting frameworks for carbon markets. This has been identified as a particular weakness by some
countries. Sweden’s SAI, for instance, noted that the government had failed to report in its financial
statements a surplus of emissions rights valued at $1 billion. As a result, the legislature was not given
the opportunity to decide how to apply the surplus.333 Since the International Accounting Standards
Board and the International Public Sector Accounting Standards Board have yet to issue guidance on the
treatment of emissions trading schemes, audit authorities have had to develop their own. New Zealand,
for instance, has issued specific guidance for public entities regarding the impact of ETS on operations,
329
INTOSAI Working Group on Environmental Auditing (WGEA) (2012). Improving National Performance: Environmental Auditing Supports Better Governance and Management , Contribution of the International Organization of Supreme Audit Institution’s Working Group on Environmental Auditing to the United Nations Conference on Sustainable Development. 330
INTOSAI WGEA (2010). Auditing the Government Response to Climate Change: Guidance for Supreme Audit Institutions., and INTOSAI WGEA (2010). Coordinated International Audit on Climate Change: Key Implications for Governments and their Auditors. 331
GAO (2011). Climate Change: Improvements Needed to Clarify National Priorities and Better Align Them with Federal Funding Decisions. GAO-11-317. 332
China National Audit Office (2011). Audit Investigation Findings of Energy Conservation and Emission Reduction of Enterprises in 20 Provinces. No. 11 of 2011. 333
Riksrevisionen (2009). What Are Sweden’s Emission Rights Worth? Handling and Reporting of Sweden’s Kyoto Units. RiR 2009:21.

210
costs, and revenues of public entities, internal controls, registries, and reporting, including reporting on
emissions.334
Compliance audits assess the extent to which public institutions undertake their activities in
accordance with environmental laws, standards, and policies. This encompasses both compliance of
public institutions and enforcement of compliance by other economic actors. In the context of climate
change, audits tend to focus on compliance with obligations under international agreements. INTOSAI
WGEA’s guidance on the audit of international environmental agreements notes that international
agreements do not have to be translated into domestic legislation to fall under the SAI’s mandate.
Indeed, the INTOSAI WGEA argues that SAIs may question why governments choose not to adhere to
international agreements, such as the Kyoto protocol, and whether this is in the national interest.335
Since UNFCC-related commitments are differentiated, the scope of audits by developed and developing
countries varies. Audits by Annex I countries generally focus on progress towards emissions reductions
targets and whether national policies are adequate to achieve these targets. Audits have highlighted
those cases where targets will not be achieved, as in Canada.336 They have also identified cases,
including Denmark, 337 where targets will be achieved but without significant progress towards policy
goals (such as improvements in energy efficiency and shifts to renewable energy). All countries have
reporting obligations, and compliance with these requirements is frequently the target of audit
institutions. Honduras, for example, reported deficiencies in the timeliness and coverage of reporting to
UNFCCC; it was also noted that its government had not implemented the national climate change
strategy or provided adequate funding to the agencies responsible.338 In Estonia, the audit authority
identified deficiencies in the national inventory reported to the UNFCCC, reporting that it understated
the level of GHG emissions.339
Performance audits assess the efficiency and effectiveness of climate change policies and institutions.
In the case of mitigation, efficiency and effectiveness is usually assessed relative to emissions reduction
targets. This includes audits of specific initiatives programs. Sweden, for example, audited the
government’s green procurement policies and concluded that the program lacked clear objectives and
assignment of responsibilities.340 Japan audited subsidy programs that were supposed to achieve
emissions reduction and concluded that many of these programs failed to link subsidies to targets;
where targets were set, it identified huge discrepancies between actual and planned emissions
reductions, resulting in significantly higher unit costs than originally intended.341 In the case of
adaptation, performance audits are hampered by the lack of measureable impact indicators and targets.
The relatively few audits that have been undertaken have tended to focus on whether there are
334
Controller and Auditor-General (2011). The Emissions Trading Scheme: SummaryIinformation for Public Entities and Auditors. 335
INTOSAI (2010). 336
Auditor General of Canada (2012). Meeting Canada’s 2020 Climate Change Commitment. 337
Rigsrevisionen (2012). Report to the Public Accounts Committee on Denmark’s Reduction of CO2 –Emissions. 338
Tribunal de Cuentas (2010). Implementación de los Compromisos Asumidos en el Convenio Marco de las Naciones Unidas sobre Cambio Climático. Informe No. 003-2010-DARNA. 339
National Audit Office Estonia (2009). The State’s Efforts of Reducing Greenhouse Gas Emissions. 340
Riksrevisionen (2011). Green Public Procurement- Is Management Effectively Helping to Achieve the Climate Objective? RiR: 2011/29. 341
Japan (2010). Implementation of Subsidized Projects to Reduce CO2 Emission.

211
adequate vulnerability assessments and the adequacy of government’s response to identified risks. A
coordinated audit by eight European SAIs noted that all of the countries had developed national
vulnerability assessments but only two had developed adaptation plans; the audit also noted that the
actions undertaken were geared to present-day climate-related hazards rather than the risks of future
climate changes.342 Brazil’s audit authority has focused on adaptation in the most vulnerable sectors,
with audits addressing impacts on agriculture and livestock, coastal zones, and water security in semi-
arid areas. Again the audits founded deficiencies in risk identification and in the planning response.343
In practice, the financial, compliance, and performance dimensions of audits are combined as part of
an audit plan that focuses on risks. Box 6.10 outlines the 4-stage planning process for mitigation and
adaptation audits proposed in the INTOSAI WGEA guidance.344 The steps are (1) problem identification
(assessing the relevance and urgency of adaptation and mitigation issues); (2) mapping of the
government’s response across the range of policy instruments at the government’s disposal; (3) risk
identification (where the auditor identifies the relevant audit topics related to financial management,
compliance, and performance); and (4) design of the audit (identifying the audit objectives and scope of
work). This process is intended to identify particular risks related to efficiency, effectiveness, and the
governance of climate change policy.
Box 6.10: Planning Climate Change Audits
MITIGATION AUDITS Step ADAPTATION AUDITS
Identify Problem
trends and projections: GHG emissions, sources, sinks
1
Identify Problem
actual and potential impacts of climate change
adaptive capacity and vulnerability to climate change
Map Government Response
international commitments and national targets
roles and responsibilities of government entities
policy instruments for reducing emissions
2
Map Government Response
objectives and targets of adaptation policies
roles and responsibilities of government entities
policy instruments for adaptation
Identify Risks
achievement of objectives
use of policy instruments
effectiveness of policy implementation
misstatement of financial resources
economy and value-for-money in implementation
3
Identify Risks
identification of key vulnerablities
effectiveness of overall plan or strategy
addressing needs of most vulnerable sectors and areas
misstatement of financial resources
economy and value-for-money in implementation
Design Audit
progress against commitments and targets
effectiveness of policy instruments in achieving targets and in mobilizing technology and science
funding effectiveness
governance effectiveness
4
Design Audit
identification of climate-change-related threats
adequacy of adaptation policy, plan, or strategy
efficiency and effectiveness of policy instruments
funding effectiveness
governance effectiveness
Source: Adapted from INTOSAI WGEA (2010). Auditing the Government Response to Climate Change: Guidance for Supreme Audit Insituttions.
342
EuroSAI (2012). Adaptation to Climate Change – Are Governments Prepared. 343
Tribunal de Contas da União (2009). Relatório de Auditoria: Adaptação da Agropecuária aos Cenários de Mudanças do Clima. 344
INTOSAI WGEA (2010). Auditing the Government Response to Climate Change: Guidance for Supreme Audit Insituttion.

212
CHAPTER 7. BUDGET CLASSIFICATION
7.1. CHAPTER SUMMARY
Climate Change Public Expenditure and Institutional Reviews include an important step: determining
and which on-budget and off-budget expenditures are climate-related. Such determination is a
necessary first step in the analysis. This step is complicated, however, because there is no readily
available classification for climate change expenditures as they relate to on-budget and off-budget
spending; as a result, analysts and policy makers have to formulate and apply their own criteria in
determining which budget items and off-budget spending can be labeled climate-related. This chapter
outlines the main issues that the analysts and policymakers face when classifying expense items as
climate-related and describes solutions that have been found.
This chapter distinguishes four purposes for climate-change-expenditure classifications: to generate
statistics; to guide the allocation of resources; to evaluate the climate change impact of public
expenditures; and to track climate change expenditures. Statistical approaches to the classification of
expenditures seek to generate data that can be compared and aggregated across time, between
countries, and with other social, economic, and environmental data. For the purpose of allocating
resources, the key consideration in classifying expenditures is the policy objective that a government is
seeking to achieve. Evaluations assess the impact of public expenditures regardless of their policy
objective, however, and so include expenditures that adversely affect climate change outcomes as well
as those that have a positive impact. Tracking of expenditures is used for the earmarked funds; to
determine the actions designed to achieve climate change targets; to determine climate change policy
expenditure targets; and for monitoring, verifying, and reporting on climate change finance in the
context of international commitments. The different systems of classifications that are used to serve
these purposes are the System of Environmental-Economic Accounting; country specific budget
classifications); Rio Markers and co-benefits methodology; (tagging of climate-change-relevant
expenditures; and estimation of off-budget expenditures. (See Box 7.1 for a description of Rio Markers
for Climate Change and the World Bank approach).
The System of Environmental-Economic Accounting (SEEA) provides a statistical framework for the
classification and reporting of environmental activities, products, expenditures, and other
transactions. SEEA applies the accounting concepts, structures, rules, and principles of the System of
National Accounts; as such, it is fully compatible with economic data generated for National Accounts
purposes. This includes the functional and economic classifications of Government Financial Statistics.
Adopted in 2012, SEEA will be implemented progressively by all national authorities. The World Bank
actively supports the adoption of SEEA by national statistics authorities. SEEA distinguishes two broad
types of environmental activity: environmental protection and resource management. Environmental
protection expenditures reflected in Environmental Protection Expenditure Accounts (EPEA), encompass
the European System for the Collection of Economic Information on the Environment (SERIEE). Resource
management activities, the second broad SEEA category, encompasses activities whose primary purpose
is preserving and maintaining the stock of natural resources and safeguarding these assets against
213
depletion. Environmental Goods and Services Sector (EGSS) reporting is not yet widely developed in
practice.
Climate change expenditure items can be found in a variety of places: in administrative budgets
(expenditures of designated climate change agencies such as a ministry, commission or sub-unit within
another organization with a broader institutional mandate), in line Item classifications (e.g., if there is a
line item for subsidies), in program classifications (expenditures of programs of any agency, where the
primary objective is climate change management, adaptation, or mitigation), in project classifications
(expenditures of projects where the primary objective is climate change-related), and in climate fund
accounts (expenditures of a specifically designated climate change fund). Budget statistics also capture
climate change-relevance in economic classifications (e.g. direct subsidies) and in functional
classifications (i.e., in the section on environmental protection and incorporated as a sub-function of
pollution abatement in the form of expenditure on measures to control or prevent the emission of
greenhouse gases).345
Box 7.1. Classification of Climate Finance in International Development Assistance
The World Bank is working to harmonize a joint approach to climate finance classification and reporting among multilateral development banks (MDBs) and is supporting other research bodies in acquiring climate finance data from external sources to build a more comprehensive landscape of climate finance.
The World Bank approach goes a step further than the Rio Markers for Climate Change, which were designed to facilitate reporting on climate change for the OECD’s Official Development Assistance (ODA )and are part of a broader set of Rio Markers. Under the World Bank’s methodology, all aid activities reported through the OECD’s Credit Reporting System are tagged (or “Rio-marked”) for climate change if the activities are principally or significantly targeting UNFCCC objectives. As this system covers mainly bilateral ODA and trust funds, it excludes other climate finance providers, including MDB financing for mitigation and adaptation projects from their own resources.
The World Bank’s approach allows for inclusion of all mitigation and adaptation activities when reporting on climate change financing. It classifies the World Bank’s financing activity according to the climate change co-benefits of the projects. The reporting system became operational in July 2012, and similar systems of classification have now been adopted by other multilateral development banks. Typically an activity is assigned a percentage of its overall financing to reflect its relevance to adaptation and mitigation. At the World Bank, this percentage is estimated by teams preparing projects, this is done at the time of project appraisal. Details can be found at http://www.worldbank.org/en/news/feature/2013/11/14/mdb-climate-finance-report.
Source: World Bank (2014). Multilateral Development Banks Provided $27 Billion in Climate Finance in 2012. World Bank News, A Feature Story. November 14, 2013.
The budget process can be used to tag climate-change-relevant expenditure items and to track actual
expenditures. Some developing countries are starting to code and track actual climate-change-related
expenditures at the national level. There is an inevitable degree of subjectivity, however, in defining
how relevant different expenditures are to climate change. Depending on the approach used, the
estimate for the climate expenditure envelope will differ: there are studies that came up with a
quantitative estimate of climate relevant spending as a proportion of total expenditure and GDP in
345
IMF Stateistics Department (2001). Government Finance Statistics Manual 2001 (GFSM 2001).
214
different countries, but the data have limitations for the purpose of cross-country comparisons.
Countries looking to track may wish to refer to the ongoing OECD and MDB harmonization effort.
Determining off-budget climate expenditures346 is particularly difficult. Off-budget expenditures are
financial transactions that are not reflected in the budget. They can take different forms, the most
common being subsidies to public enterprises, credits provided by government, government
guarantees, and subsidies routed through the tax system. There are various definitions of subsidies. For
conceptual purposes, it is helpful to take a broader view and consider subsidies as interventions that
result in the provision of goods at a price below the opportunity cost. Subsidies are financed through
various channels that are often not captured in government budgets and financial statements. Explicit
subsidies that are direct budgetary payments (i.e., made though budgeting) are relatively
straightforward. Guarantees, however, will only be captured in most countries if there is a specific
registry in place. Implicit subsidies and tax expenditures are the most difficult to track. Implicit subsidies
occur, for example, when a state-owned enterprise or other entity absorbs the cost of providing energy
at lower than market price. This is qualified as a quasi-fiscal operation. Governments also finance
subsidies through preferential tax treatment, such as by applying tax rates that are lower than the
prevailing rates and through the use of tax credits.
7.2. OVERVIEW
Climate Change Public Expenditure and Institutional Reviews include an important step: determining
and which on-budget and off-budget expenditures are climate-related. Such determination is a
necessary first step in the analysis. This step is complicated, however, because there is no readily
available classification for climate change expenditures as they relate to on-budget and off-budget
spending; as a result, analysts and policy makers have to formulate and apply their own criteria in
determining which budget items and off-budget spending can be labeled climate-related. This chapter
outlines the main issues that the analysts and policymakers face when classifying expense items as
climate-related and describes solutions that have been found.
The process of determining which expenditure items are climate related is a useful exercise. It forces
analysts to question the purpose of expenditures, their impacts, and their relevance in a particular
country and policy context. It helps decision makers to assess the relative importance of alternative uses
of funds in achieving policy objectives and to align expenditures with the government climate change
and development policies. Governments are taking different approaches to determining climate-related
expenditures, and those approaches are usually based on the purposes for which the classification
approach is used. Classifying climate change expenditures poses a number of challenges, including the
fact that it is hard to formulate a universal classification approach for cross-cutting policy agendas and
for expenditures that are not discrete but do constitute an element of various programs.
Expenditures related to cross-cutting policy agendas–such as climate change, growth, poverty
reduction, and gender–defy a universal classification approach. The system of classification depends
346
See a more detailed discussion in Chapter 6.

215
instead on the particular country and policy context. Cross-cutting policy agendas are not tied to a
particular institution or sector, a particular actor, or a particular policy instrument. They instead entail a
whole-of-government response; engagement by households, communities, the private sector, and
central and local governments; and the use of various policy levers (e.g., regulation, information,
taxation, and spending). While it is possible to identify a range of policy interventions that might
constitute adaptation or mitigation, these policy interventions will not be relevant in all countries or
sectors. Where they are relevant, it may not immediately be apparent what the underlying motivation
is. This is particularly true of climate change adaptation. Expenditures that support economic growth
and poverty reduction will increase resilience to climate change by building economic, institutional, and
social capital. Expenditures that help manage current climate variability (e.g., investments in irrigation,
drought tolerant species, and diversification of income sources) will also help address climate change.
Consequently, classification of expenditures as climate-change-related or development-related is far
from clear cut and will always be a matter of judgment and degree.
Climate change expenditures are rarely discrete; they typically relate to a particular component or
design feature of a program or project. Adaptation, for example, may entail building a higher flood
embankment to reflect future climate change. Mitigation may entail the selection of a more efficient
power generation technology in order to reduce future emissions. In such cases, the classification of the
whole project as climate change related would significantly overstate the amount of expenditure on
climate change. An accurate assessment requires attribution of the specific expenditures associated
with these climate-change-related elements of the program or project expenditures on the basis of
either costs or benefits. While it may be possible to isolate additional costs related to climate change in
program and project design, tracking these costs during implementation adds complexity to financial
reporting. The attribution of benefits is also challenging, because, unlike poverty- and gender-related
expenditures (where the benefits can be attributed to social groups based on their consumption of the
services that the expenditures finance), there is no common measure (attribute) to test the relevance of
climate change expenditures.
7.3. PURPOSE
Budget definitions of climate-related expenditures should be informed by the purpose for which they
will be used. Criteria for the classification of expenditures have to be determined and procedures for
the consolidation of information put in place. This requires some understanding of how and for what
purpose the information will be used and agreement on which institution should take the lead. This
sourcebook identifies four purposes for using budget definitions of climate-related expenses: to
generate statistics; to guide the allocation of resources; to evaluate the climate change impact of public
expenditures; and to track climate change expenditures. Each of these purposes has particular
requirements and poses particular challenges.
Statistical approaches to the budget definition of climate-related expenditures seek to generate data
that can be compared and aggregated across time, between countries, and with other social,
economic, and environmental data. Budget definitions should ensure consistency, in the sense that
those responsible for classifying expenditures should assign a particular expenditure type to the same

216
category regardless of the country, institutional, or policy context. This requires use of consistent
concepts, data structures, and aggregation procedures. For the purpose of policy analysis, expenditure
data should be consistent with the framework used for economic statistics (i.e., the System of National
Accounts). This allows analysis of the public sector’s interaction with the economy and with households,
corporations, and the nonprofit sector. Data has to be gathered from these economic actors as well as
from central and local governments. This places the statistics authority in a lead role. The budget
definitions should take into account the needs of information users, including policy analysts, while
being consistent with international standards.
For the purposes of allocating resources, the key consideration in classifying expenditures is the policy
objective that the government seeks to achieve. In order to serve as an effective basis for resource
allocation, budget definitions have to be integrated into the government’s budget classification and
chart of accounts. This allows decision makers to consider the level of resources that they wish to assign
to policy objectives at the time of budget preparation. It also allows the authorities to control, monitor,
and report on the application of resources in relation to policy objectives during budget execution.
Budget definitions and classifications will be determined by central finance and planning agencies driven
by the needs of the budget process and policy priorities; international standards carry little weight.
Unfortunately, budget classifications do not capture climate change expenditures effectively. Countries
that have program budget classifications–and many developing countries do not–are best placed to
incorporate climate change within their budgets. However, program classifications will only identify
expenditures whose primary purpose is climate change. They will not identify expenditures in programs
that are not primarily climate-change-related but generate climate change co-benefits. Furthermore,
definitions based on budgets and charts of accounts will not capture off-budget expenditures from off-
budget funds, tax expenditures, contingent liabilities, and quasi-fiscal operations which may constitute a
substantial part of climate change-related public expenditures.
Evaluations assess the impact of public expenditures regardless of their policy objective; these include
expenditures that adversely affect climate change outcomes as well as those that have a positive
impact. For evaluation purposes, climate-related expenditures are those that have an impact on
mitigation or adaptation and those that will be impacted by climate change. The scope may be broad; on
mitigation for instance, countries may choose to assess the impact of expenditures using UNFCCC
planning instruments as reference (see Chapter 3 for a discussion of national communications, national
inventories, and other planning tools). Evaluation requires a whole-of-government approach that is not
constrained by the policy framework and that considers all relevant public expenditures regardless of
the institutions responsible and whether or not the expenditures are reflected in the budget (see Box
7.2). Identification of unintended consequences of public expenditure policy is a critical part of this
process. So too is the identification of inconsistencies between stated policy objectives and actual
expenditures. Fossil fuel subsidies feature prominently among expenditures with significant climate
change impacts. Indeed, the expenditures on fossil subsidies may by far exceed expenditures on
mitigation. An effective evaluation brings these issues to the attention of decision makers and identifies
possible solutions. Whether commissioned by a central finance or planning agencies or not, evaluations
are typically undertaken by policy units, although sometimes by audit authorities or by civil society Data

217
is usually gathered ad hoc, as required by a particular exercise. Ideally information systems are
established to generate the information for future evaluation purposes.
Box 7.2. Climate Fiscal and Financing Frameworks in Indonesia, Bangladesh, and Cambodia: A whole-of-government Approach
A number of countries are moving from an ad hoc approach to classifying climate finance under a whole-of-government approach increasingly coordinated by the Ministry of Finance. The exact focus of these fiscal and financing frameworks has varied depending on the particular needs of each country. Some countries focused more on mitigation (e.g., Indonesia), while other emphasized adaptation (e.g., Bangladesh). Countries where international flows are important (e.g., Cambodia) used these to finance climate change needs, while other countries (e.g., Indonesia) focused initially purely on domestic resources. Some countries (e.g., Bangladesh and Indonesia) focused on designing fiscal and monetary policy measures (such as green banking) to incentivize private-sector green investments.
Indonesia’s Ministry of Finance developed in 2011 a “Mitigation Fiscal Framework” to assess whether the quantity and quality of government expenditure is appropriate to achieve the country’s greenhouse gas emissions reduction targets. The analysis recommends ways to improve the quantity and quality of expenditure to reach these targets in the future.
Bangladesh’s Ministry of Finance developed a “Climate Fiscal Framework” in 2014 that reviews expenditure and tax policy and its link to climate change; it also looked at the role of the banking sector. The focus of the review was adaptation, but it also discussed mitigation issues (and, in particular, the role of fossil fuel subsidies).
The Government of Cambodia developed a Climate Change Financing Framework (CCFF) in 2014. The framework was created for estimating supply and demand for climate expenditures, to identify any financing gaps and to highlight the need to make efficient use of limited climate expenditures. As part of this process, line ministries have been requested to undertake a prioritization exercise to select climate programs that should be funded first. The CCFF builds on the Cambodia’s national climate change strategy, the cross sectoral climate change action planning process and expenditure analysis (using tools such as the Climate Change Public Expenditure and Institutional Review). It includes additional analysis on costs and benefits of climate expenditure, an assessment of climate financing scenarios, and a review of various modalities for channeling climate finance at the national and local level. The CCFF formulates guidelines for the management of climate change finance in Cambodia. It also highlights the need for targeted capacity development interventions. At the heart of the CCFF is an innovative benefits approach to defining and analyzing climate finance which looks at whether the benefits of a policy/action are affected by climate change. The approach involves a comparative analysis of cost benefit ratios (CBR) for investments using data from the IPCC reports which estimate potential climate impacts, one can calculate cost benefit ratios for programs and investments with or without climate change. The benefits approach then asks what proportion of the CBR is due to climate change and uses this proportion to denote climate finance.
Source: UNDP reports are available at http://www.climatefinance-developmenteffectiveness.org/publications.html.UNDP, 2014. Case Study: Cambodia Climate Change Financing Framework. Strengthening the Governance of Climate Change Finance. UNDP.
Tracking of expenditures assumes particular importance where funds have been earmarked, where
there are expenditure targets in relation to climate change policy, and in the context of international
commitments to monitor, verify, and report on climate change finance. Earmarking and expenditure
targets may be applied at a national level and addressed through the classification of appropriate
expenditure categories for budgetary and financial reporting (see Box 7.3). Tracking becomes more
challenging when the goal is to follow the flow of climate change finance from the source of funds to the
developing country recipient and, ideally, to the final application of funds. In principle, tracking should
be relatively straightforward where funds are projectized (i.e., assigned to specific time-limited activities

218
that are reflected as discrete entities in the source and recipient governments’ budgets and charts) and
both governments agree on the classification of climate change expenditures. However, funds may not
be projectized throughout the delivery chain. Financing may be programmatic or provided as budget
support and thus become undistinguishable from the recipient government’s broader budget. There
may be cases where governments disagree on the appropriate budget definition of climate-related
expenditures, wish to restrict the budget definition of climate-related expenditures to a particular
source of funds (for example, dedicated climate change funds), or wish to exclude some expenditures
(such as development assistance). Furthermore, while two countries may agree on the classification of
climate change expenditures, there is no guarantee that other countries will follow the same approach;
as a result, it may not be possible to aggregate expenditures across countries. While this may not be a
particular concern to a recipient government, it does undermine the effectiveness of the tracking system
at an international level since it is no longer possible to reconcile reporting by, between, and among
developed and developing countries or to generate consistent global aggregates of climate change
expenditures.
Box 7.3. Tracking Climate Expenditures in Nepal and Indonesia
A number of countries, including Nepal and Indonesia, are starting to routinely track their climate expenditures across the budget.
Nepal’s Ministry of Finance, as part of the 2013 Annual Budget Statement, analyzed climate change expenditures and estimated them in the 2013/14 budget. The budget statement showed that 10.3 percent of total government expenditures, or 3.1 percent of GDP, were climate related. The analysis of climate expenditures allowed the government to review the allocation of the funds among ministries and to check whether funding reaches the local level.
Indonesia’s Ministry of Finance is planning to issue a decree to tag the quantity of climate expenditures. Indonesia is also starting discussions on scoring the quality of climate expenditures. Tagging or marking is more straightforward as it simply records the amount of an expenditure. Scoring climate expenditure is more complicated; it requires dialogue with line ministries and involve selecting the criteria for assessment of each expenditure’s effectiveness. If designed well, scoring can be used as a tool for performance-based budgeting and expenditure prioritization.
Source: UNDP reports are available at: http://www.climatefinance-developmenteffectiveness.org/publications.html
Climate Change Public Expenditure and Institutional Reviews may be expected to develop
classification approaches that fulfill several purposes. Public expenditure reviews are evaluations; as a
result, the starting point is a classification approach that seeks to capture information on the climate
change impacts of public expenditures. Because public expenditure reviews should inform government
policy, reviews will need to be able to translate their recommendations so that they can be reflected in
plans and budgets. CCPEIRs may also inform financing partners, demonstrating how climate change
finance has been applied, its consistency with government climate change policy, and its impact.
The following sections review specific approaches to the classification of climate change expenditures,
how they can be applied, and their strengths and weaknesses in the context of public financial
management systems and CCPEIR. It is worth reiterating that there is no perfect method: all of the

219
approaches currently in use have significant shortcomings when it comes to the budget definition of
climate-related expenditures. This is as true of the approaches that have been developed specifically to
address climate change as it is for those approaches that serve a broader purpose. Early CCPEIRs
adopted pragmatic solutions, placing considerable emphasis on the process by which expenditures are
classified and on the involvement of key stakeholders in these decisions. The final section draws on this
experience.
7.4. ENVIRONMENTAL ACCOUNTING
The System of Environmental-Economic Accounting provides a statistical framework for the
classification and reporting of environmental activities, products, expenditures, and other
transactions. SEEA allows assessment of trends in the use and availability of natural resources, the
extent of emissions and discharges into the environment resulting from economic activity, and the
amount of economic activity undertaken for environmental purposes. SEEA applies the accounting
concepts, structures, rules, and principles of the System of National Accounts; as such, it is fully
compatible with economic data generated for National Accounts purposes. The SEEA framework
includes the functional and economic classifications of Government Financial Statistics. Adopted in
2012, SEEA will be implemented progressively by all national authorities.347 The World Bank actively
supports the adoption of SEEA by national statistics authorities.
SEEA distinguishes two broad types of environmental activity: environmental protection and resource
management. Environmental protection activities are activities whose primary purpose is to prevent,
reduce, and eliminate pollution and other forms of degradation of the environment. Environmental
Protection Expenditure Accounts (EPEA) and supporting statistics on environmental protection
expenditure are widely available in OECD countries. They mirror the Classification of Environmental
Protection Activities and Expenditure (CEPA), first developed in 1994 and adopted by the UN in 2000.
They also encompass the European System for the Collection of Economic Information on the
Environment (SERIEE), a more detailed subset of the SEEA developed by Eurostat. Eurostat compiles
EPEA equivalent statistics for the 27 EU member countries, for candidate countries, and for the four
EFTA countries.348 Resource management activities are activities whose primary purpose is to preserve
and maintain the stock of natural resources and safeguard these assets against depletion. Reporting on
Environmental Goods and Services Sector (EGSS) activities is not yet widely developed in practice.
Expenditures for environmental protection cover all goods and services for environmental protection
purposes, including connected products and adapted goods. Connected products are products whose
use directly serves environmental protection purposes but which are not environmental-protection-
specific services or inputs into characteristic activities. Adapted goods are goods that have been
specifically modified to be more environmentally friendly or “cleaner—and whose use is therefore
beneficial for environmental protection. Only the net or extra cost of the adapted goods is considered
347
European Commission, Food and Agriculture Organization, International Monetary Fund, Organisation for Economic Cooperation and Development, United Nations, World Bank (2012). System of Envrionmental-Economic Accounting: Central Framework. 348
Eurostat (2010). Environmental Statistics and Accounts in Europe.
220
an environmental expenditure because, from the perspective of the purchaser, it is only the extra cost
that represents the amount spent for environmental protection purposes. These extra costs are usually
determined in reference to a base or equivalent normal good. Comparison may not be possible where
reference goods no longer exist, where normal goods have incorporated environmental standards, or
when new goods present other advantages in addition to their environmental benefit. SEEA offers
specific guidance to address these measurement challenges.
SEEA distinguishes among and reports on environmental activities, transactions, and expenses by
households, corporations, the nonprofit sector, and general government. This allows measurement of
economic actors’ response to environmental concerns through the supply of and demand for
environmental protection services, through adoption of production methods, and through changes in
consumption behavior. It also reveals who finances expenditures on environmental protection, the
relative importance of various economic actors, and how changes in financing sources influence
environmental protection activities. This information is critical for understanding the impact of both
climate change policy and expenditures.
SEEA provides policymakers with a broader perspective on atmospheric pollution than is available
from National Inventories. The methodology SEEA uses to account for GHG emissions cannot be used
for monitoring progress toward internationally agreed emissions reduction targets. While there are
technical differences in the basis for consolidating accounts, the major source of differences is that
National Inventories only take into account emissions within territorial borders whereas SEEA air
emissions accounts includes all nationally registered businesses. This can be significant for countries
with large international maritime and aviation transport industries. Furthermore, SEEA includes a
broader range of pollutants than National Inventories. Eurostat accounts take into account emissions of
gases responsible for acidification and emissions of ground-level ozone gases as well as emissions of the
three major GHGs. This data can help reveal trade-offs between the environmental pressures resulting
from different policies. For example, diesel-fueled vehicle are more fuel efficient than gasoline-fueled
vehicles (and thus have lower carbon emissions per kilometer but typically have higher emissions of
acidifying and ground level ozone).
SEEA does not capture all climate change expenditures; mitigation activities are included,
sequestration is covered in principle but not yet in practice, and most adaptation expenditures are
excluded altogether. The EPEA classification includes a specific class of activities related to protection of
ambient air and climate. Mitigation activities are reported through this functional account, though some
disaggregation is needed because it encompasses a broader range of pollutants than GHGs.
Sequestration should be reflected in EGSS, but an appropriate methodology has yet to be developed.
Work is underway on specific Ecosystem Accounts that will fully account for stocks and flows of carbon
and their valuation. Finally, SEEA will not capture adaptation activities that do have environmental
protection or natural resource management as their primary function. Activities that seek to mitigate
natural hazards or reduce the impact of environmental damage are specifically excluded from the SEEA
framework because the primary purpose of these activities is to protect people and assets rather than to
protect and manage the environment itself.

221
7.5. BUDGET CLASSIFICATION
Budget classifications are used to systematize and structure budget information. Budget classifications
serve multiple purposes for multiple users. They structure the information used for budget preparation
and the way the information is presented to decision makers for review and approval. They establish the
framework for appropriations (the authorization of expenditure) by the legislature. They also lay out
categories of expenditures for the purposes of accounting and budget control. In order to serve these
purposes, budget classifications have to adhere to basic principles. A budget classification should be:
internally consistent (i.e., the rationale for classification should apply across all of the subcategories
within a classification); comprehensive (i.e., each category should cover all the relevant expenditures);
and internally mutually exclusive (i.e., each transaction should be classified in only one subcategory of
the expenditure classification).
There are two broad categories of budget classifications: those that are specific to the context of a
particular country (contextual) and those whose purpose is statistical (see Box 7.4). Administrative,
line item, territorial, and program classifications will be unique to each country and reflect particular
institutional arrangements and policy objectives. Administrative and territorial classifications are subject
to administrative reorganizations, as agencies and territorial administrative units are created, merged,
or abolished. Program classifications structure expenditures according to the policy objectives that the
government is trying to achieve and so may be restructured as policy objectives change. Data generated
using these classifications will not be comparable between countries or over extended periods of time.
In contrast, economic and functional classifications have a statistical purpose. Data generated using
these classifications should be consistent with the requirements of IMF Government Financial Statistics
(GFS) which, in turn, are fully integrated with the statistical requirements of the UN System of National
Accounts.349 This enables comparison of expenditures by public institutions, households, businesses, and
the nonprofit sector using identical categories and makes it possible to aggregate spending (for example,
on consumption, investment, health, education, or the environment) across the whole economy. It also
allows comparison of expenditure categories across time, irrespective of changing organizational
arrangements and policy objectives, and between countries. GFS-compatible functional classifications,
however, are sometimes constructed by mapping summary expenditure data from administrative and
program classifications; as such, they may be based on judgments about the consistency between
administrative mandates or program objectives and GFS functions.
Standard budget classifications do not provide an effective basis for the identification and tracking of
climate change expenditures. Box 7.4 lays out the principal budget classifications, their rationale, and
the nature of climate change expenditures that they identify and that they are unable to identify.
Administrative classifications, for instance, will capture expenditures related to agencies that have a
mandate related to climate change. The functional classification includes a function for environmental
protection that incorporates a sub-function for pollution abatement (including expenditures on
measures to control or prevent emissions of greenhouse gases). However, this records climate change
mitigation spending only, not adaptation spending; and for mitigation, it does not capture climate-
349
IMF Statistics Department (2001). Government Finance Statistics Manual 2001 (GFSM 2001).

222
change-related spending embedded in activities with a primary purpose other than environmental
protection, such as a mitigation component within an energy generation project that is classified as an
expenditure on economic services within the functional classification.
Box 7.4. Budget Classifications and Climate Change Expenditure
Classification Rationale and stucture CC-Related Expenditures
Identified CC-Related Expenditures not
identified
Contextual
Administrative
Government entities that are responsible for managing the allocated funds, such as ministries or departments. The classification may extend to administrative sub-units within these entities.
All expenditures of a specifically designated CC agency, such as a ministry, commission, or sub-unit within another organization with a broader institutional mandate.
Does not incorporate CC spending by entities that do not have CC as their sole or primary focus.
Line Item
The objects of expenditure, such as salaries, equipment, and operational expenses. Traditionally used as the basis for appropriation and expenditure control. Often based on the economic classificaiton in modern systems.
If there is a line item for subsidies, this classification could help identify CC-relevant subsidies.
Does not incorporate any other inputs to CC activities, such as staff salaries, and consumption of goods and services.
Territorial Territorial administrative units, such as provinces or districts.
Does not, of itself, identify any CC spending
Must be combined with one or more other classifications to generate CC spending by geographic area.
Program Groupings of activities sharing a common specific policy objective. Used to promote a focus on results.
Captures programs where the primary objective is CC management, adaptation, or mitigation in any agency.
Does not incorporate CC-relevant spending in programs where CC is not the primary objective.
Project
Activities of limited duration with a specific objective. Projects may be subsumed within the program classification or identified as a distinct budget category (notably for development assistance).
All expenditures of projects where primary objective is CC-related.
Does not incorporate CC-relevant spending on projects where CC is not the primary objective.
Fund The source of finance, this may be a consolidated fund or Treasury account, a special purpose fund, or external financing.
All expenditures of a specifically designated CC fund.
Does not incorporate CC spending by funds that do not have CC as their sole or primary focus.
Statistical
Economic
Categorizes expenditures according to the nature of the transaction or the object of spending (e.g., capital or current, the kind of goods or services obtained, and transfers from government to other agent households, corporations, and the nonprofit sector. Usually replaces and fulfills the control function of line item classification.
May capture CC-relevant expenditures on budget direct subsidies.
Does not incorporate any other economic inputs to CC activities, such as staff salaries, and consumption of goods and services.
Functional
Categorizes expenditures according to the purpose of spending, with 10 functions of government (divisions) divided into sub-functions (groups) and sub-sub-functions (or classes). Functions include environmental protection.
Environmental protection incorporates a sub-function of pollution abatement, which includes expenditure on measures to control or prevent emissions of greenhouse gases.
Records CC mitigation spending only, not adaptation spending. For mitigation, does not capture CC spending embedded in activites with a primary purpose other than environmental protection.

223
Expenditures are typically identified and tracked by using a combination of classifications, though this
too has limitations in the context of climate change. No single classification can capture all policy
dimensions. Computerized Financial Management Information Systems facilitate the classification of
budgets and individual transactions using multiple classifications simultaneously, using a string of codes
to classify transactions according to each of the classifications independently of the others. While this
does allow greater granularity in identifying specific categories of expenditure, it only partially resolves
the problem of climate change expenditures. Budget classifications cannot distinguish climate change
expenditures when these are embedded in programs, projects, and activities that have a primary
purpose other than climate change. Further analysis is needed to disentangle climate-change-related
expenditures from information sources other than the budget and chart of accounts. The share of
embedded climate change expenditures in these programs will usually be estimates based on “expert”
judgment.
Box 7.5. Cross-Cutting Programs
France’s 2001 Organic Budget Law introduced a program budget structure that sought to align resources with policy objectives, with 132 programs consolidated under 34 missions. Programs are tied to specific government agencies in order to ensure accountability for results. Where more than one agency contributes to a policy objective, each agency has its own program. All expenditures are tied to a specific program. The budget documents provide information on 17 cross-cutting programs (programmes transversales) which cross more than one mission, covering issues such as climate change, road safety, overseas policies, and gender. The cross-cutting programs are attached as an annex to the budget law for information purposes.
The Minister of Environment, Sustainable Development, Transport, and Housing is responsible for the cross-cutting program on climate change (TPCC). The cross-cutting program seeks to ensure consistency between France’s climate plan, commitments regarding mitigation and adaptation, and the government’s budget. The cross-cutting program integrates 26 programs drawn from 11 missions, with programs linked to 28 performance indicators. The cross-cutting program is updated annually by the General Directorate for Energy and Climate Change. The cross-cutting program is not exclusive; programs identified as relating to climate change can also belong to other cross-cutting programs. The cross-cutting program may also include programs for which combating climate change is not necessarily a primary objective. For example, the program "radar" is included in the cross-cutting program on road safety because its primary objective is to reduce vehicular speeds and accidents; it is also included under climate change because it contributes to the reduction of emissions. Total budget appropriations supporting the TPCC is 2012 was €4.4 billion and tax expenditures amounted to €3.3 billion.
Sources: Kraan, D.-J. (2007). Programme Budgeting in OECD Countries. OECD Journal on Budgeting ; République Française (2012). Document de Politique Transversale Project de Loi de Finance pour 2012 – Lutte contre le Changement Climatique.
Climate change considerations can be addressed during budget preparation but will not be reflected
in the structure of the budget used for appropriations. During budget preparation, central finance and
planning agencies can ask institutions to detail their climate-change-related expenditures in each of
their programs, projects, and activities. Climate change policy issues and their expenditure implications
can then be addressed in budget negotiations between sectoral and central agencies. This information
can be consolidated so that an overview of climate change expenditures can be presented in budget
documents submitted to the legislature for information purposes. France is one of the few countries to
do this systematically, providing information on a range of cross-cutting policy objectives as an annex to
the budget documents (see Box 7.5). However, the appropriations structure, which serves as the formal

224
basis for resource allocation and expenditure control, cannot distinguish climate change expenditures in
their totality. In traditional budget systems, appropriations allocate resources between institutions and,
in some countries, departments within those institutions. Where program classifications are used, these
may be the basis for appropriations; the program structure may also be used in conjunction with the
administrative classification (where resources are allocated between programs or resources are
allocated between institutions and then between programs). This will identify climate change
expenditures where this is the primary purpose of the institution or program. It will not capture climate
change expenditures embedded in the budgets of institutions and programs whose primary purpose is
not related to climate change.
7.6. REPORTING CLIMATE CHANGE FINANCE
The “Rio Markers” were developed by OECD-DAC to help track Official Development Assistance
provided to support developing countries’ efforts to implement the 1992 Rio Conventions. The Rio
Conventions are the Framework Convention on Climate Change (UNFCCC); the Convention to Combat
Desertification (UNCCD), and the Convention on Biological Diversity (UNCBD). Introduced as part of the
Creditor Reporting System (CRS), reporting on mitigation-related development assistance began on a
trial basis in 1998 and became a requirement for OECD-DAC members in 2007. The Rio Markers were
extended to cover adaptation-related development assistance starting in 2010. OECD is working to
expand the coverage of the reporting system to include additional donors, non-concessional
developmental loans, and multilateral development banks.
The Rio Markers reporting methodology requires donors to assess the extent to which each of the
activities that they finance targets UNFCC objectives. Guided by the definitions and criteria for
mitigation and adaptation activities presented in Box 7.6, the donor classifies the activity according to
whether adaptation or mitigation is the principal policy objective and is fundamental to the design and
impact of the activity. The donor also classifies whether the activity: would not have been funded but
for an adaptation or mitigation objective; fulfills significant policy objectives, which are, however, not
the principal reason for undertaking the activity; may have been formulated to address or take into
account climate-related concerns; have been screened and found not to be targeted towards the policy
objectives of the Conventions (OECD 2011).
The Rio Markers allow only a rough estimation of development assistance financing mitigation and
adaptation activities. OECD-DAC generates a list of activities that have mitigation and adaptation as
principal and significant objectives which can be sorted by recipient. It also generates summary data for
DAC members. The Rio Markers methodology does not, however, require donors to indicate what
proportion of total project financing is assigned to principal or significant policy objectives. Nor is it
possible to distinguish what share of financing is assigned to mitigation and adaptation where projects
target both objectives and so counted in both categories. Consequently, OECD-DAC advises that the
principal and significant objectives should be shown separately, and cautions that the sum of these

225
categories is an “estimate” or “upper bound” of development assistance in support of a particular
objective.350
Box 7.6. Rio Markers
MITIGATION
Definition The activity contributes to the objective of stabilization of greenhouse gas (GHG) concentrations in the atmosphere at a level that would prevent dangerous anthropogenic interference with the climate system by promoting efforts to reduce or limit GHG emissions or to enhance GHG sequestration.
Criteria The activity contributes to:
the mitigation of climate change by limiting anthropogenic emissions of GHGs, including gases regulated by the Montreal Protocol; or
the protection and/or enhancement of GHG sinks and reservoirs; or
the integration of climate change concerns with the recipient countries’ development objectives through institution building, capacity development, strengthening of the regulatory and policy framework, or research; or
developing countries’ efforts to meet their obligations under the convention.
ADAPTATION
Definition The activity intends to reduce the vulnerability of human or natural systems to the impacts of climate change and climate-related risks by maintaining or increasing adaptive capacity and resilience. This encompasses a range of activities, from information and knowledge generation, to capacity development, to planning and the implementation of climate change adaptation actions.
Criteria The activity is considered climate change adaptation if:
the climate change adaptation objective is explicitly indicated in the activity documentation; and
the activity contains specific measures targeting the above definition.
The principal weakness of this methodology lies in the coding method, which relies entirely on “expert
judgment,” in assessing whether the activity is mitigation- or adaption-related and in determining the
relative weight of these objectives within the project objectives. One recent study used a key term
filter to assess whether donors had accurately coded adaptation projects using the Rio Markers. The
study found that only 55 percent of the projects identified by donors as having adaptation as a primary
or significant objective used one or more of the relevant key terms. The proportion of adaptation-
relevant projects fell still further (to 35 percent) after a more detailed review. Nearly 40 percent of the
“relevant” projects were overcoded in the sense of being identified as having adaptation as a significant
objective rather than the reported primary objective. The study further noted marked differences in the
proportion of projects that had been overcoded between countries.351 These results mirror an earlier
assessment of mitigation projects which concluded that thresholds for scoring significant and principal
objectives differ within and across reporting entities.352 While this may be a result of coding errors, it is
likely that coding is subject to more systematic bias: where governments have identified climate change
350
OECD (2011). OECD Handbook on the OECD-DAC Climate Markers. 351
Junghans, L. and Harmeling, S. (2012). Different Tales from Different Countries: A first Assessment of the OECD “Adaptation Marker”. 352
Michaelowa, A. and Michaelowa, K. (2010). Coding Error or Statistical Embellishment? The Political Economy of Reporting Climate Aid. Zurich Center for Comparative and International Studies.

226
as a priority for development assistance agencies there may be incentives for these agencies to bias
their coding so as to increase the proportion of climate change projects.
There are proposals to extend the application of the Rio Markers beyond OECD CRS development
assistance reporting. The EU Commission has proposed that at least 20 percent of the 2014-2020 Multi-
Annual Financial Framework should be spent on climate-change-related activities. In order to achieve
this goal it will be necessary to identify and track climate-change-related EU-financed expenditures by
member states. The EU Commission has proposed using OECD’s Rio Markers for this purpose. This
applies weights when aggregating expenditures across activities so that all expenditures within projects
with climate change mitigation or adaptation as a principal objective are marked as climate change
expenditures and 40 percent of the projects with climate change as a significant objective are marked as
climate change expenditures. These are arbitrary weightings, and it has been suggested that accuracy
could be improved by allowing agencies to determine their own appropriate weightings based on
project design and feasibility studies.353 OECD-DAC is exploring the feasibility of using the Rio Markers to
report on and track climate-change-relevant development assistance in recipient countries. At the time
of writing, preliminary discussions were underway with partner countries in the context of the post-
Busan development effectiveness agenda.
The World Bank has developed an alternative methodology for reporting climate change finance
based on an estimation of climate change co-benefits. Development activities provide climate co-
benefits when they impact on climate change adaptation and/or mitigation, either as one of the stated
objectives or as positive or negative externalities. The reporting system, which became operational in
July 2012, seeks to track the share of activity financing that could provide direct climate co-benefits. In
contrast to the Rio Markers, the co-benefits methodology assigns a percentage share between 0-100
percent of the activity’s overall financing commitment to adaptation and mitigation at the sub-activity
level, disaggregating by project subcomponent for investment operations and by prior action for
development policy operations. Teams preparing activities are responsible for estimating financing
activity and sub-activity contributions to adaptation and mitigation during the activity appraisal period
at the end of activity design but before implementation. When the impact of an activity in generating
co-benefits is unclear, the share of funding assigned to co-benefits should be zero so as to avoid "green-
washing," (i.e., overstating the climate change impact of financing). The co-benefits coding should be
used in conjunction with sector codes, but financing should be shared equally across sectors when more
than one World Bank sector is relevant to a particular activity/prior action (unless there is a clear
rationale for doing otherwise).
While the World Bank co-benefits methodology represents an advance on the Rio Markers in terms of
providing more disaggregated estimates of adaptation and mitigation financing, the resulting data is
still only a rough estimate. Data will be based on estimates generated at project preparation and so will
not necessarily take into account changes introduced during implementation. Just as with the Rio
Markers, however, the principal weakness lies in the extent to which the method relies on judgment:
353
Medarova-Bergstrom, K. and Volkery, A. (2012). Walking the Talk: Practical Options for Making the EU MF 2014-2020 deliver on Climate Change. Institute for European Environmental Policy.

227
first, in determining whether activities will generate co-benefits and, second, in assigning the proportion
of financing to the generation of these co-benefits. The risk that co-benefits will be incorrectly identified
is mitigated somewhat by the provision of guidance in the form of an illustrative typology of activities
with adaptation and mitigation, case examples, and a quality assurance process that will review
consistency in application of the methodology across World Bank operations.354 The risk that the
proportion of activity financing that generates these co-benefits will be over or underestimated is more
difficult to address in the absence of detailed information on the costing of specific activity outputs and
outcomes. In the current state of knowledge, comparable quantitative information on activity co-
benefits can only be generated for mitigation activities.
7.7. TAGGING CLIMATE-RELEVANT EXPENDITURES
The budget process can be used to tag spending related to climate change and track the expenditures.
Performance-oriented approaches to budgeting can be used to create more transparency over the
allocation of funds to programs, the outputs to be delivered, and the intended outcomes. Administrative
data can be collected for monitoring, and programs and projects subjected to selective evaluation. This
data can be used for reporting to the legislature and to the public, as well as to meet donor monitoring,
reporting, and verification requirements. Reviews of climate finance issues by legislative committees,
both at the time of budget approval and during the end-of-year review of the budget execution report
and annual reports of relevant individual multilateral development agencies, would add value to the
process of climate change budgeting.
In the U.S., Office of Management and Budget (OMB), Office of Science and Technology Policy (OSTP),
and Council on Environmental Quality (CEQ) use executive-level guidance memoranda to define
climate change priorities within the overall federal budget. The directors of OMB and OSTP described
climate change priorities within the science and technology budget in a July 21, 2010, memorandum for
the heads of executive departments and agencies titled Science and Technology Priorities for the FY
2012 Budget. The memorandum instructs agencies to explain in their budget submissions how they will
redirect available resources, as appropriate, from lower-priority areas to science and technology
activities that address the challenges. The two directors issued a similar memorandum for the FY 2011
budget on August 4, 2009 Overarching climate change priorities are also discussed by OECC policy
committees and through discussions convened by the assistant to the president for energy and climate
change.
Several U.S. agencies stated in a survey that requests for climate change funding data should come
from one source to increase the efficiency and consistency of reporting. According to one respondent,
“if possible, it would be great if one organization (OMB) were the sole entity that requested information
from departments. That would help to ensure consistency and the use of common definitions and
terms.” Another respondent added that “a more formal request—with better guidance on what should
be reported—coming from OMB … might impose more discipline and accuracy on the process.”
354
World Bank (2012). Typology of Activites With Climate Co-Benefits by WB Sector.
228
An integrated budget review process could also be a way to better align agency funding and
interagency priorities. According to OSTP, more interaction between OMB, OSTP, and agency budget
and programmatic leads would help to develop more consistent reporting and provide a better
framework for developing initiatives and building in cross-cutting strategic elements. As a means of
achieving this goal, OMB and OSTP held a budget hearing with the U.S. Global Change Research Program
(USGCRP) and agency officials in September 2010.
Many agencies reported wanting additional guidance from OMB, OSTP, and USGCRP about how to
classify and report climate change funding. It would be useful to have specifications on how to better
define the categories and what information is needed. One possible approach suggested by a survey
respondent was to reach agreement with legislative appropriators on a set of definitions and criteria for
climate change programs that could be used for several years. Several respondents also noted that
guidance is needed to clearly articulate what is and is not considered to be climate change funding.
OMB’s past practice of favoring interagency priorities over individual agency priorities when
collectively reviewing climate science budget decisions was also discussed. The participants in the
roundtable discussion emphasized that there needs to be a carrot (a flexible pool of funding to
encourage agency participation) and a stick (a penalty for not addressing interagency priorities) to
enhance agency implementation of interagency program priorities. According to interviews with
stakeholders, past USGCRP funding decisions vetted by an integrated budget review process were
enforced by “fencing.” Once agencies signed off on their contribution to the USGCRP during budget
negotiations with OMB, funding became fenced off. Therefore, once an agency committed funds it was
not allowed to change its mind (i.e., OMB would not allow an agency to reprogram the funds for other
purposes).
Some developing countries are starting to code and track actual climate-change-related expenditures
at the national level. In 2012, a Climate Change Public Expenditure and Institutional Review (CCPEIR)
conducted in Morocco with the support of the World Bank helped tag climate expenditures and
revealed some deficiencies in the climate budgeting process (Box 7.7). A CCPEIR in Vietnam (2012)
aimed at establishing a systematic basis for climate change response management; to support this
objective, it developed a typology guide to be used by the government in tracking climate-change-
related expenditures (Box 8.8). UNDP piloted methodologies for a CCPEIR in Nepal (2011); four more
studies have since been completed (in Bangladesh, Cambodia, Fiji, Nauru, Samoa, Thailand and Vietnam)
(See Boxes 7.2 and 7.3). Five more studies have been initiated in Burkina Faso, China, Kenya, Nicaragua
and Pakistan. The CCPEIR was intended as a first step to enable national policymakers to assess the
present status of the national response to climate change, in readiness for scaling up access and delivery
of climate finance. Each study was designed to provide an early indicative estimate of the public
resources being channeled to address climate change and to assess the extent to which the national
policy and institutional context guides those expenditures. Given the lack of a preexisting international
or in-country definition of climate-change-related spending, there were some differences in
methodology among the countries. Nepal has since introduced a climate change budget code to
systematically track budgeted and actual spending.
229
Box 7.7. Morocco: Climate Change Public Expenditure and Institutional Review Helped to Tag Climate Expenditures
Morocco is highly vulnerable to climate change, particularly in three key areas–water resources, agriculture, and physical infrastructure. Budgetary spending on climate measures is significant and needs to be efficient, especially considering limited budget resources and competing national priorities. With the support of the World Bank, the Climate Change Public Expenditure and Institutional Review (CCPEIR) program conducted an assessment of climate change public spending to help the government increase climate spending efficiency, tag climate-related expenditures, and mainstream climate spending in the budget process (including the development of a Climate Medium Term Expenditure Framework (MTEF). The assessment covered public expenditure from 2005-2010. Five sectors were selected based on their mitigation potential and climate vulnerability: agriculture, energy, water and forestry, solid waste, and sanitation.
The CCPEIR revealed considerable public investments by the government in favor of the selected sectors. A more detailed analysis showed a preponderance of infrastructure programs. Much of the funding was in favor of adaptation activities, notably related to water resource management. Spending on adaptation accounted on average for 64 percent of climate expenditures (and 9 percent of national investment expenditures) over the reviewed period, most of which went to the water and agriculture sectors. Most of the investment programs and projects in these sectors addressed water efficiency and were closely linked with traditional development projects (e.g., dams, hydro-agricultural development).
About a third of climate-relevant expenditures were funded through special accounts managed by respective sectoral ministries. The recently established Fund to address Natural Disaster (Fonds de Lutte contre les Catastrophes Naturelles) is an important tool for the government in addressing prevention and mitigation aspects, but its management, impact, and sustainability raise questions and point to the need for reform.
The CCPEIR also revealed that mainstreaming of climate change issues into strategic decision making and budget processes remained limited. This was due in part to the lack of a clear and sound climate strategy, as well as to weak climate governance arrangements. As a result, (1) the integration of climate issues in the sectoral strategies and budget planning varied among sectors; (2) processes and systems to support climate activities have not yet been developed; (3) the chart of accounts did not allow for identification of specific climate-relevant expenditures; (4) central and local government agencies have not been motivated to develop specific climate activities; and (5) existing performance indicators did not yet include climate change.
Budget planning tools, such as the MTEF, constitute a key entry point for mainstreaming climate change in strategic planning. As part of the CCPEIR, a draft framework for a climate MTEF was prepared, incorporating key climate programs and projects and climate performance indicators.
Source: World Bank (2012). Morocco Climate Change Public Expenditure and Institutional Review.
There is an inevitable degree of subjectivity in these studies in determining how relevant different
expenditures are to climate change. This is partly due to the fact that a large proportion of climate-
relevant spending in these studies is embedded in sector expenditures with other primary objectives;
isolating the climate change component of these expenditures is a subjective exercise. Therefore, while
each study came up with a quantitative estimate of climate-relevant spending as a proportion of total
expenditure and GDP, the data have limitations for the purpose of cross-country comparisons.
To date the methodology in most studies has focused on adaptation rather than mitigation, and has
not attempted to identify spending that has a negative impact on (i.e., that exacerbates) climate
change. Reflecting country levels of development, policy attention in most countries is focused on
adaptation. The exception is Thailand, where mitigation was an important part of the CCPEIR. In each of
the five studies, the only expenditures measured were those that have a positive impact on climate

230
Box 7.8. Developing a Typology Guide to Climate-Change Response Expenditures (TCCRE) in Vietnam
A CCPEIR in Vietnam, a joint UNDP-World Bank initiative, was aimed at establishing a systematic basis for climate change response management and giving a snapshot of climate change expenditures and their trends. It developed a typology guide, a basic Manual for use by the Government of Vietnam in tracking climate-change-related expenditures.
The fundamental difficulty in compiling an overview of climate-change-related spending is the limited information on the purpose, objectives, and expected outcomes associated with individual projects. To overcome this issue, each investment was reviewed in five sequential steps, permitting the investment and recurrent expenditure to be positioned in the typology and associated data tables.
Step 1: Is the Expenditure Climate-Change-Related?
Answer: If the investment is assessed to be climate-change-related, it passes to the next step; otherwise it is rejected.
Comments: This decision depends to some extent on national circumstances. It is critical that project documents include enough information on objectives to determine clearly whether or not a project is climate change related.
Step 2: How to group Expenditures by Climate Change Task?
Answer: Each investment is assigned to a task category of the typology; if this is not possible, the investment is rejected.
Comment: Each investment should be placed into one task-level category. If investments have activities which fit into more than one task category, then it is necessary to select a category in which a majority of the activities (in budget terms) take place. This step requires discussions with line ministries and provinces who help identify to which climate change objective each project should be assigned.
Step 3: How to determine whether the Investment is Adaptation- or Mitigation-Related?
Answer: Each investment is coded as adaptation or mitigation.
Comment: An activity should be classified as adaptation-related if it intends to reduce the vulnerability of human or natural systems to the impacts of climate change and climate-related risks by maintaining or increasing adaptive capacity and resilience. An activity should be classified as mitigation-related if it contributes to the objectives of stabilization of GHG concentrations in the atmosphere at a level that would prevent dangerous anthropogenic interference with the climate system by promoting efforts to reduce or limit GHG emissions or to enhance GHG sequestration (OECD 2011). Some investments may have elements of both adaptation and mitigation, in which case either the main intent of the project or the main focus of the outcomes/impacts should be used to identify the focus of the investment.
Step 4 – What is the Proportion of Expenditure Related to Climate Change?
Answer: Each investment is coded as complete or has having high, medium, low, or marginal relevance.
Comment: It is highly desirable that projects be appraised in terms of their impact on climate change. Project appraisal data, however, might not be readily accessible. To help address this question, the percentage of the project activities targeted at climate-change-related investments can be estimated. If a project has 40 percent of the project activities targeted at climate-change-related, then inclusion of 40 percent of the management and administrative costs is appropriate.
Step 5: Compilation of Analytical Tables
The data must be collected at the most granular level of CCPEIR analysis, which is an investment item or a financial entity. The database allows generation of tables and charts showing spending allocations and provide a snapshot of how spending has been distributed among policy areas and activities. Reformulation of the typology’s task-level coding into policy objectives can then be carried out. This permits climate-change-related expenditure to be linked to policy objectives. This has a valuable function in oversight of the pattern of spending across policy areas. Source: World Bank and UNDP (2012). CCPEIR Methodology: Application and Development for Vietnam.
231
change. The CCPEIR currently underway in Indonesia, however, which is focusing on how the
government can meet its ambitious climate change mitigation targets, is incorporating budget subsidies
for fossil fuel consumption in the analysis.
A further limitation of the approaches to date is that they focus attention on on-budget central
government spending, although this is not inherent in the approach. Focusing on the government’s
budget–and often only the development budget–leaves out fiscal support through extra-budgetary
funds, government guarantees, Public Private Partnerships, government resources channeled through
the revenue side of the budget (e.g., tax incentives), spending by subnational governments, public
infrastructure investments by State-Owned Enterprises (that ameliorate or exacerbate climate change),
and the relationship between taxation, energy pricing, and climate change. In some countries, on-
budget spending may well be a relatively narrow and small component of climate-change-related public
resources (both positive and negative).
It is important that the scope of analyses of climate finance not be confined to what is more easily
measured but may be less important and that a more internationally consistent methodology is
pursued in future studies. The differences in methodology in classifying climate change spending are
partly a practical problem, and there is no reason in principle why fiscal activities outside of the budget
cannot be incorporated into future analyses. Data availability will be an issue in some cases, but the
existing studies have already shown that it is possible in some instances to incorporate “dirty spending”
in the form of subsidies (e.g., Indonesia), expenditures by selected subnational governments (e.g.,
Nepal), and mitigation-related spending by state-owned enterprises (e.g., Samoa). The CCPEIRs also
identified a need to move beyond expenditure data, to indicators of outputs and outcomes, in order to
assess the quality of spending.
7.8. OFF-BUDGET CLIMATE EXPENDITURES
Off-budget expenditures are financial transactions that are not reflected in the budget. Off-budget
expenditures can take different forms, the most common being subsidies to public enterprises, credits
provided by governments, government guarantees, and subsidies routed through the tax system. The
IMF Government Financial Statistics (GFS) Manual defines subsidies narrowly as unrequited payments
by government to enterprises which seek to influence the level of production, the price of products, or
the remuneration of the enterprise. Following GFS, subsidies are payable only to producers, not to
consumers, and are current rather than capital payments. Payments to nongovernmental entities are
reported as transfers, and payments to enterprises to finance capital formation or to cover operating
deficits accumulated over more than two years are reported as a miscellaneous other capital expense.355
The World Trade Organization takes a broader view, including direct payments to enterprises,
guarantees, tax expenditures, and the provision of goods and services or the purchase of products
(WTO, 2007) For conceptual purposes, it is helpful to take a still broader view and consider subsidies as
interventions that result in the provision of goods at a price below opportunity cost (see Box 7.9). This
355
IMF Stateistics Department (2001). Government Finance Statistics Manual 2001 (GFSM 2001). Note that IMF studies on subsidies are based on a broader defintion than that in the IMF manual.
232
recognizes that regulatory instruments, such as quotas and purchase requirements, also have price
effects and entail transfers between agents.
Box 7.9. Energy subsidies: Economic Costs and Sources of Financing
Energy subsidies have wide-ranging economic consequences. While aimed at protecting consumers, subsidies aggravate fiscal imbalances, crowd-out priority public spending, and depress private investment, including in the energy sector. Subsidies also distort resource allocation by encouraging excessive energy consumption, artificially promoting capital-intensive industries, reducing incentives for investments in renewable energy, and accelerating the depletion of natural resources. Most of the benefits of subsidies are captured by higher-income households, reinforcing inequality. Even future generations are affected through the damaging effects of increased energy consumption on global warming.
Energy subsidies are pervasive and impose substantial fiscal and economic costs in most regions. On a pre-tax basis, subsidies for petroleum products, electricity, natural gas, and coal reached $480 billion in 2011 (0.7 percent of global GDP or two percent of total government revenues). The cost of subsidies is especially acute in oil exporters, which account for about two-thirds of the total. On a post-tax basis—which also factors in the negative externalities from energy consumption—subsidies, at $1.9 trillion, are even higher (2.5 percent of global GDP or eight percent of total government revenues). The advanced economies account for about 40 percent of the global post-tax total, while oil exporters account for about one-third. Removing these subsidies could lead to a 13-percent decline in CO2 emissions and generate positive spillover effects by reducing global energy demand.
Although energy subsidies do not always appear on the budget, they must ultimately be paid by someone. Whether and how subsidies are reflected in the budget will depend on who incurs them and how they are financed. For example, the cost of pre-tax consumer subsidies may be incurred by state-owned enterprises (SoEs) that sell electricity or petroleum products at a price below supply costs. If the government fully finances these losses with a transfer, the consumer subsidy will be reflected in the budget as an expenditure and financed through higher taxes, increased debt, or higher inflation if the debt is monetized. In many instances, however, the subsidy may be financed by the SoE and reflected in its operating losses or as lower profits, lower tax payments to the government, the accumulation of payment arrears to its suppliers, or a combination of all three.
Alternatively, the cost of consumer subsidies could be offset by subsidized access to energy inputs, the cost of which would again fall on the government. In practice, the ways in which subsidies are financed and recorded in the budget vary across countries and can change over time. For example, whereas Indonesia, Jordan, and Malaysia fully record fuel subsidies in their budgets, Sudan and Yemen only partially record subsidies; all subsidies are off-budget in Angola. In India, the extent to which fuel subsidies are recorded in the budget has varied.
Source: IMF (2013). Energy Subsidy Reform: Lessons and Implications. IMF, Washington, DC.
Subsidies are financed through various channels that are often not captured in government budgets
and financial statements (see Box 7.10). Explicit subsidies that are direct budgetary payments (i.e.,
made through budgeting) are relatively straightforward,. They create problems, however, because
budget projections are based on price assumptions that are notoriously subject to error. Guarantees will
only be captured in most countries if there is a specific registry in place. Implicit subsidies and tax
expenditures, meanwhile, are much more difficult to track. Implicit subsidies occur where a state-owned
enterprise or other entity absorbs the cost of providing energy at lower than market prices. These are
quasi-fiscal operations. If the government does not compensate the enterprise, the financial burden
may result in reduced investments, lowered profits, reduced tax payments, and accumulation of arrears.
These activities will only be sustainable long term if they are brought on budget. Implicit subsidies are
also found in fossil-fuel-producing countries where SoEs are required to sell on domestic markets above
cost-recovery but below international market prices. In principle, the cost of quasi-fiscal operations

233
should be included in government financial reports so as to provide a more comprehensive picture of
the overall fiscal position. Governments also finance subsidies through preferential tax treatment, such
as use of tax credit and the application of lower than prevailing tax rates. Tax expenditures should also
be reflected in government budget and financial statements; in practice, however, this reporting tends
to be poor.
Box 7. 10. Financing Fuel Subsidies in India
Domestic fuel prices in India have not kept pace with rising international fuel costs, resulting in consumer price subsidies which amounted to nearly two percent of GDP in FY 2011/12. Fuel subsidies have been financed through a number of channels, including off-budget sources. Subsidies are incurred in the first instance by the predominantly state-owned oil marketing companies (OMCs), who sell fuel products to consumers at subsidized prices. The losses incurred by OMCs have been financed in a variety of ways. In FY 2007/08, just less than one-half of the financing was recorded on budget, with the remaining half financed off budget. On-budget transfers mainly took the form of so-called government “oil bonds” issued to OMCs; direct budget transfers to OMCs were negligible. Off-budget financing was split between transfers from state-owned enterprises involved in the upstream production of crude oil and self-financing by OMCs. In effect, OMCs used part of the profits from the sale of other, unregulated, fuel products to offset their subsidy losses. By FY 2011/12, all on-budget financing took the form of direct budget transfers to OMCs, which accounted for around three-fifths of subsidies; the remainder was financed by upstream transfers.
Source: IMF (2013). Energy Subsidy Reform: Lessons and Implications. IMF, Washington, DC.
Cross subsidies are distinct because they are financed by consumers rather than by governments.
Cross subsidies arise where the cost of providing a good or service to a particular group is not reflected
in the price that consumers pay; the loss is covered by higher prices for other consumers. Cross
subsidization is common in the provision of network services such as electricity or gas, where consumers
in some areas (e.g., rural areas) pay the same rates as consumers in urban areas despite the higher cost
of providing services. The service provider is able to recover costs, but the average cost is higher than it
would otherwise be and so the enterprise becomes vulnerable to competitors picking off their lower-
cost consumers.356
The value of subsidies is usually estimated using the price-gap approach, which compares the
observed price of the subsidized product with an appropriate reference price that reflects the market
price in the absence of government intervention. In the case of traded goods, such as fossil fuels, the
delivered border price usually provides an appropriate benchmark. For other products, such as
electricity, the benchmark is usually taken as the long-run marginal cost (i.e., the cost of bringing a unit
of additional capacity to the market). Subsidies can be calculated as before-tax or after-tax, reflecting
the extent of tax expenditures and negative externalities in the tax regime. While the price-gap
approach is widely used, in part because it can generate internationally comparable estimates, it does
have limitations. In particular, the approach tends to underestimate subsides because it only captures
those that benefit consumers through lower prices. The price-gap approach does not, for example,
identify a subsidy that sustains a poorly performing state-owned enterprise. This may lead to systematic
biases, such as underestimating subsidies for emerging technologies (such as renewables) by failing to
356
World Bank (2010). Subsidies in the Energy Sector: An Overview.
234
reflect support before commercialization, the impact of regulatory quotas, and subsidies to off-grid
systems.357 Finally, the price-gap approach offers little actionable information. While it provides a total
subsidy value, it is unable to distinguish subsidies’ relative impacts on prices or their effectiveness in
achieving policy goals.
An alternative approach entails the systematic identification of subsidy programs and the valuation
and aggregation of benefits to recipients. This bottom-up approach requires detailed analysis and cost
estimation for each subsidy. This is relatively straightforward in the case of direct subsidies; it becomes
more complicated when valuing the benefits related to equity participations, income and price support,
quasi-fiscal operations, tax expenditures, and cross-subsidies. The Global Subsidies Initiative has
developed a manual identifying many of the techniques available for undertaking this analysis.358
Application of this approach does provide a more detailed understanding of the range of subsidies and
the cost of individual subsidy programs. The OECD, for instance, has used this approach to generate an
inventory of fossil fuel subsides in member states, identifying a total of 550 budgetary support and tax
expenditures measures.359 It is questionable, however, to what extent the cost of individual subsidy
programs can be aggregated. At the national level, the focus on individual subsidy programs fails to take
into account that individual subsidy is part of a complex system in which a change in one element of the
subsidy regime will lead to changes in behavior that impact on the cost of other subsidy programs.360
The OECD strongly cautions against the aggregation of data across countries (although the OECD does
include such estimates suggested that the level of budgetary support and tax expenditures among OECD
countries amounted to $55-90 billion a year in 2005-2011 period.361
Choice of technique can lead to markedly different valuations. Tax expenditures, for instance, can be
estimated on the basis of revenue forgone (simply the rate of the tax concession multiplied by the
uptake; revenue gain (the amount of revenue that the government would recover if the tax expenditure
were eliminated; this incorporates behavioral changes); and expenditure equivalent (the value of a
direct subsidy that would be needed to achieve the same outcome).
357
Koplow, D. (2009). Measuring Energy Subsidies Using the Price Gap Approach: What does it Leave Out?. International Institute for Sustaianble Development. 358
Jones, D. and Steenblik, R. (2010). Subsidy Estimation a Survey of Current Practice. Geneva: International Institute for Sustainable Development. 359
OECD (2012). Inventory of Estimated Budgetary Support and Tax Expenditures for Fossil Fuels 2013. 360
Mackenzie, K. and Mintz, J. (2011). The Tricky Art of Measuring Fossil Fuel Subsidies: A Critique of Existing. 361
OECD (2012). Inventory of Estimated Budgetary Support and Tax Expenditures for Fossil Fuels 2013.

235
REFERENCES Arnell, N.W., E.L Tompkins and W.N. Adger (2005).
“Eliciting Information From Experts On The
Likelihood Of Rapid Climate Change” in Risk Analysis.
Volume 25 No.6, pp. 1419-1431
Ackerman, Frank et al. (2009). Limitations of
Integrated Assessment Models of Climate Change.
Adapted from INTOSAI WGEA (2010). "Auditing the
Government Response to Climate Change: Guidance
for Supreme Audit Institutions."
Afonso, A., Schuknecht, L. and Tanzi, V. (2005).
“Public Sector Efficiency: An International
Comparison” in Public Choice. January, 123(3-4), pp.
321-347.
Agrawala, S. et al. (2011). “Private Sector
Engagement in Adaptation to Climate Change:
Approaches to Managing Climate Risks.” OECD
Environment Working Papers, No. 39.
Agrawala, Shardul et al. (2010). "Plan or React?
Analysis of Adaptation Costs and Benefits Using
Integrated Assessment Models."
Allen and Radev (2010). "Extrabudgetary Funds."
IMF Technical Notes and Manuals.
Alliance Environnement (2007). "Evaluation of the
Application of Cross Compliance as Foreseen under
Regulation 1782/2003: Descriptive Report."
Deliverable prepared for DG Agriculture.
Alonso, Rosa, Lindsay Judge, and Jeni Klugman
(2005). PRSPs and Budgets. A Synthesis of Five Case
Studies.
Anderson, Barry and James Shepherd (2009). “Fiscal
Futures, Institutional Budget Reforms, and Their
Effects: What Can Be Learned?” OECD Journal on
Budgeting, Volume 2009/3, pp. 7-117.
Anthoff, A. & R. Hahn (2010). "Government Failure
and Market Failure: On the Inefficiecy of
Environmental and Energy Policy." Oxford Review of
Economic Policy, 26(2), pp. 197-224.
Anthony Leiserowitz and Lucy Michaels (2010). "Yale
Project on Climate Change. Yale Global Perspectives
on Climate Change: Preliminary Findings from the
Gallup World Poll."
APEC (2005). "Thailand’s Energy Efficiency Revolving
Fund: A Case Study." Prepared for the APEC Energy
Working Group by the Energy Futures Australia and
Danish Management Group.
Asian Tiger Capital Partners (2010). "A Study to
Engage the Private Sector in Climate Change
Adaptation in Bangladesh."
Attorney General’s Office, Government of Australia
(2011). "Natural Disaster Relief and Recovery
Arrangements."
Auditor General of Canada (2012). "Meeting
Canada’s 2020 Climate Change Commitment."
Austin, D. Andrew and Mindy R. Levit (2012).
"Mandatory Spending Since 1962." Congressional
Research Service.
Bacon, R., S. Bhattacharya,and M. Kojima (2010).
Expenditure of Low-Income Households on Energy:
Evidence from Africa and Asia. World Bank.
Bahadur, A., Ibrahim, M. and Tanner, T. (2010). "The
Resilience Renaissance? Unpacking of Resilience for
Tackling Climate Change and Disasters." Discussion
Paper no. 1.
Belli, P. et al. (2001). "Economic Analysis of
Investment Projects: Analytical Tools and Practical
Applications." World Bank Institute (WBI).
Bennett, J., van Buren, M. and Whitten, S. (2004).
“Estimating Society's Willingness to Pay to Maintain
Viable” in The Australian Journal of Agricultural and
Resource Economics, 48: pp 487-512.

236
Benson, C. and Clay, E. (2004). Understanding the
Economic and Financial Impacts of Natural Disasters.
World Bank Disaster Risk Management Series.
Besant-Jones, J. E. (2006). "Reforming Power
Markets in Developing Countries: What Have We
Learned?" Discussion Paper No. 19. World Bank.
Birol, F. (2007). "Energy Economics: A Place for
Energy Poverty in the Agenda?" The Energy Journal,
28 (3), pp. 1-6.
Breisinger, C., W. Engleke, and O. Ecker (2011).
"Petroleum Subsidies in Yem: Leveraging Reform for
Development." International Food Policy Research
Institute.
Brown et al (2010). "Climate Finance Additionality:
Emerging Definitions and Their Implications." ODI
and Heinrich Boll Stiftung Climate Policy Brief No. 2.
Bulkeley, H. (2010). "Climate and the Governing of
Climate Change." Annual Review of Environment and
Resources, Volume 35, pp. 229-253.
CABRI and ADB (2008). "Budget Practices and
Procedures in Africa."
Casillas, C. and Kammen, D. (2010). “The Energy-
Poverty-Climate Nexus” in Science. Volume 330, pp.
1181-1182.
CDM (2012). "Climate Change, Carbon Markets and
the CDM: A Call to Action." Report of the High-Level
Panel on the CDM Policy Dialogue.
Cebotari, Aliona et al (2008). Fiscal Risks: Sources,
Disclosure, and Management. IMF Fiscal Affairs
Department.
China National Audit Office (2011). "Audit
Investigation Findings of Energy Conservation and
Emission Reduction of Enterprises in 20 Provinces."
No. 11 of 2011.
Chivakul, Mali and Robert York (2006). "Implications
of Quasi-Fiscal Activities in Ghana." IMF Working
Paper WP/06/24.
Clarke, Daniel (2012). "Cost-Benefit Analysis of the
African Risk Capacity Facility: Malawi Country Case
Study."
Clean Development Mechanism (CDM) (2012).
"Assessing the Impact of the Clean Development
Mechanism Report." Commissioned by the High
Level Panel on the CDM Policy Dialogue.
Climate Investment Fund (2013). CIF Annual Report
2013.
Climate Policy Initiative (CPI )(2013). The Global
Landscape of Climate Finance.
Collaborative Africa Budget Reform Initiative (CABRI)
(2009). Putting Aid on Budget - Good Practice Note:
Using Country Budget Systems.
Commonwealth of Australia (2010). "Australia to
2050: Future Challenges."
Controller and Auditor-General (2011). "The
Emissions Trading Scheme: Summary Information for
Public Entities and Auditors."
Corfee-Morlot, J. et al. (2009). Cities, Climate
Change, and Multilevel Governance. Organization of
Economic Cooperation and Development.
Cummins, David and Olivier Mahul (2009).
"Catastrophe Risk Financing in Developing Countries:
Principles for Public Intervention."
Dalal-Clayton, Barry and Steve Bass (2009). "The
Challenges of Environmental Mainstreaming:
Experience of Integrating Environment into
Development Institutions and Decisions,
International Institute."
Dana, Julie (2010). "Brief on Drought Risk
Management work in Malawi-2005-2010."
DCLG (2009). "Multi-Criteria Analysis: A Manual."
De la Fuente, Alejandro (2010). "Government
Expenditures in Pre- and Post-Disaster Risk
Management." Background Note for World Bank–
237
U.N. Assessment on the Economics of Disaster Risk
Reduction (2010).
De Mooij, R., Parry, I. and Keen, M. (2013).
“Summary for Policy Makers." In Fiscal Policy to
Mitigate Climate Change: A Guide for Policy Makers.
Dechezleprêtre, A. et al. (2011). "Invention and
Transfer of Climate Change–Mitigation Technologies:
A Global Analysis." Revue of Environmental
Economic Policy, 5(1), pp. 109-130.
Department of Budget and Management (2012).
"National Budget Circular, No. 543." October 10,
2012. Republic of the Philippines.
Department of Energy and Climate Change (2009).
"Carbon Valuation in UK Policy Appraisal: A Revised
Approach."
Deutsche Gesellshaft für Internationale
Zusammenarbeit (GIZ) and World Resources
Institute (2011). "Making Adaptation Count:
Concepts and Options for Monitoring and Evaluation
of Climate Change Adaptation."
Dixt, Aarjan et al (2011). “Ready or Not: Assessing
National Institutional Capacity for Climate Change
Adaptation."
Dobes, L. and Bennett, J. (2009). “Multi-criteria
Analysis: 'Good Enough' for Government Work?” in
Agenda: A Journal of Policy Analysis and Reform.
16(3), pp. 7-29.
Dobes, Leo (2010). “Sir Sidney Kidman: Australia’s
Cattle King as a Pioneer of Adaptation to Climatic
Uncertainty.” in The Rangeland Journal. Vol 34(1).
Dobes, Leo (2012). Adaptation to Climate Change:
Formulating Policy under Uncertainty. CCEP Working
Paper 1201.
Downing, Thomas and Anand Patwardhan (2003).
"Assessing Vulnerability for Climate Adaptation."
AFP Technical Paper 3, UNDP.
Economics Group (2007). "The Social Cost of Carbon
and the Shadow Price of Carbon: What They Are,
And How to Use Them in Economic Appraisal in the
UK." London: Department of the Environment, Food
and Rural Affairs.
Ekins, P., Kesicki, F. and Smith, A. (2011). "Marginal
Abatement Cost Curves: A Call for Caution." A
report from UCL Energy Institute commissioned by
Greenpeace.
Ellis, J. (2010). "The Effects of Fossil-Fuel Subsidy
Reform: A Review of Modelling And Empirical
Studies." Global Subsidies Initiative, International
Institute for Sustainable Development.
Energy Sector Management Assistance Program
(ESMAP) (2012). Public Procurement of Energy
Efficient Products. Lessons from Around the World.
Environmental Protection Agency (2008).
"Renewable Energy Certificates."
Esch, A. (2012). "An Innovative Approach: The
German Use of ETS Revenues for National and
International Climate Financing." Germanwatch.
European Commission (2012). "Renewable Energy: A
Major Player in the European Energy Market."
European Commission (2013). "The EU Emissions
Trading System."
European Commission (2013). “Guidance on
Integrating Climate Change and Biodiversity into
Environmental Impact Assessment.”
European Council (2013). "European Council, 7/8
February 2013, Conclusions: Multi-Annual Financial
Framework." EUCO 37/13.
European Environment Agency (2013). "Trends and
Projections in Europe 2013—Tracking Progress
Towards Europe’s Climate and Energy Targets Until
2020."
EuroSAI (2012). "Adaptation to Climate Change – Are
Governments Prepared?"
Eurostat (2010). Environmental Statistics and
Accounts in Europe.

238
Feifel, K. (2010). "Using Robust Decision Making as a
Tool for Water Resources Planning in Southern
California." Retrieved from
http://www.cakex.org/case-studies/1029.
Fengler, Wolfgang et al (2008). "Managing Post-
Disaster Reconstruction Finance: International
Experience in Public Financial Management." World
Bank Policy Research Working Paper 4475.
Fischer, C. (2010). "Renewable Portfolio Standards:
When Do They Lower Energy Prices?" The Energy
Journal, 31(1), pp. 101-120.
Fonden, GFDRR and World Bank (2012). "Fonden:
Mexico’s Natural Disaster Fund – A Review."
Food and Agriculture Organization of the United
Nations (2009). "How to Feed the World in 2050."
Fozzard, Adrian (2001). "The Basic Budgeting
Problem: Approaches to Resource Allocation in the
Public Sector and their Implications for Pro-Poor
Budgeting." Working Paper 147. Centre for Aid and
Public Expenditure.
Francesco Molteni (2012). "Discretionary versus
Automatic Public Expenditure." Paris School of
Economics.
Frondel, M., C. M. Schmidt, and C. Vance (2012).
"Emissions Trading: Impact on Electricity Prices and
Energy-Intensive Industries." Interecomomics,
Volume 2, pp. 103-111.
G20 (2012). "Summary of Progress Reports to G-20
Leaders on the Commitment to Rationalize and
Phase Out Inefficient Fossil Fuel Subsidies."
Galarraga, I., M. Gonzalez-Eguino, and A. Markandya
(2011). "The Role of Regional Governments in
Climate Policy. Environmental Policy and
Governance." Volume 21, pp. 164-182.
GAO (2011). "Climate Change: Improvements
Needed to Clarify National Priorities and Better Align
Them with Federal Funding Decisions." GAO-11-317.
GAO (2013). "Climate Change: Future Federal
Adaptation Efforts Could Better Support Local
Infrastructure Decision Makers." Report to
Congressional Requesters.
Garcia, M. and C. M. T. Moore (2012). "Cash
Dividend: The Rise of Cash Transfer Programs in Sub-
Saharan Africa."
GEF (2012). "Progress Report: Accreditation Process
for GEF Project Agencies." GEF/C.43/07. October 16,
2012.
GEF (2014). "Report of the Trustee."
GEF Independent Evaluation Office (2014). "Fifth
Overall Performance Study of the GEF."
Ghesquiere, Francis and Olivier Mahul (2010).
"Financial Protection of the State against Natural
Disasters: A Primer." World Bank Policy Research
Paper 5429.
Ghesquiere, Francis and Olivier Mahul (2010).
"Financial Protection of the State against Natural
Disasters: A Primer." World Bank Policy Research
Working Paper 5429.
Gillingham, R. and M. Keen. Forthcoming.
"Mitigation and Fuel Pricing in Developing
Economies." In Fiscal Policy and Climate Change: A
Guide for Policy Makers, eds. R. D. Mooij, I. W. Parry,
and M. Keen.
Global Facility for Disaster Reduction and Recovery,
World Bank (2012). "Mexico’s Natural Disaster
Fund—A Review."
Global Facility for Disaster Reduction and Recovery,
The World Bank (2011). "Turkish Catastrophe
Insurance Pool: Providing Affordable Earthquake Risk
Insurance."
Global Humanitarian Assistance (2011). "Pooled
Funding Mechanisms and Large-Scale Disasters: Case
Studies of Haiti and Pakistan."
Global Reporting Initiative (2011). Sustainability
Reporting Guidelines.
239
Gomez-Echeverri, Luis (2010). "National Funding
Entities: Their Role in the Transition to a New
Paradigm of Global Cooperation on Climate Change.
European Capacity Building Initiative Policy Report."
Gordon, E. and L. Dilling (2010). "An Empirical
Approach to Defining Success in Adaptation." Paper
presented at Initiative on Climate Adaptation
Research and Understanding Through the Social
Sciences.
Government Accountability Office (GAO) (2013).
"High-Risk Series: An Update." Report to
Congressional Committees.
Government of India (2009). "National Action Plan
on Climate Change, Prime Minister’s Council on
Climate Change."
Government of Mexico (2012). "Disaster Risk
Management in Mexico: from response to risk
transfer." Pp. 211-221 in G20 (2012). Improving the
Assessment of Disaster Risks to Strengthen Financial
Resilience: A Special Joint G20 Publication by the
Government of Mexico and the World Bank.
Government of Zambia (2011). Zambia: Strategic
Programme for Climate Resilience (SPCR). Prepared
for the Pilot Programme for Climate Resilience June
14, 2011.
Granado, F. J. A. D. and D. Coady, D. (2012). "The
Unequal Benefits of Fuel Subsidies: A Review of
Evidence for Developing Countries." World
Development, 40(11), pp. 2234-2248.
Griffiths, C. et al. (2013). "The Social Cost of Carbon:
Valuing Carbon Reductions in Policy Analysis."
GSI and IIER (2012). A Citizens' Guide to Energy
Subsidies in Indonesia. Institute for Essential Services
Reform and International Institute for Sustainable
Development.
Gunningham, N. (2011). "Enforcing Environmental
Regulation." Journal of Environmental Law, 23(2),
pp. 169-201.
Hallegate, Stephane (2012). "Cost Effective Solution
to Reduce Disaster Losses in Developing Countries:
Hydro-Meteorological Services, Early Warning, and
Evacuation."
Hallegatte, Stéphane, Ankur Shah, Robert Lempert,
Casey Brown, and Stuart Gill (2012). "Investment
Decision Making Under Deep Uncertainty:
Application to Climate Change."
Han, G., M. Olsson, K. Hallding, and D. Lunsford, D.
(2012). "China’s Carbon Emission Trading. An
Overview of Current Development." Stockholm
Environment Institute.
Hassanzadeh, E. (2012). "Recent Developments in
Iran's Energy Subsidy Reforms." Policy Brief (ed.)
International Institute for Sustainable Development.
Heller, Peter (2003). "Who will Pay? Coping with
Aging Societies, Climate Change and other Long-
Term Fiscal Challenge." IMF.
HM Treasury (2009). "Pre-Budget Report 2009:
Securing the Recovery: Growth and Opportunity."
HM Treasury (2010.) "Long-term Public Finance
Report: An Analysis of Fiscal Sustainability."
HM Treasury and Department for Environment, Food
and Rural Affairs (2009). Accounting for the Effects
of Climate Change – Supplementary Green Book
Guidance.
Hoekman, Bernard, William J. Martin, and Carlos A.
Primo Braga (2008). "Quantifying the Value of
Preferences and Potential Erosion Losses." World
Bank.
Hughes, Gordon and Urvashi Narain (2014). "Does
Infrastructure Need To Be Built Differently To Be
Climate Resilient? Making Robust Decisions."
Technical paper for FYR Macedonia Green Growth
Country Assessment.
IEA (2008). World Energy Outlook. Paris:
International Energy Agency.
IEA (2012). CO2 Emissions from Fuel Combustion.

240
IEA, OECD, and World Bank (2010). The Scope of
Fossil-Fuel Subsidies in 2009 and a Roadmap for
Phasing Out Fossil-Fuel Subsidies."
IFC (2011). "Climate Finance: Engaging the Private
Sector." A background paper for “Mobilizing Climate
Finance. A Report Prepared at the Request of G20
Finance Ministers.”
IIGCC, INCR, IGCC and UNEP-FI (2011). "Investment-
Grade Climate Change Policy: Financing the
Transition to the Low-Carbon Economy."
IMF (2001). Government Financial Statistics Manual.
IMF (2007). Code of Good Practices on Fiscal
Transparency.
IMF (2013). "Energy Subsidy Reform: Lessons and
Implications."
IMF Statistics Department (2001). Government
Finance Statistics Manual 2001 (GFSM 2001).
Interagency Working Group on Social Cost of Carbon
(2013). "Technical Support Document: Technical
Update of the Social Cost of Carbon for Regulatory
Impact Analysis – Under Executive Order 12866."
InterAmerican Development Bank (2008). "Indicators
of Disaster Risk and Risk Management." Retrieved
from http://www.iadb.org/exr/disaster/.
Intergovernmental Panel on Climate Change (2013).
Fifth Assessment Report Climate Change 2013: The
Physical Science Basis.
Intergovernmental Panel on Climate Change (2014).
Fifth Assessment: Mitigation of Climate Change.
International Center for Climate Governance (ICCG)
(2013). The State of the EU Carbon Market. ICCG
Reflection NO. 14/2013.
International Council for Local Environmental
Initiatives (2011). Empowering Sustainable
Communities: ICLEI USA Annual Report 2010.
International Federation of Accountants (2005).
International Guidance Document: Environmental
Management Accounting.
International Finance Corporation (2011). "Climate
Finance: Engaging the Private Sector." A background
paper for “Mobilizing Climate Finance. A Report
Prepared at the Request of G20 Finance Ministers.”
INTOSAI WGEA (2010). "Auditing the Government
Response to Climate Change: Guidance for Supreme
Audit Institution."
INTOSAI WGEA (2010). "Coordinated International
Audit on Climate Change: Key Implications."
INTOSAI Working Group on Environmental Auditing
(WGEA) (2012). "Improving National Performance:
Environmental Auditing Supports Better Governance
and Management."
IPCC (2012). "The IPCC Special Report on Managing
the Risks of Extreme Events and Disasters to
Advance Climate Change Adaptation. A Special
Report of Working Groups I and II of the IPCC."
IPCC (2012). Managing the Risks of Extreme Events
and Disasters to Advance Climate Change
Adaptation. Special Report. p. 160
IPCC (2014). "Climate Change 2014: Impacts,
Adaptation, and Vulnerability - Summary for Policy
Makers." A Contribution of Working Group II to the
Fifth Assessment Report of the IPCC
IPCC (2014). “WGII AR5 Summary for Policymakers”
in "Climate Change 2014, Mitigation of Climate
Change." Contribution of Working Group III to the
Fifth Assessment Report of the IPCC
Izaurralde R.C., A.M. Thomson, J.A.Morgan, P.A.Fay,
H.W.Polley and J.L Hatfield (2011). “Climate Impacts
on Agriculture: Implications for Forage and
Rangeland Production” in Agronomy Journal.
Volume 103.
Japan (2010). "Implementation of Subsidized
Projects to Reduce CO2 Emission."

241
Jones, D. and Steenblik, R. (2010). "Subsidy
Estimation a Survey of Current Practice. Geneva:
International Institute for Sustainable
Development."
Jones, R. N. and Preston B. L. (2011). “Adaptation
and Risk Management” in Wiley Interdisciplinary
Reviews: Climate Change. 2(2), pp. 296 - 308.
Junghans, L. and Harmeling, S. (2012). Different Tales
from Different Countries: A first Assessment of the
OECD “Adaptation Marker”.
Kammen, D. and C. Kirubi (2008). "Poverty, Energy
and Resource Use in Developing Countries: Focus on
Africa." Annals of the New York Academy of
Sciences, Issue 1136, pp. 348-357.
Kerwin, A. (1993). “None Too Solid. Medical
Ignorance” in Knowledge: Creation, Diffusion,
Utilization. Volume 15 No. 2, pp. 166-185., and Aven,
T. (2011). “On Different Types of Uncertainties in the
Context of the Precautionary Principle” in Risk
Analysis. Volume 31 Issue 10, pp. 1515-1525.
Koblowsky, Peter and Chinwe Ifejika Speranza
(2012). "African developments: Competing
institutional arrangements for climate policy: the
case of Nigeria." Bonn: German Development
Institute/Deutsches Institut für Entwicklungspolitik
(DIE) (Briefing Paper 7/2012).
Komives, K. et al. (2009). Residential Electricity
Subsidies in Mexico: Exploring Options for Reform
and for Enhancing the Impact on the Poor.
Koplow, D. (2009)."Measuring Energy Subsidies
Using the Price Gap Approach: What does it Leave
Out?" International Institute for Sustainable
Development.
Kraan, D.-J. (2007). Programme Budgeting in OECD
Countries. OECD Journal on Budgeting.
Künzli, N. et al. (2000). "Public Health Impact of
Outdoor and Traffic-related Air Pollution: A
European Assessment." The Lancet, Volume 356, pp.
795-801.
Larsen, Peter and Scott Goldsmith (2007). "How
Much Might Climate Change Add to Future Costs for
Public Infrastructure?" University of Alaska Research
Summary No. 8, Institute of Social and Economic
Research University of Alaska Anchorage.
Lebel, Louis et al (2012). Mainstreaming Climate
Change Adaptation into Development Planning: A
Guide for Practitioners. UNDP-UNEP.
Legg, Wilfrid and Dimitris Diakosavvas (2010).
Environmental Cross Compliance in Agriculture.
OECD.
Lempert, Robert J. et al. (2006). "A General, Analytic
Method for Generating Robust Strategies and
Narrative Scenarios" in Management Science. 52(4),
pp. 514-528.
Loayza, Norman, Eduardo Olaberria, et al (2009)."
Natural Disasters and Growth: Going beyond the
Averages." World Bank Policy Research Working
Paper 4980.
Lu, Xianfu (2011). “Provision of climate information
for adaptation to climate change.” Climate Research,
vol. 47: 83-94.
Mackenzie, K. and Mintz, J. (2011). "The Tricky Art of
Measuring Fossil Fuel Subsidies."
Mahan, B. (1997). "Valuing Urban Wetlands: A
Property Pricing Approach." US Army Corps of
Engineers.
Marchal, V. et al. (2012). OECD Environmental
Outlook to 2050: The Costs of Inaction. Paris:
Organization for Economic Cooperation and
Development.
Mark Miller (2012). CCPEIRs in the Asia Pacific
Region – What Have We Learnt. UNDP.
MDBs (2012). "Joint Report on Mitigation Finance
2011, A report by a group of Multilateral
Development Banks (MDBs) comprising the AfDB,
ADB, EBRD, EIB, IDB, WB and IFC."
242
Meadowcroft, James (2009). “Climate Change
Governance.” Background Paper to the 2010 World
Development Report.
Medarova-Bergstrom, K. and Volkery, A. (2012).
"Walking the Talk: Practical Options for Making the
EU MF 2014-2020 deliver on Climate Change."
Institute for European Environmental Policy.
Melecky, Martin and Claudio Raddatz (2011). "How
Do Governments Respond after Catastrophes?
Natural-Disaster Shocks and the Fiscal Stance."
World Bank Policy Research Working Paper 5564.
Mendelsohn, R., Emanuel, K., Chonabayashi, S. and
Bakkensen, L. (2012). “The Impact of Climate Change
on Global Tropical Storm Damages” in Nature
Climate Change. Volume 2, p. 205–209.
Micale, V., G. Frisari, M. Hervé-Mignucci, and F.
Mazza (2013). "Risk Gaps: A Map of Risk Mitigation.
Climate Policy Initiative."
Michaelowa, A. and Michaelowa, K. (2010). "Coding
Error or Statistical Embellishment? The Political
Economy of Reporting Climate Aid." Zurich Center
for Comparative and International Studies.
Ministry of Finance, Republic of Indonesia and
Australian Indonesian Partnership (2009). "Ministry
of Finance Green Paper: Economic and Fiscal Policy
Strategies for Climate Change Mitigation in
Indonesia."
Monni, S. and F. Raes, (2008). "Multilevel Climate
Policy: The Case of the European Union, Finland, and
Helsinki." Environmental Science and Policy, 11(8), p.
743–755.
Multilateral Development Banks (MDBs) (2012). A
Joint Report on Mitigation Finance 2011.
National Audit Office of Estonia (2009). "The State’s
Efforts of Reducing Greenhouse Gas Emissions."
National Communications Support Programme
(2012). Country Papers: Preparation of National
Communications from Non-Annex I Parties to the
UNFCCC. Lessons Learned and Experiences from the
Preparation of National Communications.
National Treasury (2011). Medium Term Budget
Policy Statement 2011. Republic of South Africa.
Netherlands Commission for Environment
Assessment (2011). Climate Change Adaptation and
Strategic Environmental Assessment.
OECD (2004). "Applying Strategic Environmental
Assessment: Good Practices Guidance for
Development Cooperation." DAC Guidelnies and
Reference Series.
OECD (2011). Environmental Outlook to 2050,
Chapter 3: Climate Change.
OECD (2011). OECD Handbook on the OECD-DAC
Climate Markers.
OECD (2012). Inventory of Estimated Budgetary
Support and Tax Expenditures for Fossil Fuels 2013.
OECD DAC Network on Environment and
Development (2008). Strategic Environmental
Assessment and Adaptation to Climate Change.
Endorsed by Members of the DAC Network on
Environment and Development Cooperation.
OECD Fourth High Level Forum On Aid Effectiveness
(2011). Busan Partnership For Effective Development
Co-Operation. Busan, Republic Of Korea, 29
November-1 December 2011.
OECD International Energy Agency (2010). Low-
Emission Development Strategies (LEDS): Technical,
Institutional, and Policy Lessons.
Olivier, Jos, Greet Janssens-Maenhout, Marilena
Muntean, and Jeroen A.H.W. Peters. (2013). "Trends
in Global CO2 Emissions: 2013 Report."
Organization of American States (2010). "Caribbean
Emergency Legislation Project: Improving the Legal
and Institutional Framework Related to State of
Emergency."

243
Overseas Development Institute and Heinrich Boll
Stiftung North America. (2011). The Evolving Global
Climate Finance Architecture.
Panda, Gyana Ranjan and Narendra Jena (2012),
“Evaluating the Performance of the National Clean
Energy Fund,” Economic & Political Weekly,
September 15, 2012
Patt, Anthony G. et al (2010). "Adaptations in
Integrated Assessment Modeling: Where Do We
Stand?"
Pelham, Larissa et al (2011). "Natural Disasters:
What is the Role for Social Safety Nets?" World Bank
Social Protection Discussion Paper No. 1102.
Peters, Glen P., Jan C. Minx, Christopher L. Weber
and Ottomar Edenhofer (2011). “Growth in Emission
Transfers via International Trade From 1990 to
2008” in Proceedings of the National Academy of
Sciences.
Pieter Pauw and Imme Scholz (2012). "Private
Financing of Adaptation to Climate Change in Poor
Countries?" The German Development Institute, The
Current Column, 26 November 2012.
Popp, D. (2011). "International Technology Transfer,
Climate Change, and the Clean Development
Mechanism." Review of Environmental Economics
and Policy, 5(1), pp. 131-152.
Pradhan, Sanjay (1996). "Evaluating Public Spending.
A Framework for Public Expenditure Reviews."
World Bank Discussion Papers 323.
Randall, A. (2011). Risk and Precaution. Chapter 4.
Cambridge University Press, UK., and Standards
Australia/Standards New Zealand (2009). AS/NZS ISO
31000:2009. Risk Management – Principles and
Guidelines.
Ranger and Garbett-Shiels (2011). "How can decision
makers in developing countries incorporate
uncertainty about future climate risks into existing
planning and policy making processes?" Policy Paper,
March 2011.
Ranger et al (2010). "Adaptation in the UK: A
decision-making process." Grantham Research
Institute on Climate Change and the Environment.
Ranger, Nicola, Antony Millner, Simon Dietz, Sam
Frankhauser, Ana Lopez and Giovanni Ruta (2010).
Adaptation in the UK: A Decision-Making Process.
Grantham Research Institute on Climate Change and
the Environment and the Center for Climate Change
Economics and Policy. p. 39.
Reeder, Tim and Nicola Ranger (2011). “How Do You
Adapt in an Uncertain World? Lessons From the
Thames Estuary 2100 Project” in World Resources
Report Uncertainty Series.
Renaud, Fabrice G., Karen Sudmeier-Rieux and
Marisol Estrella (2013). The Role of Ecosystems in
Disaster Risk Reduction.
Renewables Energy Policy Network for the 21st
Century (2012). Renewables 2012 Global Status
Report.
Republic of Botswana Ministry of Environment,
Wildlife, and Tourism (2011). Second National
Communication to the UNFCCC.
République Française (2012). Document de Politique
Transversale Project de Loi de Finance pour 2012 –
Lutte contre le Changement Climatique.
Rigsrevisionen (2012). Report to the Public Accounts
Committee on Denmark’s Reduction of CO2 –
Emissions.
Riksrevisionen (2009). "What Are Sweden’s Emission
Rights Worth? Handling and Reporting of Sweden’s
Kyoto Units." RiR 2009:21.
Riksrevisionen (2011). "Green Public Procurement- Is
Management Effectively Helping to Achieve the
Climate Objective?" RiR: 2011/29.
Roe, G.H., and M.B. Baker (2007). “Why is Climate
Sensitivity So Unpredictable?” in Science. 318, pp.
629-632; Gay, C. and F. Estrada (2010).”Objective
Probabilities About Future Climate Are A Matter Of
Opinion” in Climate Change. Ii, pp. 27-46

244
Scandizzo, Pasquale L.(2011). “Climate Change
Adaptation and Real Option Evaluation” in Social
Science Research Network Scholarly Paper. ID
2046955. Rochester, NY.
Shrimali, G., S. Tirumalachetty, and D. Nelson (2012).
"Falling Short: An Evaluation of the Indian
Renewable Certificate Market." Climate Policy
Initiative and Indian Business School.
Stanton, Elizabeth et al. (2008). "Inside the
Integrated Assessment Models: Four issues in
Climate Economics."
State Forestry Administration of P.R.China.(2011).
"China’s National Progress Report to the UNFF
Secretariat on the Implementation of NLBI and Other
Relevant Resolutions; and Forest Trends."
Stern, Nicholas (2007). The Economics of Climate
Change: the Stern Review. Cambridge University
Press, Cambridge, UK.
Stern, Nicholas (2009). A Blueprint for a Safer Planet:
How to Manage Climate Change and Create a New
Era of Progress and Prosperity. The Bodley Head,
London, UK.
Sudharshan Canagarajah and Tim Williamson (2006).
"Uganda’s Virtual Poverty Fund: Pro-Poor Spending
Reform." World Bank PREM Note No. 108, March
2006.
Sue Wing, Ian (2004). "Computable General
Equilibrium Models and Their Use in Economy-Wide
Policy Analysis." MIT Joint Program on the Science
and Policy of Global Change Technical Note No. 6.
Massachusetts
Swanson, AuPhil and Leiv Lundethors (2003). "Public
Environmental Expenditure Reviews (PEERS)
Experience and Emerging Practice." World Bank
Environment Strategy Papers No. 7.
Swart, R. et al., (2009). "Europe Adapts to Climate
Change: Status of Developing National Adaptation
Strategies." Partnership for European Environmental
Research.
Swim, Janet, Paul C. Stern, Thomas J. Doherty, Susan
Clayton, Joseph P. Reser, Elke U. Weber, Robert
Gifford and George S. Howard (2011). “Psychology’s
Contributions to Understanding and Addressing
Global Climate Change.” American Psychologist.
Volume 66 No. 4, pp. 241-250.
Swiss Cooperation et al. (2012). "Climate Finance
Readiness: Lessons Learned in Developing
Countries."
Syroka, Joanana and Nucifora, Antonio (2010).
"National Drought Insurance for Malawi." World
Bank Policy Research Working Paper 5169.
The Budget Transparency Initiative, World Bank
(2013). Global Stock-Take of Social Accountability
Initiatives for Budget Transparency and Monitoring.
The Humanitarian Accountability Partnership (2010).
"The 2010 HAP Standard in Accountability and
Quality Management Standards Principles."
The World Bank (2012). Turn Down the Heat: Why a
4C Warmer World Must be Avoided.
The World Bank and Global Facility for Disaster
Reduction and Recovery (GFDRR) (2012). The Sendai
Report: Managing Disaster Risks for a Resilient
Future.
The World Bank Treasury (2011). "MultiCat Program
Product Note."
Tiwari, Krishna R. et al (2014). "Does Nepal’s Climate
Change Adaptation Policy and Practices Address
Poor and Vulnerable Communities?"
Tom Tietenberg (2013). Carbon Pricing: Lessons
Derived From Experience.
Triantis, A.J and A. Borison (2001). “Real Options:
State of the Practice” in Journal of Applied Corporate
Finance. Volume 14(2), pp. 8-24.
Tribunal de Contas da União (2009). Relatório de
Auditoria: Adaptação da Agropecuária aos Cenários
de Mudanças do Clima.
245
Tribunal de Cuentas (2010). Implementación de los
Compromisos Asumidos en el Convenio Marco de las
Naciones Unidas sobre Cambio Climático. Informe
No. 003-2010-DARNA.
U.S. Energy Information Administration (2013).
Annual Energy Outlook 2013.
UK HM Treasury (2003). The Green Book: Appraisal
and Evaluation in Central Government.
UN Conference on Trade and Development (2010).
World Investment Report 2010: Investing in a Low
Carbon Economy.
UN Environment Programme (2012). "Feed-in Tariffs
as a Policy Instrument for Promoting Renewable
Energy and Green Technologies in Developing
Countries."
UN Environment Programme and Bloomberg (2012).
"Global Trends in Renewable Energy Investment
2011: Analysis of Trends and Issues in the Financing
of Renewable Energy."
UN Global Compact (2012). Annual Review of
Business Policies and Actions to Advance
Sustainability: 2011 Global Compact Implementation
Survey.
UNDP (2011). Blending Climate Finance Through
National Climate Funds: A Guidebook for the Design
and Establishment of National Funds to Achieve
Climate Change Priorities.
UNDP (2012). National Climate Funds: Learning from
the Experience of Asia-Pacific Countries.
Environment and Energy Discussion Paper.
UNDP (2012). Readiness for Climate Finance: A
Framework for Understanding What it Means to be
Ready to Use Climate Finance.
UNDP and UNEP (2011). "Applying Climate
Information for Adaptation Decision-Making."
National Communications Support Programme.
UNEP (2009). Primer on CDM Programme of
Activities. Retrieved from www.cd4cdm.org.
UNEP (2010). ADAPT Cost Project: Analysis of the
Economic Costs of Climate Adaptation in Africa.
UNEP (2011). A Practical Framework for Planning
Pro-Development Climate Policy.
UNEP (2012). Annual Report 2012.
UNEP (2012). The Emissions Gap Report.
UNEP Risø Centre (2011). Low Carbon Development
Strategies: A Primer on Framing Nationally
Appropriate Mitigation Actions (NAMAs) in
Developing Countries.
UNFCC (2005). “National Inventory Submissions
2005.” Retrieved from
https://unfccc.int/national_reports/annex_i_ghg_inv
entories/national_inventories_submissions/items/27
61.php.
UNFCC Conference of the Parties (2002). "Report of
the Conference of the Parties on its Seventh Session
Held at Marrakesh from 29 October to 10 November
2001." Addendum. FCCC/CP/2001/13/Add. 1.
UNFCC Conference of the Parties (2010). "Report of
the Conference of the Parties on its sixteenth
session, held in Cancun from 29 November to 10
December 2010." Addendum.
FCCC/CP/2010/7/Add.1
UNFCC LDC Expert Group (2009). “Least Developed
Countries: Support Needed to Fully Implement
National Adaptation Programmes of Action
(NAPAs).”
UNFCCC (2003). "Report of the Conference of the
Parties on its Eighth Session, held at New Delhi from
23 October 23 to 1 November 1, 2002."
UNFCCC Conference of the Parties (2011). "Report of
the Conference of the Parties on its seventeenth
session, held in Durban from 28 November to 11
December 2011." Addendum.
FCCC/CP/2011/9/Add.1.
UNFCCC Conference of the Parties (2011). "Report of
the Conference of the Parties on its seventeenth

246
session, held in Durban from 28 November to 11
December 2011." Addendum.
FCCC/CP/2011/9/Add.1.
UNFCCC Subsidiary Body for Implementation (2011).
Compilation and Synthesis of Fifth National
Communications, and Addendum.
FCCC/SBI/2011/INF.1 and FCCC/SBI/2011/INF.1
/Add.2.
United Nations (2011). Hyogo Framework for Action
2005-2015: Building the Resilience of Nations and
Communities to Disasters. Mid-term Review 2010-
11.
United Nations Educational, Scientific, and Cultural
Organization, United Nations Water, and World
Water Assessment Programme (2012). Managing
Water Under Uncertainty and Risk: The United
Nations World Water Development Report 4.
UN-REDD Programme (2011). The UN-REDD
Programme Strategy 2011-2015.
Vagliasindi, M. (2012). Implementing Energy Subsidy
Reforms: An Overview of the Key Issues.
Vagliasindi, M. (2012). Implementing Energy Subsidy
Reforms: An Overview of the Key Issues. World Bank.
Vagliasindi, M. (2013). Implementing Energy Subsidy
Reforms. Evidence from Developing Countries.
World Bank.
Victor, D. (2009). "The Politics of Fossil Fuel
Subsidies." International Institute for Sustainable
Development.
Vogt-Shilb, A. and Hallegate, S. (2011). "When
Starting with the Most Expensive Option Makes
Sense: Use and Misuse of Marginal Abatement Cost
Curves." World Bank Policy Research Working Paper
5803.
Watts, Robbie (2012). "Linking National and Local
Adaptation Planning: Lessons from Nepal, Case study
3." The Learning Hub, IDS, UK.
Wilkinson, P., et al. (2009). "Public Health Benefits of
Strategies to Reduce Greenhouse Gas Emissions:
Household Energy." The Lancet, 374(9705), pp.
1917-1929.
William C. Fay and Michelle D. Rodgers (2008).
"Appropriations for Mandatory Expenditures."
Harvard Law School Federal Budget Policy Seminar
Briefing Paper No. 17.
World Bank (2004). "Learning Lessons from Disaster
Recovery: The Case of Honduras." Hazard
Management Unit Working Paper Series No.8.
World Bank (2010). "Weather and Climate Services
in Europe and Central Asia A Regional Review."
World Bank Working Paper
World Bank (2010). "Weathering the Storm: Options
for Disaster Risk Financing in Vietnam."
World Bank (2010). Cities and Climate Change: An
Urban Agenda.
World Bank (2010). Subsidies in the Energy Sector:
An Overview.
World Bank (2010). The Economics of Adaptation to
Climate Change.
World Bank (2010). World Development Report
2010: Development and Climate Change.
World Bank (2010). World Development Report
2010: Development and Climate Change.
World Bank (2011). "Climate Change and Fiscal
Policy: A Report for APEC."
World Bank (2011). "Program Document: Vietnam
First Climate Change Development Policy
Operation." Report 59493-VN.
World Bank (2011). Transition to a Low-Emissions
Economy in Poland.
World Bank (2012). "Hands-on Energy Adaptation
Toolkit (HEAT)."

247
World Bank (2012). "Inclusive Green Growth. The
Pathway to Sustainable Development."
World Bank (2012). "Typology of Activities With
Climate Co-Benefits by WB Sector."
World Bank (2012). "World Bank Financing for
Renewable Energy Hits Record High." World Bank
website, October 16, 2012.
World Bank (2012). Beyond the Annual Budget:
Global Experience with Medium Term Expenditure
Frameworks.
World Bank (2012). CCPEIR Methodology:
Application and Development for Vietnam. World
Bank, Washington, DC.
World Bank (2012). State and Trends of the Carbon
Market Report 2012.
World Bank (2012). The World Bank’s Approach to
Public Sector Management 2011-2020: Better
Results from Public sector institutions.
World Bank (2013). "Main Report." Building
Resilience: Integrating Climate and Disaster Risk into
Development - the World Bank Group Experience,
vol. 1.
World Bank (2013). Building Resilience: Integrating
Climate and Disaster Risk into Development - the
World Bank Group Experience.
World Bank (2014). "Managing Disaster Risks for
Resilient Development." Retrieved June 21, 2014,
from
http://www.worldbank.org/en/results/2013/04/12/
managing-disaster-risks-resilient-development.
World Bank (2014). "Multilateral Development
Banks Provided $27 Billion in Climate Finance in
2012." World Bank website, Feature Story.
November 14, 2013.
World Bank (2014). FYR Macedonia: Green Growth
Country Assessment.
World Bank and GFDRR (2013). "Disaster Risk
Management in South Asia: A Regional Overview."
World Bank and IFC (2012). "Doing Business 2013
Case Study: Does Doing Business Matter for Foreign
Direct Investment?"
World Bank and United Nations (2010). Natural
Hazards, Unnatural Disasters: The Economics of
Effective Prevention.
World Bank Civil Society Team (2007). “Consultations
with Civil Society: A Sourcebook.” Working
Document.
World Bank Independent Evaluation Group (2006).
Hazards of Nature, Risks to Development: An IEG
Evaluation of World Bank Assistance for Natural
Disasters.
World Bank, 2010. "Subsidies in the Energy Sector:
An Overview."
World Bank, IFC, IMF, and OECD (2011). "Mobilizing
Climate Finance." A Paper Prepared at the Request
of G20 Finance Ministers.
World Bank. (2012). "Morocco Climate Change
Public Expenditure and Institutional Review." World
Bank, Washington, DC.
World Economic Forum (2013). The Green
Investment Report: The Ways and Means to Unlock
Private Finance for Green Growth.
World Meteorological Organization (2008). "Capacity
Assessment of National Meteorological and
Hydrological Services in Support of Disaster Risk
Reduction: Analysis of the 2006 WMO Disaster Risk
Reduction."
World Resources Institute (2005) "Mainstreaming
the Environment in PRSPs: The Unfulfilled Promise."
World Resources Institute (2010). Renewable Energy
Tax Credits.

248
Yépez-García, Rigoberto Ariel, and Julie Dana (2012).
"Mitigating Vulnerability to High and Volatile Oil
Prices." World Bank.
Young-Kyu Kang (2013). "Financing South Korea’s
Green Growth Plan." World Bank.
Zadek, Simon, Maya Forstater, Fernanda Polacow
and Joao Boffino(2009). "Radical Simplicity in
Designing National Climate Institutions: Lessons
from the Amazon Fund. AccountAbility."
Zhuang, J., Liang, J., Lin, T. and De Guzman, F. (2007).
"Theory and Practice in the Choice of Social Discount
Rate for Cost-Benefit Analysis: A Survey." Asian
Development Bank.
249
RELEVANT WEBSITES
Climate Finance
Analytical papers on climate change finance
http://www.climatefinance-developmenteffectiveness.org/publications.html
UNFCCC notes on climate finance
http://unfccc.int/cooperation_and_support/financial_mechanism/items/2807.php
GEF projects list
http://www.thegef.org/gef/project_list
GEF discrete funding windows for the Rio Conventions on Biodiversity and Desertification
http://unfccc.int/resource/docs/convkp/conveng.pdf
World Bank and UNDP Climate Options website on international funding sources
http://www.climatefinanceoptions.org/cfo/index.php
Forest Carbon Partnership Facility, and REDD+
https://www.forestcarbonpartnership.org/fcpf
Country Experiences (United Kingdom)
The Climate Change Act
http://www.theccc.org.uk
U.K. Carbon Budget
https://www.gov.uk/government/policies/reducing-the-uk-s-greenhouse-gas-emissions-by-80-by-
2050/supporting-pages/carbon-budgets
U.K. Climate Impacts Programme
http://www.ukcip.org.uk/
U.K. Meteorological Office Regional Climate Modelling System
http://www.metoffice.gov.uk/precis/intro
Disaster Risk Management
CCRIF
http://www.ccrif.org
Tools and methodology for disaster damage, loss and needs assessments
http://www.gfdrr.org/gfdrr/Track-III-TA-Tools. For detailed guidance on damage assessment, see UN-ECLAC

250
GIS Systems and Information
GeoNode
http://geonode.org/
InaSAFE
http://inasafe.org/en/
CAPRA
http://www.ecapra.org
Climate Change Knowledge Portal
climateknowledgeportal.worldbank.org
countryadaptationprofiles.gfdrr.org
International Accords, Forums and Organizations
Copenhagen Accord
https://unfccc.int/meetings/copenhagen_dec_2009/items/5262.php
Kyoto Protocol
http://unfccc.int/kyoto_protocol/items/2830.php
OECD Second and Fourth High Level Forums on Aid Effectiveness
http://www.oecd.org/dac/effectiveness/thehighlevelforaonaideffectivenessahistory
Warsaw International Mechanism for Loss and Damage
http://unfccc.int/adaptation/workstreams/loss_and_damage/items/8134.php
National Communications Support Program
http://ncsp.undp.org/
Guidelines and Data
Guidelines for National Adaptation Plans (NAPs)
http://unfccc.int/adaptation/workstreams/national_adaptation_programmes_of_action/ items/7279.php
IPCC Data Distribution Center
http://www.ipcc-data.org/
Guidelines on the CDM project cycle and methodologies
http://cdm.unfccc.int

Climate change is one of the greatest global challenges of our time, yet the
integration of climate change considerations into the policy-making process
remains patchy. In many countries, morever, climate change remains the
preserve of specialist environmental agencies and systematic incorporation of
climate change issues into national planning is missing. This Climate Change
Public Expenditure and Institutional Review Sourcebook (CCPEIR) seeks to
provide practitioners with the tools and information they need to respond to
the public expenditure policy and management challenges resulting from
climate change. It is a series of notes and supporting materials that
consolidates research and international experience, identifies emerging
practice, and provides practical guidance to the staff of central finance
agencies, development agencies, environmental agencies and international
organizations. The Sourcebook also raises awareness and supports policy
dialogue in countries developing climate change action plans. In addition to
addressing topics commonly discussed in public expenditure and institutional
reviews, this Sourcebook dives deeper into the specific public expenditure
policy and management challenges raised by climate change. Decision-making
under uncertain climate conditions, expenditure planning for extreme
weather events, and the difficulty of creating budget classifications for
climate-related expenditures are each examined in the Sourcebook. While
recognizing the diversity of challenges faced by different countries, the
Sourcebook takes the first step in providing a comprehensive source of
information and operational guidance. It is a living document that will expand
and be updated to be of relevance to policy makers as situations change and
knowledge advances.