
Climate Change Projections for the Tropical Rainforest...
38
Climate Change Projections for the Tropical Rainforest Region of North Queensland R. Suppiah, I. Macadam and P.H. Whetton September 2007 Undertaken for the Marine and Tropical Sciences Research Facility by the Climate Impacts and Risk Group, CSIRO Marine and Atmospheric Research Supported by the Australian Government’s Marine and Tropical Sciences Research Facility Project 2.5ii.1 Regional climate change projections for tropical rainforests
Transcript of Climate Change Projections for the Tropical Rainforest...

Climate Change Projections for the Tropical Rainforest Region of North Queensland R. Suppiah, I. Macadam and P.H. Whetton September 2007 Undertaken for the Marine and Tropical Sciences Research Facility by the Climate Impacts and Risk Group, CSIRO Marine and Atmospheric Research Supported by the Australian Government’s Marine and Tropical Sciences Research Facility Project 2.5ii.1 Regional climate change projections for tropical rainforests

© Commonwealth Scientific and Industrial Research Organisation (‘CSIRO’) Australia 2006 This report should be cited as: Suppiah, R., Macadam, I. and Whetton, P. H. (2007) Climate Change Projections for the Tropical Rainforest Region of North Queensland. Unpublished report to the Marine and Tropical Sciences Research Facility. Reef and Rainforest Research Centre Limited, Cairns (38pp.). Report made available online by the Reef and Rainforest Research Centre Limited for the Australian Government’s Marine and Tropical Sciences Research Facility. The Marine and Tropical Sciences Research Facility (MTSRF) is part of the Australian Government’s Commonwealth Environment Research Facilities programme. The MTSRF is represented in North Queensland by the Reef and Rainforest Research Centre Limited (RRRC). The aim of the MTSRF is to ensure the health of North Queensland’s public environmental assets – particularly the Great Barrier Reef and its catchments, tropical rainforests including the Wet Tropics World Heritage Area, and the Torres Strait – through the generation and transfer of world class research and knowledge sharing. This publication is copyright. The Copyright Act 1968 permits fair dealing for study, research, information or educational purposes subject to inclusion of a sufficient acknowledgement of the source. The Biodiversity Monitoring Toolkit proformas are available for copying and use by community groups and revegetation practitioners, provided sufficient acknowledgement is given. The views and opinions expressed in this publication are those of the authors and do not necessarily reflect those of the Australian Government or the Minister for the Environment and Water Resources. CSIRO makes no representations or warranties regarding merchantability, fitness for purpose or otherwise with respect to this report. Any person relying on this report does so entirely at his or her own risk. CSIRO and all persons associated with it exclude all liability (including liability for negligence) in relation to any opinion, advice or information contained in this report, including, without limitation, any liability which is consequential on the use of such opinion, advice or information to the full extent of the law, including, without limitation, consequences arising as a result of action or inaction taken by that person or any third parties pursuant to reliance on this report. Where liability cannot be lawfully excluded, liability is limited, at CSIRO’s election, to the re-supply of the report or payment of the cost of re-supply of the report. All rights are reserved and no part of this publication covered by copyright may be reproduced or copied in any form or by any means except with the written permission of CSIRO. The results and analyses contained in this report are based on a number of technical, circumstantial or otherwise specified assumptions and parameters. The user must make its own assessment of the suitability for its use of the information or material contained in or generated from the report. To the extent permitted by law, CSIRO excludes all liability to any party for expenses, losses, damages and costs arising directly or indirectly from using this report. The use of this report is subject to the terms on which it was prepared by CSIRO. In particular, this report may only be used for the following purposes: • This report may be copied for distribution within Australian Government departments; • The information contained within this report may be used by the entity for which it was prepared (“the Client”), or by the
Client’s contractors and agents, for the Client’s internal business operations (but not licensing to third parties); • Extracts of the report distributed for these purposes must clearly note that the extract is part of a larger report prepared by
CSIRO for the Client. This report must not be used as a means of endorsement without the prior written consent of CSIRO. The name, trademark or logo of CSIRO must not be used without the prior written consent of CSIRO. This report is available for download from the Reef and Rainforest Research Centre website. Visit http://www.rrrc.org.au/mtsrf/theme_2/project_2_5ii_1.html September 2007. Enquiries may be addressed to: Dr Ramasamy Suppiah CSIRO Marine and Atmospheric Research PMB No 1, Aspendale, Victoria 3195 Telephone: (03) 9239 4554 Fax: (03) 9239 4444 Email: [email protected]

Climate Change Projections for the Tropical Rainforest Region of North Queensland
i
ACKNOWLEDGEMENTS The work of the authors draws upon research findings of many colleagues within CSIRO Marine and Atmospheric Research (CMAR), and overseas research institutions. CSIRO global climate and regional climate models were developed by the members of the Climate, Weather and Ocean Prediction Theme within CMAR. Martin Dix from CMAR made useful comments on the manuscript. This is part of a wider study on the tropical rainforest region of North Queensland under the Australian Government’s Marine and Tropical Sciences Research Facility, implemented by the Reef and Rainforest Research Centre (RRRC) Limited. This work also contributes to the CSIRO climate research program.

Suppiah et al.
ii
ABSTRACT The northern Queensland tropical rainforest region has more biodiversity than anywhere else in the country. Rainfall in this region has decreased over the past century, particularly after 1950. A new assessment of twenty-three global climate models from the Intergovernmental Panel on Climate Change data centre has now been made using statistical tests. We have compared simulated spatial patterns of mean sea level pressure, temperature and rainfall with observed patterns. On the basis of the results of statistical tests, fifteen models were selected to construct temperature and rainfall projections for the northern Queensland region and sub regions. Temperature and rainfall projections are given for four seasons specifically related to the Marine and Tropical Sciences Research Facility (MTSRF) region and also for decades from 2020 to 2080. Annual temperature is projected to increase between 0.5 and 1.4°C by 2030 and between 1.0 and 4.2°C by 2070. Rainfall changes are more uncertain due to strong model-to-model variations. By 2030, projected rainfall changes are between -6% and +5% and between -19% and +14% by 2070. Much less warming and narrower ranges in rainfall are projected in scenarios with stabilised CO2 concentrations.
Climate Change Projections for the Tropical Rainforest Region of North Queensland
iii
CONTENTS Acknowledgements ................................................................................................................... i Abstract .................................................................................................................................... ii 1. Introduction ..............................................................................................................1 2. Observed Climate Change and Variability During the Instrumental Period .......2 2.1 Temperature Trends .........................................................................................2 2.2 Rainforest Trends..............................................................................................5 3. Assessment of AR4 Climate Models ....................................................................10 4. Construction of Climate Change Projections ......................................................16 5. Climate Change Projections for Queensland and Sub-Regions........................18 6. Conclusions............................................................................................................23 7. References ..............................................................................................................24 Appendix A1: Projected changes in temperature for Queensland for 2020 to 2080 ...........25 Appendix A2: Projected percentage changes in rainfall for Queensland for 2020
to 2080..........................................................................................................26 Appendix A3: Projected seasonal temperature changes, relative to 1990, for the full range of SRES emission scenarios for the region shown in Figure 12 for 2020 to 2080 ...........................................................................27 Appendix A4: Projected seasonal temperature changes, relative to 1990, for the WRE 550 emission scenario for the regions shown in Figure 12 for 2020 to 2080............................................................................................28 Appendix A5: Projected seasonal temperature changes, relative to 1990, for the WRE 450 emission scenario for the regions shown in Figure 12 for 2020 to 2080............................................................................................29 Appendix A6: Projected seasonal rainfall changes, relative to 1990, for the full range of SRES emission scenarios for the regions shown in Figure 12 for 2020 to 2080 ...........................................................................30 Appendix A7: Projected seasonal rainfall changes, relative to 1990, for the WRE 550 emission scenario for the regions shown in Figure 12 for 2020 to 2080............................................................................................31 Appendix A8: Projected seasonal rainfall changes, relative to 1990, for the WRE 450 emission scenario for the regions shown in Figure 12 for 2020 to 2080............................................................................................32


Climate Change Projections for the Tropical Rainforest Region of North Queensland
1
1. INTRODUCTION About 900,000 hectares of tropical rainforest stretch from Townsville to Cooktown. Some of the plants and animals found there have been around for more than 100 million years. Although the tropical rainforest covers less than one percent of Australia’s landmass, it has more biodiversity than anywhere else in the country. Rainfall in this region shows a decreasing trend over the past century which is stronger after 1950 (Bureau of Meteorology, 2006). Climate change projections produced by CSIRO (2001) also show a tendency for drier conditions under enhanced greenhouse conditions. Atmospheric greenhouse gas concentrations have increased in the past century and are almost certain to continue to increase in the future (IPCC, 2007). Any greenhouse warming induced climate change has significant implications for management and conservation of resources and biodiversity of the rainforest region of north Queensland. Sensitivity of rainforest to climate change has been investigated by Hilbert et al. (2001) and Ostendorf et al. (2001). The extinction risk of some species due to climate change has also been reported by Thomas et al. (2004). In this interim report, we present temperature and rainfall projections for the tropical rainforest region based on simulations performed for the Intergovernmental Panel on Climate Change (IPCC) Fourth Assessment Report involving twenty-three global climate models (GCMs). Previous and the current projections were constructed based on the results of a set of selected GCMs. The GCMs and regional climate models were selected using the results of pattern correlation and root mean square (RMS) error values. In this method, we have given equal weights to selected models which were used to construct temperature and rainfall projections for selected regions as well as for the whole of Australia. The present study is also focused on small region and the performance of the models has been tested, particularly for that region using equal weight method. Since the completion of the study by applying equal weights to selected AR4 models, we have developed probabilistic projections in which each AR4 model is assigned a weight based on its ability to simulate the present climate. Projections were constructed for the whole of Australia and they will be available later in this year. Preliminary analysis indicate minor differences in projected changes in temperature and rainfall, but overall the direction of change shows close agreement between the results of the present study and projections based on probabilistic method. In the final stage of this project, we intend to provide improved projections based on the probabilistic method, in which we give best, low and high estimates of changes as 50th, 10th and 90th percentiles.

Suppiah et al.
2
2. OBSERVED CLIMATE CHANGE AND VARIABILITY DURING THE INSTRUMENTAL PERIOD
2.1 Temperature Trends In Australia, the average temperature has risen by 0.9°C from 1910 to 2004 (Nicholls and Collins, 2006). Daily minimum temperature has increased by 1.14°C (0.12°C per decade) and the daily maximum has increased by 0.65°C (0.07°C per decade). The regional warming over the second half of the century has been stronger. For the period 1950 to 2005, Australian average surface temperature shows an increase of 0.95°C (0.17°C per decade). Maximum temperatures have increased by 0.86°C (0.15°C per decade) and minimum temperatures have increased by 1.04°C (0.18°C per decade) (Bureau of Meteorology, 2006a). Greater increases in maximum temperature have been observed over southern and eastern Australia while slower warming (and some cooling) has been observed over the northwest and southwest (Figure 1a). The spatial pattern of minimum temperature trends is very similar to the maximum temperature trends, but the magnitude of the trend in minimum temperature is larger over southern and eastern Australia (see Figures 1 b and 1c). The warmest year on record for Australia was 2005, when the annual mean temperature was 1.06°C above the 1961-1990 average, the maximum temperature was 1.21°C and the minimum was 0.91°C above average (Bureau of Meteorology, 2006b). In general, the frequency of extremely warm days and nights has increased while that of extremely cool days and nights has decreased. From 1957 to 2004, the Australian average shows an increase in hot days (35°C or more) of 1.0 days per decade, an increase in hot nights (20°C or more) of 1.8 nights per decade, a decrease in cold days (15°C or less) of 1.4 days per decade and a decrease in cold nights (5°C or less) of 1.5 nights per decade (Nicholls and Collins, 2006). Trends and year-to-year variability in maximum, minimum and average temperatures of the tropical rainforest region from 1950 to 2006 are shown in Figures 2 through 4. Since 1950, the tropical rainforest region’s average maximum temperature has increased by 0.8°C (0.14°C per decade), the minimum by 0.91°C (0.16°C per decade) and the average by 0.86°C (0.15°C per decade). Thus, compared to national trends, the tropical rainforest region’s temperatures show slower increases during the last five decades. However, similar to all-Australian records, 2005 was the warmest on record in the rainforest region.

Climate Change Projections for the Tropical Rainforest Region of North Queensland
3
(a) (b)
(c)
Trend in Maximum Temperature1950-2005 (oC/10yrs)
Trend in Minimum Temperature1950-2005 (oC/10yrs)
Trend in Mean Temperature1950-2005 (oC/10yrs)
Figure 1. Spatial patterns of trends in (a) maximum, (b) minimum and (c) mean temperatures in Australia from 1950 to 2005. Source: Australian Bureau of Meteorology.
Year
1950 1960 1970 1980 1990 2000 2010
Tem
pera
ture
ano
mal
ies
(o C)
-4.0-3.5-3.0-2.5-2.0-1.5-1.0-0.50.00.51.01.52.02.5
Temperature anomalies from 1961-9011-year running mean
Annual maximum temperature
0.14oC per 10 years
Figure 2a: Trends and fluctuations in maximum temperatures in the tropical rainforest region of north Queensland. Source: Australian Bureau of Meteorology.

Suppiah et al.
4
Year
1950 1960 1970 1980 1990 2000 2010
Tem
pera
ture
ano
mal
ies
(o C)
-1.5
-1.0
-0.5
0.0
0.5
1.0
1.5
Temperature anomalies from 1961-9011-year running mean
Annual minimum temperature0.16oC per 10 years
Figure 2b: Trends and fluctuations in minimum temperatures in the tropical rainforest region of north Queensland. Source: Australian Bureau of Meteorology.
Year
1950 1960 1970 1980 1990 2000 2010
Tem
pera
ture
ano
mal
ies
(o C)
-3.0
-2.5
-2.0
-1.5
-1.0
-0.5
0.0
0.5
1.0
1.5
2.0
Temperature anomalies from 1961-90 11-year running mean
Annual mean temperature0.15oC per 10 years
Figure 2c. Trends and fluctuations in average temperatures in the tropical rainforest region of north Queensland. Source: Australian Bureau of Meteorology

Climate Change Projections for the Tropical Rainforest Region of North Queensland
5
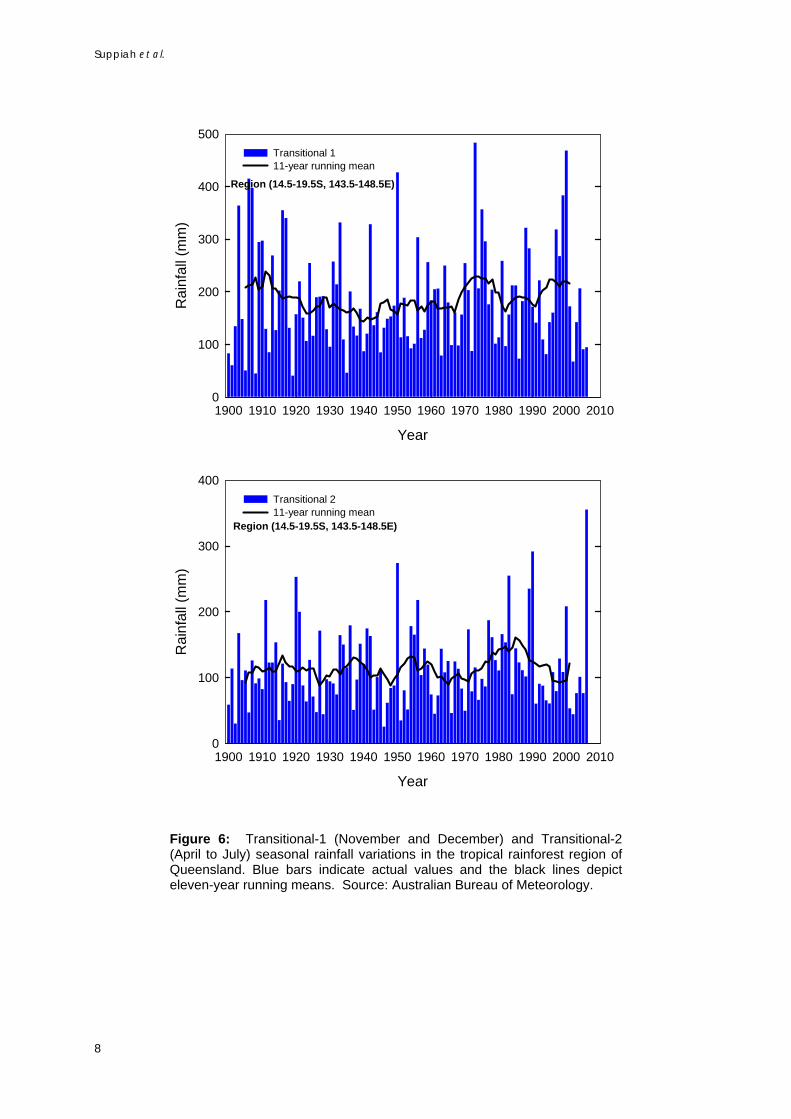
2.2 Rainfall Trends Australian rainfall records from 1900 to 2006 show an increasing trend over many parts of the country, except for south-western Australia and some parts of coastal Queensland, Tasmania and southern South Australia (Figure 3a). However, during the second half of the century, there is a stronger tendency for decreased rainfall in south-western and eastern Australia and increased rainfall over north-western and central Australia (Figure 3b). Due to the high natural variability of rainfall on decadal and longer time scales, it is difficult to distinguish any statistically significant long-term trends from this natural variability. In the 1970s, many regions were wet, while the 1990s were dry in many regions. Figures 4, 5 and 6 show fluctuations in annual and seasonal rainfall in the rainforest region of North Queensland from 1900 to 2006. There is no clear trend during the past century, but there are fluctuations on multi-decadal time scales. In particular, the 1920s, 1960s and 1990s were dry decades and the 1970s was a wet period. Decadal fluctuations in annual rainfall are dominated by wet season (January to March) rainfall variations. Rainfall in the dry season (August to October) shows no clear trend and strong variability. Rainfall in transitional seasons (Transitional 1 – November and December; Transitional 2 – April to July) shows greater variability and also no clear trends. Rainfall decrease is stronger in the south of the region compared to the north as indicated by rainfall trends in Townsville and Cairns in Figure 7.
Trend in annual rainfall1990-2006 (mm/10 years)
Trend in annual rainfall1950-2006 (mm/10 years)
Figure 3: Rainfall trends in Australia for (a) 1900 to 2006 and (b) 1950-2006. Trends are shown as mm per 10 years. Source: Australian Bureau of Meteorology.

Suppiah et al.
6
Year
1900 1910 1920 1930 1940 1950 1960 1970 1980 1990 2000 2010
Rai
nfal
l (m
m)
400
600
800
1000
1200
1400
1600
1800Annual rainfall 11-year running mean
Region (14.5-19.5S, 143.5-148.5E)
Figure 4: Annual rainfall variations in Tropical rainforest region of north Queensland. Blue bars indicate actual values and the black line depicts the eleven-year running mean. Source: Australian Bureau of Meteorology.

Climate Change Projections for the Tropical Rainforest Region of North Queensland
7
Year
1900 1910 1920 1930 1940 1950 1960 1970 1980 1990 2000 2010
Rai
nfal
l (m
m)
200
400
600
800
1000
1200
1400
1600Wet season rainfall11-year running mean
Region (14.5-19.5S, 143.5-148.5E)
Year
1900 1910 1920 1930 1940 1950 1960 1970 1980 1990 2000 2010
Rai
nfal
l (m
m)
0
20
40
60
80
100
120
140
160
180
200Dry season rainfall11-year running mean
Region (14.5-19.5S, 143.5-148.5E)
Figure 5: Wet (January to March) and dry (August to October) seasonal rainfall variations in the tropical rainforest region of Queensland. Blue bars indicate actual values and the black lines depict eleven-year running means. Source: Australian Bureau of Meteorology.
Suppiah et al.
8
Year
1900 1910 1920 1930 1940 1950 1960 1970 1980 1990 2000 2010
Rai
nfal
l (m
m)
0
100
200
300
400
500Transitional 111-year running mean
Region (14.5-19.5S, 143.5-148.5E)
Year
1900 1910 1920 1930 1940 1950 1960 1970 1980 1990 2000 2010
Rai
nfal
l (m
m)
0
100
200
300
400Transitional 211-year running mean
Region (14.5-19.5S, 143.5-148.5E)
Figure 6: Transitional-1 (November and December) and Transitional-2 (April to July) seasonal rainfall variations in the tropical rainforest region of Queensland. Blue bars indicate actual values and the black lines depict eleven-year running means. Source: Australian Bureau of Meteorology.

Climate Change Projections for the Tropical Rainforest Region of North Queensland
9
Year
1940 1950 1960 1970 1980 1990 2000 2010
Rai
nfal
l (m
m)
200
400
600
800
1000
1200
1400
1600
1800
2000
2200
Total rainfall11 year running meanLinear trend
Townsville
Year
1940 1950 1960 1970 1980 1990 2000 2010
Rai
nfal
l (m
m)
500
1000
1500
2000
2500
3000
3500
Total rainfall11-year running meanLinear trend
Cairns
Figure 7: Trends and inter annual variabilities of rainfall from 1 September to 30 April from 1940 to 2000. Note a stronger decrease in Townsville compared to Cairns. Source: Australian Bureau of Meteorology.
Suppiah et al.
10
3. ASSESSMENT OF AR4 CLIMATE MODELS Monthly data from 20th Century and 21st Century SRES A2 and A1B emission scenario (SRES, 2000) simulations of twenty-three GCMs were obtained from the WCRP CMIP3 (World Climate Research Programme’s Coupled Model Intercomparison Project Phase 3) Model Output website at http://www-pcmdi.llnl.gov/ipcc/info_for_analysts.php. These model simulations were performed for the IPCC Fourth Assessment Report (IPCC AR4). For each scenario, most of the models have single simulations, while some models have multiple simulations. For models with multiple simulations, we have computed ensemble-mean changes in climate. The simulations of the 20th Century climate were driven by observed changes in greenhouse gases and aerosols. Some simulations included direct and indirect effects of aerosols; some included ozone depletion, and some included volcanic aerosols and solar forcing. Radiative forcing is not directly observed and is particularly uncertain for aerosol. Table 1 gives information about the various forcings used in each simulation and the resolution of each model. Where both SRES A2 and A1B 21st Century simulations were available, the SRES A2 simulation was selected for further analysis in preference to the SRES A1B simulation. Statistical methods were used to objectively test the ability of each model to simulate Queensland’s present climate. Observed and simulated patterns for 1961-1990 were compared by calculating the pattern correlation coefficient, which measures pattern similarity, and root mean square error (RMS), which measures differences in magnitude. A pattern correlation coefficient of 1.0 indicates a perfect match between the observed and simulated spatial pattern, and an RMS error of 0.0 indicates a perfect match between observed and simulated magnitudes. In case of rainfall, pattern correlation and RMS error statistics have been calculated using seasonal total values. In Figure 10 total RMS error values for each season were divided by the number of days in a season and expressed as mm per day. A domain that covers Queensland (140-155°E, 10-20°S) was selected to validate the temperature and rainfall simulations. However, a larger domain that covers Australia (110-160°E, 10-45°S) was used to assess mean sea-level pressure (MSLP). Further details of the methods described in this section are given by Whetton et al. (2005). Here we assessed the model reliability over Queensland for four conventional seasons: December to February (DJF), March to May (MAM), June to August (JJA) and September to November (SON) as the seasonal breakdown is used to capture large-scale characteristics of climate over a broad region. However, climate change projections for the rainforest region are produced for a slightly different seasonal breakdown and they are Wet season (January to March, Dry season (August to October), Transitional 1 (November and December) and Transitional 2 (April to July). Figure 8 shows the pattern correlation and RMS error for MSLP for twenty-three models. The correlation coefficient of most models is very good (above 0.8), except for BCC which shows correlations less than 0.8 in three seasons and IPSL which shows correlations less than 0.8 in all four seasons. Models such as CCCMAT47, GISS-AOM, MICRO-H and MICRO-M show correlations less than 0.8 in two seasons. The RMS error is greater than 2 hPa in some models, particularly in BCC, CCCMAT47, GISS-E-H, GISS-E-R, IPSL, MICRO-H and HADCM3. Some models also show errors greater than 5 hPa in two or three seasons. However, an error of 5 hPa is considered small compared to the global range in mean seasonal pressure, approximately 970 to 1040 hPa.. Most models perform very well in DJF and MAM when the south-north pressure gradient is strong. The models perform moderately well in JJA and SON when the pressure gradient is weak. Figure 9 shows pattern correlation and RMS error for temperature for twenty-three models over Queensland. It is evident from Figure 9 that pattern correlations for all models are
Climate Change Projections for the Tropical Rainforest Region of North Queensland
11
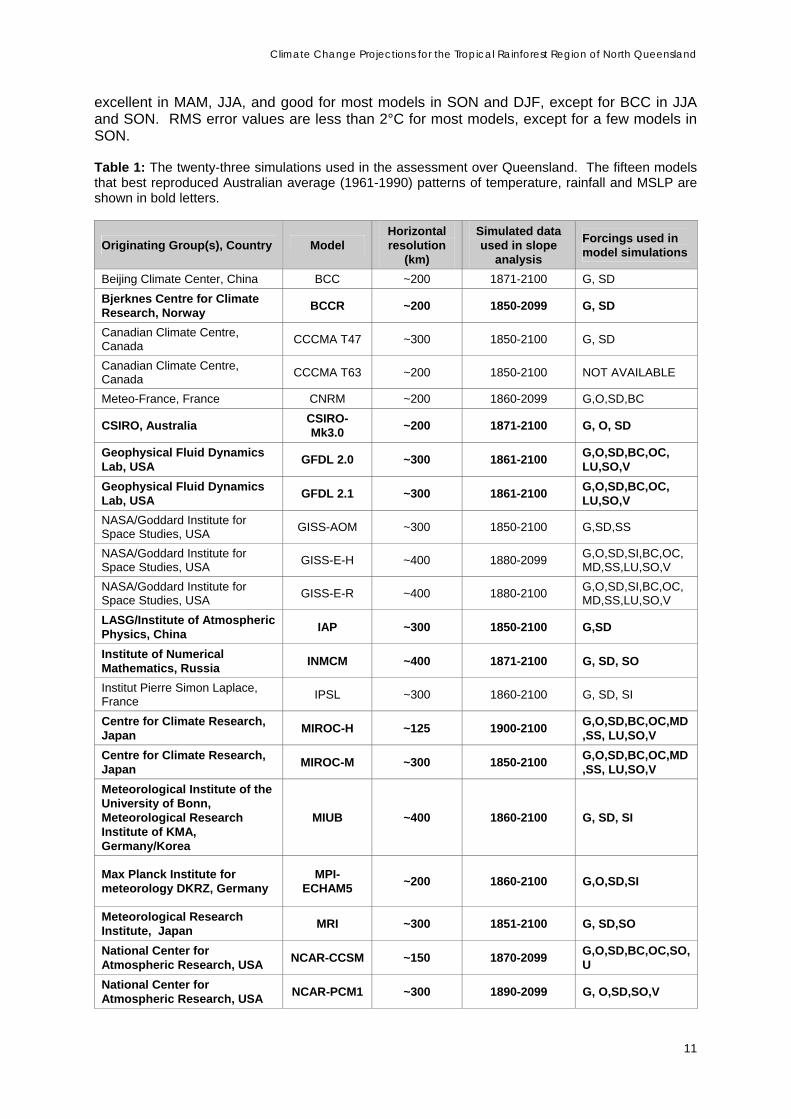
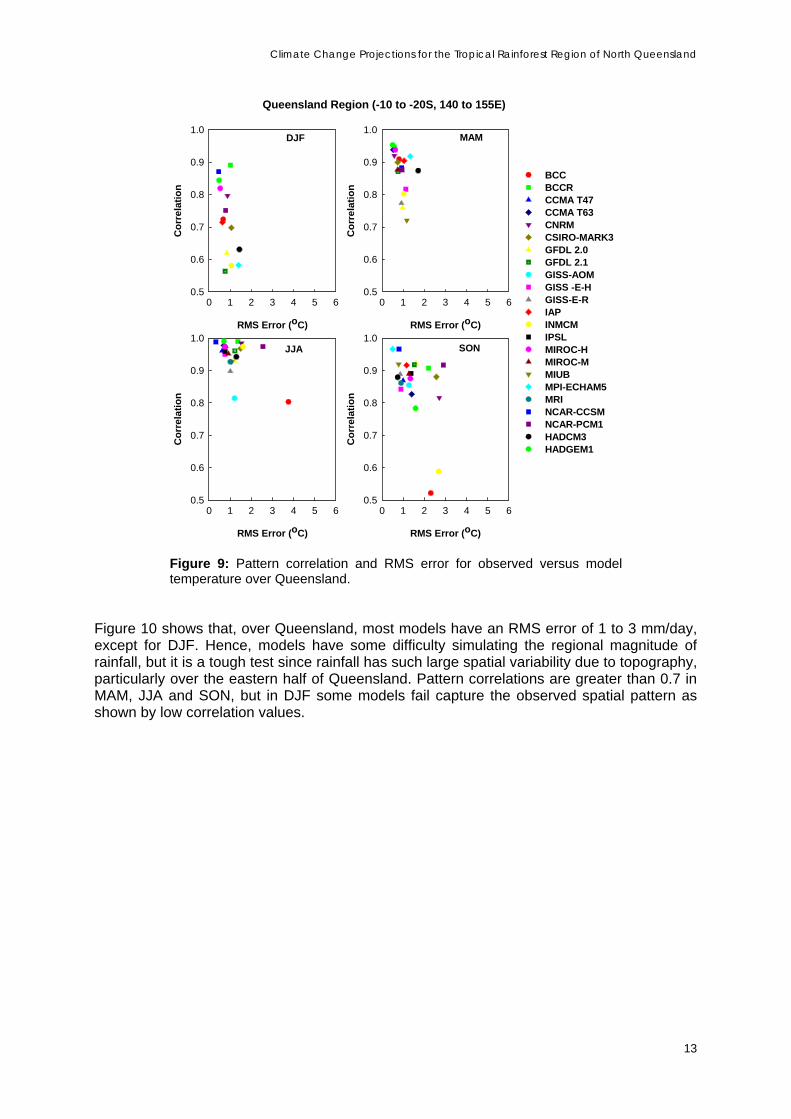
excellent in MAM, JJA, and good for most models in SON and DJF, except for BCC in JJA and SON. RMS error values are less than 2°C for most models, except for a few models in SON. Table 1: The twenty-three simulations used in the assessment over Queensland. The fifteen models that best reproduced Australian average (1961-1990) patterns of temperature, rainfall and MSLP are shown in bold letters.
Originating Group(s), Country Model Horizontal resolution
(km)
Simulated data used in slope
analysis
Forcings used in model simulations
Beijing Climate Center, China BCC ~200 1871-2100 G, SD Bjerknes Centre for Climate Research, Norway BCCR ~200 1850-2099 G, SD
Canadian Climate Centre, Canada CCCMA T47 ~300 1850-2100 G, SD
Canadian Climate Centre, Canada CCCMA T63 ~200 1850-2100 NOT AVAILABLE
Meteo-France, France CNRM ~200 1860-2099 G,O,SD,BC
CSIRO, Australia CSIRO-Mk3.0 ~200 1871-2100 G, O, SD
Geophysical Fluid Dynamics Lab, USA GFDL 2.0 ~300 1861-2100 G,O,SD,BC,OC,
LU,SO,V Geophysical Fluid Dynamics Lab, USA GFDL 2.1 ~300 1861-2100 G,O,SD,BC,OC,
LU,SO,V NASA/Goddard Institute for Space Studies, USA GISS-AOM ~300 1850-2100 G,SD,SS
NASA/Goddard Institute for Space Studies, USA GISS-E-H ~400 1880-2099 G,O,SD,SI,BC,OC,
MD,SS,LU,SO,V NASA/Goddard Institute for Space Studies, USA GISS-E-R ~400 1880-2100 G,O,SD,SI,BC,OC,
MD,SS,LU,SO,V LASG/Institute of Atmospheric Physics, China IAP ~300 1850-2100 G,SD
Institute of Numerical Mathematics, Russia INMCM ~400 1871-2100 G, SD, SO
Institut Pierre Simon Laplace, France IPSL ~300 1860-2100 G, SD, SI
Centre for Climate Research, Japan MIROC-H ~125 1900-2100 G,O,SD,BC,OC,MD
,SS, LU,SO,V Centre for Climate Research, Japan MIROC-M ~300 1850-2100 G,O,SD,BC,OC,MD
,SS, LU,SO,V Meteorological Institute of the University of Bonn, Meteorological Research Institute of KMA, Germany/Korea
MIUB ~400 1860-2100 G, SD, SI
Max Planck Institute for meteorology DKRZ, Germany
MPI-ECHAM5 ~200 1860-2100 G,O,SD,SI
Meteorological Research Institute, Japan MRI ~300 1851-2100 G, SD,SO
National Center for Atmospheric Research, USA NCAR-CCSM ~150 1870-2099 G,O,SD,BC,OC,SO,
U National Center for Atmospheric Research, USA NCAR-PCM1 ~300 1890-2099 G, O,SD,SO,V

Suppiah et al.
12
Originating Group(s), Country Model Horizontal resolution
(km)
Simulated data used in slope
analysis
Forcings used in model simulations
Hadley Centre, UK HADCM3 ~300 1860-2099 G,O,SD,SI
Hadley Centre, UK HADGEM1 ~125 1860-2098 G,O,SD,SI,BC,OC,LU,SO,V
G=Well-mixed GHGs, O=Ozone, SD=Sulfate (direct), SI=Sulfate indirect, BC=Black carbon, OC=Organic carbon, MD=Mineral dust, SS=Sea salt, LU=Land use, SO=Solar irradiance and V=Volcanic aerosol.
RMS Error (hPa)
0 1 2 3 4 5 6 7 8 9 10
Cor
rela
tion
0.00.10.20.30.40.50.60.70.80.91.0
BCCBCCRCCMA T47 CCMA T63 CNRM CSIRO-MARK3GFDL 2.0GFDL 2.1GISS-AOMGISS-E-HGISS-E-RIAPINMCM IPSLMIROC-HMIROC-MMIUBMPI-ECHAM5MRINCAR-CCSM NCAR-PCM1HADCM3HADGEM1
DJF
RMS Error (hPa)
0 1 2 3 4 5 6 7 8 9 10
Cor
rela
tion
0.00.10.20.30.40.50.60.70.80.91.0
RMS Error (hPa)
0 1 2 3 4 5 6 7 8 9 10
Cor
rela
tion
0.00.10.20.30.40.50.60.70.80.91.0
RMS Error (hPa)
0 1 2 3 4 5 6 7 8 9 10
Cor
rela
tion
0.00.10.20.30.40.50.60.70.80.91.0
MAM
JJA SON
Figure 8: Pattern correlation and RMS error for observed versus model MSLP for the Australian region. Details of models are given in Table 1. In these diagrams, the better the model performance, the closer to the top left-hand corner of each diagram the result will lie
Climate Change Projections for the Tropical Rainforest Region of North Queensland
13
RMS Error (oC)
0 1 2 3 4 5 6
Cor
rela
tion
0.5
0.6
0.7
0.8
0.9
1.0
BCC BCCRCCMA T47CCMA T63CNRMCSIRO-MARK3GFDL 2.0GFDL 2.1GISS-AOMGISS -E-HGISS-E-RIAPINMCMIPSLMIROC-HMIROC-MMIUBMPI-ECHAM5MRINCAR-CCSMNCAR-PCM1HADCM3HADGEM1
DJF
RMS Error (oC)
0 1 2 3 4 5 6
Cor
rela
tion
0.5
0.6
0.7
0.8
0.9
1.0
RMS Error (oC)
0 1 2 3 4 5 6
Cor
rela
tion
0.5
0.6
0.7
0.8
0.9
1.0
RMS Error (oC)
0 1 2 3 4 5 6
Cor
rela
tion
0.5
0.6
0.7
0.8
0.9
1.0
MAM
JJA SON
Queensland Region (-10 to -20S, 140 to 155E)
Figure 9: Pattern correlation and RMS error for observed versus model temperature over Queensland.
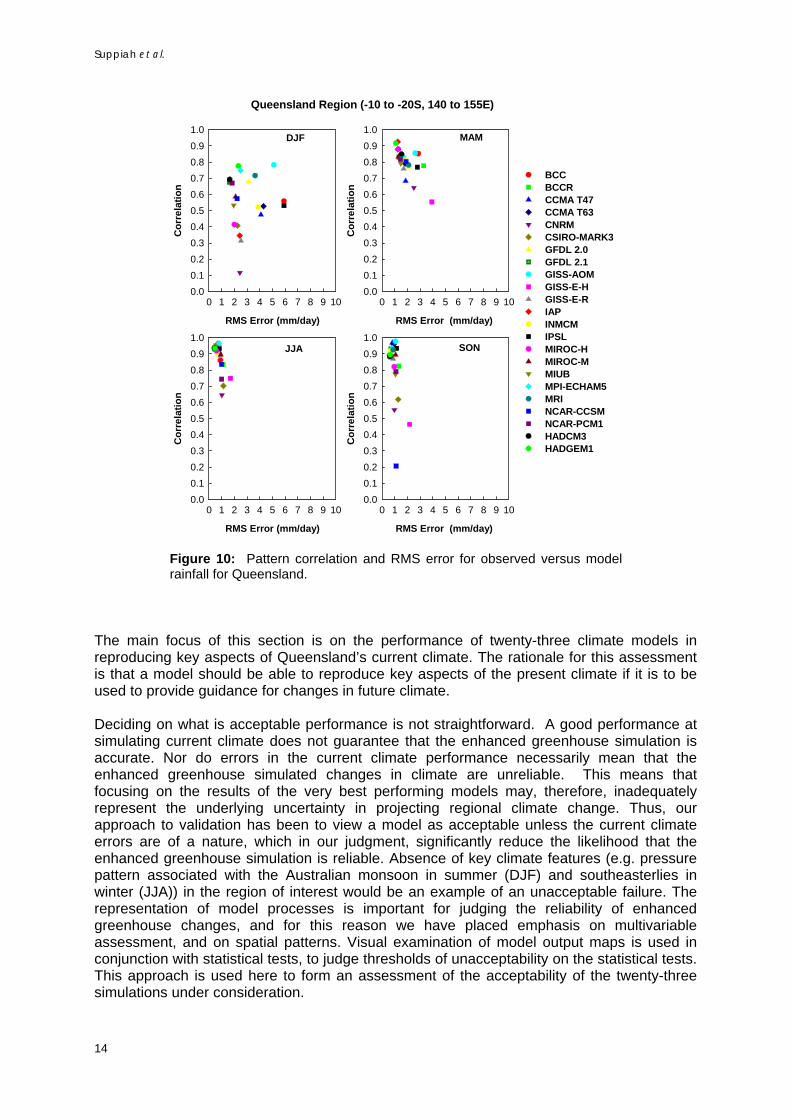
Figure 10 shows that, over Queensland, most models have an RMS error of 1 to 3 mm/day, except for DJF. Hence, models have some difficulty simulating the regional magnitude of rainfall, but it is a tough test since rainfall has such large spatial variability due to topography, particularly over the eastern half of Queensland. Pattern correlations are greater than 0.7 in MAM, JJA and SON, but in DJF some models fail capture the observed spatial pattern as shown by low correlation values.
Suppiah et al.
14
RMS Error (mm/day)
0 1 2 3 4 5 6 7 8 9 10
Cor
rela
tion
0.00.10.20.30.40.50.60.70.80.91.0
BCCBCCRCCMA T47CCMA T63CNRMCSIRO-MARK3GFDL 2.0GFDL 2.1GISS-AOMGISS-E-HGISS-E-RIAPINMCMIPSLMIROC-HMIROC-MMIUBMPI-ECHAM5MRINCAR-CCSMNCAR-PCM1HADCM3HADGEM1
DJF
RMS Error (mm/day)
0 1 2 3 4 5 6 7 8 9 10
Cor
rela
tion
0.00.10.20.30.40.50.60.70.80.91.0
RMS Error (mm/day)
0 1 2 3 4 5 6 7 8 9 10
Cor
rela
tion
0.00.10.20.30.40.50.60.70.80.91.0
RMS Error (mm/day)
0 1 2 3 4 5 6 7 8 9 10
Cor
rela
tion
0.00.10.20.30.40.50.60.70.80.91.0
MAM
JJA SON
Queensland Region (-10 to -20S, 140 to 155E)
Figure 10: Pattern correlation and RMS error for observed versus model rainfall for Queensland.
The main focus of this section is on the performance of twenty-three climate models in reproducing key aspects of Queensland’s current climate. The rationale for this assessment is that a model should be able to reproduce key aspects of the present climate if it is to be used to provide guidance for changes in future climate. Deciding on what is acceptable performance is not straightforward. A good performance at simulating current climate does not guarantee that the enhanced greenhouse simulation is accurate. Nor do errors in the current climate performance necessarily mean that the enhanced greenhouse simulated changes in climate are unreliable. This means that focusing on the results of the very best performing models may, therefore, inadequately represent the underlying uncertainty in projecting regional climate change. Thus, our approach to validation has been to view a model as acceptable unless the current climate errors are of a nature, which in our judgment, significantly reduce the likelihood that the enhanced greenhouse simulation is reliable. Absence of key climate features (e.g. pressure pattern associated with the Australian monsoon in summer (DJF) and southeasterlies in winter (JJA)) in the region of interest would be an example of an unacceptable failure. The representation of model processes is important for judging the reliability of enhanced greenhouse changes, and for this reason we have placed emphasis on multivariable assessment, and on spatial patterns. Visual examination of model output maps is used in conjunction with statistical tests, to judge thresholds of unacceptability on the statistical tests. This approach is used here to form an assessment of the acceptability of the twenty-three simulations under consideration.

Climate Change Projections for the Tropical Rainforest Region of North Queensland
15
To compare the overall performance of each model, a simple demerit point system based on thresholds was devised. This is the same point system described in more detail in Whetton et al. (2005). Models with an RMS error greater than 2.0 or a pattern correlation below 0.8 for MSLP, temperature and rainfall were assigned a demerit point. A maximum of twelve points would indicate failure to satisfactorily reproduce either pattern or magnitude for each variable in each season. An additional point was assigned if the RMS error was greater than 4.0 or if the pattern correlation fell below 0.6. On the basis of this system, we excluded models with more than ten points in the construction of mean temperature and rainfall projections for Queensland. The eight models that were excluded are BCC, CCCMA-T47, CCCMA-T63, CNRM, GISS-AOM, GISS-E-H, GISS-E-R and IPSL. Climate change projections are produced based on the remaining fifteen models.

Suppiah et al.
16
4. CONSTRUCTION OF CLIMATE CHANGE PROJECTIONS
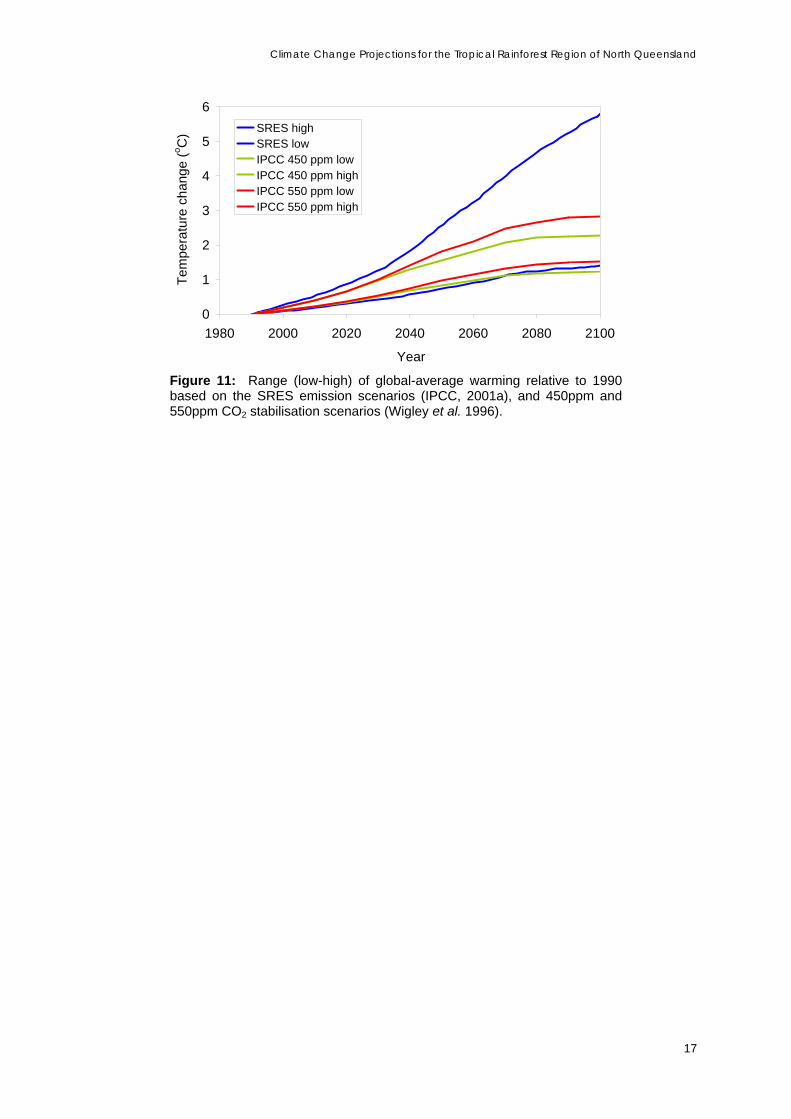
Climate change projections are often based on time-slices within a given climate simulation, e.g. a thirty year period centered on 2030, 2050, and so on. A disadvantage with this approach is that large portions of the simulation are not used and the projections are limited to the subset of SRES emission scenarios used in the simulations, e.g. B1, A1B and A2. However, analysis of temperature and rainfall simulations has shown that the regional patterns of change tend to scale linearly with global warming, for a range of emission scenarios (Whetton et al. 2005). The patterns of regional change in temperature and rainfall per degree of global warming from selected models can be rescaled by a given amount of global warming to produce a pattern of change that would apply for a given future date and global warming scenario. Hence, projections can be evaluated for emissions scenarios that have not been directly simulated in GCM experiments. This pattern scaling method has been used by CSIRO since 2001 (Whetton et al. 2005). Furthermore, the pattern scaling method enables us to estimate future temperature and rainfall changes by multiplying the regional ranges per degree of global warming by global warming projections given by IPCC. Such procedure has been applied to SRES and CO2 stabilisation emission scenarios. To derive regional projections for the years 2030 and 2070 for SRES emissions scenarios, the ranges of change per degree of global warming are combined with the IPCC (2001a) global warming projections for 2030 and 2070. For example, the high scenario for the regional warming range in 2030 would be the upper limit of the relevant range of regional warming per degree of global warming multiplied by the upper limit of the global warming range for 2030. Correspondingly, the low scenario for the regional warming range is based on the combination of the lower end of the regional warming per degree of global warming multiplied by the lower end of the global warming range. (The approach is the same for precipitation change, however, where the lower limit of the range of percent rainfall change is negative; this is combined with the upper limit of the projected global warming). The global warming projections are shown in Figure 11 for SRES emission scenarios. For the SRES scenarios, the range of global warming for 1990-2100 allows for two sources of uncertainty: (i) the full range of IPCC greenhouse gas and sulfate aerosol emission scenarios derived from the Special Report on Emission Scenarios (SRES, 2000), and (ii) the full range of “climate sensitivity”, i.e. the global mean warming for a doubling of CO2 from 280 parts per million (ppm) to 560 ppm. The combination of these uncertainties is given in the IPCC (2001a) global warming values, namely 0.54 to 1.24°C by 2030 and 1.17 to 3.77°C by 2070, relative to 1990. Updated global warming values for 2030 and 2070 were not available from IPCC (2007). Two CO2 stabilisation scenarios are considered: stabilisation at 450 ppm by the year 2100 and stabilisation at 550 ppm by the year 2150. For the 450 ppm scenario, the global warming is 0.52 to 0.89°C by 2030 and 1.11 to 1.95°C by 2070. For the 550 ppm scenario, the global warming is 0.57 to 0.96°C by 2030 and 1.36 to 2.36°C by 2070. First, temperature and rainfall projections were made multiplying the regional patterns of change per degree of global warming by IPCC global warming values for SRES emission scenarios and then, the regional patterns of change per degree of global warming are scaled using the global warming values derived by Wigley et al. (1996) for stabilised emission scenarios.
Climate Change Projections for the Tropical Rainforest Region of North Queensland
17
0
1
2
3
4
5
6
1980 2000 2020 2040 2060 2080 2100
Year
Tem
pera
ture
cha
nge
(o C) SRES high
SRES lowIPCC 450 ppm lowIPCC 450 ppm highIPCC 550 ppm lowIPCC 550 ppm high
Figure 11: Range (low-high) of global-average warming relative to 1990 based on the SRES emission scenarios (IPCC, 2001a), and 450ppm and 550ppm CO2 stabilisation scenarios (Wigley et al. 1996).

Suppiah et al.
18
5. CLIMATE CHANGE PROJECTIONS FOR QUEENSLAND AND SUB-REGIONS
In this section, future changes in temperature and rainfall are provided for Queensland and also for sub regions shown in Figure 12; north, south and the tropical rainforest region. Annual temperature and rainfall changes are presented in Figures 13 and 14 as colour-coded maps for the average climate change conditions by around 2030 and 2070 relative to a thirty-year average centred on 1990, i.e. from 1975 to 2004. The conditions of any individual year will continue to be strongly affected by natural climatic variability, which cannot be easily predicted. Figures 13 and 14 were produced using the method described by Whetton et al. (2005). The results of the fifteen models selected from those listed in Table 1 were interpolated to a common grid with a horizontal resolution of one degree both latitudinally and longitudinally. For each grid cell, the temperature range is bounded by the second lowest and second highest warmings given by the fifteen models. In the case of rainfall, the range of change for each grid cell is bounded by the second highest decrease in rainfall and the second greatest increase in rainfall given by the fifteen models. This approach reduces the influence of outlying model results.
Longitude °E
Latit
ude
°S
Figure 12: Sub regions used to construct climate change projections. Annual averaged temperature projections for SRES and CO2 stabilised emissions scenarios for 2030 and 2070 are presented for the whole region in Figure 12a. Changes in temperature for other decades are given in Appendix A1. By 2030, the region from the coast to 200 km inland shows annual-mean warming between 0.4 and 1.4°C, regions 200 to 600 km inland warm by 0.4 to 1.7°C and regions more than 600 km inland warm by 0.5 to 2.0°C. By 2070, the region within 200 km of the coast warms by 0.8 to 4.3°C, regions 200 to 600 km inland warm by 0.8 and 5.3°C and regions more than 600 km inland warm by 1.1 to 6.2°C.
Longitude °E
Long
itude
°E

Climate Change Projections for the Tropical Rainforest Region of North Queensland
19
Projected spatial patterns of seasonal temperature changes shown in Figure 12b are very similar to the pattern of annual change. However, there are differences in the magnitude of change between the seasons. The wet season, January to March, shows slightly reduced warming compared to other seasons. When considering a single emission scenario that stabilises the greenhouse gas concentration at a certain level by a certain year, there is a significant reduction in the upper limit of regional warming. With a scenario that leads to CO2 stabilisations at 550 ppm by the year 2150 (the WRE 550 scenario from Wigley et al. 1996), the upper limit of warming is reduced by 20% by 2030 and 37% by 2070. With a scenario that leads to CO2 stabilisations at 450 ppm by the year 2100 (the WRE 450 scenario from Wigley et al. 1996), the upper limit of warming is reduced by 25% by 2030 and 48% by 2070.
SRES 2030
0 1 2 3 4 5 6 7 8Temperature Change (oC)
WRE550 2030
0 1 2 3 4 5 6 7 8Temperature Change (oC)
WRE450 2030
0 1 2 3 4 5 6 7 8Temperature Change (oC)
SRES 2070
0 1 2 3 4 5 6 7 8Temperature Change (oC)
WRE550 2070
0 1 2 3 4 5 6 7 8Temperature Change (oC)
WRE450 2070
0 1 2 3 4 5 6 7 8Temperature Change (oC)
2030 2070
AnnualSRES
550 ppm
450 ppm
Figure 12a: Projected range of annual temperature (°C) for 2030 and 2070, relative to 1990, for the full range of (1) SRES emission scenarios, (2) the WRE 550 scenario, which stabilises the CO2 concentrations at 550 ppm by the year 2150, and (3) the WRE 450 scenario, which stabilises the CO2 concentrations at 450 ppm by the year 2100.

Suppiah et al.
20
SRES 2030
0 1 2 3 4 5 6 7 8Temperature Change (oC)
WRE550 2030
0 1 2 3 4 5 6 7 8Temperature Change (oC)
WRE450 2030
0 1 2 3 4 5 6 7 8Temperature Change (oC)
SRES 2070
0 1 2 3 4 5 6 7 8Temperature Change (oC)
WRE550 2070
0 1 2 3 4 5 6 7 8Temperature Change (oC)
WRE450 2070
0 1 2 3 4 5 6 7 8Temperature Change (oC)
2030 2070
Jan. to March Apr. to July
Aug. to Oct. Nov. to Dec.
SRES
550 ppm
450 ppm
Figure 12b: Projected range of seasonal temperature (°C) for 2030 and 2070, relative to 1990, for the full range of (1) SRES emission scenarios, (2) the WRE 550 scenario which stabilises the CO2 concentrations at 550 ppm by the year 2150, and (3) the WRE 450 scenario which stabilises the CO2 concentrations at 450 ppm by the year 2100.
Rainfall changes are more complex than temperature changes, as their signs and magnitudes show strong spatial variations. Model to model variations in rainfall are also large. Projected annual rainfall changes for 2030 and 2070 are shown in Figure 13a, and changes for other decades are given in Appendix A2. Under the SRES scenarios for 2030, the region within 200 km of the southern coast shows annual rainfall changes between -15 and +7% and northern coastal region and Cape York Peninsula show changes between -7 and +7%. Southern inland region shows changes between -15 and +15% with some areas in the east and south showing annual rainfall changes between -7 and +15%. By 2070, under SRES scenarios the region within 200 km of the southern coast shows annual rainfall changes between -45 and +23% and northern costal region and Cape York Peninsula show changes between -23 and +23%. Southern inland region shows changes between -45 and +45% with some areas in the east and south showing annual rainfall changes between -23 and +45%. Projected rainfall changes show strong variations among seasons as depicted in Figure 13b. The wet season (January to March) and Transitional season 2 (April to July) show increases and decreases. By 2030, in the wet season regions within 200 km from the coast and Cape York Peninsula show changes between -7 and +7% and southern inland region shows changes between -7 and +15%. A small region in the coast shows changes between -15 and +7%. In Transitional season 2, regions within 200 km from the south coast show changes between -15 and +7% and the majority of the remaining areas show changes between -15 and +15%. A few isolated areas show changes between -7 and +15%. For SRES emissions scenarios, a tendency for decreases is dominant in the dry season (August to October) and Transitional season 1 (November and December). In the dry season, projected rainfall changes over a large area show between -22 and +7% and a region that cover east and south of the Gulf of Carpentaria shows changes between -22 and +15% and northeast shows changes between -15 and +15%. In Transitional season 1, southeast and area south of Gulf of Carpentaria show changes between -22 and +7% and regions of southwest and north-central show changes between -22 and +15%. Part of York Peninsula shows changes between -15 and +7%. By 2070, strong increases and decreases are projected.

Climate Change Projections for the Tropical Rainforest Region of North Queensland
21
2030 2070
SRES 2030
-80 -40 0 40 80Rainfall Change (%)
WRE550 2030
-80 -40 0 40 80Rainfall Change (%)
WRE450 2030
-80 -40 0 40 80Rainfall Change (%)
SRES 2070
-80 -40 0 40 80Rainfall Change (%)
WRE550 2070
-80 -40 0 40 80Rainfall Change (%)
WRE450 2070
-80 -40 0 40 80Rainfall Change (%)
AnnualSRES
550 ppm
450 ppm
Figure 13a: Projected percentage changes in annual rainfall for 2030 and 2070, relative to 1990, for (1) SRES emission scenarios, (2) the WRE 550 scenario, which stabilises the CO2 concentrations at 550 ppm by the year 2150, and (3) the WRE 450 scenario, which stabilises the CO2 concentrations at 450 ppm by the year 2100. When considering a single emission scenario that stabilises the greenhouse gas concentration at a certain level by a certain year, there is a significant reduction in the magnitude of changes in regional rainfall. With a scenario that leads to CO2 stabilisation at 550 ppm (the WRE 550 scenario from Wigley et al. 1996), the range of rainfall changes reduces from [-22 to +15%] to [-17 to +12%] by 2030 and by 2070, the range of rainfall changes reduces from [-68 to +45%] to [-42 to +28%]. With a scenario that leads to CO2 stabilisation at 450 ppm (the WRE 450 scenario from Wigley et al. 1996), the range of rainfall changes reduces from [-22 to +15%] to [-16 to +11%] by 2030, and from [-68 to +45%] to [-35to +23%] by 2070. Projected changes in seasonal temperature and rainfall for regions shown in Figure 11 are given in Appendices A3 to A8.

Suppiah et al.
22
2030 2070SRES 2030
-80 -40 0 40 80Rainfall Change (%)
WRE550 2030
-80 -40 0 40 80Rainfall Change (%)
WRE450 2030
-80 -40 0 40 80Rainfall Change (%)
SRES 2070
-80 -40 0 40 80Rainfall Change (%)
WRE550 2070
-80 -40 0 40 80Rainfall Change (%)
WRE450 2070
-80 -40 0 40 80Rainfall Change (%)
Jan. to March
Nov. to DecAug. to Oct.
Apr. to July
SRES
550 ppm
450 ppm
Figure 13b: Projected percentage changes in seasonal rainfall for 2030 and 2070, relative to 1990, for (1) SRES emission scenarios, (2) a scenario that stabilises the CO2 concentrations at 550 ppm by the year 2150 and (3) a scenario that stabilises the CO2 concentrations at 450 ppm by the year 2100.
Climate Change Projections for the Tropical Rainforest Region of North Queensland
23
6. CONCLUSIONS An assessment of twenty-three global climate models from the IPCC data centre has been made using statistical tests. Simulated patterns of mean sea level pressure, temperature and rainfall have been compared with observed patterns. On the basis of the results of statistical tests, fifteen models have been selected to construct temperature and rainfall projections for northern Queensland and sub regions. Temperature and rainfall projections are given for four seasons specifically related to the MTSRF region and also for decades from 2020 to 2080. Model-to-model variations and emission scenarios largely dominate the ranges of projected temperature and rainfall. By 2030, projected annual warming shows between 0.4 and 1.4°C in the region from the coast to 200 km inland, between 0.4 and 1.7°C in regions 200 to 600 km inland and between 0.5 and 2.0°C in regions more than 600 km inland. Greater warming is projected by 2070. If CO2 concentrations are stabilised at 550 ppm by the year 2150, the upper limit of warming is reduced by 20% by 2030 and 37% by 2070. If CO2 concentrations are stabilised at 450 ppm by the year 2100, the upper limit of warming is reduced by 25% by 2030 and 48% by 2070. The wet season and Transitional season 2 show increases and decreases in rainfall, but decreases dominate the dry season and Transitional season 1. By 2030, in the wet season regions within 200 km from the coast and Cape York Peninsula show changes between -7 and +7% and southern inland region shows changes between -7 and +15%. A small region in the coast shows changes between -15 and +7%. In Transitional season 2, regions within 200 km from the south coast show changes between -15 and +7% and the majority of the remaining areas show changes between -15 and +15%. A few isolated areas show changes between -7 and +15%. In the dry season, projected rainfall changes are between -22 and +7%. A region that covers east and south of the Gulf of Carpentaria shows changes between -22 and +15% and the northeast shows changes between -15 and +15%. In Transitional season 1, the southeast and area south of the Gulf of Carpentaria show changes between -22 and +7% and parts of the southwest and the north-central region show changes between -22 and +15%. Part of York Peninsula shows changes between -15 and +7%. By 2070, strong increases and decreases are projected.

Suppiah et al.
24
7. REFERENCES CSIRO, 2001. Climate change projections for Australia. CSIRO Atmospheric Research,
Melbourne, 8pp. Hilbert, D. W., Ostendorf, B. and Hopkins, M. S. 2001. Sensitivity of tropical forests to climate
change in the humid tropics of north Queensland. Austral Ecology, 26, 590-603. IPCC, 2007. Climate Change 2007: The Physical Science – Summary for Policymakers.
Contribution of Working Group I to the Fourth Assessment Report of the Intergovernmental Panel on Climate Change, 17pp.
Ostendorf, B., Hilbert, D. W. and Hopkins, M. S. 2001. The effect of climate change on
tropical rainforest vegetation pattern. Ecological Modelling, 145, 211-224. SRES, 2000: Special Report on Emission Scenarios: Summary for Policymakers. A Special
Report of Working Group III of the Intergovernmental Panel on Climate Change. Cambridge University Press, Cambridge, UK, http://www.ipcc.ch/pub/sres-e.pdf, 27 pp. Table 6-1.
Thomas, C. D. and 18 co-authors. 2004. Extinction risk from climate change. Nature, 427,
145-148. Whetton, P.H., McInnes, K.L., Jones, R.N., Hennessy, K.J., Suppiah, R., Page, C.M.,
Bathols, J. and Durack P. 2005: Climate change projections for Australia for impact assessment and policy application: A review. CSIRO Technical Paper. 001, Aspendale, Vic., CSIRO Marine and Atmospheric Research, 34p. http://www.cmar.csiro.au/e-print/open/whettonph_2005a.pdf
Wigley, T.M. L., Richels, R. and Edmonds, J.A. 1996. Economic and environmental choices
in the stabilization of atmospheric CO2 concentrations. Nature, 379, 240-243.
Climate Change Projections for the Tropical Rainforest Region of North Queensland
25
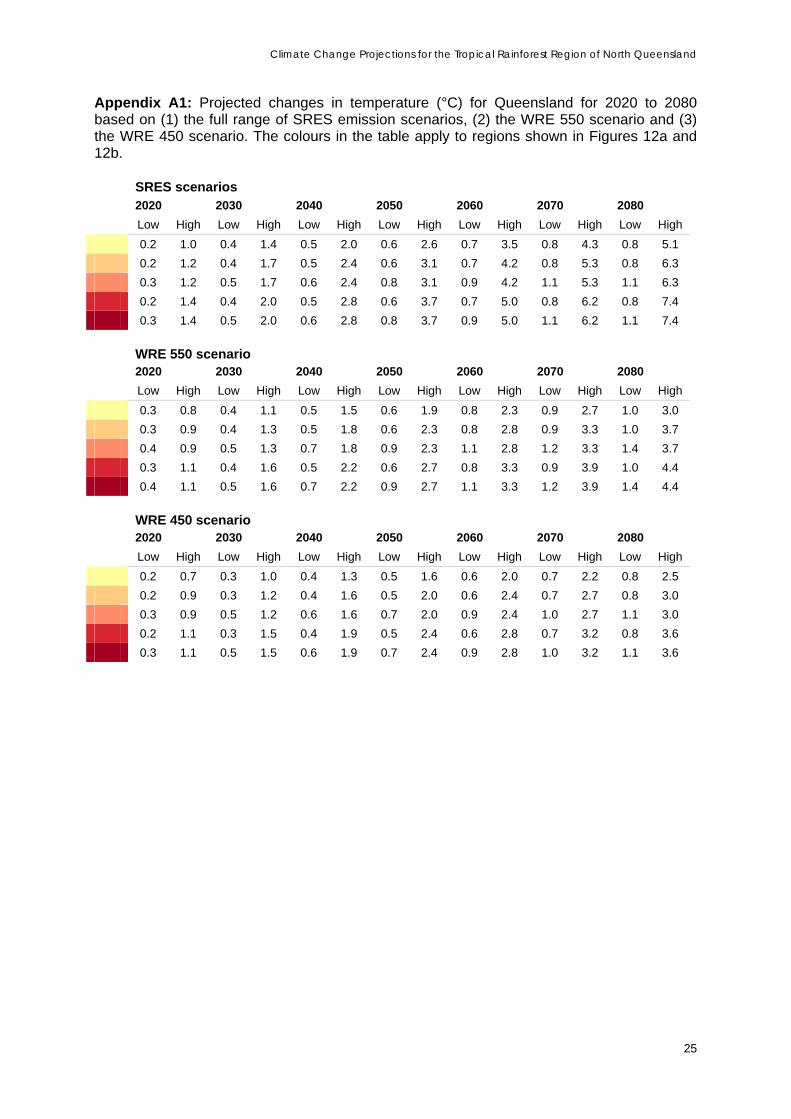
Appendix A1: Projected changes in temperature (°C) for Queensland for 2020 to 2080 based on (1) the full range of SRES emission scenarios, (2) the WRE 550 scenario and (3) the WRE 450 scenario. The colours in the table apply to regions shown in Figures 12a and 12b. SRES scenarios 2020 2030 2040 2050 2060 2070 2080
Low High Low High Low High Low High Low High Low High Low High 0.2 1.0 0.4 1.4 0.5 2.0 0.6 2.6 0.7 3.5 0.8 4.3 0.8 5.1 0.2 1.2 0.4 1.7 0.5 2.4 0.6 3.1 0.7 4.2 0.8 5.3 0.8 6.3 0.3 1.2 0.5 1.7 0.6 2.4 0.8 3.1 0.9 4.2 1.1 5.3 1.1 6.3 0.2 1.4 0.4 2.0 0.5 2.8 0.6 3.7 0.7 5.0 0.8 6.2 0.8 7.4 0.3 1.4 0.5 2.0 0.6 2.8 0.8 3.7 0.9 5.0 1.1 6.2 1.1 7.4
WRE 550 scenario 2020 2030 2040 2050 2060 2070 2080
Low High Low High Low High Low High Low High Low High Low High 0.3 0.8 0.4 1.1 0.5 1.5 0.6 1.9 0.8 2.3 0.9 2.7 1.0 3.0 0.3 0.9 0.4 1.3 0.5 1.8 0.6 2.3 0.8 2.8 0.9 3.3 1.0 3.7 0.4 0.9 0.5 1.3 0.7 1.8 0.9 2.3 1.1 2.8 1.2 3.3 1.4 3.7 0.3 1.1 0.4 1.6 0.5 2.2 0.6 2.7 0.8 3.3 0.9 3.9 1.0 4.4 0.4 1.1 0.5 1.6 0.7 2.2 0.9 2.7 1.1 3.3 1.2 3.9 1.4 4.4
WRE 450 scenario 2020 2030 2040 2050 2060 2070 2080
Low High Low High Low High Low High Low High Low High Low High 0.2 0.7 0.3 1.0 0.4 1.3 0.5 1.6 0.6 2.0 0.7 2.2 0.8 2.5 0.2 0.9 0.3 1.2 0.4 1.6 0.5 2.0 0.6 2.4 0.7 2.7 0.8 3.0 0.3 0.9 0.5 1.2 0.6 1.6 0.7 2.0 0.9 2.4 1.0 2.7 1.1 3.0 0.2 1.1 0.3 1.5 0.4 1.9 0.5 2.4 0.6 2.8 0.7 3.2 0.8 3.6 0.3 1.1 0.5 1.5 0.6 1.9 0.7 2.4 0.9 2.8 1.0 3.2 1.1 3.6

Suppiah et al.
26
Appendix A2: Projected percentage changes in rainfall for Queensland for 2020 to 2080 based on (1) the full range of SRES emission scenarios, (2) the WRE 550 scenario and (3) the WRE 450 scenario. The colours in the table apply to regions shown in Figures 13a and 13b. SRES scenario 2020 2030 2040 2050 2060 2070 2080
Dry Wet Dry Wet Dry Wet Dry Wet Dry Wet Dry Wet Dry Wet -5 10 -7 15 -10 20 -13 25 -18 35 -23 45 -25 55 -15 10 -22 15 -30 20 -40 25 -55 36 -70 45 -80 55 -10 5 -15 7 -20 10 -25 13 -35 18 -45 23 -55 25 -15 5 -22 7 -30 10 -40 13 -55 18 -70 23 -80 25 -5 5 -7 7 -10 10 -13 13 -18 18 -23 23 -25 25 -10 10 -15 15 -20 20 -25 25 -35 35 -45 45 -55 55
WRE 550 scenario 2020 2030 2040 2050 2060 2070 2080
Dry Wet Dry Wet Dry Wet Dry Wet Dry Wet Dry Wet Dry Wet -4 8 -6 12 -8 16 -10 20 -12 24 -14 30 -16 30 -12 8 -17 12 -24 16 -30 20 -35 24 -40 30 -50 30 -8 4 -12 6 -16 8 -20 10 -24 12 -30 14 -30 16 -12 4 -17 6 -24 8 -30 10 -35 12 -40 14 -30 16 -4 4 -6 6 -8 8 -10 10 -12 12 -14 14 -16 16 -8 8 -12 12 -16 16 -20 20 -24 24 -30 30 -30 30
WRE 450 scenario 2020 2030 2040 2050 2060 2070 2080
Dry Wet Dry Wet Dry Wet Dry Wet Dry Wet Dry Wet Dry Wet -4 8 -5 11 -7 14 -9 17 -10 20 -12 23 -13 25 -12 8 -16 11 -21 14 -25 17 -30 20 -35 23 -40 25 -8 4 -11 5 -14 7 -17 9 -20 10 -23 12 -25 13 -12 4 -16 5 -21 7 -25 9 -30 10 -35 12 -40 13 -4 4 -5 5 -7 7 -9 9 -10 10 -12 12 -13 13 -8 8 -11 11 -14 14 -17 17 -20 20 -23 23 -25 25

Climate Change Projections for the Tropical Rainforest Region of North Queensland
27
Appendix A3: Projected seasonal temperature changes (°C), relative to 1990, for the full range of SRES emission scenarios for the regions shown in Figure 12 for 2020 to 2080. The seasons are as follows: Wet season (January to March), Dry season (August to October), Transitional season 1 (November and December), Transitional season 2 (April to July), Wet-half year (December to May) and Dry-half year (June to November).
2020 2030 2040 2050 2060 2070 2080 Region/Year Low High Low High Low High Low High Low High Low High Low High Entire region Annual 0.3 1.1 0.5 1.6 0.7 2.2 0.8 2.9 1.0 3.9 1.1 4.8 1.2 5.7 Wet season 0.3 1.1 0.4 1.6 0.6 2.2 0.7 2.9 0.8 3.8 0.9 4.8 1.0 5.7 Dry season 0.4 1.1 0.5 1.6 0.7 2.2 0.9 2.8 1.0 3.8 1.2 4.8 1.3 5.7 Transitional-1 0.3 1.2 0.5 1.7 0.6 2.3 0.8 3.1 0.9 4.1 1.0 5.2 1.1 6.2 Transitional-2 0.3 1.1 0.5 1.6 0.7 2.3 0.8 3.0 1.0 4.0 1.1 5.0 1.2 5.9 Wet half-year 0.3 1.1 0.4 1.6 0.6 2.2 0.7 2.9 0.9 3.8 1.0 4.8 1.1 5.7 Dry half-year 0.4 1.1 0.5 1.6 0.7 2.2 0.9 2.9 1.0 3.9 1.1 4.8 1.2 5.7 Southern sub-region Annual 0.3 1.2 0.5 1.7 0.7 2.3 0.8 3.1 1.0 4.2 1.1 5.2 1.2 6.2 Wet season 0.3 1.1 0.4 1.7 0.6 2.3 0.7 3.0 0.8 4.1 0.9 5.1 1.0 6.0 Dry season 0.4 1.2 0.6 1.8 0.8 2.4 0.9 3.2 1.1 4.3 1.2 5.3 1.3 6.3 Transitional-1 0.3 1.2 0.5 1.8 0.6 2.5 0.7 3.2 0.9 4.4 1.0 5.5 1.1 6.5 Transitional-2 0.4 1.2 0.5 1.7 0.7 2.4 0.9 3.1 1.0 4.2 1.1 5.2 1.2 6.2 Wet half-year 0.3 1.2 0.5 1.7 0.6 2.3 0.8 3.0 0.9 4.1 1.0 5.1 1.1 6.1 Dry half-year 0.4 1.2 0.6 1.7 0.7 2.4 0.9 3.1 1.1 4.2 1.2 5.3 1.3 6.3 Northern sub-region Annual 0.3 1.0 0.5 1.4 0.6 2.0 0.8 2.6 0.9 3.5 1.0 4.4 1.1 5.2 Wet season 0.3 1.0 0.4 1.5 0.5 2.0 0.7 2.7 0.8 3.6 0.9 4.5 0.9 5.3 Dry season 0.3 1.0 0.5 1.4 0.7 1.9 0.8 2.5 1.0 3.4 1.1 4.2 1.2 5.0 Transitional-1 0.3 1.0 0.5 1.5 0.6 2.0 0.8 2.6 0.9 3.6 1.0 4.5 1.1 5.3 Transitional-2 0.3 1.1 0.5 1.6 0.6 2.1 0.8 2.8 0.9 3.8 1.0 4.7 1.1 5.6 Wet half-year 0.3 1.0 0.4 1.5 0.6 2.0 0.7 2.6 0.8 3.5 0.9 4.4 1.0 5.2 Dry half-year 0.4 1.0 0.5 1.4 0.7 2.0 0.8 2.6 1.0 3.5 1.1 4.4 1.2 5.2 Rainforest area Annual 0.3 0.9 0.5 1.4 0.6 1.9 0.7 2.5 0.9 3.3 1.0 4.2 1.1 5.0 Wet season 0.3 1.0 0.4 1.4 0.6 1.9 0.7 2.6 0.8 3.4 0.9 4.3 1.0 5.1 Dry season 0.3 0.9 0.5 1.4 0.6 1.9 0.8 2.4 0.9 3.3 1.0 4.1 1.1 4.9 Transitional-1 0.3 1.0 0.5 1.4 0.6 1.9 0.8 2.5 0.9 3.4 1.0 4.3 1.1 5.0 Transitional-2 0.3 1.0 0.5 1.5 0.6 2.0 0.8 2.7 0.9 3.6 1.0 4.5 1.1 5.4 Wet half-year 0.3 1.0 0.4 1.4 0.6 1.9 0.7 2.5 0.8 3.4 0.9 4.3 1.0 5.1 Dry half-year 0.3 0.9 0.5 1.4 0.6 1.9 0.8 2.5 0.9 3.3 1.1 4.1 1.1 4.9
Suppiah et al.
28
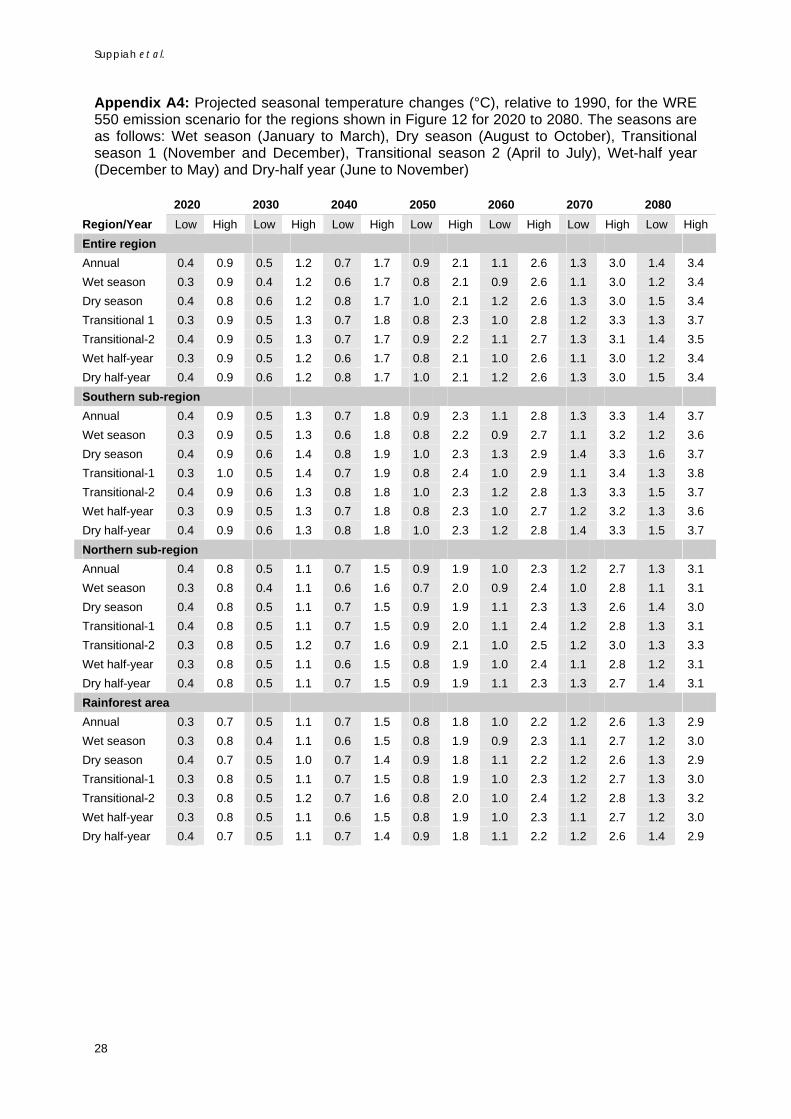
Appendix A4: Projected seasonal temperature changes (°C), relative to 1990, for the WRE 550 emission scenario for the regions shown in Figure 12 for 2020 to 2080. The seasons are as follows: Wet season (January to March), Dry season (August to October), Transitional season 1 (November and December), Transitional season 2 (April to July), Wet-half year (December to May) and Dry-half year (June to November)
2020 2030 2040 2050 2060 2070 2080 Region/Year Low High Low High Low High Low High Low High Low High Low High Entire region Annual 0.4 0.9 0.5 1.2 0.7 1.7 0.9 2.1 1.1 2.6 1.3 3.0 1.4 3.4 Wet season 0.3 0.9 0.4 1.2 0.6 1.7 0.8 2.1 0.9 2.6 1.1 3.0 1.2 3.4 Dry season 0.4 0.8 0.6 1.2 0.8 1.7 1.0 2.1 1.2 2.6 1.3 3.0 1.5 3.4 Transitional 1 0.3 0.9 0.5 1.3 0.7 1.8 0.8 2.3 1.0 2.8 1.2 3.3 1.3 3.7 Transitional-2 0.4 0.9 0.5 1.3 0.7 1.7 0.9 2.2 1.1 2.7 1.3 3.1 1.4 3.5 Wet half-year 0.3 0.9 0.5 1.2 0.6 1.7 0.8 2.1 1.0 2.6 1.1 3.0 1.2 3.4 Dry half-year 0.4 0.9 0.6 1.2 0.8 1.7 1.0 2.1 1.2 2.6 1.3 3.0 1.5 3.4 Southern sub-region Annual 0.4 0.9 0.5 1.3 0.7 1.8 0.9 2.3 1.1 2.8 1.3 3.3 1.4 3.7 Wet season 0.3 0.9 0.5 1.3 0.6 1.8 0.8 2.2 0.9 2.7 1.1 3.2 1.2 3.6 Dry season 0.4 0.9 0.6 1.4 0.8 1.9 1.0 2.3 1.3 2.9 1.4 3.3 1.6 3.7 Transitional-1 0.3 1.0 0.5 1.4 0.7 1.9 0.8 2.4 1.0 2.9 1.1 3.4 1.3 3.8 Transitional-2 0.4 0.9 0.6 1.3 0.8 1.8 1.0 2.3 1.2 2.8 1.3 3.3 1.5 3.7 Wet half-year 0.3 0.9 0.5 1.3 0.7 1.8 0.8 2.3 1.0 2.7 1.2 3.2 1.3 3.6 Dry half-year 0.4 0.9 0.6 1.3 0.8 1.8 1.0 2.3 1.2 2.8 1.4 3.3 1.5 3.7 Northern sub-region Annual 0.4 0.8 0.5 1.1 0.7 1.5 0.9 1.9 1.0 2.3 1.2 2.7 1.3 3.1 Wet season 0.3 0.8 0.4 1.1 0.6 1.6 0.7 2.0 0.9 2.4 1.0 2.8 1.1 3.1 Dry season 0.4 0.8 0.5 1.1 0.7 1.5 0.9 1.9 1.1 2.3 1.3 2.6 1.4 3.0 Transitional-1 0.4 0.8 0.5 1.1 0.7 1.5 0.9 2.0 1.1 2.4 1.2 2.8 1.3 3.1 Transitional-2 0.3 0.8 0.5 1.2 0.7 1.6 0.9 2.1 1.0 2.5 1.2 3.0 1.3 3.3 Wet half-year 0.3 0.8 0.5 1.1 0.6 1.5 0.8 1.9 1.0 2.4 1.1 2.8 1.2 3.1 Dry half-year 0.4 0.8 0.5 1.1 0.7 1.5 0.9 1.9 1.1 2.3 1.3 2.7 1.4 3.1 Rainforest area Annual 0.3 0.7 0.5 1.1 0.7 1.5 0.8 1.8 1.0 2.2 1.2 2.6 1.3 2.9 Wet season 0.3 0.8 0.4 1.1 0.6 1.5 0.8 1.9 0.9 2.3 1.1 2.7 1.2 3.0 Dry season 0.4 0.7 0.5 1.0 0.7 1.4 0.9 1.8 1.1 2.2 1.2 2.6 1.3 2.9 Transitional-1 0.3 0.8 0.5 1.1 0.7 1.5 0.8 1.9 1.0 2.3 1.2 2.7 1.3 3.0 Transitional-2 0.3 0.8 0.5 1.2 0.7 1.6 0.8 2.0 1.0 2.4 1.2 2.8 1.3 3.2 Wet half-year 0.3 0.8 0.5 1.1 0.6 1.5 0.8 1.9 1.0 2.3 1.1 2.7 1.2 3.0 Dry half-year 0.4 0.7 0.5 1.1 0.7 1.4 0.9 1.8 1.1 2.2 1.2 2.6 1.4 2.9

Climate Change Projections for the Tropical Rainforest Region of North Queensland
29
Appendix A5: Projected seasonal temperature changes (°C), relative to 1990, for the WRE 450 emission scenario for the regions shown in Figure 12 for 2020 to 2080. The seasons are as follows: Wet season (January to March), Dry season (August to October), Transitional season 1 (November and December), Transitional season 2 (April to July), Wet-half year (December to May) and Dry-half year (June to November)
2020 2030 2040 2050 2060 2070 2080 Region/Year
Low High Low High Low High Low High Low High Low High Low High Entire region Annual 0.4 0.8 0.5 1.1 0.6 1.5 0.8 1.8 0.9 2.2 1.0 2.5 1.1 2.8 Wet season 0.3 0.8 0.4 1.1 0.5 1.5 0.6 1.8 0.8 2.2 0.9 2.5 0.9 2.8 Dry season 0.4 0.8 0.5 1.1 0.7 1.5 0.8 1.8 1.0 2.2 1.1 2.5 1.2 2.8 Transitional 1 0.3 0.9 0.4 1.2 0.6 1.6 0.7 2.0 0.8 2.3 1.0 2.7 1.0 3.0 Transitional-2 0.4 0.9 0.5 1.2 0.6 1.5 0.8 1.9 0.9 2.3 1.0 2.6 1.1 2.9 Wet half-year 0.3 0.8 0.4 1.1 0.6 1.5 0.7 1.8 0.8 2.2 0.9 2.5 1.0 2.8 Dry half-year 0.4 0.8 0.5 1.1 0.7 1.5 0.8 1.8 1.0 2.2 1.1 2.5 1.2 2.8 Southern sub-region Annual 0.3 0.9 0.5 1.2 0.6 1.6 0.8 2.0 0.9 2.3 1.0 2.7 1.1 3.0 Wet season 0.3 0.9 0.4 1.2 0.5 1.6 0.7 1.9 0.8 2.3 0.9 2.6 1.0 2.9 Dry season 0.4 0.9 0.5 1.3 0.7 1.6 0.9 2.0 1.0 2.4 1.2 2.8 1.3 3.1 Transitional 1 0.3 0.9 0.4 1.3 0.6 1.7 0.7 2.1 0.8 2.5 0.9 2.8 1.0 3.1 Transitional-2 0.4 0.9 0.5 1.2 0.7 1.6 0.8 2.0 1.0 2.4 1.1 2.7 1.2 3.0 Wet half-year 0.3 0.9 0.4 1.2 0.6 1.6 0.7 1.9 0.8 2.3 0.9 2.6 1.0 2.9 Dry half-year 0.4 0.9 0.5 1.2 0.7 1.6 0.9 2.0 1.0 2.4 1.1 2.7 1.2 3.0 Northern sub-region Annual 0.3 0.8 0.5 1.0 0.6 1.3 0.7 1.7 0.9 2.0 1.0 2.3 1.1 2.5 Wet season 0.3 0.8 0.4 1.1 0.5 1.4 0.6 1.7 0.7 2.0 0.8 2.3 0.9 2.6 Dry season 0.4 0.7 0.5 1.0 0.6 1.3 0.8 1.6 0.9 1.9 1.0 2.2 1.1 2.4 Transitional 1 0.3 0.8 0.5 1.1 0.6 1.4 0.7 1.7 0.9 2.0 1.0 2.3 1.1 2.6 Transitional-2 0.3 0.8 0.5 1.1 0.6 1.5 0.7 1.8 0.9 2.1 1.0 2.5 1.1 2.7 Wet half-year 0.3 0.8 0.4 1.0 0.5 1.4 0.7 1.7 0.8 2.0 0.9 2.3 1.0 2.5 Dry half-year 0.4 0.8 0.5 1.0 0.7 1.3 0.8 1.7 0.9 2.0 1.1 2.3 1.2 2.5 Rainforest area Annual 0.3 0.7 0.4 1.0 0.6 1.3 0.7 1.6 0.8 1.9 0.9 2.2 1.0 2.4 Wet season 0.3 0.7 0.4 1.0 0.5 1.3 0.6 1.6 0.8 1.9 0.9 2.2 0.9 2.5 Dry season 0.3 0.7 0.5 1.0 0.6 1.3 0.7 1.6 0.9 1.9 1.0 2.1 1.1 2.4 Transitional 1 0.3 0.7 0.4 1.0 0.6 1.3 0.7 1.6 0.8 1.9 0.9 2.2 1.0 2.4 Transitional-2 0.3 0.8 0.4 1.1 0.6 1.4 0.7 1.7 0.8 2.0 1.0 2.3 1.0 2.6 Wet half-year 0.3 0.7 0.4 1.0 0.5 1.3 0.7 1.6 0.8 1.9 0.9 2.2 1.0 2.5 Dry half-year 0.3 0.7 0.5 1.0 0.6 1.3 0.7 1.6 0.9 1.9 1.0 2.1 1.1 2.4

Suppiah et al.
30
Appendix A6: Projected seasonal rainfall changes (%), relative to 1990, for the full range of SRES emission scenarios for the regions shown in Figure 12 for 2020 to 2080. Changes below -25% and above +25% are rounded to the nearest 5%. The seasons are as follows: Wet season (January to March), Dry season (August to October), Transitional season 1 (November and December), Transitional season 2 (April to July), Wet-half year (December to May) and Dry-half year (June to November).
2020 2030 2040 2050 2060 2070 2080 Region/Year Dry Wet Dry Wet Dry Wet Dry Wet Dry Wet Dry Wet Dry Wet Entire region Annual -5 4 -7 7 -9 9 -12 12 -16 16 -20 20 -24 24 Wet season -4 5 -6 7 -8 9 -10 12 -13 16 -17 20 -20 24 Dry season -13 3 -18 4 -25 5 -35 7 -45 10 -55 12 -65 14 Transitional-1 -5 5 -7 7 -10 9 -13 12 -18 17 -22 21 -25 25 Transitional-2 -11 3 -16 5 -22 7 -30 9 -40 12 -50 15 -55 17 Wet half-year -4 5 -6 8 -9 11 -11 14 -15 19 -19 23 -23 30 Dry half-year -10 2 -14 3 -19 4 -25 5 -35 6 -45 8 -50 9 Southern sub-region Annual -7 6 -10 8 -13 11 -17 15 -23 20 -30 25 -35 30 Wet season -4 6 -5 9 -7 13 -10 17 -13 23 -16 30 -19 35 Dry season -15 2 -22 4 -30 5 -40 6 -55 9 -70 11 -80 13 Transitional-1 -6 6 -8 9 -12 12 -15 16 -20 21 -25 25 -30 31 Transitional-2 -13 2 -19 3 -25 5 -35 6 -45 8 -55 10 -65 12 Wet half-year -5 7 -8 10 -11 14 -14 18 -19 25 -23 30 -30 35 Dry half-year -10 1 -15 2 -20 3 -25 4 -35 5 -45 6 -55 8 Northern sub-region Annual -4 3 -6 4 -8 6 -10 8 -13 10 -17 13 -20 15 Wet season -3 3 -4 4 -5 5 -7 7 -9 10 -11 12 -14 14 Dry season -11 3 -16 5 -22 7 -30 9 -40 12 -50 15 -55 18 Transitional-1 -5 8 -7 12 -10 16 -13 21 -17 30 -21 35 -25 40 Transitional-2 -10 4 -15 6 -20 9 -25 11 -35 15 -45 19 -55 23 Wet half-year -3 3 -4 5 -6 7 -8 9 -11 12 -13 15 -16 18 Dry half-year -11 3 -16 4 -23 6 -30 8 -40 11 -50 13 -60 16 Rainforest area Annual -4 3 -6 5 -9 6 -11 8 -15 11 -19 14 -23 17 Wet season -4 3 -5 4 -7 6 -9 7 -13 10 -16 13 -19 15 Dry season -11 2 -16 2 -22 3 -30 4 -40 5 -50 7 -60 8 Transitional-1 -5 7 -7 10 -9 14 -12 19 -16 25 -21 30 -24 35 Transitional-2 -11 6 -16 9 -22 12 -30 16 -40 22 -50 25 -60 30 Wet half-year -4 4 -6 5 -8 7 -11 10 -15 13 -19 16 -22 20 Dry half-year -12 1 -17 2 -23 3 -31 4 -41 5 -50 6 -60 7
Climate Change Projections for the Tropical Rainforest Region of North Queensland
31
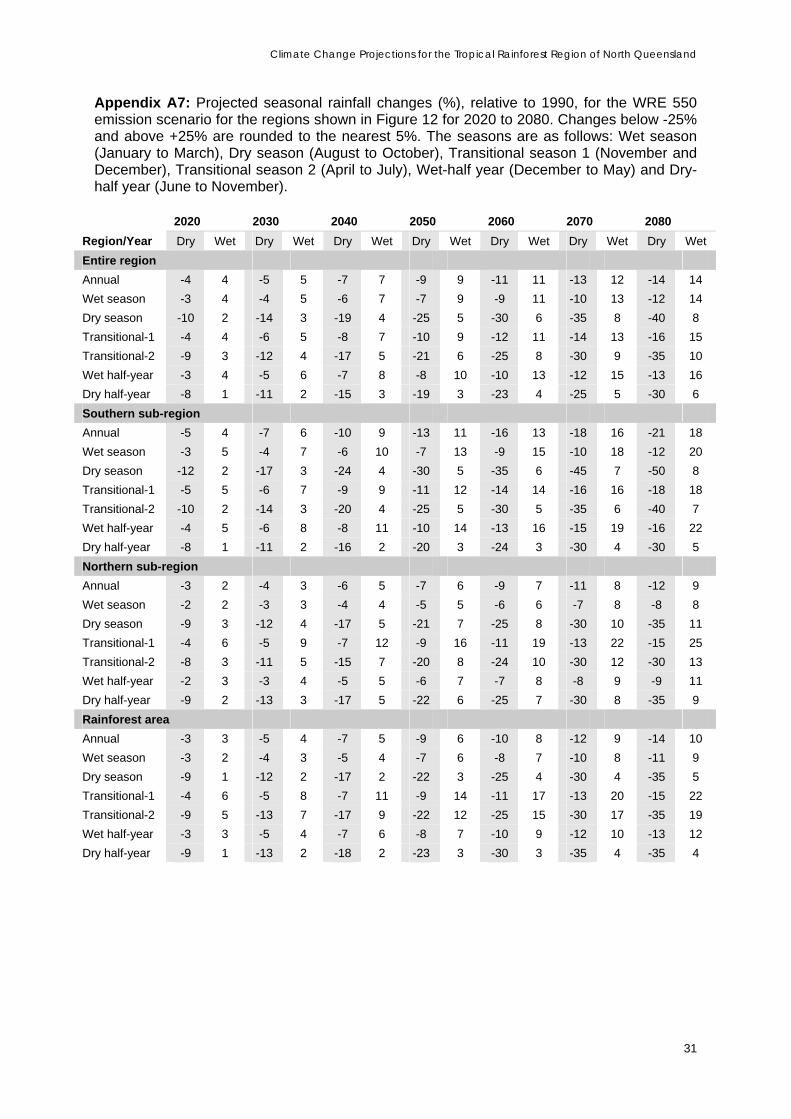
Appendix A7: Projected seasonal rainfall changes (%), relative to 1990, for the WRE 550 emission scenario for the regions shown in Figure 12 for 2020 to 2080. Changes below -25% and above +25% are rounded to the nearest 5%. The seasons are as follows: Wet season (January to March), Dry season (August to October), Transitional season 1 (November and December), Transitional season 2 (April to July), Wet-half year (December to May) and Dry-half year (June to November).
2020 2030 2040 2050 2060 2070 2080 Region/Year Dry Wet Dry Wet Dry Wet Dry Wet Dry Wet Dry Wet Dry Wet Entire region Annual -4 4 -5 5 -7 7 -9 9 -11 11 -13 12 -14 14 Wet season -3 4 -4 5 -6 7 -7 9 -9 11 -10 13 -12 14 Dry season -10 2 -14 3 -19 4 -25 5 -30 6 -35 8 -40 8 Transitional-1 -4 4 -6 5 -8 7 -10 9 -12 11 -14 13 -16 15 Transitional-2 -9 3 -12 4 -17 5 -21 6 -25 8 -30 9 -35 10 Wet half-year -3 4 -5 6 -7 8 -8 10 -10 13 -12 15 -13 16 Dry half-year -8 1 -11 2 -15 3 -19 3 -23 4 -25 5 -30 6 Southern sub-region Annual -5 4 -7 6 -10 9 -13 11 -16 13 -18 16 -21 18 Wet season -3 5 -4 7 -6 10 -7 13 -9 15 -10 18 -12 20 Dry season -12 2 -17 3 -24 4 -30 5 -35 6 -45 7 -50 8 Transitional-1 -5 5 -6 7 -9 9 -11 12 -14 14 -16 16 -18 18 Transitional-2 -10 2 -14 3 -20 4 -25 5 -30 5 -35 6 -40 7 Wet half-year -4 5 -6 8 -8 11 -10 14 -13 16 -15 19 -16 22 Dry half-year -8 1 -11 2 -16 2 -20 3 -24 3 -30 4 -30 5 Northern sub-region Annual -3 2 -4 3 -6 5 -7 6 -9 7 -11 8 -12 9 Wet season -2 2 -3 3 -4 4 -5 5 -6 6 -7 8 -8 8 Dry season -9 3 -12 4 -17 5 -21 7 -25 8 -30 10 -35 11 Transitional-1 -4 6 -5 9 -7 12 -9 16 -11 19 -13 22 -15 25 Transitional-2 -8 3 -11 5 -15 7 -20 8 -24 10 -30 12 -30 13 Wet half-year -2 3 -3 4 -5 5 -6 7 -7 8 -8 9 -9 11 Dry half-year -9 2 -13 3 -17 5 -22 6 -25 7 -30 8 -35 9 Rainforest area Annual -3 3 -5 4 -7 5 -9 6 -10 8 -12 9 -14 10 Wet season -3 2 -4 3 -5 4 -7 6 -8 7 -10 8 -11 9 Dry season -9 1 -12 2 -17 2 -22 3 -25 4 -30 4 -35 5 Transitional-1 -4 6 -5 8 -7 11 -9 14 -11 17 -13 20 -15 22 Transitional-2 -9 5 -13 7 -17 9 -22 12 -25 15 -30 17 -35 19 Wet half-year -3 3 -5 4 -7 6 -8 7 -10 9 -12 10 -13 12 Dry half-year -9 1 -13 2 -18 2 -23 3 -30 3 -35 4 -35 4
Suppiah et al.
32
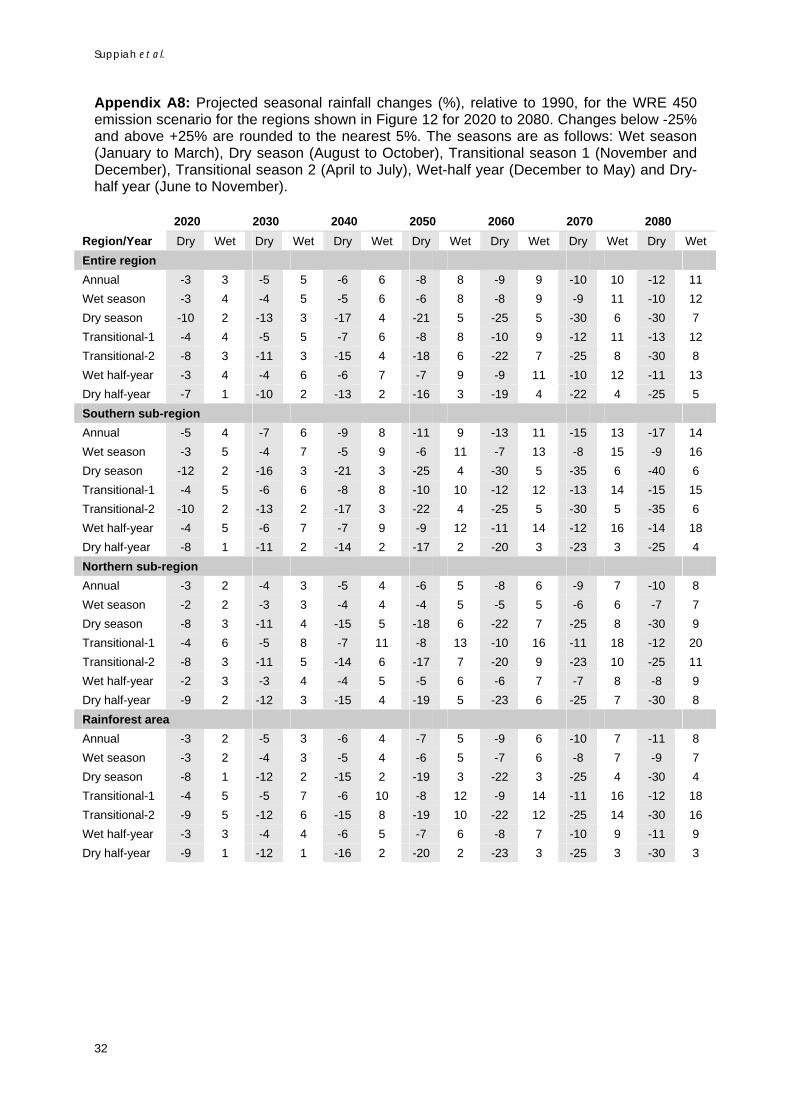
Appendix A8: Projected seasonal rainfall changes (%), relative to 1990, for the WRE 450 emission scenario for the regions shown in Figure 12 for 2020 to 2080. Changes below -25% and above +25% are rounded to the nearest 5%. The seasons are as follows: Wet season (January to March), Dry season (August to October), Transitional season 1 (November and December), Transitional season 2 (April to July), Wet-half year (December to May) and Dry-half year (June to November).
2020 2030 2040 2050 2060 2070 2080 Region/Year Dry Wet Dry Wet Dry Wet Dry Wet Dry Wet Dry Wet Dry Wet Entire region Annual -3 3 -5 5 -6 6 -8 8 -9 9 -10 10 -12 11 Wet season -3 4 -4 5 -5 6 -6 8 -8 9 -9 11 -10 12 Dry season -10 2 -13 3 -17 4 -21 5 -25 5 -30 6 -30 7 Transitional-1 -4 4 -5 5 -7 6 -8 8 -10 9 -12 11 -13 12 Transitional-2 -8 3 -11 3 -15 4 -18 6 -22 7 -25 8 -30 8 Wet half-year -3 4 -4 6 -6 7 -7 9 -9 11 -10 12 -11 13 Dry half-year -7 1 -10 2 -13 2 -16 3 -19 4 -22 4 -25 5 Southern sub-region Annual -5 4 -7 6 -9 8 -11 9 -13 11 -15 13 -17 14 Wet season -3 5 -4 7 -5 9 -6 11 -7 13 -8 15 -9 16 Dry season -12 2 -16 3 -21 3 -25 4 -30 5 -35 6 -40 6 Transitional-1 -4 5 -6 6 -8 8 -10 10 -12 12 -13 14 -15 15 Transitional-2 -10 2 -13 2 -17 3 -22 4 -25 5 -30 5 -35 6 Wet half-year -4 5 -6 7 -7 9 -9 12 -11 14 -12 16 -14 18 Dry half-year -8 1 -11 2 -14 2 -17 2 -20 3 -23 3 -25 4 Northern sub-region Annual -3 2 -4 3 -5 4 -6 5 -8 6 -9 7 -10 8 Wet season -2 2 -3 3 -4 4 -4 5 -5 5 -6 6 -7 7 Dry season -8 3 -11 4 -15 5 -18 6 -22 7 -25 8 -30 9 Transitional-1 -4 6 -5 8 -7 11 -8 13 -10 16 -11 18 -12 20 Transitional-2 -8 3 -11 5 -14 6 -17 7 -20 9 -23 10 -25 11 Wet half-year -2 3 -3 4 -4 5 -5 6 -6 7 -7 8 -8 9 Dry half-year -9 2 -12 3 -15 4 -19 5 -23 6 -25 7 -30 8 Rainforest area Annual -3 2 -5 3 -6 4 -7 5 -9 6 -10 7 -11 8 Wet season -3 2 -4 3 -5 4 -6 5 -7 6 -8 7 -9 7 Dry season -8 1 -12 2 -15 2 -19 3 -22 3 -25 4 -30 4 Transitional-1 -4 5 -5 7 -6 10 -8 12 -9 14 -11 16 -12 18 Transitional-2 -9 5 -12 6 -15 8 -19 10 -22 12 -25 14 -30 16 Wet half-year -3 3 -4 4 -6 5 -7 6 -8 7 -10 9 -11 9 Dry half-year -9 1 -12 1 -16 2 -20 2 -23 3 -25 3 -30 3