Climate Change Performance Index 2017 G20 Edition · PDF fileClimate Change Performance Index...
20
Climate Change Performance Index 2017 Jan Burck, Franziska Marten, Christoph Bals, Thea Uhlich, Niklas Höhne, Sofia Gonzales, Mia Moisio G20 Edition
Transcript of Climate Change Performance Index 2017 G20 Edition · PDF fileClimate Change Performance Index...
Climate Change Performance Index 2017
Jan Burck, Franziska Marten, Christoph Bals, Thea Uhlich, Niklas Höhne, Sofia Gonzales, Mia Moisio
G20 Edition
Germanwatch, NewClimate Institute & Climate Action Network
2 © Copyright Germanwatch
ImprintGermanwatch – Bonn Office
Kaiserstr. 20153113 Bonn, Germany
Ph.: +49 (0) 228 - 60492-0Fax: +49 (0) 228 - 60492-19
Germanwatch – Berlin Office Stresemannstr. 72
10963 Berlin, GermanyPh.: +49 (0) 30 - 28 88 356-0Fax: +49 (0) 30 - 28 88 356-1
E-mail: [email protected]
CANClimate Action Network-International
Rmayl, Nahr Street, Jaara Building, 4th floorP.O.Box: 14-5472, Beirut, Lebanon
Phone: +961.1.447192
NewClimate InstituteCologne Office
Am Hof 20-26 50667 Cologne, Germany
Berlin OfficeBrunnenstr 195
10119 Berlin, Germany
Authors Jan Burck, Franziska Marten, Christoph Bals, Thea Uhlich,
Niklas Höhne (NewClimate Institute)Sofia Gonzales, Mia Moisio
With the support ofPieter van Breenvoort, Mona Freundt
and Keno Riechers Editing
Lindsay MunroMaps
Thea Uhlich Design
cap communications, Bonn
July 2017Purchase Order Number: 17-2-06e
ISBN 978-3-943704-55-6 This publication can be downloaded at:
www.germanwatch.org/en/ccpi
With financial support from the Barthel Foundation and Stiftung Mercator
Contents1. Key Developments CCPI G20 Edition 3
2. Key Country Results 4
3. Overall Results - Worldmap CCPI 2017 G20 Edition 8 3.1 Partial Results - GHG Emissions 10 3.2 Partial Results - Renewable Energy 12 3.3 Partial Results - Energy Use 14 3.4 Partial Results - Climate Policy 16
4. Components of the CCPI 17
5. Sources and Further Reading Recommendations 19
CCPI 2017 – G20 Edition
© Copyright Germanwatch 3
1. Key Developments CCPI G20 Edition
Emitting about 75% of global greenhouse gas (GHG) emissions and 82% of global energy-relat-ed CO2 emissions (2014), the G20 as the 20 biggest economies have a particularly high responsibility in leading the world towards success in limiting global warming to well below 2°C, if not 1.5°C, as agreed to in the Paris Agreement in 2015. With its new meth-odology, the Climate Change Performance Index (CCPI) is now suited to measure the progress of countries towards contributing to the climate goals agreed to in Paris. The global response to Donald Trump’s plans to pull the USA out of the Paris Agree-ment was encouraging and strengthened hope that new competitive technologies as well as knowledge about the dangerous effects of the rise in global temperature are the basis for the global community to implement the Pairs treaty. Even domestically, the President’s decision was countered by a strong coalition of states, towns and businesses who an-nounced measures to fulfil the US pledge under the Paris Agreement. They expect the new policy of the US federal government to fail, being convinced that climate protection could be perfectly aligned with economic development and renewables would al-ready be the better business model.
This assumption is underlined by the data, which shows massively growing investments in renew-ables, leading to double-digit growth rates for renewables already for some years already. In 2016, renewables exceeded fossil fuels not only in investments but for the first time also in newly in-stalled capacity; renewable technology has already reached market parity.
At the same time, the Trump administration seems isolated in its attempt to revive its coal industry. Other countries have turned their back on coal, some in an attempt to fight bad air quality in their cities, others driven by economic factors. The new Korean (Rep.) president announced the closure of coal-fired power plants, China has reversed plans for new coal plants to be built, India is re-evaluat-ing plans for the expansion of coal and, some Eu-ropean countries acknowledged the need to phase out coal completely in the medium term.
While recognizing the significance of this develop-ment, it is important to also note that data as well show very few countries - especially in the G20 - on a pathway to well below 2°C, neither in their current performance nor in their targets for 2030. Countries have to prove they are willing to follow through with implementing the necessary policies to reach national mitigation targets and raise ambition in adapting their targets to what would be compati-ble with well below 2°C.
Contents
Germanwatch, NewClimate Institute & Climate Action Network
4 © Copyright Germanwatch
2. Key Country Results
Italy (1st)
Brazil (2nd)
France (3rd)
Germany (4th)
UK (5th)
Italy scores first in this year’s ranking. Over the last five years, its emissions per capita have shown posi-tive developments, reducing the still existing gap to a pathway that is compatible with well below 2°C. Additionally, there has been a high trend in the up-take of renewables, +53% between 2010 and 2014, with Italy showing the closest alignment to the share of renewables needed to be in line with a pathway
well below 2°C in the G20. It is also the highest scor-ing country in terms of its renewable energy target, although it is still not suff icient for the well-below-2°C limit. These positive trends could be dampened by the relatively low ambition in relation to national climate policies, lacking proactivity in achieving progress on its NDC.
The scores of the countries ranking first and sec-ond are close together. Brazil ranks second. Due to its large hydro capacities, the country’s renewable energy share in the energy mix was 38% in 2014 and is the highest in the G20. Yet there has been a slight decrease in the share of renewables over the last five years and, despite its current high level of renewables, the country’s 2030 target is only rat-ed medium. National experts demand that Brazil’s
national climate policies send out a clearer signal concerning the phase-out of fossil fuel subsidies and that they increase targets for reducing GHG emis-sions and for renewable energy to align those to a well-below-2°C pathway. The government recently agreed to heavy budget cuts for the environmental ministry, endangering the country’s progress in de-creasing emissions from deforestation.
Shortly behind Brazil, France scores well due to its relatively good development and its level of GHG emissions per capita. France still needs to signifi-cantly improve its share of renewables - recent announcements by the government point in this direction - and must reduce the energy use per
capita. France’s international climate policies show leadership, while national policies have remained moderate so far. To align France closer with its 2°C pathway, the new administration needs to keep its campaign promises and increase the level of ambi-tion nationally.
Germany scores only very marginally behind France. Germany’s renewable growth rates and its alignment to a well-below-2°C pathway within this category are rated as high. However, as the world’s biggest user of lignite, Germany still has relatively high GHG emissions as well as an energy use per capita higher than the EU average, showing little improvement over the last years. Its 2030 targets
across the indicators are rated medium. Germany has taken on an increasingly vocal role within the international climate negotiations and its national climate plan (2015) shows sector-specific emissions reduction targets, yet some of these could be more ambitious. Its dependence on coal remains a major decelerator to achieving alignment with the well-below-2°C emissions pathway.
With a very high performance especially in the GHG emissions category, e.g. with the third highest rat-ed emissions reduction target, the United Kingdom holds the 5th rank in the CCPI. From national ex-perts, the UK receives only low ratings for current policies, both domestically and regarding its perfor-mance in international climate diplomacy. NationalExperts warn, like some other European countries, the UK¹s relatively high score would stems from a lag eff ect: with the exception of a bold promise to phase out coal power, for which the UK deserves credit, policy from 5-10 years ago is responsible for
low carbon investment and the UK¹s falling emis-sions. Experts agree that future carbon reductions are at real risk: the government has failed to deliv-er a policy framework for renewables from 2017 onwards, and as a consequence the UK¹s Treasury expects renewables investment to fall by 96% by 2020. The continuation of several other important policies, including the carbon floor price and zero carbon homes, also seems to be at risk. Without sig-nificant change in policy in the next years, experts would expect the UK to drop in the CCPI.
CCPI 2017 – G20 Edition
© Copyright Germanwatch 5
India (6th)
EU (7th)
Mexico (8th)
South Africa (9th)
Being evaluated by the CCPI for the first time, the European Union find itself ranked sixth place, scoring slightly lower than India. The Union of 28 states accounts for 8% of global GHG emissions. Compared to most G20 states, the EU has a rela-tively high share of renewables (11%) and its GHG emissions and energy use per capita show im-provements over the last five years. Nevertheless, there remains an urgent need to increase ambition related to its targets for 2030 across all categories.
Experts for European climate policy warn the diver-sity that exists in the level of ambition for climate protection between the different member states and the lack of compliance mechanisms might be leading to a loss in climate leadership for the EU as a whole. The Union’s clear condemnation of Donald Trump’s announcement of a US withdrawal from the Paris Agreement on the other hand, was widely appreciated among the experts.
Regarding the current levels of both GHG emissions and energy use measured per capita, Mexico is still performing very well compared to the other G20 countries. Its emissions reduction targets are rel-atively ambitious and rank fifth highest. The share of renewables in total primary energy supply on the other hand, is relatively low, as is the respec-tive 2030 target. National experts expect efforts to
expand renewable energy capacities to increase in the near future, since Mexico’s new climate strategy focuses on renewables deployment and a reduction of emissions from fossil fuels. While experts value the strategy as a major step forward, at the same time they criticize that it would be lacking a suffi-cient alignment to the well-below-2°C limit.
According to national experts, South Africa shows strong commitment to climate protection, which is reflected in its very high scoring performance in international climate diplomacy. The country’s na-tional policies are nevertheless slightly behind oth-ers and lack implementation, they added. Current levels of and past trends in emissions per capita, as
well as energy use per capita, rank in the mid-field of the G20 tableau and show a gap between the situa-tion as it is and what would be necessary for a well-below-2°C pathway. To climb up the ranking, South Africa would need to expand renewable energy and to increase ambition in its 2030 targets and imple-mentation for all three index categories.
India, the number six in the CCPI G20 edition, leads the tableau among countries with medium perfor-mance. While India’s GHG emissions and energy use are increasing, its current levels are the lowest among the G20 countries, showing compatibility with the 2°C pathway and good 2030 emission re-duction targets. Its share of renewables in the en-
ergy mix was 9% in 2014. With one of the world’s largest renewables programs and its recent shift in coal policies, India scores very high within the na-tional policy evaluation. Its recent role in the inter-national climate negotiations has also found wide acknowledgment. It still accounts for 7% of global emissions.
Germanwatch, NewClimate Institute & Climate Action Network
6 © Copyright Germanwatch
Indonesia (10th)
Argentina (11th)
China (12th)
Turkey (13th)
Canada (14th)
Turkey’s overall climate policy performance is ranked lowest in the G20. The government, which has applied to host the UN climate summit in 2019, has not yet ratified the Paris Agreement and, accord-ing to national experts, has approved several new coal power plant projects. Due to its still relatively low emissions level, Turkey performs relatively high in the well-below-2°C compatibility of current lev-els, however the lack of ambition in the country’s
policy framework is reflected in its low performanc-es regarding trends in GHG emissions and energy use per capita. A growth in renewable energy over the last years though, has led Turkey to a compa-rably very high performance in the respective cat-egory. Nevertheless, country experts demand that Turkey must raise it ambition in adapting mitigation and renewable energy targets to the well-below-2°C temperature limit.
Canada’s 2030 GHG emissions targets are low, which means significantly higher ambition is needed to re-duce its per-capita emissions to a well-below-2°C compatible pathway. Its current share of renew-ables per primary energy is 17% with large hydro ca-pacities and has shown a positive trend over the last years. Despite positive developments throughout the last five years, the country’s current energy use
per capita is the highest in the G20. Under the cur-rent administration, Canada’s role in international climate diplomacy has improved significantly and national policies are expected to be strengthened accordingly. However, sector-specific decarbonisa-tion strategies in particular are still lacking, national experts criticize.
Being the world’s largest emitter of GHG emissions, and with by now relatively high per capita emis-sions as well, China nonetheless scores best among the group of low performing countries. Ambitious national climate policies and robust implementa-tion indicate major improvements for the country towards becoming a leader in renewable energy and reaching a peak in GHG emissions earlier than expected and recorded in its NDC. Its current share
of renewables within the energy mix is relatively low, yet the increase is remarkable and in absolute terms China has installed by far the highest amount of renewables in the G20 over the last years. Since China’s reaction to the Trump administration pull-ing the USA out of the Paris Agreement, national ex-perts have observed that China is taking on a lead-ing role in international climate diplomacy.
Indonesia ranks lowest in the group of moderately performing countries. Compared to the other G20 states, Indonesia has a relatively high share of re-newables with its large amounts of hydro power, and yet lacks ambition in aligning its 2030 targets for renewable energy and energy use to a well-below-2°C compatible pathway. Although the country per-forms second highest in the G20 regarding the GHG mitigation target it has put forward, a gap towards
its well-below -2°C pathway still remains. Experts’ anticipation of increasing engagement on sides of the Indonesian government, especially in the con-text of international climate diplomacy, leads to a medium performance in this regard. However, a rise in the national and aggregated policy ranking would require serious steps to limit deforestation, which has proven difficult in the past, as national experts claim.
Argentina, which will assume next year’s G20 pres-idency, ranks among the medium performers in three of the indicators defining the GHG emissions category, namely recent developments, current level, and the well-below-2°C compatibility of its current emissions level. The well-below-2°C com-patibility of both renewable energy and energy use leave room for improvement, as do the country’s targets for 2030. Although Argentina is one of a few
countries that already revised its Nationally Deter-mined Contribution (NDC), its targets are still rated as relatively low. According to national experts, the country’s national climate policy lacks sector-spe-cific targets, thus dampening expectations for fur-ther alignment with the well-below-2°C threshold. However, its role in international climate diplomacy has improved to a relatively good performance.
CCPI 2017 – G20 Edition
© Copyright Germanwatch 7
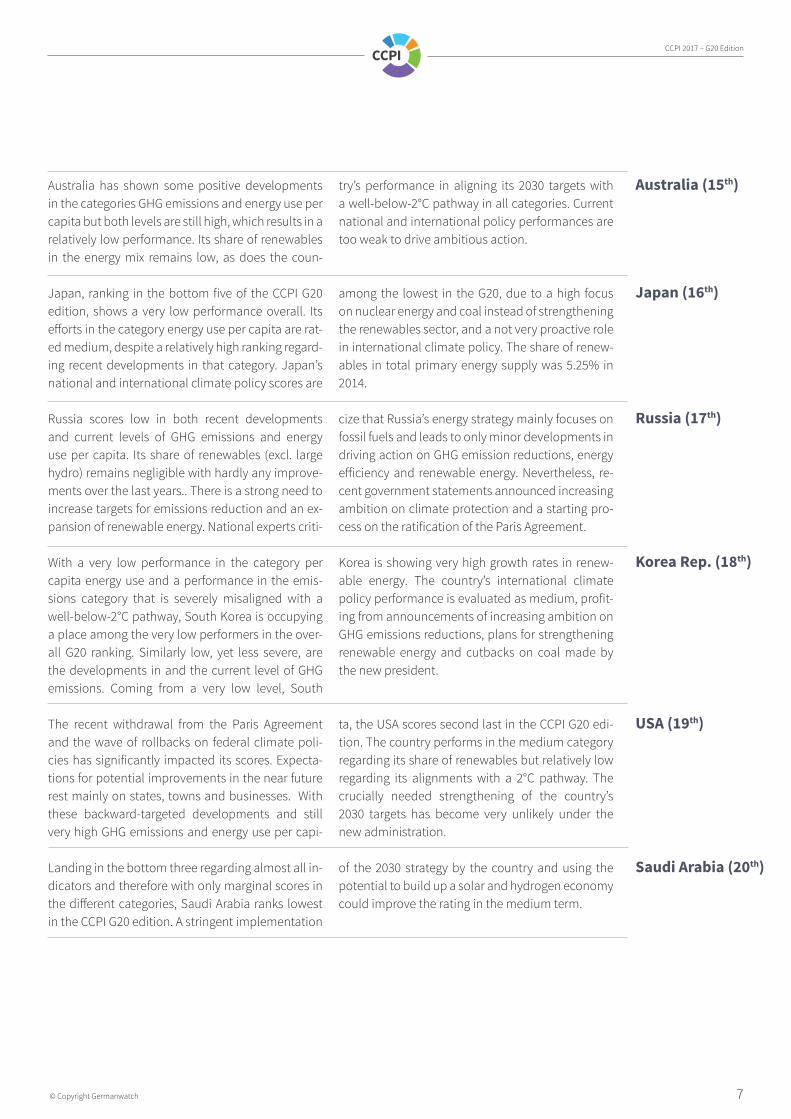
Australia has shown some positive developments in the categories GHG emissions and energy use per capita but both levels are still high, which results in a relatively low performance. Its share of renewables in the energy mix remains low, as does the coun-
try’s performance in aligning its 2030 targets with a well-below-2°C pathway in all categories. Current national and international policy performances are too weak to drive ambitious action.
Japan, ranking in the bottom five of the CCPI G20 edition, shows a very low performance overall. Its efforts in the category energy use per capita are rat-ed medium, despite a relatively high ranking regard-ing recent developments in that category. Japan’s national and international climate policy scores are
among the lowest in the G20, due to a high focus on nuclear energy and coal instead of strengthening the renewables sector, and a not very proactive role in international climate policy. The share of renew-ables in total primary energy supply was 5.25% in 2014.
With a very low performance in the category per capita energy use and a performance in the emis-sions category that is severely misaligned with a well-below-2°C pathway, South Korea is occupying a place among the very low performers in the over-all G20 ranking. Similarly low, yet less severe, are the developments in and the current level of GHG emissions. Coming from a very low level, South
Korea is showing very high growth rates in renew-able energy. The country’s international climate policy performance is evaluated as medium, profit-ing from announcements of increasing ambition on GHG emissions reductions, plans for strengthening renewable energy and cutbacks on coal made by the new president.
The recent withdrawal from the Paris Agreement and the wave of rollbacks on federal climate poli-cies has significantly impacted its scores. Expecta-tions for potential improvements in the near future rest mainly on states, towns and businesses. With these backward-targeted developments and still very high GHG emissions and energy use per capi-
ta, the USA scores second last in the CCPI G20 edi-tion. The country performs in the medium category regarding its share of renewables but relatively low regarding its alignments with a 2°C pathway. The crucially needed strengthening of the country’s 2030 targets has become very unlikely under the new administration.
Australia (15th)
Japan (16th)
Russia (17th)
Korea Rep. (18th)
USA (19th)
Saudi Arabia (20th)Landing in the bottom three regarding almost all in-dicators and therefore with only marginal scores in the different categories, Saudi Arabia ranks lowest in the CCPI G20 edition. A stringent implementation
of the 2030 strategy by the country and using the potential to build up a solar and hydrogen economy could improve the rating in the medium term.
Russia scores low in both recent developments and current levels of GHG emissions and energy use per capita. Its share of renewables (excl. large hydro) remains negligible with hardly any improve-ments over the last years.. There is a strong need to increase targets for emissions reduction and an ex-pansion of renewable energy. National experts criti-
cize that Russia’s energy strategy mainly focuses on fossil fuels and leads to only minor developments in driving action on GHG emission reductions, energy efficiency and renewable energy. Nevertheless, re-cent government statements announced increasing ambition on climate protection and a starting pro-cess on the ratification of the Paris Agreement.
Germanwatch, NewClimate Institute & Climate Action Network
8 © Copyright Germanwatch
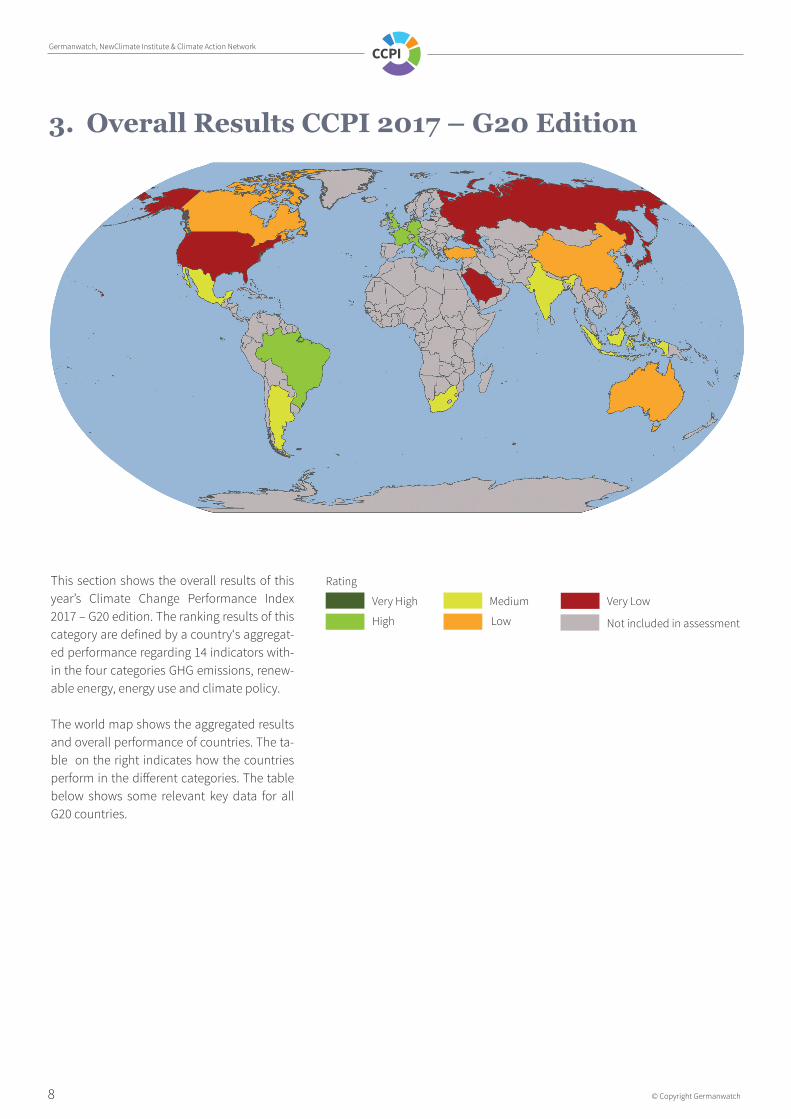
Rating
Very High
High
Medium
Low
Very Low
Not included in assessment
3. Overall Results CCPI 2017 – G20 Edition
This section shows the overall results of this year’s Climate Change Performance Index 2017 – G20 edition. The ranking results of this category are defined by a country‘s aggregat-ed performance regarding 14 indicators with-in the four categories GHG emissions, renew-able energy, energy use and climate policy.
The world map shows the aggregated results and overall performance of countries. The ta-ble on the right indicates how the countries perform in the diff erent categories. The table below shows some relevant key data for all G20 countries.
CCPI 2017 – G20 Edition
© Copyright Germanwatch 9
The CCPI 2017 results illustrate the main regional differ-ences in climate protection and performance within the 58 evaluated countries around the world. Despite decreas-ing growth rates in CO2 emissions, still no country per-formed well enough to reach the category “very good” in this year’s index.
For the first time in five years, Denmark is not leading the list but had to concede the top position to France, closely followed by Sweden and the United Kingdom. Though Denmark dropped down to rank 13, it still remains in the “good performance” group. Croatia and Portugal are the only countries to accomplish the leap from the “moder-ate” into the “good performance” group; Croatia climbing up 11 places to rank 17 and Portugal gaining 7 places up to rank 11. Compared to last year’s result, Hungary has deteriorated most drastically by dropping 17 places from rank 17 to 34. Most of the “very poor performing” countries failed to improve their scores and remained there. Like the year before Saudi Arabia, Japan, Kazakhstan, Korea and Australia form the bottom five of this category.
Very good
Good
Moderate
Poor
Very poor
Not included in assessment
Performance
4.1 CCPI World Map 2017
© G
erm
anw
atch
201
6
© G
erm
anw
atch
201
6
14 15
CCPI•Results2017 CCPI•Results2017GERMANWATCH & CAN GERMANWATCH & CANCCPI CCPI
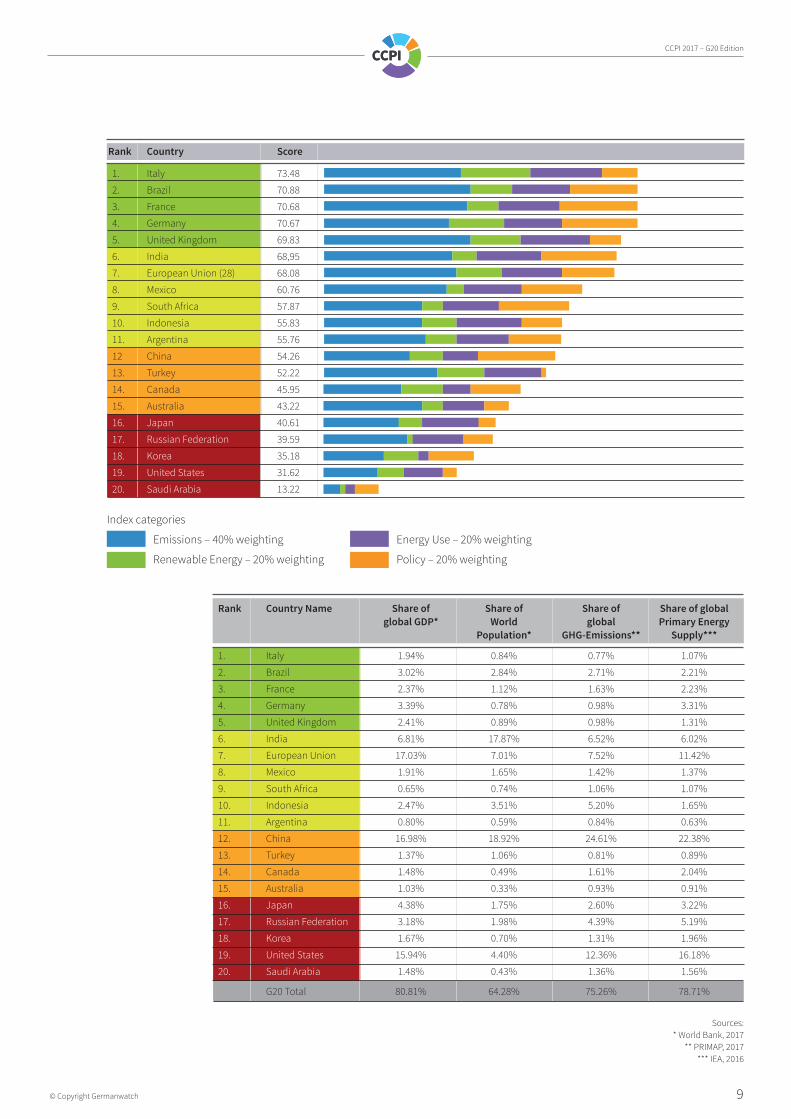
Sources:* World Bank, 2017
** PRIMAP, 2017*** IEA, 2016
Index categories
Emissions – 40% weighting
Renewable Energy – 20% weighting
Energy Use – 20% weighting
Policy – 20% weighting
Rank Country Score
1. Italy 73.48
2. Brazil 70.88
3. France 70.68
4. Germany 70.67
5. United Kingdom 69.83
6. India 68,95
7. European Union (28) 68.08
8. Mexico 60.76
9. South Africa 57.87
10. Indonesia 55.83
11. Argentina 55.76
12 China 54.26
13. Turkey 52.22
14. Canada 45.95
15. Australia 43.22
16. Japan 40.61
17. Russian Federation 39.59
18. Korea 35.18
19. United States 31.62
20. Saudi Arabia 13.22
Rank Country Name Share of Share of Share of Share of global global GDP* World global Primary Energy Population* GHG-Emissions** Supply***
1. Italy 1.94% 0.84% 0.77% 1.07%
2. Brazil 3.02% 2.84% 2.71% 2.21%
3. France 2.37% 1.12% 1.63% 2.23%
4. Germany 3.39% 0.78% 0.98% 3.31%
5. United Kingdom 2.41% 0.89% 0.98% 1.31%
6. India 6.81% 17.87% 6.52% 6.02%
7. European Union 17.03% 7.01% 7.52% 11.42%
8. Mexico 1.91% 1.65% 1.42% 1.37%
9. South Africa 0.65% 0.74% 1.06% 1.07%
10. Indonesia 2.47% 3.51% 5.20% 1.65%
11. Argentina 0.80% 0.59% 0.84% 0.63%
12. China 16.98% 18.92% 24.61% 22.38%
13. Turkey 1.37% 1.06% 0.81% 0.89%
14. Canada 1.48% 0.49% 1.61% 2.04%
15. Australia 1.03% 0.33% 0.93% 0.91%
16. Japan 4.38% 1.75% 2.60% 3.22%
17. Russian Federation 3.18% 1.98% 4.39% 5.19%
18. Korea 1.67% 0.70% 1.31% 1.96%
19. United States 15.94% 4.40% 12.36% 16.18%
20. Saudi Arabia 1.48% 0.43% 1.36% 1.56%
G20 Total 80.81% 64.28% 75.26% 78.71%
Germanwatch, NewClimate Institute & Climate Action Network
10 © Copyright Germanwatch
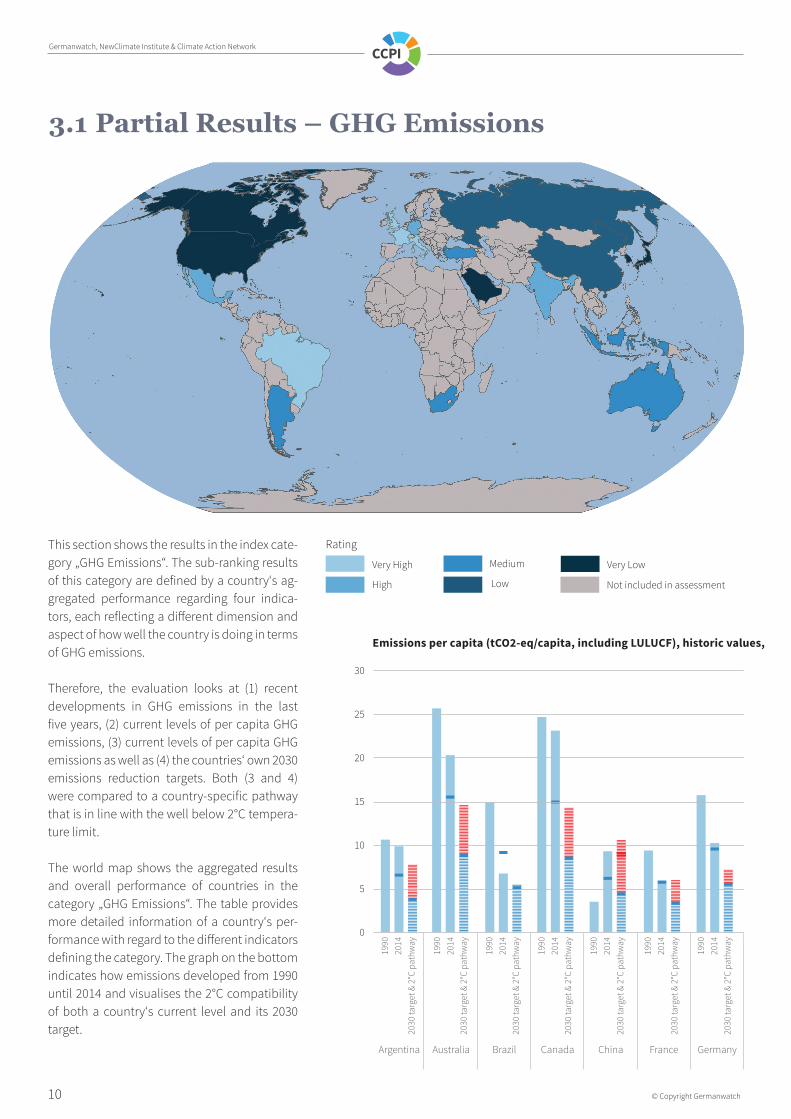
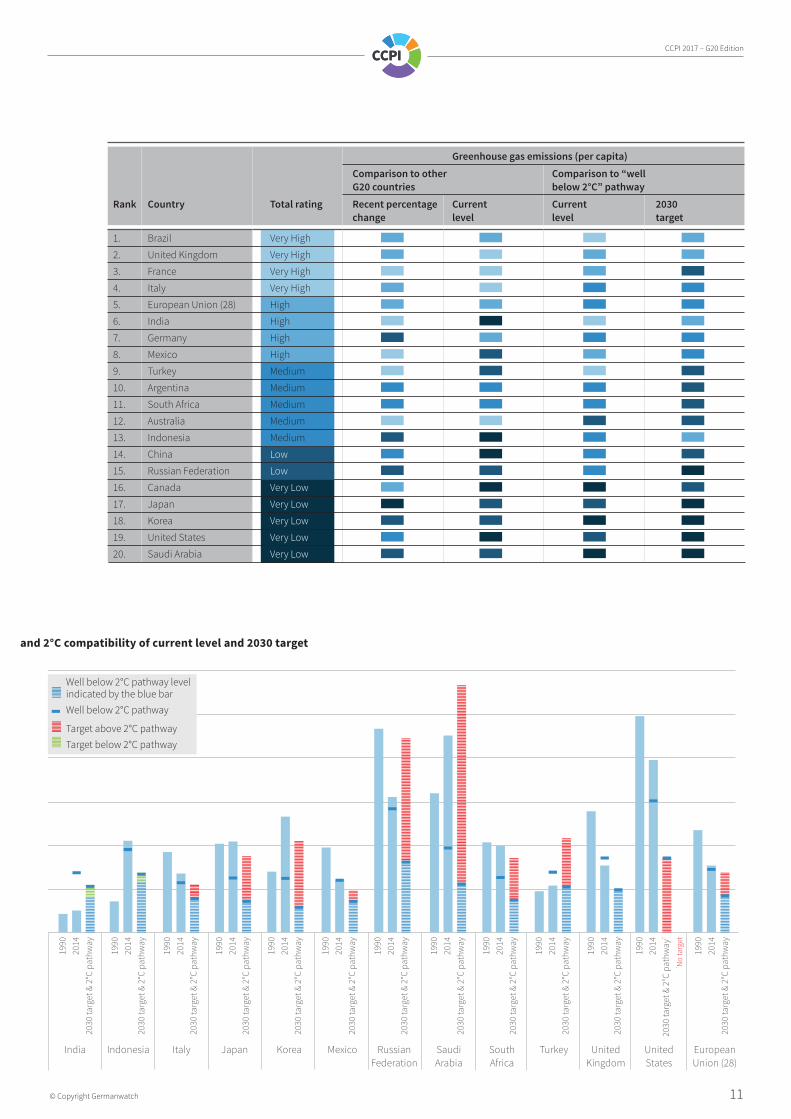
Emissions per capita (tCO2-eq/capita, including LULUCF), historic values, and 2°C compatibility of current level and 2030 target
3.1 Partial Results – GHG Emissions
This section shows the results in the index cate-gory „GHG Emissions“. The sub-ranking results of this category are defined by a country‘s ag-gregated performance regarding four indica-tors, each reflecting a diff erent dimension and aspect of how well the country is doing in terms of GHG emissions.
Therefore, the evaluation looks at (1) recent developments in GHG emissions in the last five years, (2) current levels of per capita GHG emissions, (3) current levels of per capita GHG emissions as well as (4) the countries‘ own 2030 emissions reduction targets. Both (3 and 4) were compared to a country-specific pathway that is in line with the well below 2°C tempera-ture limit. The world map shows the aggregated results and overall performance of countries in the category „GHG Emissions“. The table provides more detailed information of a country‘s per-formance with regard to the diff erent indicators defining the category. The graph on the bottom indicates how emissions developed from 1990 until 2014 and visualises the 2°C compatibility of both a country‘s current level and its 2030 target.
Rating
Very High
High
Medium
Low
Very Low
Not included in assessment
30
25
20
15
10
5
0
Argentina Australia Brazil Canada China France Germany
1990
2014
2030
targ
et &
2°C
pat
hway
1990
2014
2030
targ
et &
2°C
pat
hway
1990
2014
2030
targ
et &
2°C
pat
hway
1990
2014
2030
targ
et &
2°C
pat
hway
1990
2014
2030
targ
et &
2°C
pat
hway
1990
2014
2030
targ
et &
2°C
pat
hway
1990
2014
2030
targ
et &
2°C
pat
hway
CCPI 2017 – G20 Edition
© Copyright Germanwatch 11
The CCPI 2017 results illustrate the main regional differ-ences in climate protection and performance within the 58 evaluated countries around the world. Despite decreas-ing growth rates in CO2 emissions, still no country per-formed well enough to reach the category “very good” in this year’s index.
For the first time in five years, Denmark is not leading the list but had to concede the top position to France, closely followed by Sweden and the United Kingdom. Though Denmark dropped down to rank 13, it still remains in the “good performance” group. Croatia and Portugal are the only countries to accomplish the leap from the “moder-ate” into the “good performance” group; Croatia climbing up 11 places to rank 17 and Portugal gaining 7 places up to rank 11. Compared to last year’s result, Hungary has deteriorated most drastically by dropping 17 places from rank 17 to 34. Most of the “very poor performing” countries failed to improve their scores and remained there. Like the year before Saudi Arabia, Japan, Kazakhstan, Korea and Australia form the bottom five of this category.
Very good
Good
Moderate
Poor
Very poor
Not included in assessment
Performance
4.1 CCPI World Map 2017
© G
erm
anw
atch
201
6
© G
erm
anw
atch
201
6
14 15
CCPI•Results2017 CCPI•Results2017GERMANWATCH & CAN GERMANWATCH & CANCCPI CCPI
Greenhouse gas emissions (per capita) Comparison to other Comparison to “well G20 countries below 2°C” pathway Rank Country Total rating Recent percentage Current Current 2030 change level level target
1. Brazil Very High 2. United Kingdom Very High
3. France Very High
4. Italy Very High
5. European Union (28) High
6. India High
7. Germany High
8. Mexico High
9. Turkey Medium
10. Argentina Medium
11. South Africa Medium
12. Australia Medium
13. Indonesia Medium
14. China Low
15. Russian Federation Low
16. Canada Very Low
17. Japan Very Low
18. Korea Very Low
19. United States Very Low
20. Saudi Arabia Very Low
Emissions per capita (tCO2-eq/capita, including LULUCF), historic values, and 2°C compatibility of current level and 2030 target
Argentina Australia Brazil Canada China France Germany India Indonesia Italy Japan Korea Mexico Russian Saudi South Turkey United United European Federation Arabia Africa Kingdom States Union (28)
1990
2014
2030
targ
et &
2°C
pat
hway
1990
2014
2030
targ
et &
2°C
pat
hway
1990
2014
2030
targ
et &
2°C
pat
hway
1990
2014
2030
targ
et &
2°C
pat
hway
1990
2014
2030
targ
et &
2°C
pat
hway
1990
2014
2030
targ
et &
2°C
pat
hway
1990
2014
2030
targ
et &
2°C
pat
hway
1990
2014
2030
targ
et &
2°C
pat
hway
1990
2014
2030
targ
et &
2°C
pat
hway
1990
2014
2030
targ
et &
2°C
pat
hway
1990
2014
2030
targ
et &
2°C
pat
hway
1990
2014
2030
targ
et &
2°C
pat
hway
*
* No
targ
et
1990
2014
2030
targ
et &
2°C
pat
hway
Well below 2°C pathway level indicated by the blue barWell below 2°C pathway Target above 2°C pathwayTarget below 2°C pathway
Germanwatch, NewClimate Institute & Climate Action Network
12 © Copyright Germanwatch
RE target (% of TPES), historic values and 2°C compatibility of current level and 2030 target
100%
90%
80%
70%
60%
50%
40%
30%
20%
10%
0%
Argentina Australia Brazil Canada China France Germany
1990
2014
2030
targ
et &
2°C
pat
hway
1990
2014
2030
targ
et &
2°C
pat
hway
1990
2014
2030
targ
et &
2°C
pat
hway
1990
2014
2030
targ
et &
2°C
pat
hway
1990
2014
2030
targ
et &
2°C
pat
hway
1990
2014
2030
targ
et &
2°C
pat
hway
1990
2014
2030
targ
et &
2°C
pat
hway
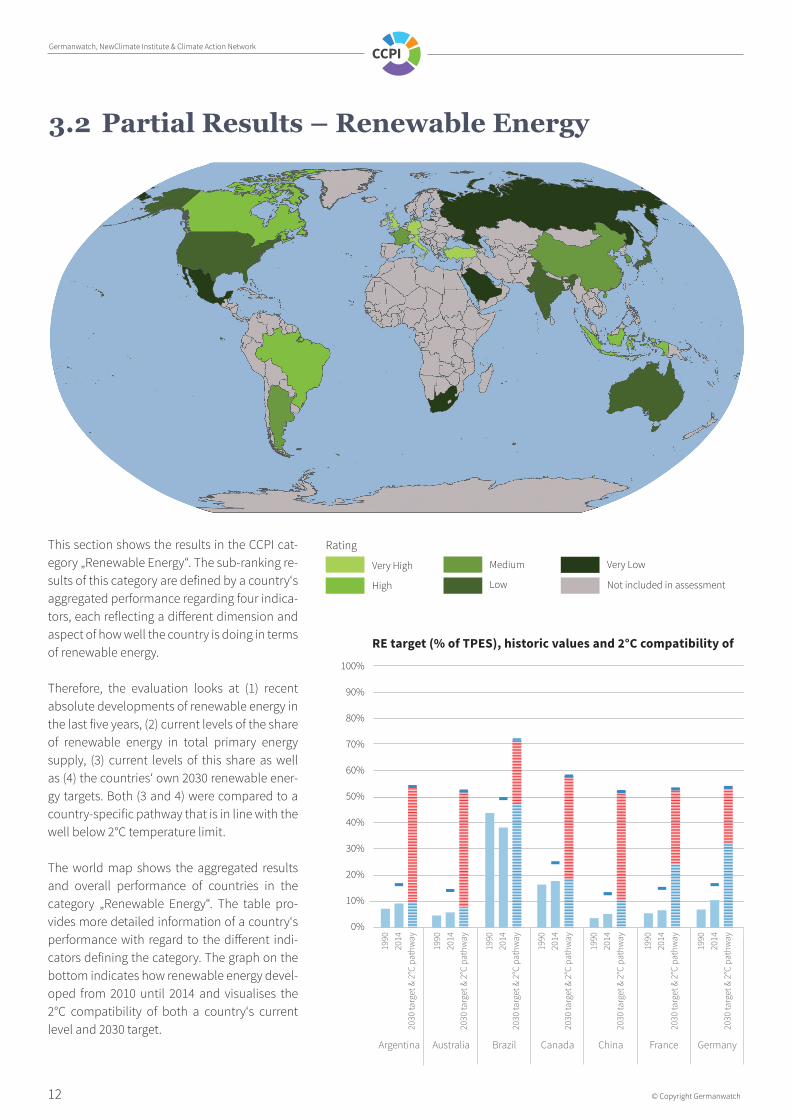
3.2 Partial Results – Renewable Energy
This section shows the results in the CCPI cat-egory „Renewable Energy“. The sub-ranking re-sults of this category are defined by a country‘s aggregated performance regarding four indica-tors, each reflecting a diff erent dimension and aspect of how well the country is doing in terms of renewable energy.
Therefore, the evaluation looks at (1) recent absolute developments of renewable energy in the last five years, (2) current levels of the share of renewable energy in total primary energy supply, (3) current levels of this share as well as (4) the countries‘ own 2030 renewable ener-gy targets. Both (3 and 4) were compared to a country-specific pathway that is in line with the well below 2°C temperature limit.
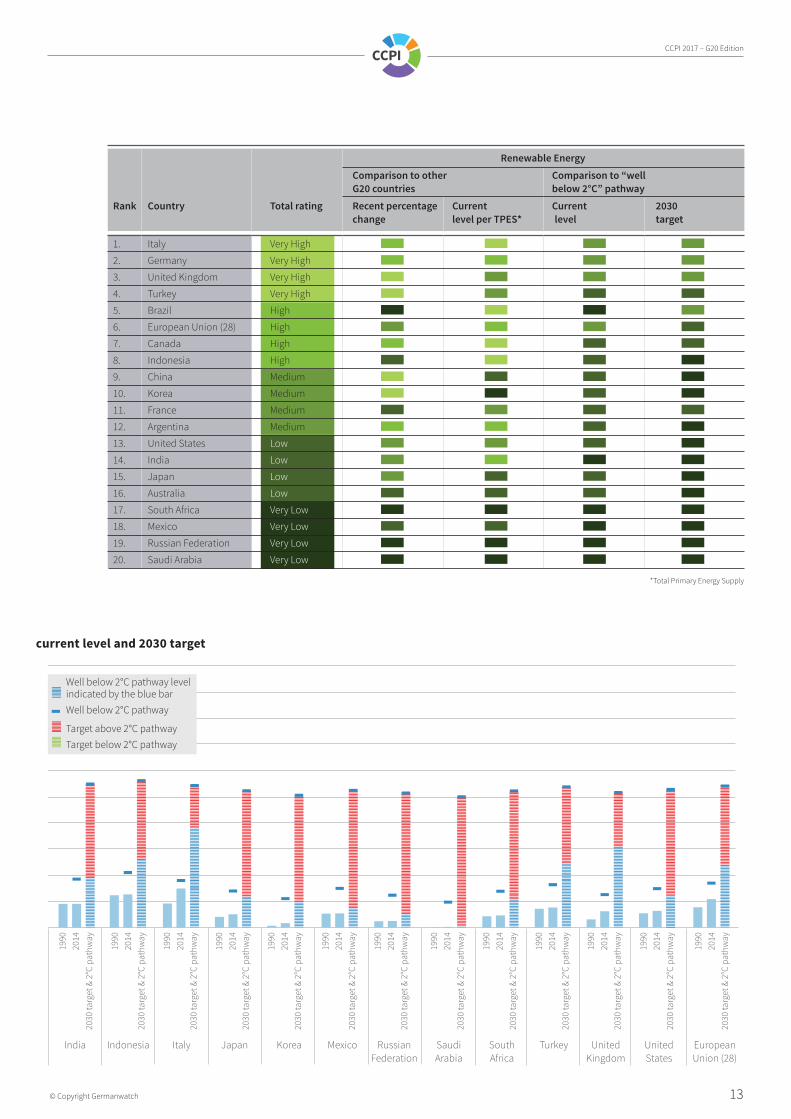
The world map shows the aggregated results and overall performance of countries in the category „Renewable Energy“. The table pro-vides more detailed information of a country‘s performance with regard to the diff erent indi-cators defining the category. The graph on the bottom indicates how renewable energy devel-oped from 2010 until 2014 and visualises the 2°C compatibility of both a country‘s current level and 2030 target.
Rating
Very High
High
Medium
Low
Very Low
Not included in assessment
CCPI 2017 – G20 Edition
© Copyright Germanwatch 13
Renewable Energy Comparison to other Comparison to “well G20 countries below 2°C” pathway Rank Country Total rating Recent percentage Current Current 2030 change level per TPES* level target
1. Italy Very High
2. Germany Very High
3. United Kingdom Very High
4. Turkey Very High
5. Brazil High
6. European Union (28) High
7. Canada High
8. Indonesia High
9. China Medium
10. Korea Medium
11. France Medium
12. Argentina Medium
13. United States Low
14. India Low
15. Japan Low
16. Australia Low
17. South Africa Very Low
18. Mexico Very Low
19. Russian Federation Very Low 20. Saudi Arabia Very Low
*Total Primary Energy Supply
RE target (% of TPES), historic values and 2°C compatibility of current level and 2030 target
Argentina Australia Brazil Canada China France Germany India Indonesia Italy Japan Korea Mexico Russian Saudi South Turkey United United European Federation Arabia Africa Kingdom States Union (28)
1990
2014
2030
targ
et &
2°C
pat
hway
1990
2014
2030
targ
et &
2°C
pat
hway
1990
2014
2030
targ
et &
2°C
pat
hway
1990
2014
2030
targ
et &
2°C
pat
hway
1990
2014
2030
targ
et &
2°C
pat
hway
1990
2014
2030
targ
et &
2°C
pat
hway
1990
2014
2030
targ
et &
2°C
pat
hway
1990
2014
2030
targ
et &
2°C
pat
hway
1990
2014
2030
targ
et &
2°C
pat
hway
1990
2014
2030
targ
et &
2°C
pat
hway
1990
2014
2030
targ
et &
2°C
pat
hway
1990
2014
2030
targ
et &
2°C
pat
hway
1990
2014
2030
targ
et &
2°C
pat
hway
Well below 2°C pathway level indicated by the blue barWell below 2°C pathway Target above 2°C pathwayTarget below 2°C pathway
Germanwatch, NewClimate Institute & Climate Action Network
14 © Copyright Germanwatch
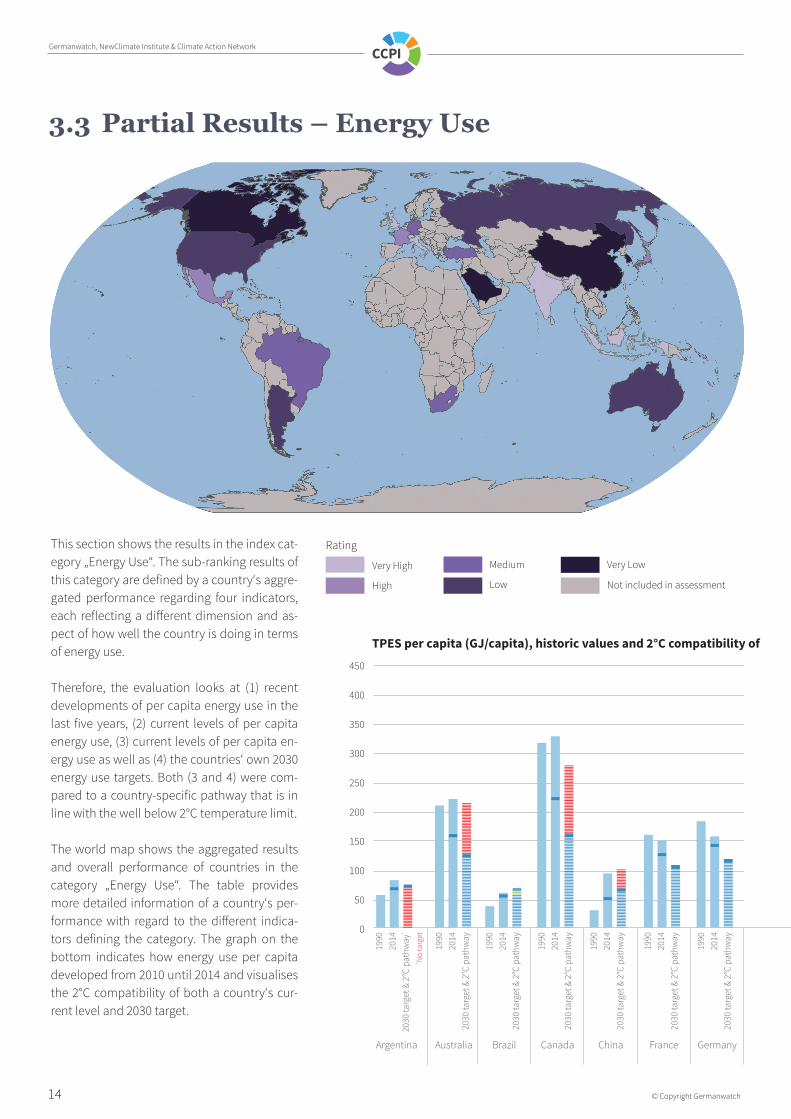
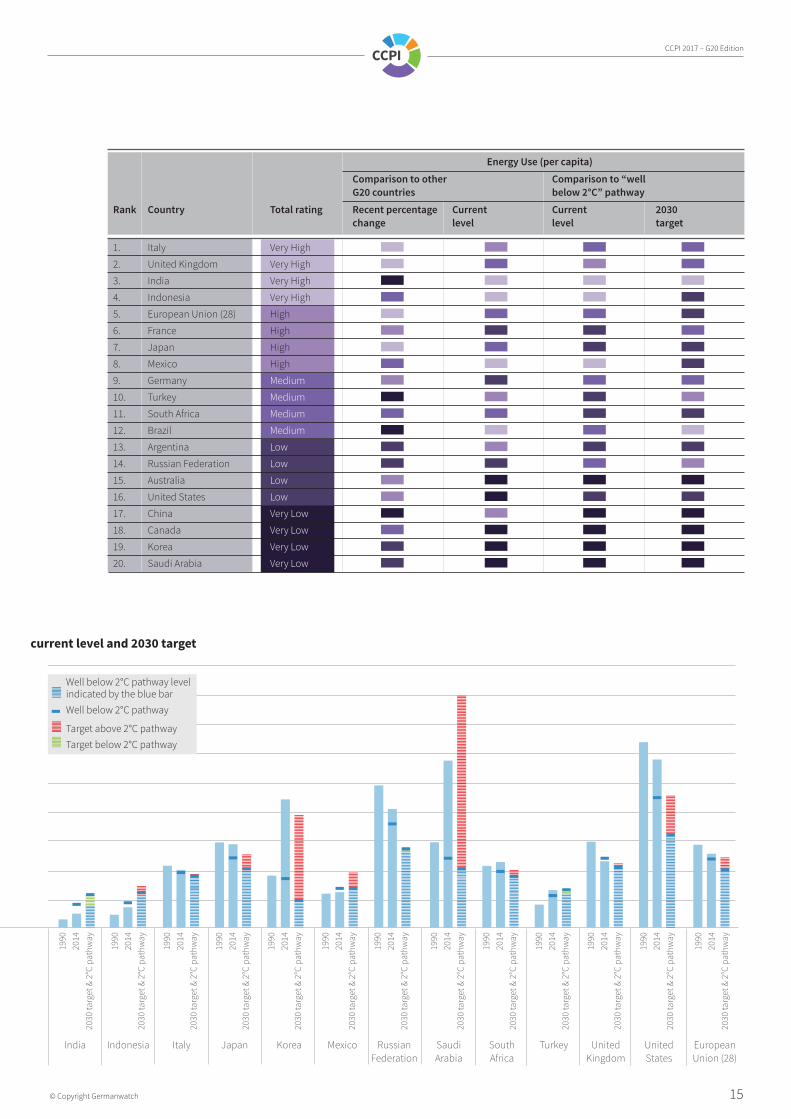
3.3 Partial Results – Energy Use
This section shows the results in the index cat-egory „Energy Use“. The sub-ranking results of this category are defined by a country‘s aggre-gated performance regarding four indicators, each reflecting a diff erent dimension and as-pect of how well the country is doing in terms of energy use. Therefore, the evaluation looks at (1) recent developments of per capita energy use in the last five years, (2) current levels of per capita energy use, (3) current levels of per capita en-ergy use as well as (4) the countries‘ own 2030 energy use targets. Both (3 and 4) were com-pared to a country-specific pathway that is in line with the well below 2°C temperature limit.
The world map shows the aggregated results and overall performance of countries in the category „Energy Use“. The table provides more detailed information of a country‘s per-formance with regard to the diff erent indica-tors defining the category. The graph on the bottom indicates how energy use per capita developed from 2010 until 2014 and visualises the 2°C compatibility of both a country‘s cur-rent level and 2030 target.
TPES per capita (GJ/capita), historic values and 2°C compatibility of current level and 2030 target
450
400
350
300
250
200
150
100
50
0
Argentina Australia Brazil Canada China France Germany
1990
2014
2030
targ
et &
2°C
pat
hway
*
* No
targ
et
1990
2014
2030
targ
et &
2°C
pat
hway
1990
2014
2030
targ
et &
2°C
pat
hway
1990
2014
2030
targ
et &
2°C
pat
hway
1990
2014
2030
targ
et &
2°C
pat
hway
1990
2014
2030
targ
et &
2°C
pat
hway
1990
2014
2030
targ
et &
2°C
pat
hway
Rating
Very High
High
Medium
Low
Very Low
Not included in assessment
CCPI 2017 – G20 Edition
© Copyright Germanwatch 15
Energy Use (per capita) Comparison to other Comparison to “well G20 countries below 2°C” pathway Rank Country Total rating Recent percentage Current Current 2030 change level level target
1. Italy Very High
2. United Kingdom Very High
3. India Very High
4. Indonesia Very High
5. European Union (28) High
6. France High
7. Japan High
8. Mexico High
9. Germany Medium
10. Turkey Medium
11. South Africa Medium
12. Brazil Medium
13. Argentina Low
14. Russian Federation Low
15. Australia Low
16. United States Low
17. China Very Low
18. Canada Very Low
19. Korea Very Low 20. Saudi Arabia Very Low
TPES per capita (GJ/capita), historic values and 2°C compatibility of current level and 2030 target
Argentina Australia Brazil Canada China France Germany India Indonesia Italy Japan Korea Mexico Russian Saudi South Turkey United United European Federation Arabia Africa Kingdom States Union (28)
1990
2014
2030
targ
et &
2°C
pat
hway
1990
2014
2030
targ
et &
2°C
pat
hway
1990
2014
2030
targ
et &
2°C
pat
hway
1990
2014
2030
targ
et &
2°C
pat
hway
1990
2014
2030
targ
et &
2°C
pat
hway
1990
2014
2030
targ
et &
2°C
pat
hway
1990
2014
2030
targ
et &
2°C
pat
hway
1990
2014
2030
targ
et &
2°C
pat
hway
1990
2014
2030
targ
et &
2°C
pat
hway
1990
2014
2030
targ
et &
2°C
pat
hway
1990
2014
2030
targ
et &
2°C
pat
hway
1990
2014
2030
targ
et &
2°C
pat
hway
1990
2014
2030
targ
et &
2°C
pat
hway
Well below 2°C pathway level indicated by the blue barWell below 2°C pathway Target above 2°C pathwayTarget below 2°C pathway
Germanwatch, NewClimate Institute & Climate Action Network
16 © Copyright Germanwatch
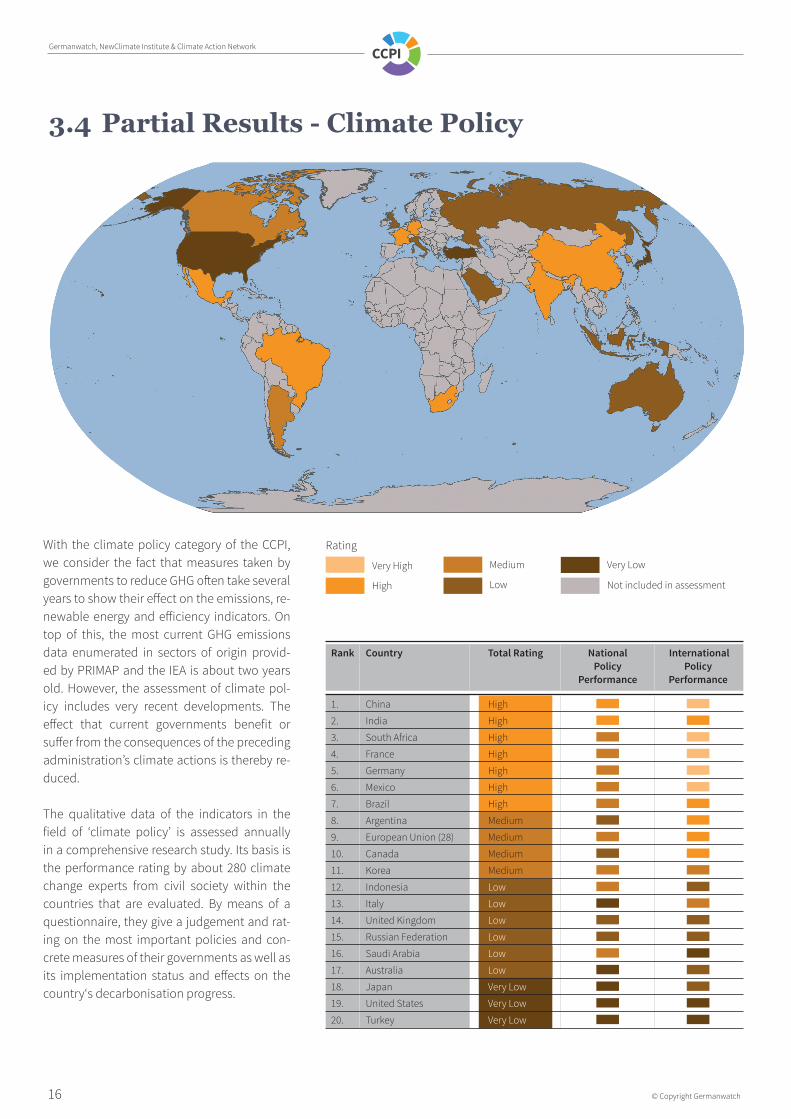
Rank Country Total Rating National International Policy Policy Performance Performance
1. China High 2. India High 3. South Africa High 4. France High 5. Germany High 6. Mexico High 7. Brazil High 8. Argentina Medium 9. European Union (28) Medium 10. Canada Medium 11. Korea Medium 12. Indonesia Low 13. Italy Low 14. United Kingdom Low 15. Russian Federation Low 16. Saudi Arabia Low 17. Australia Low 18. Japan Very Low 19. United States Very Low 20. Turkey Very Low
3.4 Partial Results - Climate Policy
With the climate policy category of the CCPI, we consider the fact that measures taken by governments to reduce GHG oft en take several years to show their eff ect on the emissions, re-newable energy and eff iciency indicators. On top of this, the most current GHG emissions data enumerated in sectors of origin provid-ed by PRIMAP and the IEA is about two years old. However, the assessment of climate pol-icy includes very recent developments. The eff ect that current governments benefit or suff er from the consequences of the preceding administration’s climate actions is thereby re-duced.
The qualitative data of the indicators in the field of ‘climate policy’ is assessed annually in a comprehensive research study. Its basis is the performance rating by about 280 climate change experts from civil society within the countries that are evaluated. By means of a questionnaire, they give a judgement and rat-ing on the most important policies and con-crete measures of their governments as well as its implementation status and eff ects on the country‘s decarbonisation progress.
Rating
Very High
High
Medium
Low
Very Low
Not included in assessment

CCPI 2017 – G20 Edition
© Copyright Germanwatch 17
4. Components of the CCPI
10%10%
10%10%
10%
10%
5%5%5%
5%
5%
5%
5%
5%
20%Climate Policy
40%Emissions
20%Renewable
Energy
20%Energy Use
Current Status of GHG* Emissions per Capita
Past Emission Trends of GHG Emissions per Capita
Past Trends compared to a well below 2°C compatible Pathway
Future GHG Emissions Reduction 2030 Target compared to a well below 2°C compatible Pathway
Current Share of Renewables per TPES**
Development of Energy Supply from Renewable Energy Sources
Past Renewable Trends compared to well below 2°C compatible Pathway
Future Renewable Energy 2030 Target compared to a well below
2°C compatible Pathway
Current Status of Energy Use per Unit of TPES/Capita
Past Trends of TPES/Capita
Past TPES/Capita Trends compared to well below 2°C compatible Pathway
Future TPES/Capita 2030 Target compared to well below
2°C compatible Pathway
National Climate Performance
International Climate Performance
*Greenhouse Gas Emissions
**Total Primary Energy Supply
The Climate Change Performance Index (CCPI) is an instrument designed to enhance transparency in in-ternational climate politics. Its aim is to put political and social pressure on those countries which have, up until now, failed to take ambitious action on climate protection. It also aims to highlight those countries with best practice climate policies.
On the basis of standardised criteria, the index eval-uates and compares the climate protection perfor-mance of the G20, which are together responsible for more than 75 percent of global greenhouse gas (GHG) emissions.
In 2017 the methodology of the CCPI was revised, due to recent global climate policy developments in the last years. One of the mayor events that marked a milestone in the international climate negotiations was the development and ratifica-tion of the Paris Agreement. For the first time, it is possible to measure states based on the promises they themselves formulated in their Nationally De-termined Contributions (NDCs). So far 149 Parties have ratified the Paris Agreement and promised to combat dangerous climate change in limiting glob-al temperature rise to well below 2°C or even 1.5° C.

Germanwatch, NewClimate Institute & Climate Action Network
18 © Copyright Germanwatch
The CCPI aims to capture those promises and eval-uates the countries‘ 2030 targets within the import-ant categories greenhouse gas emissions, renew-able energy and energy use to determine, if they are on track to a well below 2°C pathway. The CCPI now also reflects countries‘ current performances to-wards this pathway in absolute terms, in addition to the remaining relative indicators. 40% of the evalu-ation is based on indicators of emissions, 20% on renewable energy and 20% on energy use. The re-maining 20% of the CCPI evaluation is based on na-tional and international climate policy assessments by experts from the respective countries. Despite changes in the weighting and smaller modifications within the calculation method, the addition of indi-cators, which measure the progress of countries on their way not to overshoot the well below 2°C lim-it, are the major changes in the new methodology. The three categories GHG Emissions, renewable en-ergy and energy use are defined by four indicators each (recent developments, current levels and 2°C compatibility of the current performance) as well as an evaluation of the countries‘ 2030 targets in the respective categories. With these complements, the CCPI covers the evaluation of the countries promises as well as their current progress in terms of climate protection.
For the pathways, we set three ambitious targets that are essential to stay well below 2°C, which has to be reached until 2050: nearly zero GHG emissions (taking into account country-specific pathways, which gives developing countries bit more time to reach this goal), 100% energy from renewable sourc-es, and remaining at today’s global energy use per capita levels. The CCPI compares where countries actually are and where they need to be, to meet the ambitious benchmarks. Following a similar logic, the CCPI evaluates the countries‘ own 2030 targets in comparing them to the same benchmarks.
Still, more than half of the CCPI ranking indicators are qualified in relative terms (better–worse) rather than absolute. Therefore, even those countries with high rankings have no reason to sit back and relax. On the contrary, the results illustrate that even if all countries were as involved as the current front run-ners, efforts would not yet be sufficient to prevent dangerous climate change.
CCPI 2017 – G20 Edition
© Copyright Germanwatch 19
• Burck; Hermwille; Bals (2016): The Climate Change Performance Index: Background and Methodology. www.germanwatch.org/en/ccpi_bame
• Climate Transparency (2015): G20: A turning point? Available at: http://www.climate-transparency.org/g20-climateperformance [accessed: 01.11.2016]
• Climate Transparency (2016): G20 Report, From Brown to Green. Available at: http://www.climate-transparency.org/g20-brown-to-green [accessed: 01.11.2016]
• FAO (2015): Global Forest Resource Assessment 2015. Rome. Available at: www.fao.org/forest-resources-assessment/en/ [accessed: 01.11.2016]
• Freudenberg (2003): Composite Indicators of Country Performance: A Critical Assessment. STI Working Paper 2003/16. Paris.
• Gütschow, Johannes; Jeffery, Louise; Gieseke, Robert; Gebel, Ronja (2017): The PRIMAP-hist national historical emissions time series (1850-2014). V. 1.1. GFZ Data Services. http://doi.org/10.5880/PIK.2017.001
• Howarth; Santoro; Ingraffea (2011): Methane and the Greenhouse-Gas Footprint of Natural Gas from Shale Formations. In: Climatic Change, 106/4, 679-690.
• IEA (2016a): CO2 Emissions from Fuel Combustion. Paris.
• IEA (2016b): Renewables Information. Paris.
• IEA (2016c): World CO2 Emissions from Fuel Combustion: Database Documentation. Paris. Available at: http://wds.iea.org/wds/pdf/Worldco2_Documentation.pdf [accessed: 01.11.2016]
• IEEFA (2015): Global Coal Consumption: Down an Additional 2-4% in 2015. Available at: http://ieefa.org/global-coal-consumption-down-an-additional-2-4-percent-in-2015/ [accessed: 01.11.2016]
• IPCC (1997): Revised 1996 IPCC Guidelines for National Greenhouse Gas Inventories. Available at: www.ipcc-nggip.iges.or.jp/public/gl/invs1.html [accessed: 30.11.2015]
• Meinshausen et al. (2009): Greenhouse-gas emission targets for limiting global warming to 2 °C. Nature 458/7242: 1158.
• REN21 (2017): Renewables 2017 Global Status Report. Paris: REN21 Secretariat.
5. Sources and Further Reading Recommendations
GermanwatchFollowing the motto “Observing, Analysing, Acting”, Germanwatch has been actively promoting global equity and the preservation of livelihoods since 1991. In doing so, we focus on the politics and economics of the North and their worldwide consequences. The situation of marginalised people in the South is the starting point of our work. Together with our members and supporters as well as with other ac-tors in civil society, we intend to represent a strong lobby for sustainable development. We attempt to approach our goals by advocating for the prevention of dangerous climate change, for food security, and compliance of companies with human rights.
Germanwatch is funded by membership fees, donations, grants from “Stiftung Zukunftsfähigkeit” (Foundation for Sustainability) as well as grants from various other public and private donors.
You can also help achieve the goals of Germanwatch by becoming a member or by donating to:
Bank für Sozialwirtschaft AGBIC/Swift : BFSWDE33BER IBAN: DE33 1002 0500 0003 2123 00
www.germanwatch.org
G20 Edition
Climate Action Network CAN members work to achieve this goal through information exchange and the coordinated development of NGO strat-egy on international, regional, and national climate issues. CAN has regional network hubs that coordinate these eff orts around the world.
CAN members place a high priority on both a healthy en-vironment and development that “meets the needs of the present without compromising the ability of future genera-tions to meet their own needs” (Brundtland Commission). CAN’s vision is to protect the atmosphere while allowing for sustainable and equitable development worldwide.
www.climatenetwork.org
NewClimate Institute The NewClimate Institute for Climate Policy and Global Sustainability is a Germany-based research institute gener-ating ideas on climate change and driving their implementa-tion. They do research, policy design and knowledge sharing on raising ambition for action against climate change and supporting sustainable development. Their core expertise lies in the areas of climate policy analysis, climate action tracking, climate finance, carbon markets, and sustainable energy.
www.newclimate.org