Climate Change Perceptions, Data, and Adaptation in the ...
42
Environmental Studies Faculty Publications Environmental Studies 2-13-2020 Climate Change Perceptions, Data, and Adaptation in the Garhwal Climate Change Perceptions, Data, and Adaptation in the Garhwal Himalayas of India Himalayas of India Rutherford V. Platt Gettysburg College Monica V. Ogra Gettysburg College Natalie A. Kisak Gettysburg College Upma Manral Wildlife Institute of India Ruchi Badola Wildlife Institute of India Follow this and additional works at: https://cupola.gettysburg.edu/esfac Part of the Environmental Education Commons, and the Environmental Studies Commons Share feedback Share feedback about the accessibility of this item. about the accessibility of this item. Recommended Citation Recommended Citation Platt, Rutherford V., Ogra, Monica, Kisak, Natalie, Manral, Upma, and Ruchi Badola. "Climate Change Perceptions, Data, and Adaptation in the Garhwal Himalayas of India." Climate and Development (2020). This is the author's version of the work. This publication appears in Gettysburg College's institutional repository by permission of the copyright owner for personal use, not for redistribution. Cupola permanent link: https://cupola.gettysburg.edu/esfac/107 This open access article is brought to you by The Cupola: Scholarship at Gettysburg College. It has been accepted for inclusion by an authorized administrator of The Cupola. For more information, please contact [email protected].
Transcript of Climate Change Perceptions, Data, and Adaptation in the ...
Environmental Studies Faculty Publications Environmental Studies
2-13-2020
Climate Change Perceptions, Data, and Adaptation in the Garhwal Climate Change Perceptions, Data, and Adaptation in the Garhwal
Himalayas of India Himalayas of India
Rutherford V. Platt Gettysburg College
Monica V. Ogra Gettysburg College
Natalie A. Kisak Gettysburg College
Upma Manral Wildlife Institute of India
Ruchi Badola Wildlife Institute of India
Follow this and additional works at: https://cupola.gettysburg.edu/esfac
Part of the Environmental Education Commons, and the Environmental Studies Commons
Share feedbackShare feedback about the accessibility of this item. about the accessibility of this item.
Recommended Citation Recommended Citation Platt, Rutherford V., Ogra, Monica, Kisak, Natalie, Manral, Upma, and Ruchi Badola. "Climate Change Perceptions, Data, and Adaptation in the Garhwal Himalayas of India." Climate and Development (2020).
This is the author's version of the work. This publication appears in Gettysburg College's institutional repository by permission of the copyright owner for personal use, not for redistribution. Cupola permanent link: https://cupola.gettysburg.edu/esfac/107
This open access article is brought to you by The Cupola: Scholarship at Gettysburg College. It has been accepted for inclusion by an authorized administrator of The Cupola. For more information, please contact [email protected].

Climate Change Perceptions, Data, and Adaptation in the Garhwal Himalayas of Climate Change Perceptions, Data, and Adaptation in the Garhwal Himalayas of India India
Abstract Abstract Himalayan communities that depend on rain-fed agriculture are disproportionately vulnerable to climate change. In this study, we compare local perceptions of climate change from a household survey (n = 251) to climate data obtained from the Global Land Data Assimilation System (GLDAS 2.1) and MODIS Terra Snow Cover data product datasets. The study is situated in and around the Kedarnath Wildlife Sanctuary, which is located within the Garhwal Himalayas in the Indian state of Uttarakhand. We found that a large majority of respondents perceive that rainfall is increasing and that snowfall is decreasing, while a smaller majority perceives an increase in summer temperatures and no change in winter temperatures. Agreeing with the perceptions of the majority, the climate data show an increase in summer temperature and winter rainfall. However, the climate data also show an increase in winter temperature, and no monotonic change in snowfall, findings which are contrary to the perception of the majority. Household perceptions of climate change were not associated with adaptation; while many households perceived change, very few reported that they were planning to adapt. To encourage adaptation, communities would benefit from locally appropriate climate data products, and collaboration on best practices with researchers, NGOs, and extension services.
Keywords Keywords Kedarnath Wildlife Sanctuary, India, Himalayas, climate change, local perceptions, adaptation
Disciplines Disciplines Environmental Education | Environmental Sciences | Environmental Studies
This article is available at The Cupola: Scholarship at Gettysburg College: https://cupola.gettysburg.edu/esfac/107
1
Climate change perceptions, data, and adaptation in the Garhwal Himalayas of India
Rutherford V. Platt, Department of Environmental Studies, Gettysburg College, USA [email protected] [Corresponding author] Monica Ogra, Department of Environmental Studies, Gettysburg College, USA Natalie Kisak, Department of Environmental Studies, Gettysburg College, USA Upma Manral, Department of Ecodevelopment Planning and Participatory Management, Wildlife Institute of India, Dehradun, India Ruchi Badola, Department of Ecodevelopment Planning and Participatory Management, Wildlife Institute of India, Dehradun, India

2
Abstract Himalayan communities that primarily depend on rain-fed agriculture are disproportionately vulnerable to the effects of climate change. To initiate appropriate adaptation strategies, communities must have sufficient resources and accurately perceive the changes that are occurring. In this study, we compare local perceptions of climate change from a household survey (n=251) to climate data obtained from the Global Land Data Assimilation System (GLDAS 2.1) and MODIS Terra Snow Cover data product datasets. The study is situated in and around the Kedarnath Wildlife Sanctuary, which is located within the Garhwal Himalayas in the Indian state of Uttarakhand. We found that a large majority of respondents perceive that rainfall is increasing and that snowfall is decreasing, while a smaller majority perceives an increase in summer temperatures and no change in winter temperatures. Agreeing with the perceptions of the majority, the climate data show an increase in summer temperature and winter rainfall. However, the climate data also show an increase in winter temperature, and no monotonic change in snowfall, findings which are contrary to the perception of the majority. Consistent with previous studies, respondents are more perceptive to increasing temperatures in the hot season than the cold season. Furthermore, respondents are highly perceptive to increasing rainfall, potentially due to the importance of rain to livelihood, the visual salience of rain, and the recent major flooding events in the region. Climate data do not show a decrease in snowfall but do indicate that snowfall has shifted later at higher elevations. Household perceptions of climate change were not associated with adaptation; while many households perceived change, very few reported that they were taking action or planning to adapt. To encourage adaptation, communities would benefit from locally appropriate climate and weather data products, and active collaboration on best practices with researchers, NGOs, and extension services. Keywords Kedarnath Wildlife Sanctuary, India, Himalayas, climate change, local perceptions, adaptation

3
1. Introduction
In the past 50-60 years, the Himalayas have experienced a rising number of extreme heat
events, a decrease in the number of extreme cold events, and locally variable snowfall trends
(Bolch et al., 2019; Krishnan et al., 2019). The warming trends in the Himalayas are higher than
the global average (Xu & Grumbine, 2014), resulting in melting glaciers, changing vegetation
distribution, altered crop phenology, and new pests and weeds (Chaudhary et al., 2011; Sharma
& Shrestha, 2016). Glacial retreat threatens to reduce stream flow and fresh water availability
for drinking and crop irrigation, and lead to stress on groundwater resources (Mall et al., 2006;
Negi et al., 2012).
Communities that primarily depend on agriculture and subsistence farming are
disproportionately vulnerable to the effects of climate change (IPCC 2018). Yet in such
communities in the Himalayas, adaptation responses to climate change are incremental,
insufficient, and poorly integrated with wider efforts (Mishra et al., 2019). A major reason for
the inadequate response to climate change is a lack of resources -- lower caste families, women,
and other marginalized groups have particular difficulty adapting to climate change (Macchi et
al., 2015; Stock et al., 2017). In addition, adaptation to climate change is influenced by
perceptions of risk and by personal experiences (Ricke & Caldeira, 2014). Without accurate
perceptions, the communities may not initiate appropriate adaptation strategies (Amadou et al.,
2015; Piya et al., 2012). Several studies in the Himalayas have found that the majority of people
hold perceptions of climate change that are in agreement with the instrumental record (i.e.
warmer temperatures, precipitation variability, and drying of water resources) (Abid et al., 2015;
Chaudhary et al., 2011; Sharma & Shrestha, 2016; Uprety et al., 2017). However, other studies
have shown that perceptions are highly variable. For example, one study found that the

4
perception of Nepalese farmers matches the observed trends for maximum temperature, but not
for minimum temperature or rainfall (Budhathoki & Zander, 2019). Another study found that
perceptions of temperature and winter precipitation varied by study area across Nepal and India,
while perceptions of annual precipitation, monsoon onset, and crops/pests were widely consistent
(Macchi et al., 2015). A study of communities in Nepal found that while many correctly
perceive climate change, a large minority of people do not correctly perceive changes (Piya et
al., 2012).
The present study compares perceptions of climate change from 16 Himalayan villages to
climate data from NASA data sets. The key research goals are to (1) determine whether local
perceptions of climate change are in agreement with climate data, and (2) identify the probable
reasons for the agreement/lack of agreement and implications for adaptation to climate change.
The study is situated in the Kedarnath Wildlife Sanctuary (KWS) Landscape, located in the
Indian state of Uttarakhand. A better understanding of perceptions of climate change would
allow decision-makers to formulate adaptation measures and policy that address the impacts of
greatest concern to communities (Reyes-García et al., 2015; Simelton et al., 2013), to identify
linkages between environmental change and livelihoods that may not be self-evident (Byg &
Salick, 2009; Reyes-García et al., 2015; Savo et al., 2016), and to help explain why people
undertake adaptation strategies or not (Singh et al. 2018).
2. Methods
2.1.Study Area
The study area for this research comprised 16 villages located within the two central
valleys of the KWS landscape, Madhmaheshwar Valley and Kalimath Valley (Figure 1).

5
Established in 1972, the Kedarnath Wildlife Sanctuary is among the largest protected areas in
Uttarakhand (975 km2), and ranges in elevation from 1,100m to 7,068m. This large elevational
gradient results in high variability in climate and floral assemblages. It is approximately 48%
forested, including oak-dominated forests (Quercus sp.) in the temperate region (1500-2900m)
and Pine-dominated forests (Pinus roxburghii) in the subtropical regions (<1500m) (Prabhakar et
al., 2001). The KWS attracts thousands of tourists and religious pilgrims who come to visit
numerous holy sites (Manral, 2018).
Figure 1: Study Area: The Kedarnath Wildlife Sanctuary (KWS) Landscape in Uttarakhand,
India.
We surveyed residents from 251 households within 16 villages located in this geographic
area. The locations of study households ranged from 1,068 to 2,969 meters in elevation,
representing a climatic gradient of sub-tropical to temperate. Of the 16 villages, 5 are located
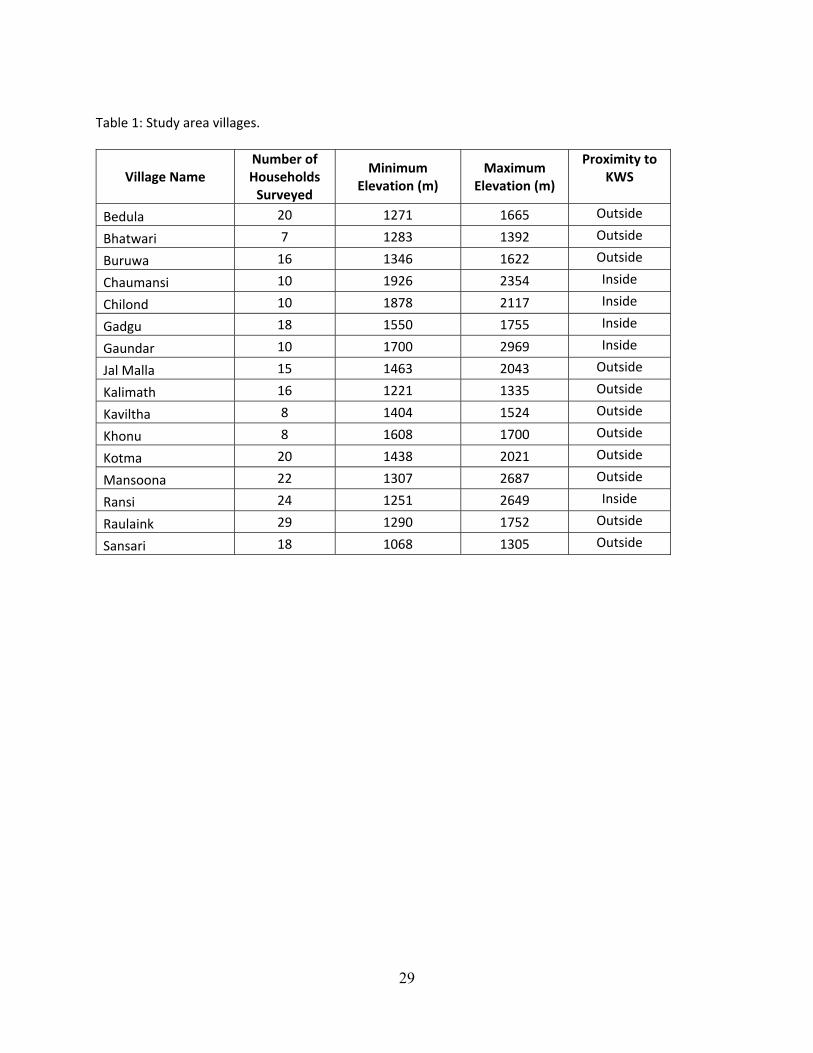
within the wildlife sanctuary and 11 are located outside the sanctuary boundaries (Table 1). As in
most parts of the Western and Central Himalaya, residents depend on cultivation of small
agricultural terraces, as well as forest resources for fuelwood and fodder (Malik et al., 2014;
Manral et al., 2017). Dominant crops include paddy, wheat, kidney beans, and traditional grains.
A small number of households seasonally migrate with their livestock to temporary summer
settlements at higher elevations with better fodder availability.
Table 1: Study area villages
2.2.Survey Data on Climate Perceptions

6
Fieldwork for this study took place from May-July 2015. To evaluate local perceptions of
changing climate, a household-level survey was conducted in 16 villages within the KWS
landscape (Table 1). Within each village, a two-person team systematically visited every fifth
home, administering the survey to a total of 251 households across the 16 villages
(approximately 20% of households). At each home, a detailed questionnaire-based interview
was conducted with a single adult member of the household. In households with more than one
adult member, a single adult was invited to participate – adults of different genders and
generations were chosen to ensure the representativeness of the sample. Informed consent was
obtained prior to each interview; participation was voluntary and unpaid. The questionnaires
were administered in Hindi or Garhwali depending on the respondent’s preferred language. The
responses were then translated to English and entered into a spreadsheet for coding and analysis.
The questionnaire dealt with four categories: climate trends, changes to agro-ecological
systems, changes in resource availability in local forests, and wildlife sighting and conflict. Only
the first of these categories is analyzed in this study. A separate study analyzed a broader set of
questions from same questionnaire and found few differences between the responses of
subgroups (i.e. categories of gender, education, or wealth) (citation redacted). Thus, in this
study we focus primarily on aggregate results and do not stratify by subgroup.
The present study analyzes results from a subsection of the questionnaire dealing with
respondent perceptions of climate trends. Key questions followed the format: “Have you noticed
changes in any of the following environmental conditions over past 15-20 years?” The
respondents were asked whether they perceived an increase, decrease, or no change (or “don’t
know”) for environmental conditions including temperature, rainfall, and snowfall.
Respondents were given an opportunity to explain their answers (“Explain your concerns about
7
environmental changes in this area”) and to provide additional, free-form narrative data. These
explanations are selectively quoted in the discussion. Finally, respondents were asked whether
they are “taking or planning actions in response to environmental change” (i.e. adapting or
planning to adapt). They were given an opportunity to describe their adaptations or explain why
they had no plan for adaptation. Using chi square tests, we evaluated whether those who
perceive environmental change are more likely to report adaptation.
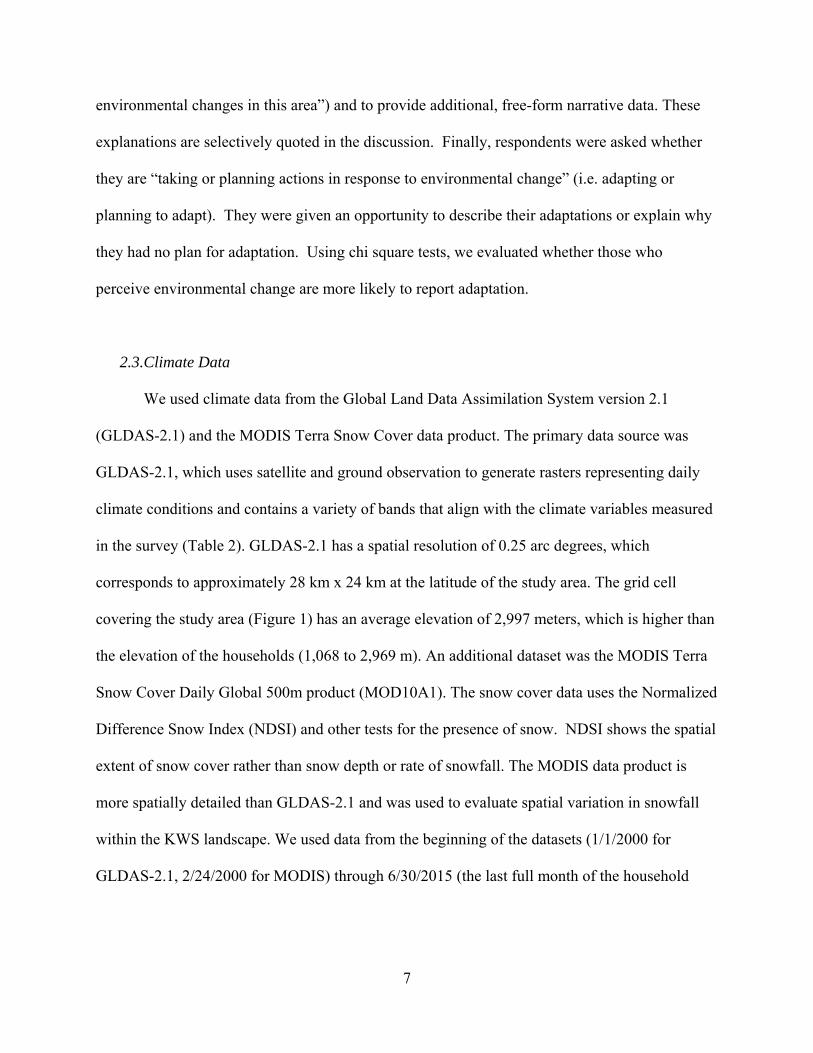
2.3.Climate Data
We used climate data from the Global Land Data Assimilation System version 2.1
(GLDAS-2.1) and the MODIS Terra Snow Cover data product. The primary data source was
GLDAS-2.1, which uses satellite and ground observation to generate rasters representing daily
climate conditions and contains a variety of bands that align with the climate variables measured
in the survey (Table 2). GLDAS-2.1 has a spatial resolution of 0.25 arc degrees, which
corresponds to approximately 28 km x 24 km at the latitude of the study area. The grid cell
covering the study area (Figure 1) has an average elevation of 2,997 meters, which is higher than
the elevation of the households (1,068 to 2,969 m). An additional dataset was the MODIS Terra
Snow Cover Daily Global 500m product (MOD10A1). The snow cover data uses the Normalized
Difference Snow Index (NDSI) and other tests for the presence of snow. NDSI shows the spatial
extent of snow cover rather than snow depth or rate of snowfall. The MODIS data product is
more spatially detailed than GLDAS-2.1 and was used to evaluate spatial variation in snowfall
within the KWS landscape. We used data from the beginning of the datasets (1/1/2000 for
GLDAS-2.1, 2/24/2000 for MODIS) through 6/30/2015 (the last full month of the household

8
survey). Annual summaries of the climate variables in Table 2 were calculated for the following
seasons:
Winter (November-February)
Summer (April-June)
Monsoon (July-September)
Annual (full calendar year)
Table 2: Selected survey questionnaire items and associated climate data sources.
For each climate variable, we used a non-parametric linear regression to evaluate trends
in mean and standard deviation over time. Specifically, we used the Mann-Kendall (M-K) test to
test for monotonic trends (i.e. consistent upward or downward trends that may or may not be
linear). The M-K test is suitable for annual data where there is no seasonal trend present, and
requires that the original data or any power transformation of the data be distributed similarly
over time (Helsel & Hirsch, 2002). Therefore, unlike OLS regression M-K tests may be used in
many cases where the variance of the original data changes over time. We also use the non-
parametric Theil-Sen linear regression to quantify the slope of the trend. The Theil-Sen method
calculates the slope of every data pair and uses the median slope to characterize the trend (Sen,
1968). Theil-Sen is robust to outliers and noise, which makes it particularly appropriate to
identifying trends in climate and weather data (Fernandes & Leblanc, 2005). In addition, for
each MODIS pixel in the study area, we found the simple linear trend between NDSI and time.
We then created scatterplots between elevation and slope (i.e. rate of change in NDSI) for each
month for the 2001-2015 period. Google Earth Engine was used for image processing of
MODIS data products (Gorelick et al., 2017).

9
While there is no weather station data available for the entire span of the study period,
monthly data is available for 2008-2010 from the weather station at Tungnath. Located 8 km
east of the study area, the Tungnath weather station is located at treeline at an elevation of 3360
meters – higher than the elevation of households (1,068 to 2,969 m) and also higher than the
average elevation within the GLDAS-2.1 grid cell (2,997m). We found that the GLDAS-2.1 data
are significantly correlated to monthly data from the Tungnath weather station (Table 2).
Temperature and rainfall had the highest correlation, while monthly snowfall rate and snow
cover were moderately correlated.
The methods we have used to analyze climate trends have general applicability; the
datasets (i.e GLDAS 2.1 and Modis Snow Cover data sets) and statistical methods (i.e. Mann-
Kendall Trend and Sen’s Slope Estimate) have not been used in previous studies of climate
perception, and could potentially be applied to other places with no long-term weather stations.
2.4.Comparison of Questionnaire Items to Climate Data
To evaluate whether there was general agreement between perceptions and associated
climate data (Table 2), we first defined “agreement” as cases when the modal perception for an
environmental change (increase, decrease, or no change) is consistent with the direction of the
Sen slope. For the changes for which there is agreement, we then compared the level of
consensus about environmental change (% of respondents who give the modal response) and the
statistical confidence (p value of the M-K test). Because perceptions may be influenced by recent
trends, we also calculated the percentile of climate data from recent years (i.e., 2013-2015)
within the time series. Finally, we evaluated how change in snow cover relates to elevation, and

10
assessed how spatial and temporal patterns of snow cover may relate to perceptions of annual
snowfall.
An important caveat is that we are comparing data collected at two different scales: local
household perceptions and regional climate data. Since local climate is strongly correlated with
regional climate, it is common practice to assess potential local impacts of climate change using
regional climate data (Maraun and Widmann, 2015). However, it is important to recognize that
complex terrain (e.g. the rain shadow of mountain ranges) can complicate the relationship
(Maraun and Widmann, 2015). We found that we found that temperature and rainfall at the
Tungnath Weather Station are strongly correlated to GLDAS-2.1 temperature and rainfall.
Snowfall at the weather station location had a lower correlation, but we were able to supplement
with a more detailed dataset, the MODIS Terra Snow Cover data product. Furthermore, it is
important to note that household perceptions of climate change are shaped by both regional and
local factors. This is evident from qualitative responses noted later in the paper, i.e. respondents
mentioned regional flooding events and snow in the mountains at higher elevations than where
they live.
3. Results
3.1. Perceptions of climate change
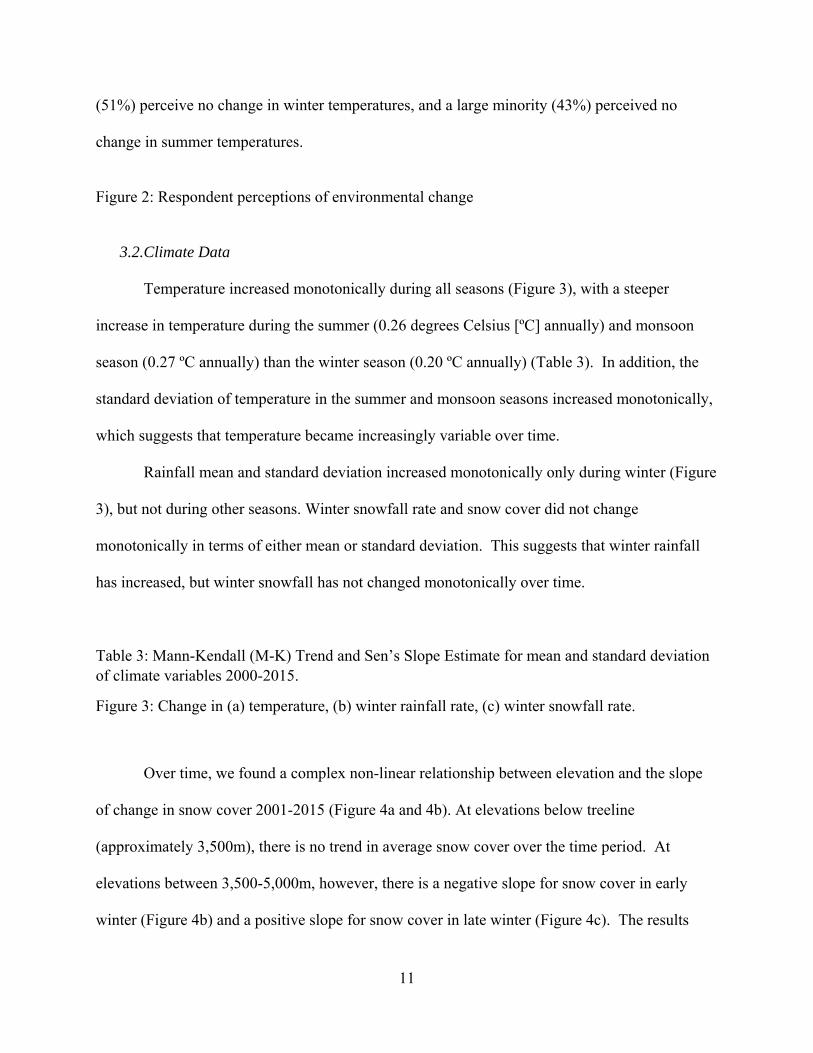
The greatest consensus among respondents relates to precipitation: 82% of respondents
perceive that rainfall is increasing and 79% perceive that snowfall is decreasing (Figure 2). In
terms of temperature, results are split with 53% perceiving an increase in summer temperature
but only 34% perceiving an increase in average winter temperatures. The majority of respondents
11
(51%) perceive no change in winter temperatures, and a large minority (43%) perceived no
change in summer temperatures.
Figure 2: Respondent perceptions of environmental change
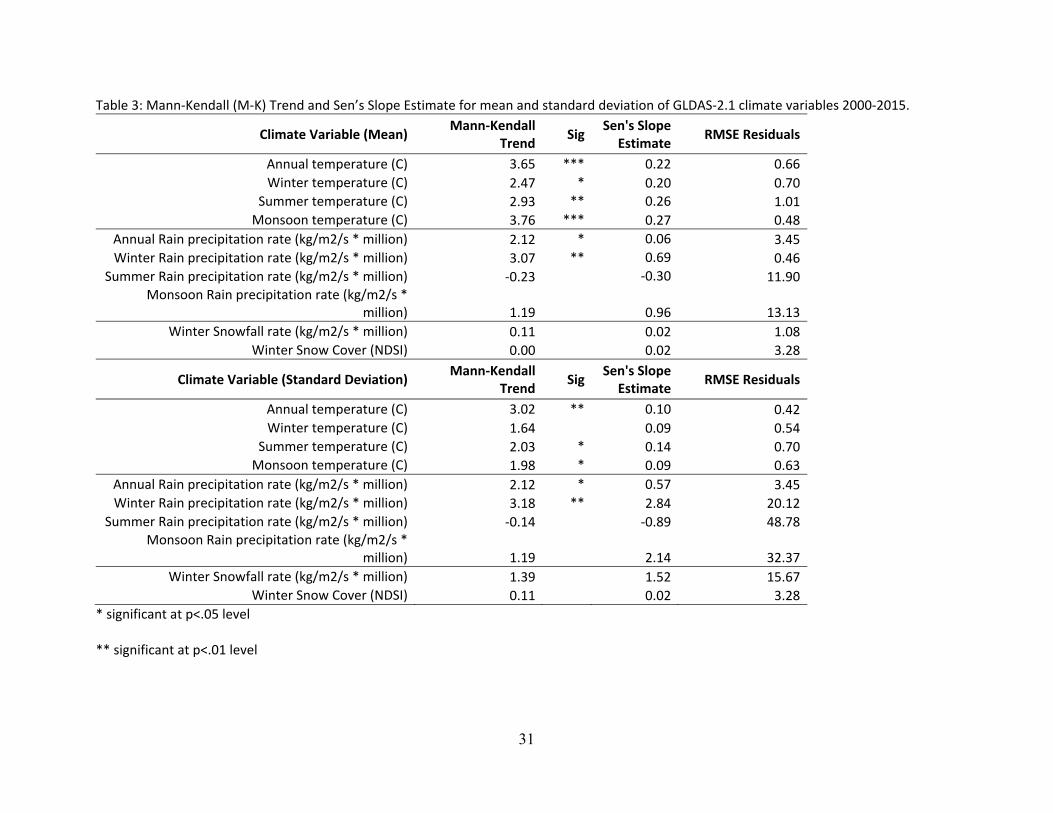
3.2.Climate Data
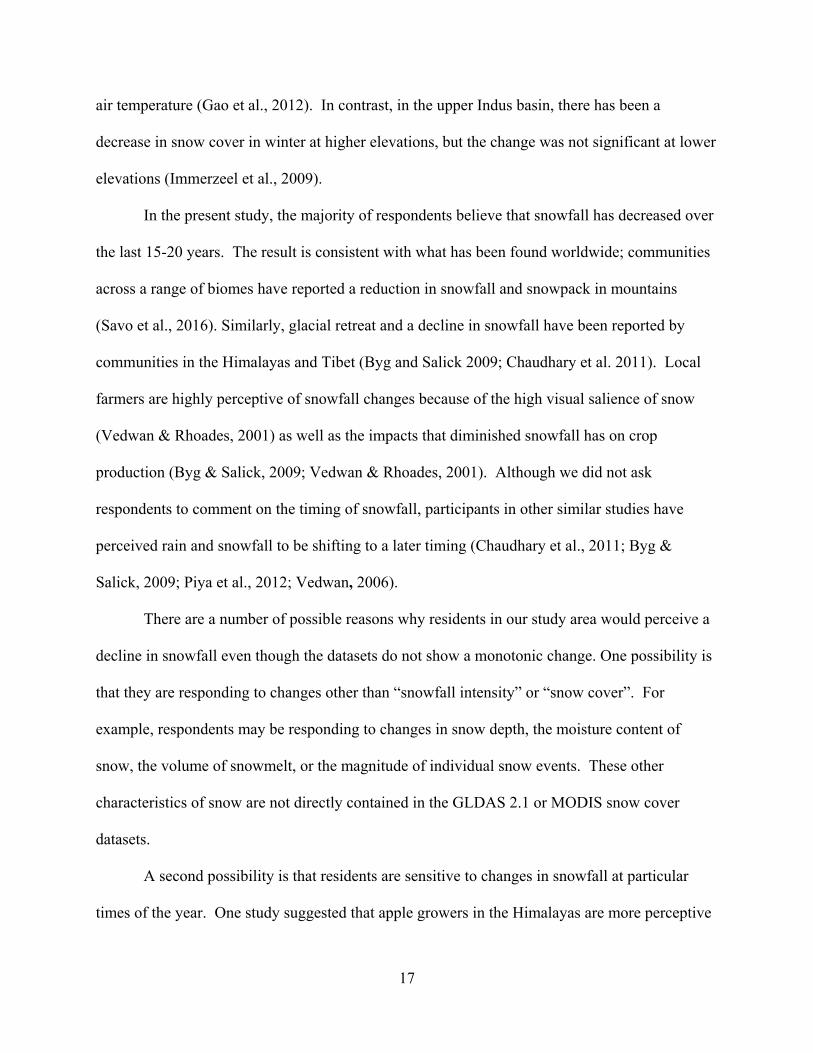
Temperature increased monotonically during all seasons (Figure 3), with a steeper
increase in temperature during the summer (0.26 degrees Celsius [ºC] annually) and monsoon
season (0.27 ºC annually) than the winter season (0.20 ºC annually) (Table 3). In addition, the
standard deviation of temperature in the summer and monsoon seasons increased monotonically,
which suggests that temperature became increasingly variable over time.
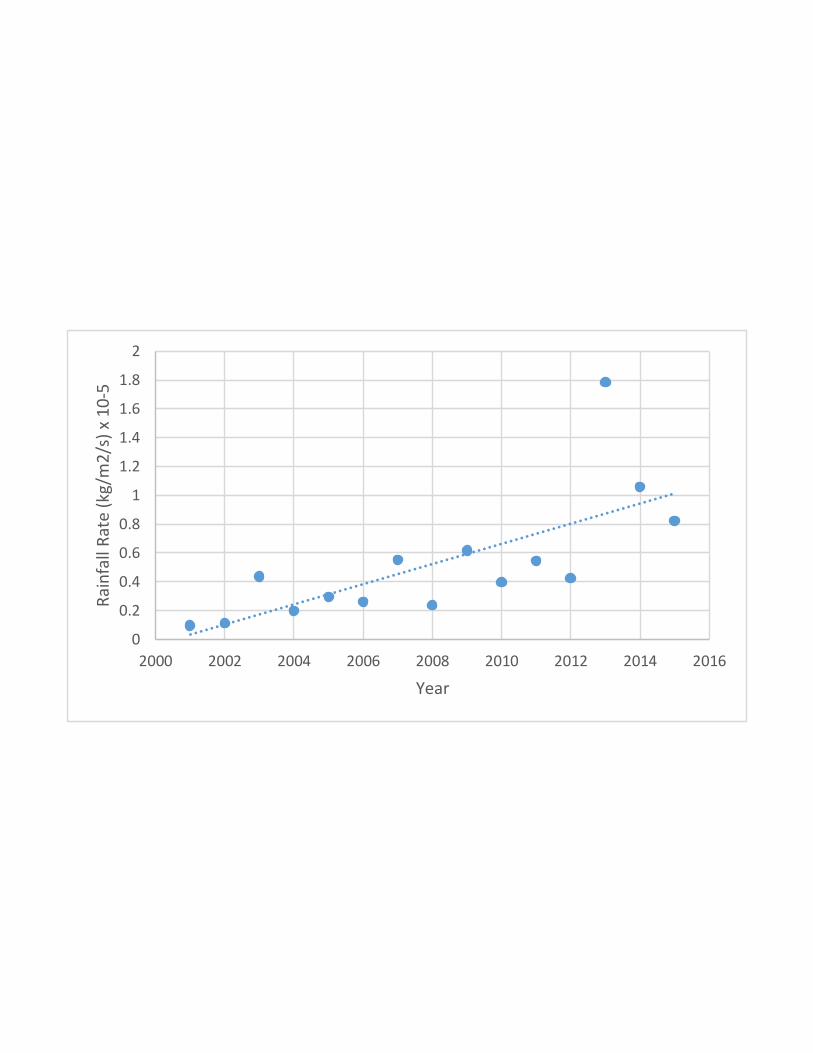
Rainfall mean and standard deviation increased monotonically only during winter (Figure
3), but not during other seasons. Winter snowfall rate and snow cover did not change
monotonically in terms of either mean or standard deviation. This suggests that winter rainfall
has increased, but winter snowfall has not changed monotonically over time.
Table 3: Mann-Kendall (M-K) Trend and Sen’s Slope Estimate for mean and standard deviation of climate variables 2000-2015.
Figure 3: Change in (a) temperature, (b) winter rainfall rate, (c) winter snowfall rate.
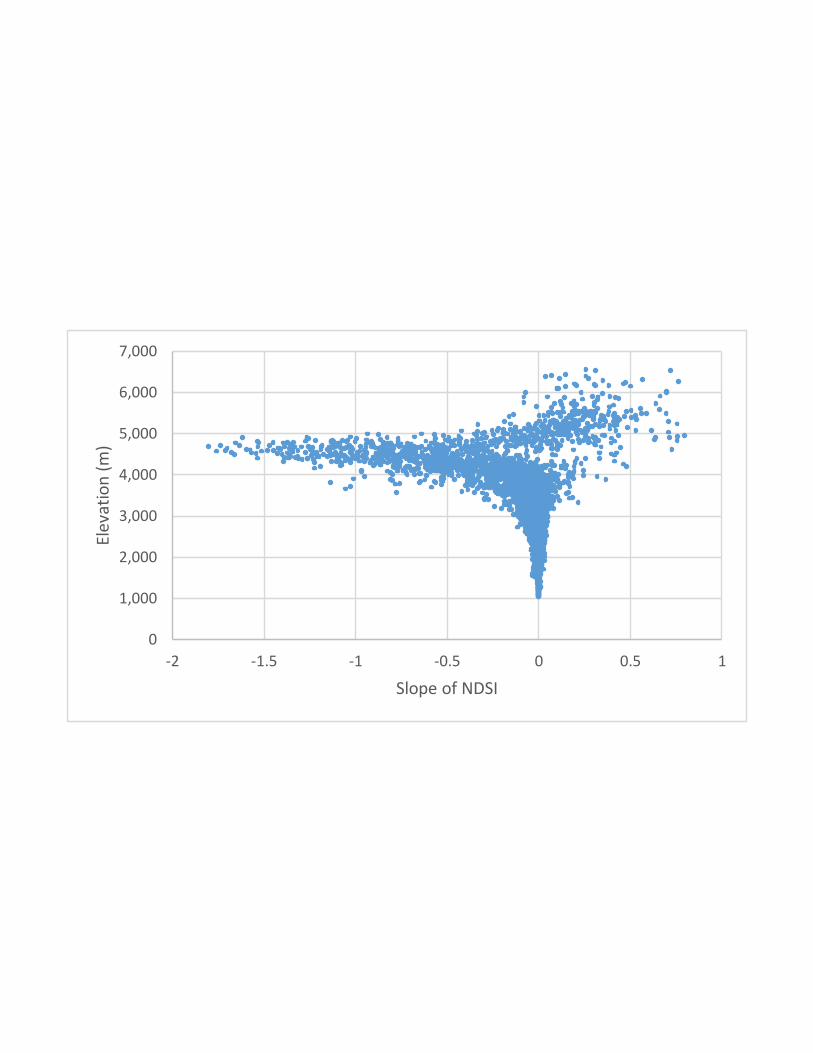
Over time, we found a complex non-linear relationship between elevation and the slope
of change in snow cover 2001-2015 (Figure 4a and 4b). At elevations below treeline
(approximately 3,500m), there is no trend in average snow cover over the time period. At
elevations between 3,500-5,000m, however, there is a negative slope for snow cover in early
winter (Figure 4b) and a positive slope for snow cover in late winter (Figure 4c). The results

12
indicate that while the annual snow cover has not changed monotonically, the seasonality of
snow cover has shifted at higher elevations during the time period studied.
Figure 4: Elevation versus slope of NDSI for the early and late winter season. (Positive slope indicates an increase in snow, while a negative slope indicates a decrease).
3.3.Agreement between local perceptions and climate data
There is agreement between perceptions and climate data for average summer
temperature and rainfall. In both cases, more than 50% of respondents perceive an increase,
there is a positive Sen slope, and the M-K test is significant at the p<.05 level (Table 4). For
winter temperature and snowfall, there is no clear agreement. While there is evidence of a
monotonic increase in winter temperatures (positive Sen slope and significant M-K test), 51% of
respondents perceived ‘no change’. A significant minority (34%) did perceive an increase in
winter temperatures. While there is no evidence of a monotonic change in snowfall (M-K test not
significant), 79% of respondents perceive a decrease. There is, however, a decrease in snowfall
at higher elevations in the early winter period (Figure 4a, b).
Table 4: Agreement of perceptions and climate data
Interestingly there is little relationship between the level of consensus about
environmental change (% of respondents who give the modal response) and the statistical
confidence (p value of the M-K test) (Table 4). For example, a large number of respondents
(82%) perceive that rainfall is increasing, but statistically the confidence is moderate that rainfall
is increasing (p <0.05 but not p<.01). In contrast, a smaller number of respondents (34%)

13
believe that winter temperature is increasing, but statistically the confidence is high that winter
temperature is increasing (p< 0.01). The averages of the three years leading up to the survey
(2013-2015) were characterized by above average temperatures, above average rainfall rate, and
close to average snowfall rate (Table 5).
Table 5: Percentile of recent years within time series.
3.4.Climate Perceptions and Adaptation
Of the 251 households in the survey, only 35 (14%) reported that they are adapting (i.e.
“taking or planning actions in response to environmental change”). Chi square tests suggested
that perceptions of environmental change were for the most part not associated with adaptation.
Adaptation households did not differ significantly from no-adaptation households in terms of
perceptions of summer temperature (χ=1.72, p=0.19), winter temperature (χ=0.684, p=0.408), or
winter snowfall (χ=0.03, p=0.862). However, 60% of respondents in adaptation households
perceived an increase in rainfall versus 87% for no-adaptation households [F(1,249)=14.982,
p=0.000]. Overall, these results underscore that in terms of perceptions of temperature and
snowfall, the households that report adaptation are similar to those who report no adaptation. In
the discussion section (4.4) we evaluate the reasons behind this finding.
Households reported adaptations such as planting vegetation (e.g. fruit and fodder trees)
to stabilize landslide areas, switching from traditional staple grains to crops typically grown in
warmer climates (e.g. mustard, lentils, or alternate grains), and increasing insecticide use to
combat the increase in agricultural pests. In open-ended comments, some respondents provided

14
explanations for why they were not adapting, including a lack of money, a lack of knowledge,
and a general sense that the environmental changes they face are beyond their control.
4. Discussion
In the following section, we interpret the agreement between survey data and climate
observations, compare the results to other similar studies, and suggest implications for
adaptation.
4.1.Temperature
The GLDAS-2.1 dataset shows that temperatures increased in all seasons, and the
increase was particularly steep during the summer and the monsoon season. Temperature also
became more variable in summer and the monsoon season. These results are consistent with
studies elsewhere in the Himalayas. For example, across the Himalayas the warming trend has
been ~0.06ºC/year since circa 1980 (Negi et al., 2012; Shrestha et al. 2012). Higher rates of
change were observed in winter months (Chaudhary et al., 2011) and at higher elevations (Negi
et al., 2012).
Worldwide, perceptions of temperature increase typically correspond to observed
temperature increase from climate records (Howe et al., 2012). While some Himalayan studies
have found that residents perceive temperature increases in both summer and winter (Chaudhary
et al., 2011, Sharma and Shrestha 2016), we found that the majority of people perceive
increasing temperatures only in summer. This finding is similar to those reported by Piya et al.
(2012) in Nepal, in which the majority also perceived increasing summer temperatures yet
disagreed about the direction of winter temperatures. It may be that respondents are more likely
to perceive warming when the ambient temperature is already high. A survey of 91,073 people

15
across 89 countries found that whether the survey was conducted during the warm or cool season
had an influence on perceptions of warming; during the warm season respondents were 11-19%
more likely to perceive that average temperatures had increased (Howe et al., 2012).
4.2.Rainfall
The GLDAS-2.1 dataset shows that rainfall increased and became more variable in the
winter. Outside of winter, there was no significant change in rainfall. Previous studies have
found that in India rainfall mean has not changed since the 1950s, but the frequency and
magnitude of extreme events has increased (Goswami et al., 2006). At the local level, some
regions in India are experiencing an increase in rainfall and others a decline (Mall et al., 2006).
While we found no monotonic change in monsoon rainfall, it is possible that there are local
variations that we could not detect at the resolution of the GLDAS 2.1 data; a previous study
found that in Uttarakhand, monsoon rains declined at high altitudes and increased in low
altitudes from ca. 1960s-2000s (Singh & Mal, 2014).
Consistent with the GLDAS-2.1 data, the majority of respondents perceive rainfall to be
increasing. Other studies also found that local populations were able to perceive changes to the
amount, frequency, and intensity of rainfall (Amadou et al., 2015; Chaudhary et al., 2011;
Sharma & Shrestha, 2016), and that farmers are more likely to perceive changes than non-
farmers (Piya et al., 2012). This may be attributed in part to the visual salience (ease of
observation) of rainfall (Vedwan & Rhoades, 2001) and to the utilitarian importance of rain.
Farmers are highly dependent on rainfall for their crops and consequently they may be more
aware of changes to rainfall (Amadou et al., 2015; Meze-Hausken, 2004). In the study area,
rainfall early in the growing seasons (i.e. June- July and November-February) is particularly

16
important for a successful harvest. Only one of the 16 villages in the study area has an irrigation
system; the remainder employs entirely rain-fed agriculture.
Recent rain events may influence perceptions of long-term change. A study in Tibet
found that locally reported perceptions are more in line with short-term, rather than long-term,
trends possibly due to the direct impact on current livelihoods from recent events (Piya et al.,
2012). This may also be true for the present study; extreme flooding rather than long-term trends
may shape respondents’ perception of rainfall. Two years before the survey for the present study,
severe flash floods and debris flows in KWS landscape led to more than 4,000 deaths, many
including many tourists and pilgrims (Chevuturi & Dimri, 2016; Kala, 2014). In qualitative
comments, a number of respondents cited “irregular rains” and “increased landslides” as specific
concerns (e.g. “due to fast rain fertile soil is running away and soil is no more fertile.”) While we
found an increase in rain in the winter, there is no significant monotonic trend in rainfall in the
summer or the monsoon season (Table 3).
4.3. Snowfall
Neither the GLDAS-2.1 dataset snowfall rate (2000-2015) nor the MODIS Terra Snow
Cover data product (2001-2015) shows a monotonic trend. However, the MODIS data set does
suggest that the seasonality of snow cover has shifted at higher elevations, with less snow cover
in early season (i.e. November-December) and more snow late season (i.e. January through early
summer). Studies elsewhere in the Himalayas have also found snow cover trends that are
elevation-dependent. For example, the length of the snow-covered season in Tibet has decreased
at lower elevations and increased at higher elevations (Gao et al., 2012). In locations where
snowfall has remained high, an increase in precipitation has likely compensated for increase in
17
air temperature (Gao et al., 2012). In contrast, in the upper Indus basin, there has been a
decrease in snow cover in winter at higher elevations, but the change was not significant at lower
elevations (Immerzeel et al., 2009).
In the present study, the majority of respondents believe that snowfall has decreased over
the last 15-20 years. The result is consistent with what has been found worldwide; communities
across a range of biomes have reported a reduction in snowfall and snowpack in mountains
(Savo et al., 2016). Similarly, glacial retreat and a decline in snowfall have been reported by
communities in the Himalayas and Tibet (Byg and Salick 2009; Chaudhary et al. 2011). Local
farmers are highly perceptive of snowfall changes because of the high visual salience of snow
(Vedwan & Rhoades, 2001) as well as the impacts that diminished snowfall has on crop
production (Byg & Salick, 2009; Vedwan & Rhoades, 2001). Although we did not ask
respondents to comment on the timing of snowfall, participants in other similar studies have
perceived rain and snowfall to be shifting to a later timing (Chaudhary et al., 2011; Byg &
Salick, 2009; Piya et al., 2012; Vedwan, 2006).
There are a number of possible reasons why residents in our study area would perceive a
decline in snowfall even though the datasets do not show a monotonic change. One possibility is
that they are responding to changes other than “snowfall intensity” or “snow cover”. For
example, respondents may be responding to changes in snow depth, the moisture content of
snow, the volume of snowmelt, or the magnitude of individual snow events. These other
characteristics of snow are not directly contained in the GLDAS 2.1 or MODIS snow cover
datasets.
A second possibility is that residents are sensitive to changes in snowfall at particular
times of the year. One study suggested that apple growers in the Himalayas are more perceptive
18
of snow early in the winter season, because early season snow promotes the required “chilling
period” for apple trees (Vedwan, 2006). Similarly, in the KWS landscape, residents expressed
the belief that snowfall in early winter can kills pests and result in good harvest, while snowfall
in late winter may damage flowering plants. Therefore, it is possible that residents are more
perceptive of changes in snow at certain times of year. Third, as with perceptions of rain, it is
possible that residents are responding to recent weather: snowfall in the year prior to the survey
was significantly lower than average (Table 5). Fourth, it is possible that snowfall has lower
visual salience for residents of the study area; most snowfall in the region occurs at elevations
much higher than where people live. Finally, it is possible that residents perceived other climate-
related changes and presume that snow must be decreasing. As one respondent said, “When we
were young then there was lot of snowfall, but today if it rains heavily than there are landslides.
Earlier it was not like this.” Similarly, numerous respondents perceive that the increase in pests
is associated with a decrease in snow: for example, “Earlier there was a lot of snowfall that used
to kill rodents, but now due to less snowfall they are increased” and “Earlier insects used to die
due to frost and snowfall, but now climate is changing and insects are not dying”. Our analysis
suggests, however, that although rain is increasing in the winter, there is no corresponding
decrease in winter snowfall over the time period studied.
4.4. Implications for adaptation to climate change
Previous studies have suggested that people are not motivated to adapt to climate change
without accurate risk perception and personal experience (Tripathi & Mishra, 2017) as well as
scientific awareness (Rudiak-Gould, 2014). Furthermore, poor and marginalized groups have
difficulty adapting to climate change (Macchi et al., 2015; Stock et al., 2017).

19
While accurate perceptions of climate change may be necessary for successful adaptation,
they were not sufficient to prompt adaptation in this case. We found that the majority of
respondents accurately perceived increasing summer temperatures and annual rainfall, yet very
few engaged in adaptation or planned to do so in the future. Indeed, very few households of any
income level or socioeconomic group are taking action or planning to adapt. The small number
of households that are adapting report actions that are limited in scope (e.g. planting warmer-
weather crops, applying insecticide, planting vegetation to stabilize soil). In open-ended
comments, respondents mentioned many barriers to adaptation, i.e. cost, a lack of knowledge,
and a sense that there is nothing they can do.
While perceptions of climate can shape peoples’ behavior (i.e. whether or not to adapt),
factors in the “operational environment” such as institutions, information, resources, and
technology also play an essential role in shaping risk perceptions and behavior (Singh et al
2018). In the KWS landscape, respondents have access to few resources and many do not believe
that organizations (particularly the Forest Department, Central Government, or NGOs) are
helpful. Thus, many respondents believe that they do not have the capacity to make meaningful
adaptations, a collective belief that may shape the behavior and willingness of members of the
community to adapt.
To encourage adaptation in the communities of the KWS landscape, we believe that new
programs must be developed by local governments and organizations. The programs should
acknowledge the perceptions of climate change, address misconceptions, and provide adaptation
knowledge, resources, and opportunities for community involvement. Toward these ends, we
propose the following actions for regional researchers, relevant NGOs, extension services, and
local governmental bodies: (1) expand the weather station network and make the data publicly

20
available; (2) actively involve communities in identifying and disseminating locally appropriate
climate data products; and (3) collaborate with communities to create a better operational
environment for adaptation.
First, we propose expanding and maintaining the weather station network, particularly in
the hills and mountains. The Himalayas and Tibetan Plateau tend to be data poor and are sparsely
covered by weather stations (Piya et al., 2012). In Uttarakhand, automatic weather stations exist
but some are poorly maintained, and the data are typically not publicly available (SANDRP,
2013). The weather stations that do exist do not capture the significant altitudinal and
topographical variation (Macchi et al., 2015). In this study, we used the GLDAS-2.1 dataset
because it is the only consistently collected publicly available climate data for the entire span of
the study. Unfortunately, GLDAS-2.1 is coarse, not ‘real time,’ and requires technical expertise
to access. A wider network of monitoring stations would also help communities manage risk and
water supply (Gao et al., 2019).
Secondly, we propose actively involve communities in identifying and disseminating
locally appropriate climate data products. Making choices about how best adapt to climate
change requires access to reliable and timely information and is a precursor to community self-
empowerment (Ogra & Badola, 2015). Scientific knowledge must be presented in locally
appropriate ways that take into account social structure, community complexities, and local
needs (Muccione et al., 2016). While classic meteorological variables (e.g. air temperature,
humidity, air pressure, precipitation, and wind) should be reported (Gao et al., 2019), so too
should data summaries that directly relate to local livelihoods. Since the seasonality of climate
change is important to residents, climate summaries should include the timing and intensity of
change in addition to current weather and annual averages.

21
Finally, researchers, local governments, NGOs, and extension services should collaborate
more with communities to build a better operational environment for adaptation. Extension
service agents can play an important role as information disseminators between government
support programs and beneficiaries (Abid et al., 2015). The Forest Department authorities in the
KWS and the NGO sector are well-positioned to assist local communities to adapt to climate
change. It is important that the staff members of these institutions are trained in basic
meteorology and climate science (Piya et al., 2012), as well as recognize how climate change
differentially impacts livelihood vulnerability (Shukla et al., 2016; Ogra & Badola, 2015). By
disseminating knowledge and building a community around climate change adaptation, local
governmental organizations and NGOs can create viable pathways for a wider range of effective
adaptation strategies.
5. Conclusion
Changes in temperature and precipitation have direct impacts on agricultural
productivity, leading to reduced water availability for irrigation, lower soil fertility, declines in
crop yields, shifting of crop cycles, and invasion of new weeds and pest species (Negi et al.,
2012; Tripathi & Mishra, 2017). In the KWS landscape, we found evidence that temperature is
increasing across all seasons, that rainfall is increasing in the winter, and that there is no
monotonic change in winter snowfall or summer/monsoon rain. The majority of respondents
perceived an increase in summer temperature and an increase in rainfall, but contrary to the
climate data, perceived no change in winter temperature and perceived a decrease in snowfall.
One finding differs from other related studies: respondents perceive a decrease in snowfall

22
decrease, while snowfall has primarily shifted later in the season but has not decreased overall
during the period of the study.
There are several reasons why perceptions do not consistently match climate data. Rain
and snow have greater visual salience (more easily observable) than temperature (Vedwan &
Rhoades, 2001). This may explain why respondents are in greater agreement about trends in
precipitation than trends in temperature even though the statistical evidence for temperature is
stronger. Furthermore, perceptions of climate change are influenced by short-term local weather
patterns, which are variable and may not reflect long-term trends (Howe et al., 2012; Shao, 2015;
Piya et al., 2012; Lehner & Stocker, 2015). The 2013 floods in Uttarakhand may have
influenced respondent perceptions of “total rainfall” even though there is no long-term
monotonic trend in rainfall in the summer or monsoon seasons. Finally, perceptions can be
affected by climate factors that we did not measure. For example, while there is no evidence of a
change in total snowfall, residents may perceive that snow is melting more quickly and presume
that increased winter rain necessarily leads to decreased winter snowfall.
In this study, the perceptions of climate change were not clearly connected to adaptation;
very few households have plans for adaptation regardless of their climate perceptions or
socioeconomic factors. To encourage a wider range of effective adaptation measures,
communities in the KWS landscape and other similar regions in the Himalayas would benefit
from improved weather and climate monitoring, locally appropriate data products, and active
collaboration on adaptation strategies with researchers, NGOs, local government, and extension
services.

23
Literature Cited
Abid, M., Scheffran, J., Schneider, U.A, & M. Ashfaq. (2015). Farmers’ perceptions of and adaptation strategies to climate change and their determinants: The case of Punjab province, Pakistan. Earth System Dynamics, 6, 225-243.
Amadou, M.L., Villamor, G.B., Attua, E.M., & S.B. Traoré. (2015). Comparing farmers’
perception of climate change and variability with historical climate data in the Upper East Region of Ghana. Ghana Journal of Geography, 7(1), 47-74.
Bolch, T., Shea, J.M, Liu, S., Azam, F.M., Gao, Y., Gruber, S., Immerzeel, W.W., Kulkarni, A.,
Li, H., Tahir, A.A., Zhang, G., & Zhang, Y. (2019). Status and Change of the Cryosphere in the Extended Hindu Kush Himalaya Region. In P. Wester, A. Mishra, A. Mukherji, & A. B. Shrestha (Eds.), The Hindu Kush Himalaya Assessment—Mountains, Climate Change, Sustainability and People (pp. 209-245). Spring Nature Switzerland AG.
Budhathoki, N.J., & Zander, K.K. (2019). Nepalese farmers’ climate change perceptions, reality
and farming strategies. Climate and Development, 1-12. Byg, A., & J. Salick. (2009). Local perspectives on a global phenomenon – Climate change in
Eastern Tibetan villages. Global Environmental Change, 19, 156-166. Chaudhary, P., Rai, S., Wangdi, S., Mao, A., Rehman, N., Chettri, S., & K.S. Bawa. (2011).
Consistency of local perceptions of climate change in the Kangchenjunga Himalaya landscape. Current Science, 101(4), 504-513.
Chevuturi, A., & Dimri, A. P. (2016). Investigation of Uttarakhand (India) disaster -2013 using
weather research and forecasting model. Nat Hazards, 82, 1703 – 1726. Fernandes, R., & Leblanc, S.G. (2005). Parametric (modified least squares) and non-parametric
(Theil-Sen) linear regressions for predicting biophysical parameters in the presence of measurement errors. Remote Sensing of Environment, 95, 303-316.
Gao, J., Williams, M. W., Fu, X., Wang, G., & Gong, T. (2012). Spatiotemporal distribution of
snow is eastern Tibet and the response to climate change. Remote Sensing of Environment, 121, 1-9.
Gao, J., Yao, T., Masson-Delmotte, V., Steen-Larsen, H.C., & Wang, W. (2019). Collapsing
glaciers threaten Asia’s water supplies. Nature, 565, 19-21. Gorelick, N., Hancher, M., Dixon, M., Ilyushchenko, S., Thau, D., & R. Moore. (2017). Google
Earth Engine: Planetary-scale geospatial analysis for everyone. Remote Sensing of Environment, 202, 18-27.
24
Goswami, B.N., Venugopal,V., Sengupta, D., Madhusoodanan, M.S., & Xaviar, P. K. (2006). Increasing Trend of Extreme Rain Events Over India in a Warming Environment. Science, 314, 1442-1445.
Helsel, D.R., & Hirsch, R.M. (2002). Statistical Methods in Water Resources. United States
Geological Survey. Howe, P.D., Markowitz, E.M., Lee, T.M., Ko, C.Y., & A. Leiserowitz. (2012). Global
perceptions of local temperature change. Nature Climate Change, 3, 352-356. Immerzeel, W.W., Droogers, P., de Jong, S.M., & Bierkens, M.F.P. (2009). Large-scale
monitoring of snow cover and runoff simulation in Himalayan river basins using remote sensing. Remote Sensing of Environment, 113, 40-49.
IPCC, 2018: Summary for Policymakers. In: Global warming of 1.5°C. An IPCC Special Report
on the impacts of global warming of 1.5°C above pre-industrial levels and related global greenhouse gas emission pathways, in the context of strengthening the global response to the threat of climate change, sustainable development, and efforts to eradicate poverty [V. Masson-Delmotte, P. Zhai, H. O. Pörtner, D. Roberts, J. Skea, P. R. Shukla, A. Pirani, W. Moufouma-Okia, C. Péan, R. Pidcock, S. Connors, J. B. R. Matthews, Y. Chen, X. Zhou, M. I. Gomis, E. Lonnoy, T. Maycock, M. Tignor, T. Waterfield (eds.)]. World Meteorological Organization, Geneva, Switzerland, 32 pp. <https://report.ipcc.ch/sr15/pdf/sr15_spm_final.pdf> Accessed August 12th, 2019.
Kala, C. P. (2014). Deluge, disaster and development in Uttarakhand Himalayan region of India:
Challenges and lessons for disaster management. International Journal of Disaster Risk Reduction, 8, 143-152.
Krishnan, R., Shrestha, A.B., Ren, G., Rajbhandari, R., Saeed, S., Sanjay, J., Syed, A., Vellore,
R., Xu, Y., You, Q., & Ren, Y. (2019). Unravelling Climate Change in the Hindu Kush Himalaya: Rapid Warming in the Mountains and Increasing Extremes. In P. Wester, A. Mishra, A. Mukherji, & A. B. Shrestha (Eds.), The Hindu Kush Himalaya Assessment—Mountains, Climate Change, Sustainability and People (pp. 57-91). Spring Nature Switzerland AG.
Lehner, F., & Stocker, T. (2015). From local perception to global perspective. Nature Climate
Change, 5(8), 731-734. Macchi, M., Gurung, A.M., & Hoermann, B. (2015). Community perceptions and responses to
climate variability and change in the Himalayas. Climate and Development, 7(5), 414-425.
Malik, Z. A., Hussain, A., Iqbal, K., & Bhatt, A. B. (2014). Species richness and diversity along
the disturbance gradient in Kedarnath Wildlife Sanctuary and its adjoining areas in Garhwal Himalaya, India. International Journal of Current Research, 6(12), 10918-10926.
25
Mall, R.K., Gupta, A., Singh, R, Singh, R.S., & L.S. Rathore. (2006). Water resources and
climate change: An Indian perspective. Current Science, 90(12), 1610-1626. Manral, U (2018) Kedarnath Wildlife Sanctuary: Nature-Culture linkages in a sacred landscape
in Indian Himalayan Region. In: Ishizawa M, Inaba N, Yoshida M (eds) Proceedings of the Capacity Building Workshop on Nature-Culture Linkages in Heritage Conservation, Asia and the Pacific 2017. Sacred Landscapes. Journal of World Heritage Studies, University of Tsukuba, Japan: University of Tsukuba. Pp 26-33.
Manral, U., Badola, R., & Hussain, S.A. (2017) Forest Composition and Structure Under Various
Disturbance Regimes in the Alaknanda River Basin, Western Himalaya. Mountain Research and Development, 37(3), 310-322.
Maraun, D. and Widmann, M. (2015). The representation of location by a regional climate
model in complex terrain. Hydrol. Earth Syst. Sci. 19, 2449-3456. Meze-Hausken, E. (2004). Contrasting climate variability and meteorological drought with
perceived drought and climate change in northern Ethiopia. Climate Research, 27, 19-31. Mishra, A., Appadurai, A.N., Choudhury, D., Regmi, B.R., Kelkar, U., Alam, M., Chaudhary, P.,
Mu, S.S., Ahmed, A.U., Lotia, H., Fu, C., Mangyel, T., & Sharma, U. (2019). Adaptation to Climate Change in the Hindu Kush Himalaya: Stronger Action Urgently Needed. In P. Wester, A. Mishra, A. Mukherji, & A. B. Shrestha (Eds.), The Hindu Kush Himalaya Assessment—Mountains, Climate Change, Sustainability and People (pp. 457-485). Springer Nature Switzerland AG.
Muccione, V., Salzmann, N., & C. Huggel. (2016). Scientific knowledge and knowledge needs
in climate adaptation policy: A case study of diverse mountain regions. Mountain Research and Development, 36(3), 364-375.
Negi, G.C.S., Samal, P.K., Kuniyal, J.C., Kothyari, B.P., Sharma, R.K., & P.P. Dhyani. (2012).
Impact of climate change on the western Himalayan mountain ecosystems: An overview. Tropical Ecology, 53(3), 345-356.
Ogra, M.V. & R. Badola. (2015). Gender and climate change in the Indian Himalayas: global
threats, local vulnerabilities, and livelihood diversification at the Nanda Devi Biosphere Reserve. Earth System Dynamics, 6, 505-523.
Piya, L., K.L. Maharjan, & N.P. Joshi. (2012). Perceptions and realities of climate change among
the Chepang communities in rural mid-hills of Nepal. Journal of Contemporary India Studies, 2, 35-50.
Prabhakar, B., Sharma, S. S., & Singh, R. L. (2001). Management plan of Kedarnath musk deer
Sanctuary (from 2000-2001 to 2009-2010) Part I and II. Wildlife preservation organization, Forest department, UP.
26
Reyes-García, V., Fernández-Llamazares, Á., Guèze, M., Garcés, A., Mallo, M., Vila-Gómez,
M., & M. Vilaseca. (2015). Local indicators of climate change: The potential contribution of local knowledge to climate research. WIREs Climate Change, 7, 109-124.
Ricke, K.L., & K. Caldeira. (2014). Natural climate variability and future climate policy. Nature
Climate Change, 4, 333-338. Rudiak-Gould, P. (2014). The influence of science communication on indigenous climate change
perception: Theoretical and practical implications. Human Ecology, 42, 75-86. Savo, V., Lepofsky, D., Benner, J.P., Kohfeld, K.E., Bailey, J., & K. Lertzman. (2016).
Observations of climate change among subsistence-oriented communities around the world. Nature Climate Change, 6, 462-474.
Sen, P.K. (1968). Estimates of the regression coefficient based on Kendall’s tau. J. Am. Stat.
Assoc., 63, 1379-1389. Shao, W. (2015). Are actual weather and perceived weather the same? Understanding
perceptions of local weather and their effects on risk perceptions of global warming. Journal of Risk Research, 19(6), 722-742.
Sharma, R.K., & D.G. Shrestha. (2016). Climate perceptions of local communities validated
through scientific signals in Sikkim Himalaya, India. Environmental Monitoring and Assessment, 188, 578.
Shukla, R., K. Sachdeva, & P.K. Joshi (2016) Inherent vulnerability of agricultural communities
in Himalaya: A village-level hotspot analysis in the Uttarakhand state of India. Applied Geography, 74, 182-198.
Shrestha, U.B., Gautam, S., & K.S. Bawa. (2012). Widespread climate change in the Himalayas
and associated changes in local ecosystems. PLoS ONE, 7(5), 1-10. Simelton, E., Quinn, C.H., Batisani, N., Dougill, A.J., Dyer, J.C., Fraser, E.D.G., Mkwambisi,
D., Sallu, S., & L.C. Stringer. (2013). Is rainfall really changing? Farmers’ perceptions, meteorological data, and policy implications. Climate and Development, 5(2), 123-138.
Singh, C., H. Osbar & P. Dorward. (2018). The implications of rural perceptions of water
scarcity on differential adaptation behavior in Rajasthan, India. Regional Environmental Change, 18:2417-2432.
Singh, R.B., & Mal, S. (2014). Trends and variability of monsoon and other rainfall seasons in
Western Himalaya, India. Atmospheric Science Letters, 15, 218-226.
27
South Asia Network on Dams, Rivers and People (SANDRP) (2013). Uttarakhand Rainfall: Since 1901 and in light of the 2013 disaster. < https://sandrp.in/2013/09/25/uttarakhand-rainfall-since-1901-and-in-the-light-of-2013-disaster/>. Accessed August 12th, 2019.
Stock, R., Birkenholtz, T., & Garg, A. (2017). Let the people speak: improving regional
adaptation policy by combining adaptive capacity assessments with vulnerability perceptions of farmers in Gujarat, India. Climate and Development, 11(2), 138-152.
Tripathi, A., & A.K. Mishra. (2017). Knowledge and passive adaptation to climate change: An
example from Indian farmers. Climate Risk Management, 16, 195-207. Uprety, Y., Shrestha, U.B., Rokaya, M.B., Shrestha, S., Chaudary, R.P., THakali, A., Cockfield,
G., & Asselin, H. (2017). Perceptions of climate change by highland communities in the Nepal Himalaya. Climate and Development, 9(7), 649-661.
Vedwan, N. (2006). Culture, Climate and the Evironment: Local Knowledge and Perception of
Climate Change among Apply Growers in Northwestern India. Journal of Ecological Anthropology, 10(1), 4-18.
Vedwan, N., & R.E. Rhoades. (2001). Climate change in the Western Himalayas of India: A
study of local perception and response. Climate Research, 19, 109-117. Xu, J., & Grumbine, R. E. (2014). Building ecosystem resilience for climate change adaptation
in the Asian highlands. WIREs Climate Change, 5, 709-718.

28
ACKNOWLEDMENTS
Research was funded through Gettysburg College (RPD#140648). We thank study participants
for their time and research assistants Umed Rana Singh, Pariva Dobriyal, Tanveer Ahmad, Aftab
Usmani, Marion McKenzie, and Lincoln (Max) Butcher.
29
Table 1: Study area villages.
Village Name Number of Households Surveyed
Minimum Elevation (m)
Maximum Elevation (m)
Proximity to KWS
Bedula 20 1271 1665 Outside
Bhatwari 7 1283 1392 Outside
Buruwa 16 1346 1622 Outside
Chaumansi 10 1926 2354 Inside
Chilond 10 1878 2117 Inside
Gadgu 18 1550 1755 Inside
Gaundar 10 1700 2969 Inside
Jal Malla 15 1463 2043 Outside
Kalimath 16 1221 1335 Outside
Kaviltha 8 1404 1524 Outside
Khonu 8 1608 1700 Outside
Kotma 20 1438 2021 Outside
Mansoona 22 1307 2687 Outside
Ransi 24 1251 2649 Inside
Raulaink 29 1290 1752 Outside
Sansari 18 1068 1305 Outside

30
Table 2: Survey questions and associated climate data sources.
Survey question: “Have you noticed changes in any of the
following environmental
conditions over past 15‐20 years?”
GLDAS‐2.1 Data (2000‐2015)
Tungnath Weather Station
Data (2008‐2010)
Pearson’s R Correlation of monthly GLDAS 2.1 and
Tungnath Weather Station Data
(2008‐2010)
Temperature
(Winter and Summer)
Average surface skin
temperature, ºK Temperature, ºK .95 **
Total Rainfall Rain precipitation rate,
kg/m2/s Rainfall (cm) .85 **
Total Snowfall
Snow precipitation
rate, kg/m2/s Snowfall (cm) .67 **
Snow Cover (NDSI) .64 **
* significant at p<.05 level
** significant at p<.01 level
31
Table 3: Mann‐Kendall (M‐K) Trend and Sen’s Slope Estimate for mean and standard deviation of GLDAS‐2.1 climate variables 2000‐2015.
Climate Variable (Mean)Mann‐Kendall
TrendSig
Sen's Slope Estimate
RMSE Residuals
Annual temperature (C) 3.65 *** 0.22 0.66
Winter temperature (C) 2.47 * 0.20 0.70Summer temperature (C) 2.93 ** 0.26 1.01
Monsoon temperature (C) 3.76 *** 0.27 0.48
Annual Rain precipitation rate (kg/m2/s * million) 2.12 * 0.06 3.45
Winter Rain precipitation rate (kg/m2/s * million) 3.07 ** 0.69 0.46
Summer Rain precipitation rate (kg/m2/s * million) ‐0.23 ‐0.30 11.90Monsoon Rain precipitation rate (kg/m2/s *
million) 1.19 0.96 13.13
Winter Snowfall rate (kg/m2/s * million) 0.11 0.02 1.08
Winter Snow Cover (NDSI) 0.00 0.02 3.28
Climate Variable (Standard Deviation)Mann‐Kendall
TrendSig
Sen's Slope Estimate
RMSE Residuals
Annual temperature (C) 3.02 ** 0.10 0.42
Winter temperature (C) 1.64 0.09 0.54
Summer temperature (C) 2.03 * 0.14 0.70Monsoon temperature (C) 1.98 * 0.09 0.63
Annual Rain precipitation rate (kg/m2/s * million) 2.12 * 0.57 3.45Winter Rain precipitation rate (kg/m2/s * million) 3.18 ** 2.84 20.12
Summer Rain precipitation rate (kg/m2/s * million) ‐0.14 ‐0.89 48.78Monsoon Rain precipitation rate (kg/m2/s *
million) 1.19
2.14 32.37
Winter Snowfall rate (kg/m2/s * million) 1.39 1.52 15.67Winter Snow Cover (NDSI) 0.11 0.02 3.28
* significant at p<.05 level
** significant at p<.01 level

Table 4: Agreement of perceptions and climate data
Survey Variable Modal perception of change (15‐20 years leading up to 2015)
Monotonic change in climate data (2000‐2015)
Agreement
Summer Temperature Increase (53%) Increase ** Yes
Winter Temperature No Change (51%) Increase ** No
Total Rainfall Increase (82%) Increase * Yes
Total Snowfall Decrease (79%) No Change No
* significant at p<.05 level
** significant at p<.01 level

1
Table 5: Percentile of recent years within time series.
Climate Variable 2013 2014 2015 Average
Annual Temperature 100% 93% * 97%
Winter Temperature 64% 85% 75% 75%
Summer Temperature 93% 80% 33% 69%
Monsoon Temperature 100% 77% * 88%
Annual Rainfall Rate 100% 60% * 80%
Winter Rainfall Rate 57% 100% 92% 83%
Summer Rainfall Rate 100% 27% 73% 67%
Monsoon Rainfall Rate 36% 50% * 43%
Winter Snowfall Rate 73% 33% 60% 56%
Winter Snow Cover 54% 85% * 69%
* Excluded (post‐survey)


0.0%
10.0%
20.0%
30.0%
40.0%
50.0%
60.0%
70.0%
80.0%
90.0%
100.0%
average summertemperature (n=250)
average wintertemperature (n=249)
total annual rainfall(n=251)
total annual snowfall(n=252)
increase decrease no change don't know

-5
0
5
10
15
20
2000 2002 2004 2006 2008 2010 2012 2014
Tem
per
atu
re (
C)
Summer Winter Monsoon
Linear (Summer) Linear (Winter) Linear (Monsoon)
0
0.2
0.4
0.6
0.8
1
1.2
1.4
1.6
1.8
2
2000 2002 2004 2006 2008 2010 2012 2014 2016
Rai
nfa
ll R
ate
(kg/
m2
/s)
x 10
-5
Year

0
0.2
0.4
0.6
0.8
1
1.2
1.4
2000 2002 2004 2006 2008 2010 2012 2014 2016
Sno
wfa
ll R
ate
(kg/
m2
/s)
x 1
0-5
Year
0
1,000
2,000
3,000
4,000
5,000
6,000
7,000
-2 -1.5 -1 -0.5 0 0.5 1
Elev
atio
n (
m)
Slope of NDSI

0
1,000
2,000
3,000
4,000
5,000
6,000
7,000
-1.5 -1 -0.5 0 0.5 1 1.5 2 2.5 3 3.5
Elev
atio
n (
m)
Slope of NDSI