Climate Change in the Great Lakes - Great Lakes Integrated...
24
Climate Change in the Great Lakes Photo: Dan Brown
Transcript of Climate Change in the Great Lakes - Great Lakes Integrated...

Climate Change in the
Great Lakes
Photo: Dan Brown
Great Lakes Integrated Sciences & Assessments

NOAA Regional Integrated
Sciences & Assessments (RISA)
“supports research teams
that conduct innovative,
interdisciplinary, user-
inspired, and regionally
relevant research that
informs resource
management, planning,
and public policy. ”

4
GLISA’s Approach
ServiceResearch Integration
Collaboration
Extension
• Interpret existing information and data for stakeholders
• Provide locally relevant climate synthesis:– What has happened?
– What could happen?
– What are the impacts?
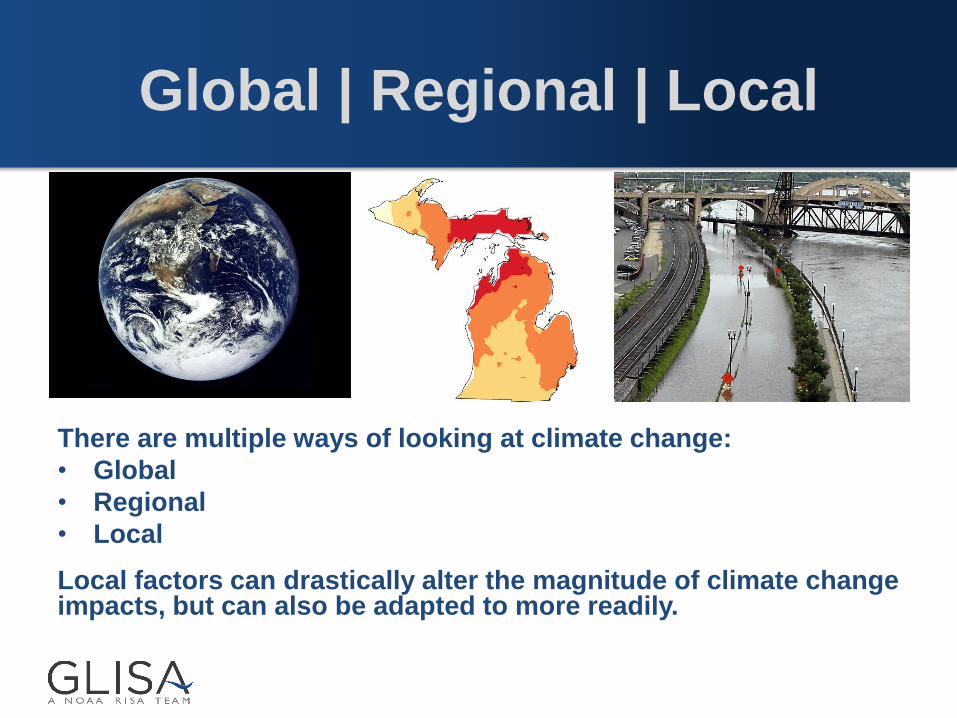
There are multiple ways of looking at climate change:
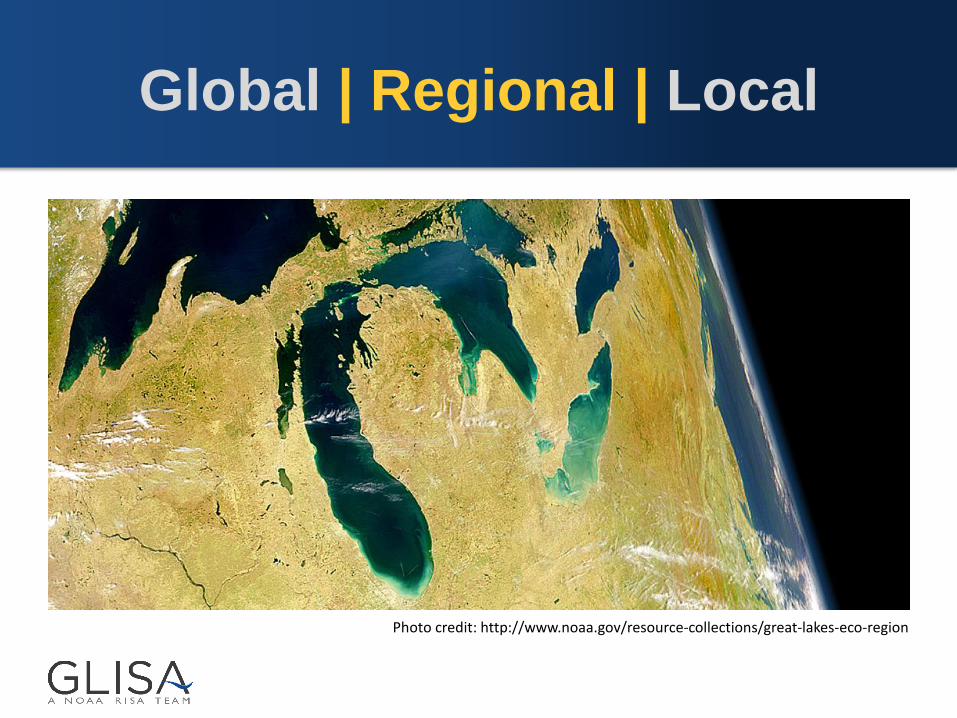
• Global
• Regional
• Local
Local factors can drastically alter the magnitude of climate change impacts, but can also be adapted to more readily.
Global | Regional | Local
Global | Regional | Local
Photo credit: http://www.noaa.gov/resource-collections/great-lakes-eco-region
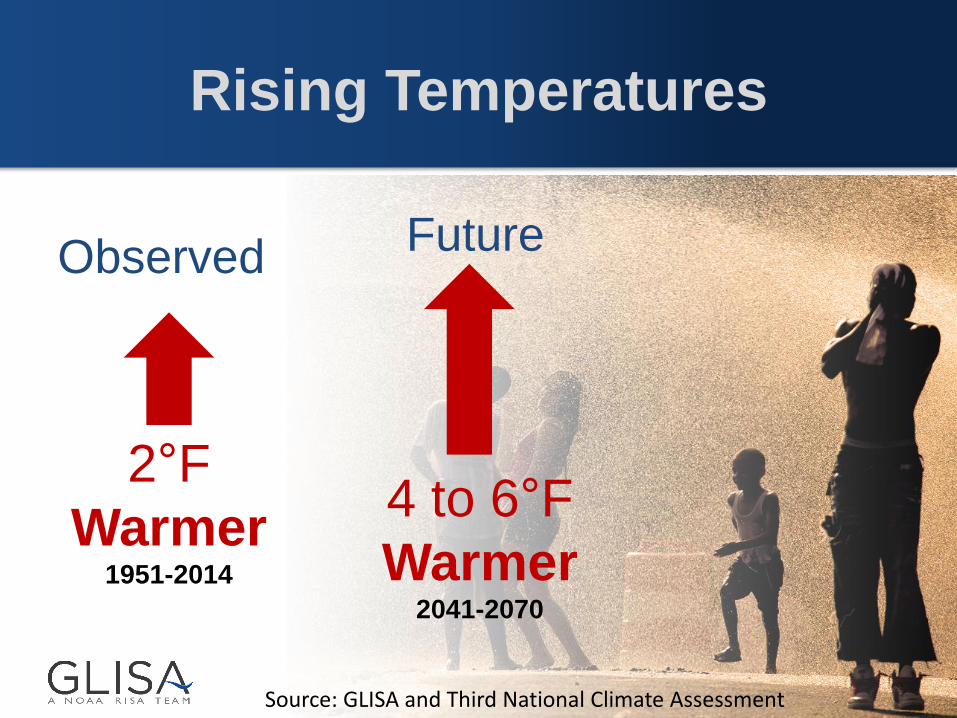
Rising Temperatures
2°F
Warmer1951-2014
Observed
4 to 6°F
Warmer2041-2070
Future
Source: GLISA and Third National Climate Assessment

Winters are Warming Faster
2.8°F increase during
winter (December – February)
2°F increase averaged
over the entire year
Source: GLISA and Third National Climate Assessment
Photo: Dan Brown

Warming Winters
Photo: Dan Brown
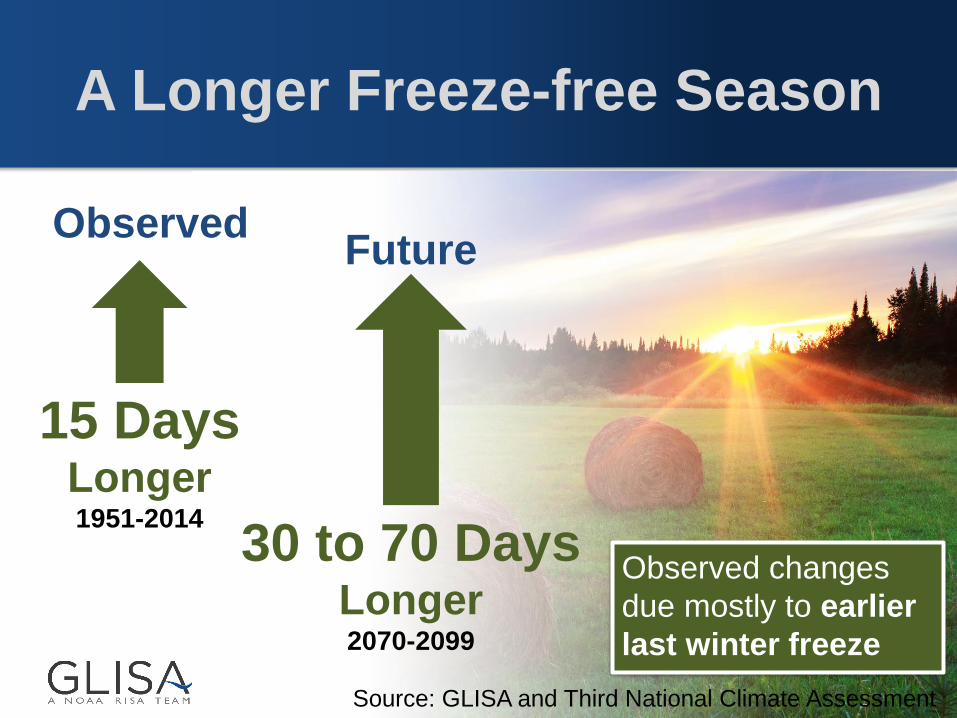
A Longer Freeze-free Season
Observed
30 to 70 Days Longer2070-2099
Observed changes
due mostly to earlier
last winter freeze
Future
15 Days Longer1951-2014
Source: GLISA and Third National Climate Assessment

Extreme Heat and Humidity
By mid-century, models project Michigan
could see:
90°F Days0 to 80 more days per year
95°F Days0 to 30 more days per year*
But, it is unclear if there has been a significant
observed change in hot days.

Source: National Climatic Data Center
Changes are calculated from linear best fits of annual totals from 1951-2014.
Uneven changes
across the Region:
SE MI (+17%)
Western UP (-1%)
Total annual precipitation
has increased by:
11.9%
More Precipitation

Source: National Climatic Data Center
Changes are calculated from linear best fits of annual totals from 1951-2014.
Nuisance flooding and
minor damages are
reported more frequently
after these events
1.25-inch
Precipitation Days:
34.7%
More Extreme Precipitation

Change in Snowfall
Photo: Kim Channell
Snowfall has
increased in
lake-effect
areas
Snowfall has
remained
stable or
decreased
throughout
southern
parts of the
region

A Migrating Climate
The climate future
generations
experience will be
fundamentally different
than the climate today.
Courtesy UCS 2009, original work by Hayhoe et al.
By the end of this
century, Michigan
summers will feel more
like current summers in
Arkansas.

Impacts
Photo: Dan Brown
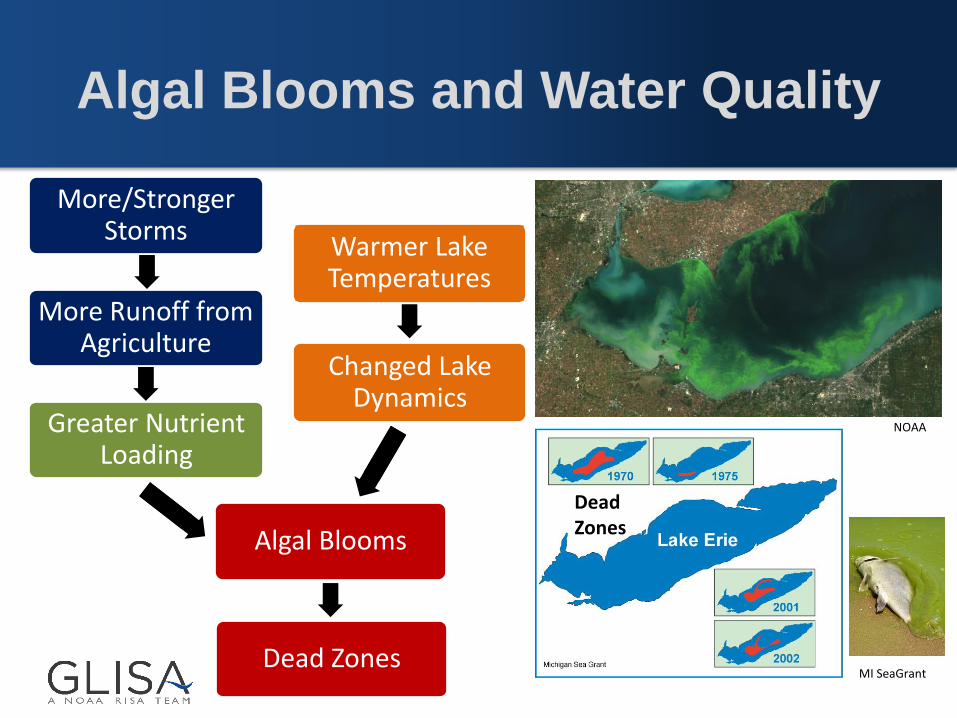
Algal Blooms and Water Quality
NOAA
MI SeaGrant
Dead Zones
More/Stronger Storms
Warmer Lake Temperatures
Changed Lake Dynamics
More Runoff from Agriculture
Greater Nutrient Loading
Algal Blooms
Dead Zones

Stormwater Impacts
With increased extreme
precipitation events,
intense, flashy runoff
amplify flooding risks.
Ontario
Spring 17’
Flood
U.S. Army National Guard

Lake Levels
• Declined since record highs in the 1980s and
increased again recently (2015)
• While most models project continued declines in long-
term lake levels, there remains significant uncertainty.
• Short-term variability and periods of high lake levels
are still anticipated.
Photo: Kim Channell
Average

Impacts of Lake Levels
• Boating and recreation
• Shipping and navigation
• Property
• Fisheries and wetlands
Photos: Kim Channell

Impacts of Declining Great
Lakes Ice Cover
• Fishing Industry: Ice cover protects whitefish spawning areas. Great Lakes commercial fishing is $4 billion industry.
• Coastal Zone: In nearshore areas, ice provides stable platform for recreation and protects wetland areas from erosion.
• Water Levels and Navigation: Heavy ice cover can reduce evaporation and contribute to higher water levels in the following seasons—good news for shipping.

Potential Impacts on Shipping
Every lost inch of water
depth:
– Reduces cargo capacity
50-270 tons
– Costs $10k-30k per transit.
…but less lake ice
cover allows for a
longer shipping
season

• Forest ecosystems forced northward– Maple-Beech-Birch forest displaced
• Amplified stressors on biodiversity– Declining Coldwater fish populations,
species migrating northward
• Agriculture– Longer growing season
– Water availability, warm spells, spring freezes, flooding, and drought will reduce crop yields
Plants and Wildlife