Climate Change Impacts on Rain-fed Agriculture and Crop ... Center/documents... · Climate Change...
24
Climate Change Impacts on Rain-fed Agriculture and Crop Yields in the Niger Basin Aondover Tarhule and Uvirkaa Akumaga Dept. of Geography and Environmental Sustainability, University of Oklahoma
-
Upload
trinhkhanh -
Category
Documents
-
view
214 -
download
0
Transcript of Climate Change Impacts on Rain-fed Agriculture and Crop ... Center/documents... · Climate Change...

Climate Change Impacts on Rain-fed Agriculture and Crop Yields in the Niger Basin
Aondover Tarhule and Uvirkaa Akumaga Dept. of Geography and
Environmental Sustainability, University of Oklahoma

Importance of Rain-fed Agriculture
Represents 95% of cultivated land area.
Accounts for 35% of GDP, on average.
Employs 70% of the population. (FAOSTAT, 2005).
Very risky due to variable rainfall, dry spells, recurrent droughts, long dry seasons, floods, or extreme rainfall.
Limited to no insurance in SSA against weather hazards and extremes.
Majority of famers have small farm holdings of < 2 ha.
Poor investments; < 10% of investments in irrigated agriculture.
While irrigation is critical and necessary, it will NOT
by itself alone assure food security because of
constraints related to affordability of water, access
and tenure to irrigation lands, and inertia on the part
of farmers to convert from rain-fed agricultural
systems to irrigation.
Therefore, in order to achieve maximum impact for
food security, climate risk assessment and climate
adaptation (planning and management) must include both irrigated and rain-fed agriculture.
Large scale or widespread irrigation outside riparian
environments highly unlikely in SSA due to the size
and yield of groundwater aquifers as well as the lack
of investment.
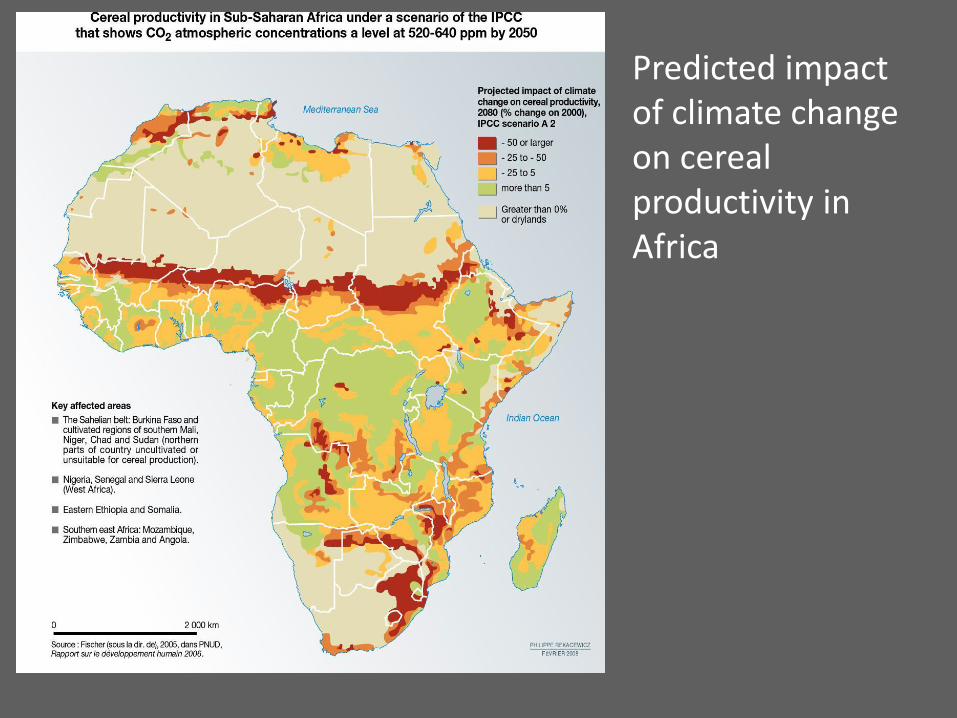
Predicted impact of climate change on cereal productivity in Africa
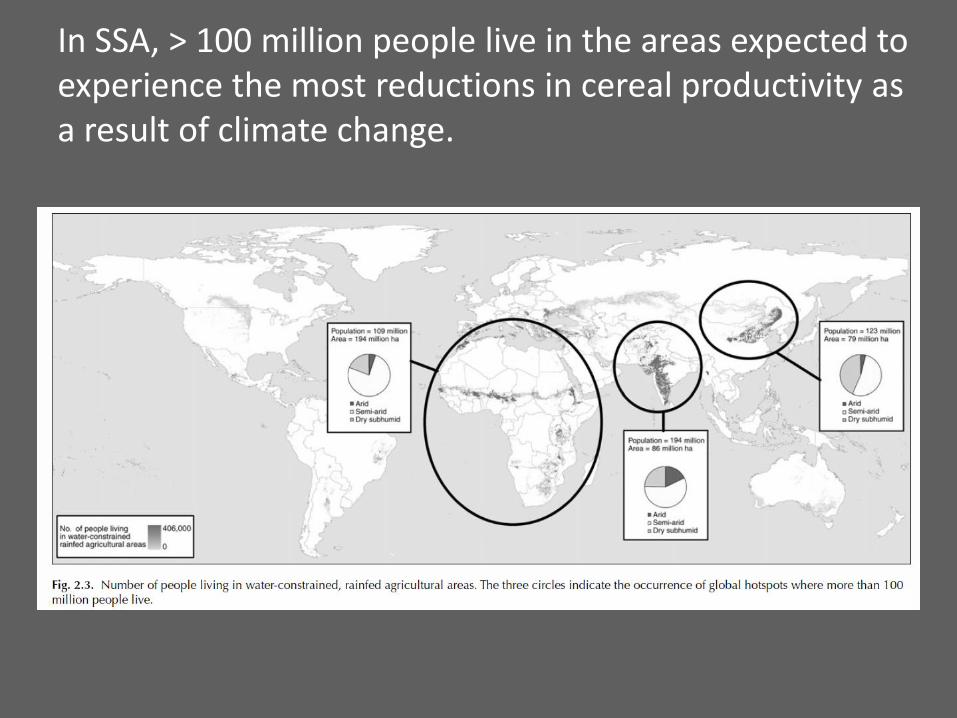
In SSA, > 100 million people live in the areas expected to experience the most reductions in cereal productivity as a result of climate change.

Even without climate change, cereal yields in most SSA countries are only about 35% of potential, creating a “yields gap” due to inefficient management methods, soil nutrient status and climate risks.
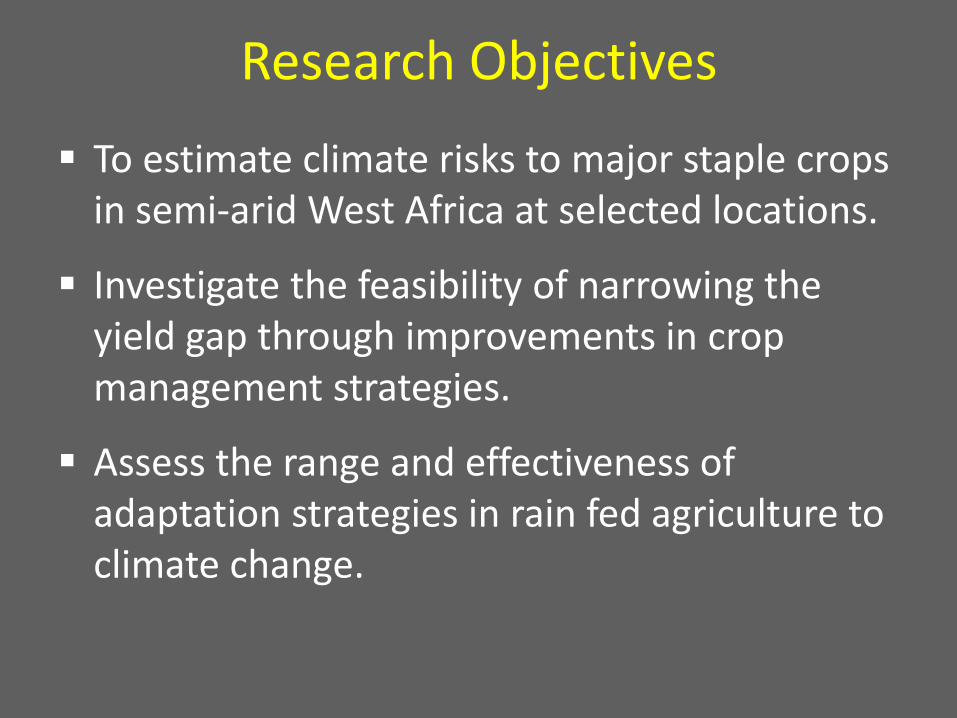
Research Objectives
To estimate climate risks to major staple crops in semi-arid West Africa at selected locations.
Investigate the feasibility of narrowing the yield gap through improvements in crop management strategies.
Assess the range and effectiveness of adaptation strategies in rain fed agriculture to climate change.

http://upload.wikimedia.org/wikipedia/commons/f/f0/Grain_millet,_early_grain_fill,_Tifton,_7-3-02.jpg
Millet
Sorghum Corn
Cowpeas
www.worldofteaching.com
10
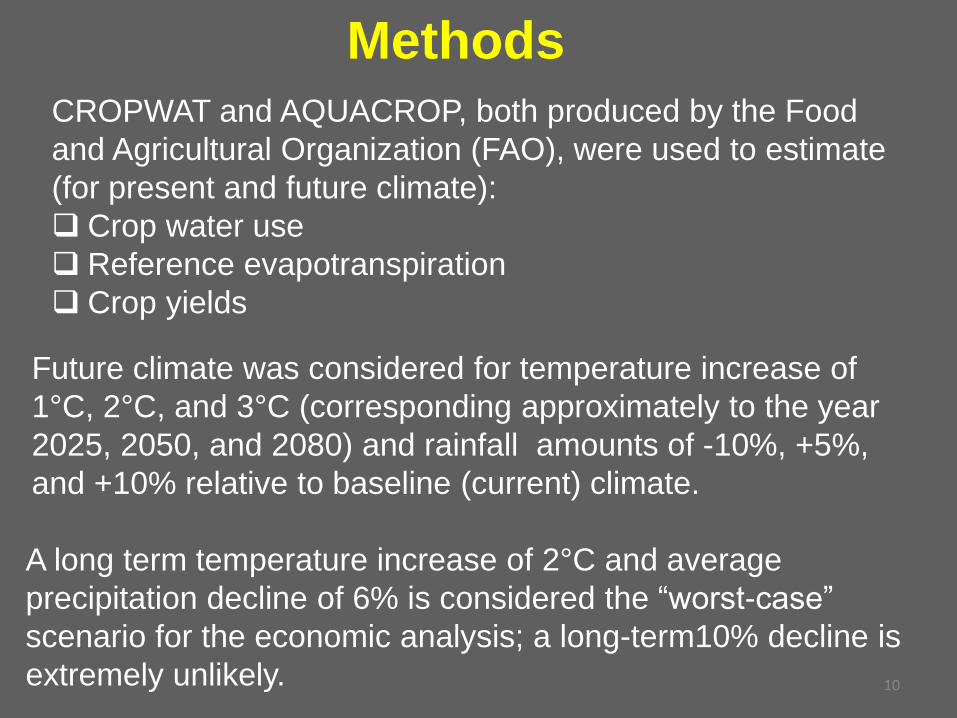
Methods
CROPWAT and AQUACROP, both produced by the Food
and Agricultural Organization (FAO), were used to estimate
(for present and future climate):
Crop water use
Reference evapotranspiration
Crop yields
Future climate was considered for temperature increase of
1°C, 2°C, and 3°C (corresponding approximately to the year
2025, 2050, and 2080) and rainfall amounts of -10%, +5%,
and +10% relative to baseline (current) climate.
A long term temperature increase of 2°C and average
precipitation decline of 6% is considered the “worst-case”
scenario for the economic analysis; a long-term10% decline is
extremely unlikely.

Required input: daily maximum and minimum air temperatures, rainfall, (ETo), and the mean annual (CO2) concentration in the atmosphere.
Simulates attainable crop biomass and harvestable yield in response to water available (therefore may overestimate relative to actual).
Application: to compare attainable against actual yields to identify the constraints limiting crop production, serving as a benchmarking tool.
Pests and diseases are not considered
12
Methods
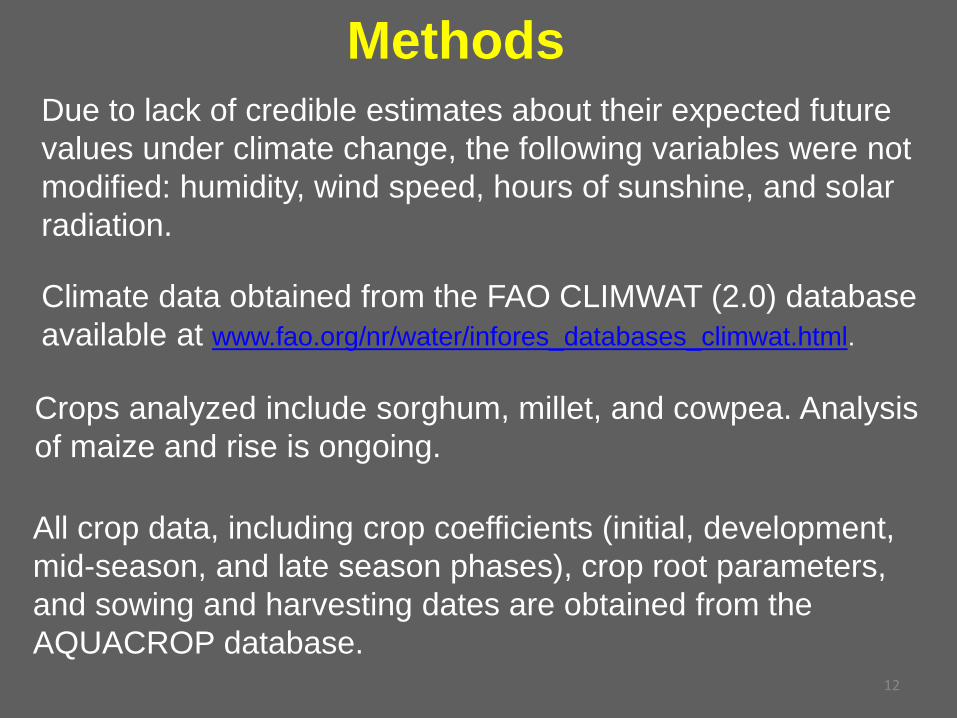
Climate data obtained from the FAO CLIMWAT (2.0) database
available at www.fao.org/nr/water/infores_databases_climwat.html.
All crop data, including crop coefficients (initial, development,
mid-season, and late season phases), crop root parameters,
and sowing and harvesting dates are obtained from the
AQUACROP database.
Crops analyzed include sorghum, millet, and cowpea. Analysis
of maize and rise is ongoing.
Due to lack of credible estimates about their expected future
values under climate change, the following variables were not
modified: humidity, wind speed, hours of sunshine, and solar
radiation.

y = 2.7493x - 17 R² = 0.9778
-100
-80
-60
-40
-20
0
20
40
60
-22.5 -17.5 -12.5 -7.5 -2.5 2.5 7.5 12.5 17.5 22.5
Yie
ld (
∆%
)
PCP (∆%)
Dori-Sorghum
y = -6.7143x - 2.0607 R² = 0.933 -100
-80
-60
-40
-20
0
0 0.5 1 1.5 2 2.5 3 3.5 4 4.5 5
Yie
ld (
∆%
)
Temp ∆ (°C)
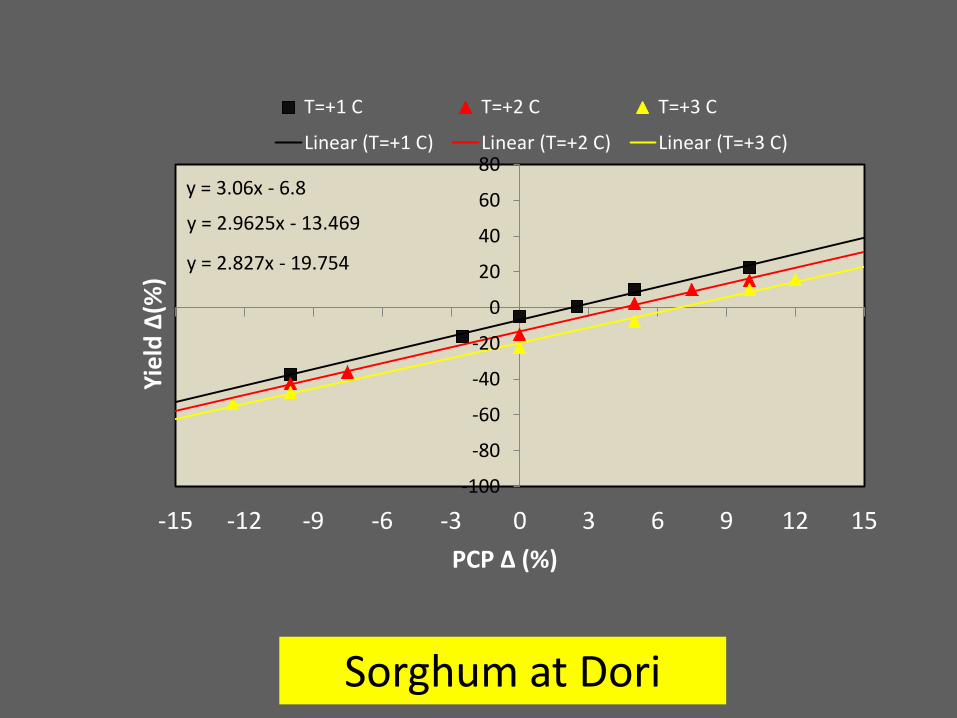
y = 3.06x - 6.8
y = 2.9625x - 13.469
y = 2.827x - 19.754
-100
-80
-60
-40
-20
0
20
40
60
80
-15 -12 -9 -6 -3 0 3 6 9 12 15
Yie
ld ∆
(%)
PCP ∆ (%)
T=+1 C T=+2 C T=+3 C
Linear (T=+1 C) Linear (T=+2 C) Linear (T=+3 C)
Sorghum at Dori

y = 2.2321x - 12.216 R² = 0.9427
-100
-80
-60
-40
-20
0
20
40
60
-22.5 -17.5 -12.5 -7.5 -2.5 2.5 7.5 12.5 17.5 22.5
Yie
ld(∆
%)
PCP (∆%)
Dori-Millet
y = -6.8302x - 3.0604 R² = 0.9861
-100
-80
-60
-40
-20
0
0.0 0.5 1.0 1.5 2.0 2.5 3.0 3.5 4.0 4.5 5.0
Mil
let
Yie
ld (
∆%
)
Temp ∆ (°C)
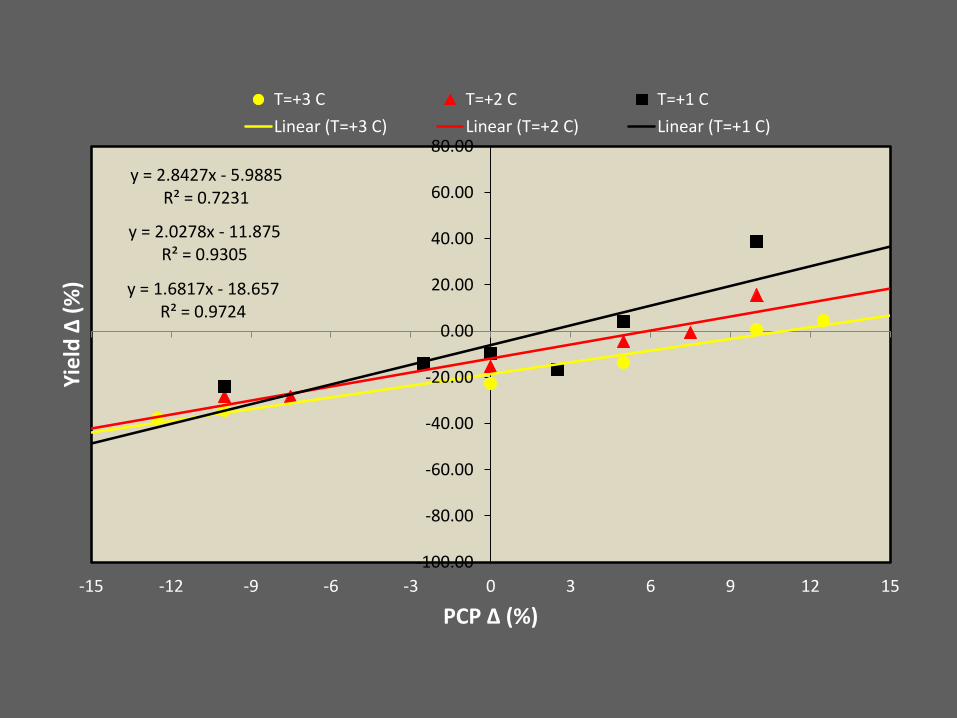
y = 1.6817x - 18.657 R² = 0.9724
y = 2.0278x - 11.875 R² = 0.9305
y = 2.8427x - 5.9885 R² = 0.7231
-100.00
-80.00
-60.00
-40.00
-20.00
0.00
20.00
40.00
60.00
80.00
-15 -12 -9 -6 -3 0 3 6 9 12 15
Yie
ld ∆
(%
)
PCP ∆ (%)
T=+3 C T=+2 C T=+1 C
Linear (T=+3 C) Linear (T=+2 C) Linear (T=+1 C)

Preliminary conclusions These results suggest that:
a +1% change in PCP leads to a +3% change in yield.
+1°C change in temp leads to between -6% and -8% change in yield.
Questions:
How do the above rates of change compare to historical periods of rainfall variability?
What are the corresponding rates of yield changes in other ecological zones and crops?
What is the effect on yields of simultaneously varying temperature and precipitation?
How do other factors, such as planting and harvesting dates, soil nutrient management, mulching etc, impact crop yields and what is their utility as climate change adaptation measures?

Source: Mohammed, B.A. 2011. Climate cahnge risks in Sahelian Africa. Reg Environ Change (2011) 11 (Suppl 1):S109–S117 DOI 10.1007/s10113-010-0172-y
0.00
0.20
0.40
0.60
0.80
1.00
1.20
0.00
0.20
0.40
0.60
0.80
1.00
1.20
1.401
96
1
19
64
19
67
19
70
19
73
19
76
19
79
19
82
19
85
19
88
19
91
19
94
19
97
20
00
20
03
20
06
20
09
Mill
et
Yie
lds
(to
ns/
ha)
Sorg
hu
m Y
ield
s (t
on
s/h
a)
Years
Sorghum
Millet
Source: FAOSTATS, 2012
Increasing yields despite decreasing rainfall
Management more important than climate change???

Crop Yield Elasticity
Proportionate change in yield due to changes in temperature and precipitation.
Log-Linear Y-P-T model:
Y = ea Pb Tc,
or in the log-linear domain:
ln (Y) = a + b ln (P) + c ln (T)
Y=yield
P=precipitation
T=Temperature

The parameters b and c (shape factors) could be obtained from (see Pike and Turkey, 1954)
(Q-μQ)/μQ = b (P-μP)/μP + c (T-μT)/μT
b = εP = (CvQ/CvP) [(ρQP – ρPT.ρQT)/(1-ρPT2)]
c = εT = (CvQ/CvT) [(ρQT – ρPT.ρQP)/(1-ρPT2)]
a = μQ / [Σ Pb/n] = scale factor
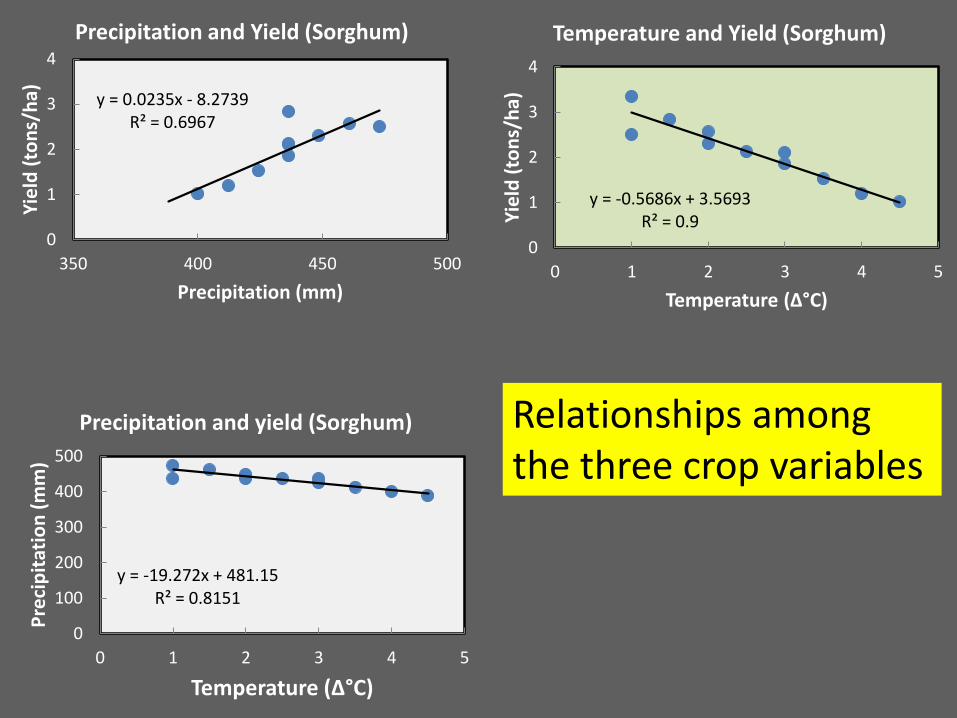
y = 0.0235x - 8.2739 R² = 0.6967
0
1
2
3
4
350 400 450 500
Yie
ld (
ton
s/h
a)
Precipitation (mm)
Precipitation and Yield (Sorghum)
y = -0.5686x + 3.5693 R² = 0.9
0
1
2
3
4
0 1 2 3 4 5
Yie
ld (
ton
s/h
a)
Temperature (∆°C)
Temperature and Yield (Sorghum)
y = -19.272x + 481.15 R² = 0.8151
0
100
200
300
400
500
0 1 2 3 4 5
Pre
cip
itat
ion
(m
m)
Temperature (∆°C)
Precipitation and yield (Sorghum) Relationships among the three crop variables

y = 0.6282e0.547x R² = 0.9104
0
1
2
3
4
5
0 1 2 3 4
Q-P
-T S
imu
late
d Y
ield
s
Aquacrop Yields (tons/ha)
Series1
Expon. (Series1)
0
1
2
3
4
5
1 2 3 4 5 6 7 8 9 10 11
Yie
ld (
ton
s/h
a)
Yield Step
Aquacrop
Q-P-T

Preliminary findings a +1% change in PCP leads to a +3% change in yield.
+1°C change in temp leads to between -6% and -8% change in yield.
The method allows us to establish the Yield sensitivity to precipitation and temperature change but more analysis is needed to be definitive.
Historical patterns suggest that field management options may be more important than climate change at least within narrow ranges.
The method appears feasible as a first pass approach to estimating the impacts of climate change on crop yields.

Thank You!


![Effects of Simulated Sulfuric Acid Rain on Crop Plants - [email protected] Home](https://static.fdocuments.us/doc/165x107/61fb1def2e268c58cd5a5893/effects-of-simulated-sulfuric-acid-rain-on-crop-plants-emailprotected.jpg)