Climate change impacts in the Mediterranean resulting … · Climate change impacts in the...
21
Climate change impacts in the Mediterranean resulting from a 2 o C global temperature rise A report for WWF 1 July 2005 C. Giannakopoulos, M. Bindi, M. Moriondo and T. Tin
Transcript of Climate change impacts in the Mediterranean resulting … · Climate change impacts in the...
Climate change impacts in the Mediterranean resulting from a 2oC global temperature rise
A report for WWF
1 July 2005
C. Giannakopoulos, M. Bindi, M. Moriondo and T. Tin
Published in July 2005 by WWF, the global conservation organization, Gland, Switzerland. Any reproduction in full or in part of this publication must mention the title and credit the above-mentioned publisher as the copyright owner. © text (2005) WWF. All rights reserved. The geographical designations in this report do not imply the expression of any opinion whatsoever on the part of WWF concerning the legal status of any country, territory, or area, or concerning the delimination of its frontiers or boundaries.
B
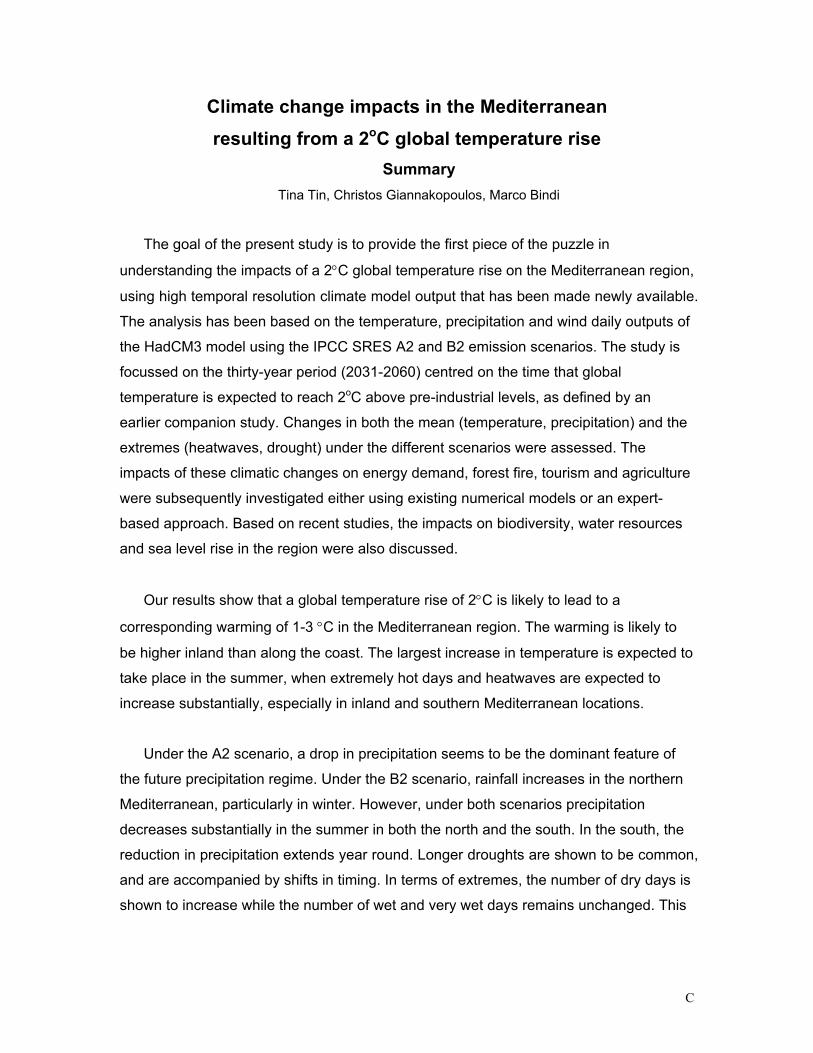
Climate change impacts in the Mediterranean resulting from a 2oC global temperature rise
Summary Tina Tin, Christos Giannakopoulos, Marco Bindi
The goal of the present study is to provide the first piece of the puzzle in
understanding the impacts of a 2°C global temperature rise on the Mediterranean region,
using high temporal resolution climate model output that has been made newly available.
The analysis has been based on the temperature, precipitation and wind daily outputs of
the HadCM3 model using the IPCC SRES A2 and B2 emission scenarios. The study is
focussed on the thirty-year period (2031-2060) centred on the time that global
temperature is expected to reach 2oC above pre-industrial levels, as defined by an
earlier companion study. Changes in both the mean (temperature, precipitation) and the
extremes (heatwaves, drought) under the different scenarios were assessed. The
impacts of these climatic changes on energy demand, forest fire, tourism and agriculture
were subsequently investigated either using existing numerical models or an expert-
based approach. Based on recent studies, the impacts on biodiversity, water resources
and sea level rise in the region were also discussed.
Our results show that a global temperature rise of 2°C is likely to lead to a
corresponding warming of 1-3 °C in the Mediterranean region. The warming is likely to
be higher inland than along the coast. The largest increase in temperature is expected to
take place in the summer, when extremely hot days and heatwaves are expected to
increase substantially, especially in inland and southern Mediterranean locations.
Under the A2 scenario, a drop in precipitation seems to be the dominant feature of
the future precipitation regime. Under the B2 scenario, rainfall increases in the northern
Mediterranean, particularly in winter. However, under both scenarios precipitation
decreases substantially in the summer in both the north and the south. In the south, the
reduction in precipitation extends year round. Longer droughts are shown to be common,
and are accompanied by shifts in timing. In terms of extremes, the number of dry days is
shown to increase while the number of wet and very wet days remains unchanged. This
C
can imply that when it rains it will rain more intensely and strongly, especially at certain
locations in the northern Mediterranean.
Based on the above climatic variables, we calculated the Canadian Fire Weather
Index to provide an indication of the forest fire risk under the future climate scenarios.
Under both A2 and B2 scenarios, fire risk is shown to increase nearly everywhere in the
Mediterranean region, especially in inland locations. The southern Mediterranean is at
risk of forest fire all year round. In the Iberian Peninsula, northern Italy and over the
Balkans, the period of extreme fire risk lengthens substantially. The only region that
shows little change in fire risk is in the southeastern Mediterranean.
Based on the same climatic data, we investigated the changes in agricultural crop
yields using a well-established numerical model. Our results show a general reduction in
crop yields (e.g. C3 and C4 summer crops, legumes, cereals, tuber crops). The southern
Mediterranean is likely to experience an overall reduction of crop yields due to the
change in climate. In some locations in the northern Mediterranean, the effects of
climate change and its associated increase in carbon dioxide may have little or small
positive impacts on yields, provided that additional water demands can be met. The
adoption of specific crop management options (e.g. changes in sowing dates or cultivars)
may help in reducing the negative responses of agricultural crops to climate change.
However, such options could require up to 40% more water for irrigation, which may or
may not be available in the future.
We calculated heating degree days (HDD) and cooling degree days (CDD) in order
to examine the change in heating and cooling requirements. Under both climate
scenarios, HDD decreases substantially in the northern Mediterranean and CDD
increases everywhere in the Mediterranean, especially in the south. This change can
potentially shift the peak in energy demand to the summer season with implications for
the need for additional energy capacity and increased stress on water resources.
Changes to tourism in the Mediterranean were examined through discussions with
experts and stakeholders. We expect that warmer northern European summers would
encourage northern Europeans to take domestic holidays and thus, not travel to the
Mediterranean. In addition, more frequent and intense heat waves and drought are likely
D
E
to discourage holidays in the Mediterranean in the summer. We expect that the
Mediterranean holiday season may shift to spring and autumn.
Based on results from existing studies, a global warming of 2°C and its associated
reduction in precipitation are expected to reduce surface runoff and water yields in the
Mediterranean region. In some countries, this could result in water demand exceeding
available water supply. In terms of biodiversity, climate change is likely to lead to shifts in
the distributions and abundances of species, potentially increasing the risks of extinction.
In addition, forest fires are expected to encourage the spread of invasive species which
in turn, have been shown to fuel more frequent and more intense forest fires.
Acknowledgments
The authors would like to thank Clare Goodess, Bob Bunce, Rafael Navarro, Antonio
Navarra, Riccardo Valentini, Michael Case and Lara Hansen for their comments on
earlier drafts of this report. Special thanks goes to Clare Goodess for her help during the
initial phase of the project, and to Mark New, Daniel Scott and Jacqueline Hamilton for
their helpful discussions.

F
Contents::
Page
C Summary
1 Climate change impacts on the Mediterranean resulting from a 2°C
temperature rise.
54 Impact of a 2° C global temperature rise on the Mediterranean
region: Agriculture analysis assessment.
G
Impact of a 2° C global temperature rise on the Mediterranean region: Agriculture analysis assessment.
M. Bindi & M. Moriondo Department of Agronomy and Land Management, Florence, Italy
d changes in ime-slice
3 and C4 severe in the
ing is likely to
locations in ange and its associated increase in
CO2 may have little or small positive impacts on yields, provided that additional water demands can be met. The adoption of specific crop management options (e.g. changes in sowing dates or cultivars) may help in reducing the negative responses of agricultural crops to climate change. However, such options could require up to 40% more water for irrigation, which may or may not be available in the future.
Summary The climate change impact analysis on agriculture showed that the expectetemperature and precipitation for SRES-IPCC scenarios A2 and B2 in the t2031-2060 determined a general reduction in yield of agricultural crops (e.g. Csummer crops, legumes, cereals, tuber crops). Reductions in yields are moresouthern Mediterranean than in the northern Mediterranean, even when the fertilizeffect of increased CO2 is taken into account. The southern Mediterranean experience an overall reduction of crop yields due to climate change. In somethe northern Mediterranean, the effects of climate ch
54
Materia
1 2
3 4 5
6 7
1
ls
imulation Hadley Centre.
rise on the ered to
narios were (SRES)
greenhouse gas emission; ii)
different areas of p simulation
model (i.e. CropSyst) to reproduce crop yields, the data reported in the FAOSTAT tries.
ep crop e soil water budget,
el allows etic
leaf area index, n management,
to simulate crop
ent between d,
alysis hirteen grid cells (called ‘hot
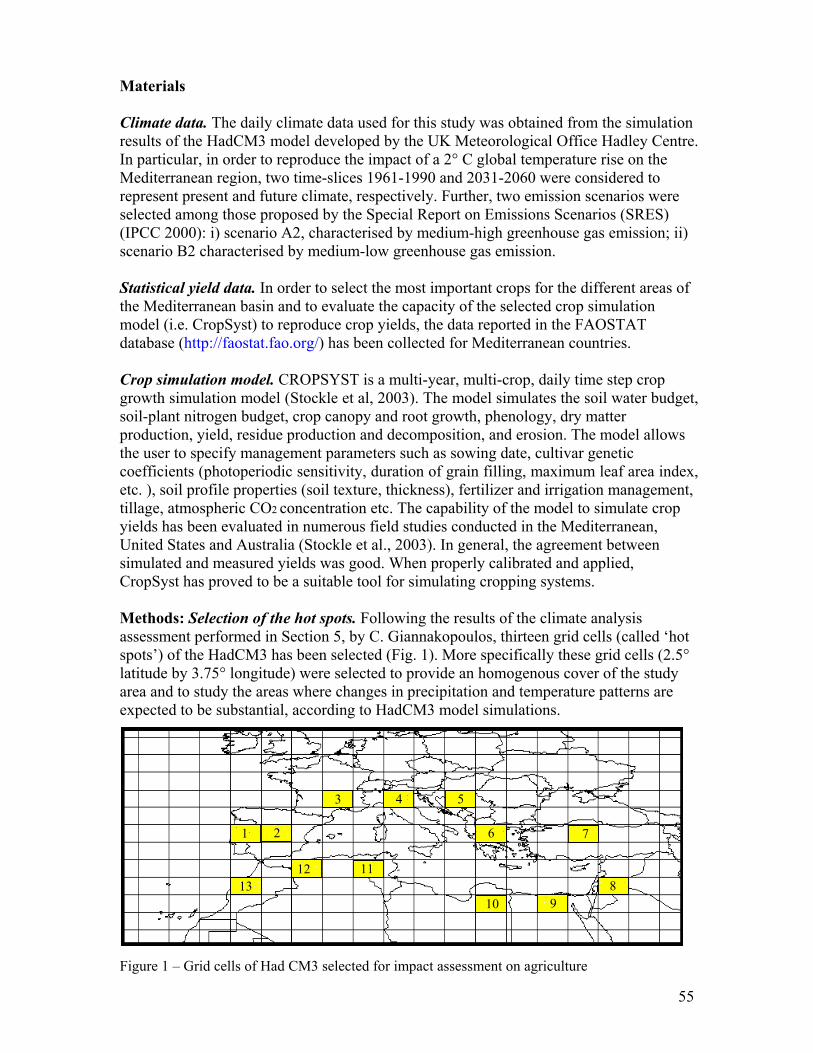
spots’) of the HadCM3 has been selected (Fig. 1). More specifically these grid cells (2.5° latitude by 3.75° longitude) were selected to provide an homogenous cover of the study area and to study the areas where changes in precipitation and temperature patterns are expected to be substantial, accordin odel simulations.
Figure 1 – Grid cells
Climate data. The daily climate data used for this study was obtained from the sresults of the HadCM3 model developed by the UK Meteorological Office In particular, in order to reproduce the impact of a 2° C global temperatureMediterranean region, two time-slices 1961-1990 and 2031-2060 were considrepresent present and future climate, respectively. Further, two emission sceselected among those proposed by the Special Report on Emissions Scenarios (IPCC 2000): i) scenario A2, characterised by medium-high scenario B2 characterised by medium-low greenhouse gas emission. Statistical yield data. In order to select the most important crops for the the Mediterranean basin and to evaluate the capacity of the selected cro
database (http://faostat.fao.org/) has been collected for Mediterranean coun Crop simulation model. CROPSYST is a multi-year, multi-crop, daily time stgrowth simulation model (Stockle et al, 2003). The model simulates thsoil-plant nitrogen budget, crop canopy and root growth, phenology, dry matter production, yield, residue production and decomposition, and erosion. The modthe user to specify management parameters such as sowing date, cultivar gencoefficients (photoperiodic sensitivity, duration of grain filling, maximumetc. ), soil profile properties (soil texture, thickness), fertilizer and irrigatiotillage, atmospheric CO2 concentration etc. The capability of the modelyields has been evaluated in numerous field studies conducted in the Mediterranean, United States and Australia (Stockle et al., 2003). In general, the agreemsimulated and measured yields was good. When properly calibrated and applieCropSyst has proved to be a suitable tool for simulating cropping systems. Methods: Selection of the hot spots. Following the results of the climate anassessment performed in Section 5, by C. Giannakopoulos, t
g to HadCM3 m
2
of Had CM3 selected
for i mpact asse ssme90
nt on agriculture
8
55
1
11
1 3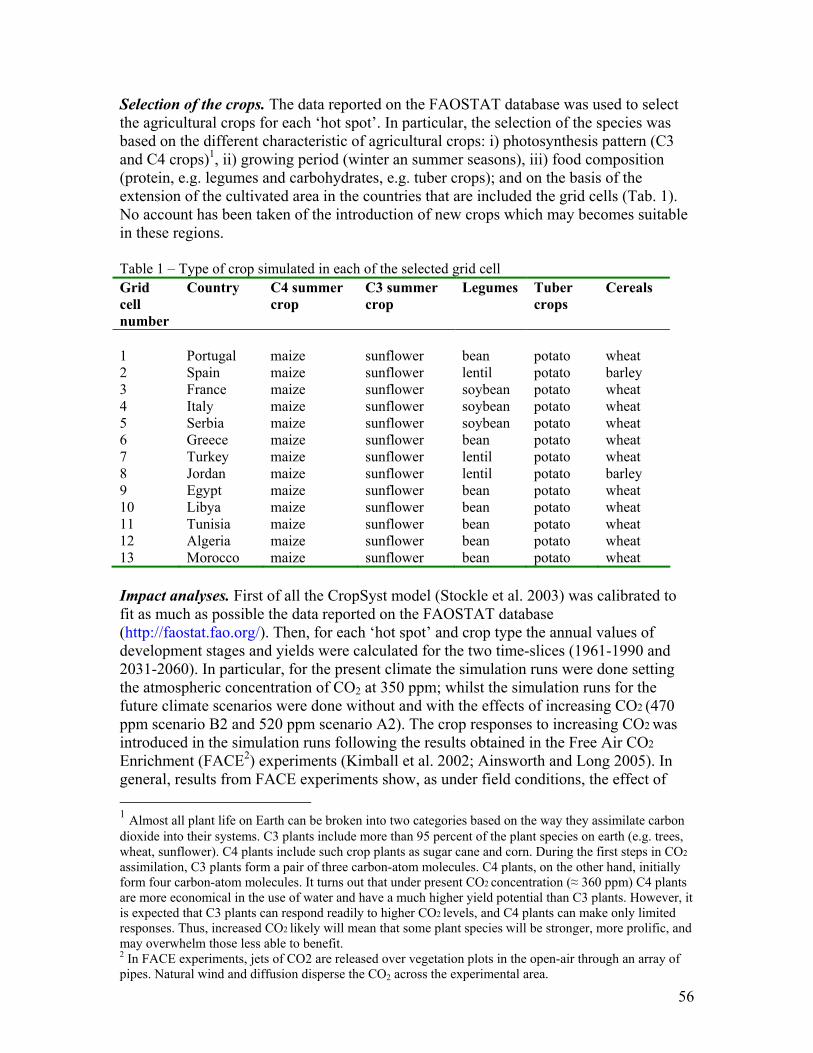
Selection of the crops. The data reported on the FAOSTAT database was usthe agricultural crops for each ‘hot spot’. In particular, the selection of the spbased on the different characteristic of agricultural crops: i) photosynthesisand C4 crops)1, ii) growing period (winter an summer seasons), iii) food(protein, e.g. legumes and carbohydrates, e.g. tuber crops); and on the basis oextension of the cultivated area in the countries that are included the grid cellsNo account ha
ed to select ecies was
pattern (C3 composition
f the (Tab. 1).
s been taken of the introduction of new crops which may becomes suitable
ble 1 – Type of cr ulated i of the selected grid
cell numbe
Country C4 summer crop
C3 summer crop
Legumes Tuber Cereals
in these regions. TaGrid
op sim n each cell
r crops
m sun er an potato m sun er ntil potato m sun er ybean potato m sun er ybean potato m sun er ybean potato m sun er an potato
7 Turk m sun er ntil potato 8 Jord m sun er ntil potato 9 Egypt m sun er an potato
1 Portugal aize flow be wheat 2 Spain aize flow le barley 3 France aize flow so wheat 4 Italy aize flow so wheat 5 Serbia aize flow so wheat 6 Greece aize flow be wheat
ey aize flow le wheat an aize flow le barley aize flow be wheat
10 Libya maize sunflower bean potato wheat
potato wheat wheat
11 Tunisia maize sunflower bean potato wheat 12 Algeria maize sunflower bean 13 Morocco maize sunflower bean potato Impact analyses. First of all the CropSyst model (Stockle et al. 2003) was cafit as much as possible the data
librated to
lues of 1990 and
one setting s for the
future climate scenarios were done without and with the effects of increasing CO2 (470 CO2 was r CO2
005). In ffect of
reported on the FAOSTAT database (http://faostat.fao.org/). Then, for each ‘hot spot’ and crop type the annual vadevelopment stages and yields were calculated for the two time-slices (1961-2031-2060). In particular, for the present climate the simulation runs were dthe atmospheric concentration of CO2 at 350 ppm; whilst the simulation run
ppm scenario B2 and 520 ppm scenario A2). The crop responses to increasingintroduced in the simulation runs following the results obtained in the Free AiEnrichment (FACE2) experiments (Kimball et al. 2002; Ainsworth and Long 2general, results from FACE experiments show, as under field conditions, the e 1 Almost all plant life on Earth can be broken into two categories based on the way they assimdioxide into their systems. C3 plants
ilate carbon include more than 95 percent of the plant species on earth (e.g. trees,
t steps in CO2
plants, on the other hand, initially form four carbon-atom molecules. It turns out that under present CO2 concentration (≈ 360 ppm) C4 plants are more economical in the use of water and have a much higher yield potential than C3 plants. However, it is expected that C3 plants can respond readily to higher CO2 levels, and C4 plants can make only limited responses. Thus, increased CO2 likely will mean that some plant species will be stronger, more prolific, and may overwhelm those less able to benefit. 2 In FACE experiments, jets of CO2 are released over vegetation plots in the open-air through an array of pipes. Natural wind and diffusion disperse the CO2 across the experimental area.
wheat, sunflower). C4 plants include such crop plants as sugar cane and corn. During the firsassimilation, C3 plants form a pair of three carbon-atom molecules. C4
56
CO2 on crop yields is significantly lower than that obtained in controlled environmental studies.
strategies (e.g. f climate r crops (i.e.
t the rest rainfed crops”. Moreover, all the crops were considered
fully fertilised (i.e. no nitrogen stress).
t climate ported in
mer crop, the different
ica which is expected to have lower water availability. Whilst for the irrigated crops (C4 summer
re less
apacity of ach
error is the ses and can
ths study. put with
for individual grid cells while the statistical data from FAO has been collected at the nation level. The climate
on over a gical trend,
pest and disease stresses, etc.) that cannot be reproduced by the model.
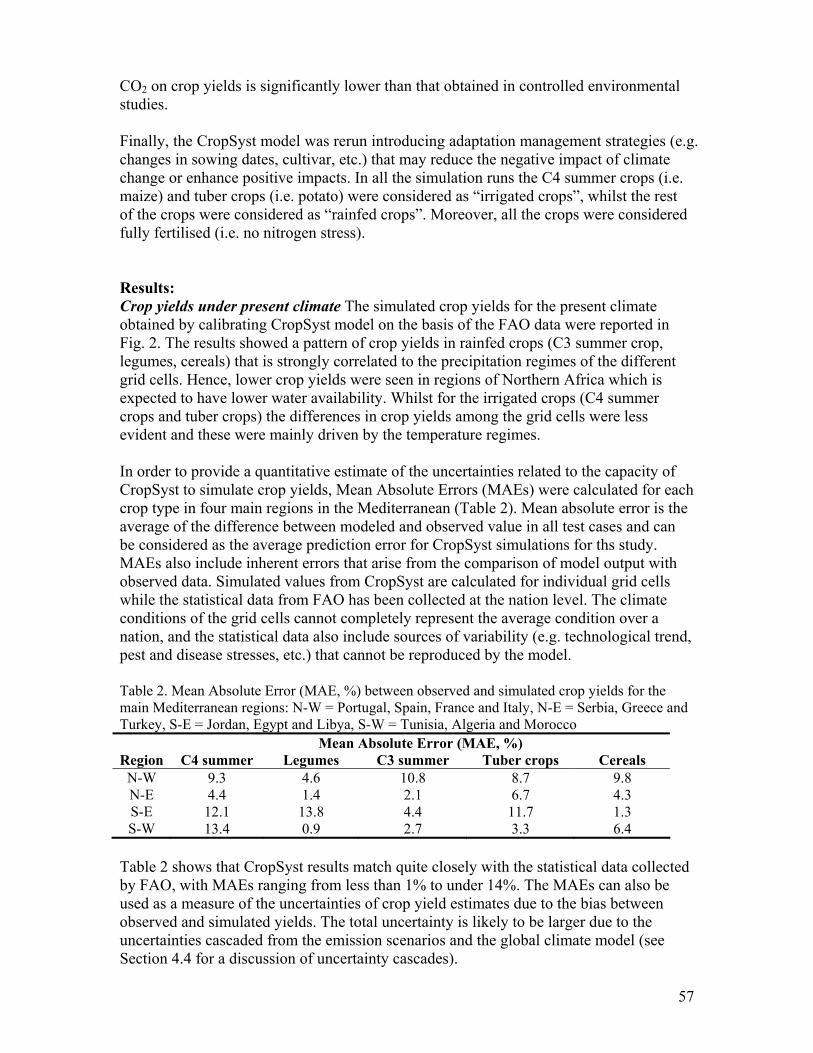
e 2. M Absolute r (MAE, % een observ nd simulated crop yields for the Medi nean regi N-W = Por l, Spain, France and Italy, N-E = Serbia, Greece and ey, S ordan, E nd Libya, sia, Algeria and Morocco
Mean olute Error
Finally, the CropSyst model was rerun introducing adaptation managementchanges in sowing dates, cultivar, etc.) that may reduce the negative impact ochange or enhance positive impacts. In all the simulation runs the C4 summemaize) and tuber crops (i.e. potato) were considered as “irrigated crops”, whilsof the crops were considered as “
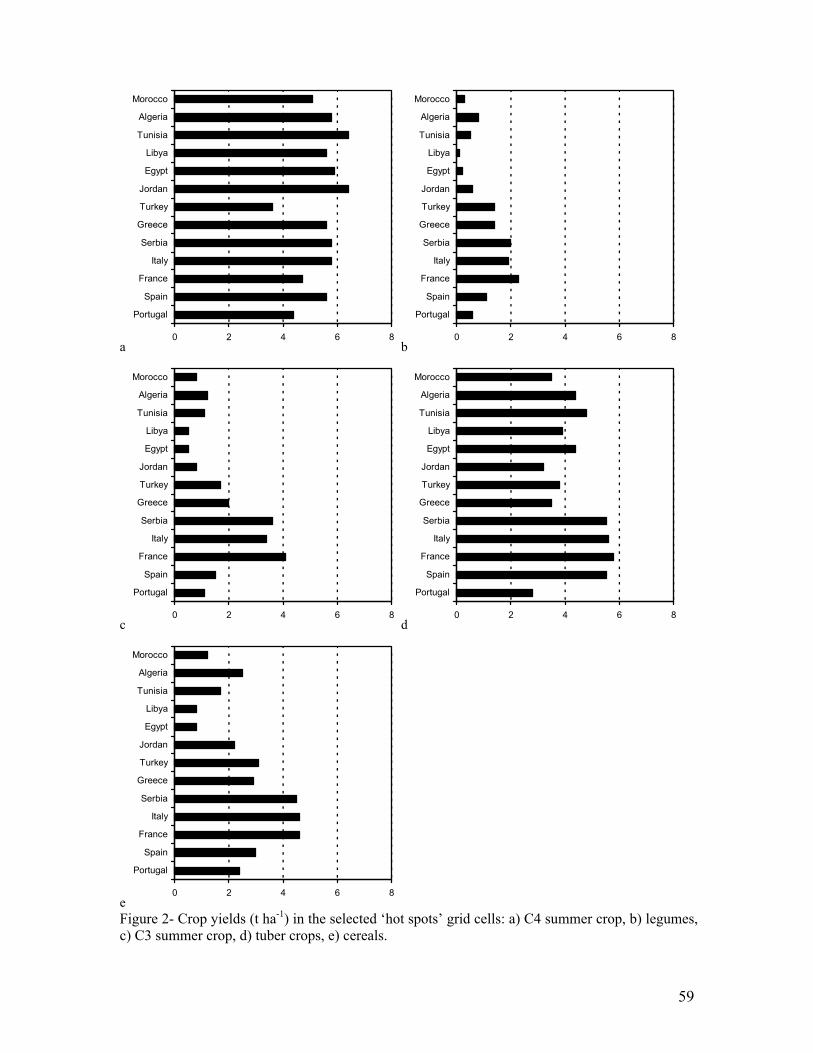
Results: Crop yields under present climate The simulated crop yields for the presenobtained by calibrating CropSyst model on the basis of the FAO data were reFig. 2. The results showed a pattern of crop yields in rainfed crops (C3 sumlegumes, cereals) that is strongly correlated to the precipitation regimes ofgrid cells. Hence, lower crop yields were seen in regions of Northern Afr
crops and tuber crops) the differences in crop yields among the grid cells weevident and these were mainly driven by the temperature regimes. In order to provide a quantitative estimate of the uncertainties related to the cCropSyst to simulate crop yields, Mean Absolute Errors (MAEs) were calculated for ecrop type in four main regions in the Mediterranean (Table 2). Mean absoluteaverage of the difference between modeled and observed value in all test cabe considered as the average prediction error for CropSyst simulations forMAEs also include inherent errors that arise from the comparison of model outobserved data. Simulated values from CropSyst are calculated
conditions of the grid cells cannot completely represent the average conditination, and the statistical data also include sources of variability (e.g. technolo
Tabl ean Erro ) betw ed amain terra ons: tugaTurk -E = J gypt a S-W = Tuni
Abs (MAE, %) Region C4 summer Legumes C3 summer Tuber crops Cereals
.8 N-W 9.3 4.6 10.8 8.7 9N-E 4.4 1.4 2.1 6.7 S-E 12.1 13.8 4.4 11.7 S-W 13.4 0.9 2.7 3.3
4.3 1.3 6.4
Table 2 shows that CropSyst results match quite closely with the statistical data collected by FAO, with MAEs ranging from less than 1% to under 14%. The MAEs can also be used as a measure of the uncertainties of crop yield estimates due to the bias between observed and simulated yields. The total uncertainty is likely to be larger due to the uncertainties cascaded from the emission scenarios and the global climate model (see Section 4.4 for a discussion of uncertainty cascades).
57
Changes in crop yields without the effect of CO2
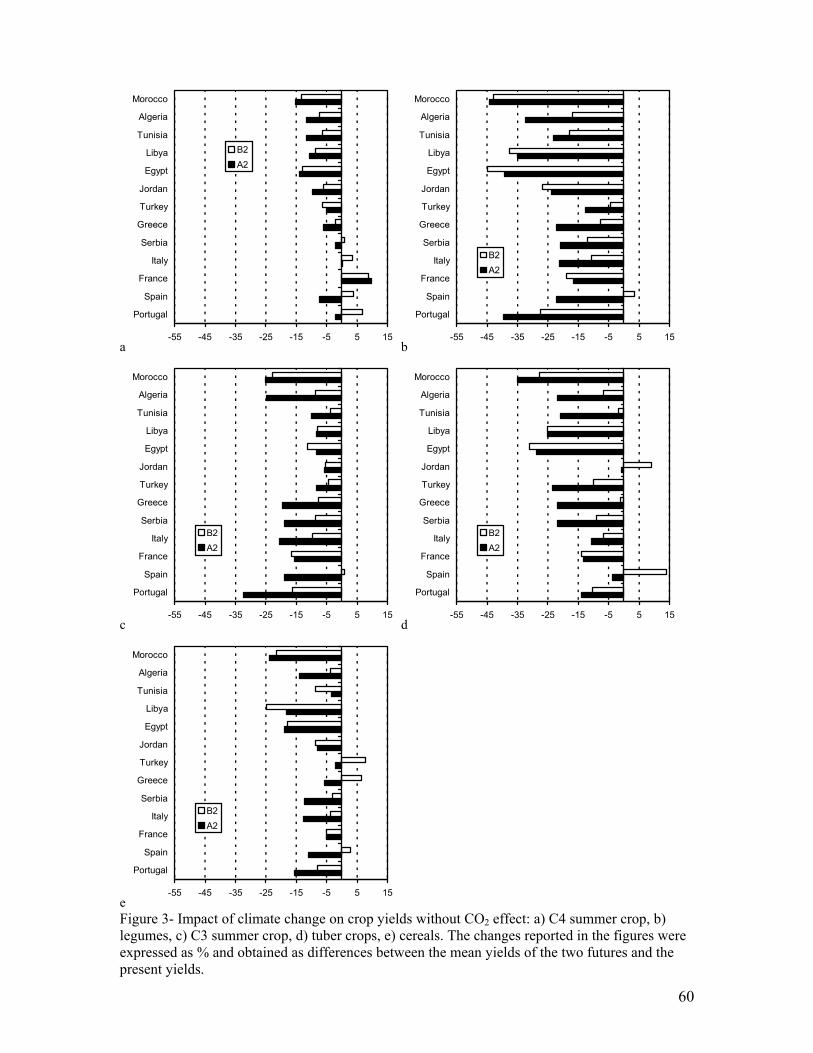
The results of the CropSyst simulation runs (without including the effect of Cpresent and future climate scenar
O2) for io were reported in Fig. 3. On the basis of the different
ion of yields es (e.g.
5% (Morocco) e) in B2
ith the as very small. More
2 scenario
s in all the grid se was very small.
in A2
rops showed a general reduction of yields in all the grid cells with s ranges from +15% (Spain)
eneral reduction of yields, even if in a few grid cells the yields increased (Turkey, Greece and Spain). More specifically these changes ranges
a) to +8%
l the ‘hot
ermined a lopment) (Tab.
higher in reductions in
precipitation are expected to be higher during the summer periods. Moreover, in general the reductions were higher in A2 scenarios, since for this scenario larger changes in temperature (increase) and precipitation (reduction) regimes were expected. However, the results from the two scenarios agree closely in terms of maximum decreases in yields.
crop types these are the main results: - C4 summer crops. C4 summer crops showed an almost systematic reductwith the exception of a few grid cells located in the EU-Mediterranean countriItaly, France, Spain and Portugal). More specifically, these ranges from -1to + 10% (France) in A2 scenario and from -13% (Morocco) to +9% (Francscenarios (Fig. 3a). - Legumes. Legumes showed a general reduction of yields in all the grid cells wexception of that on Spain, where, however, the increase wspecifically, these changes ranges from -44% (Morocco) to -13% (Turkey) in Aand from -45% (Egypt) to +3% (Spain) in B2 scenarios (Fig. 3b). - C3 summer crops. C3 summer crops showed a general reduction of yieldcells with the exception of that on Spain, where, however, the increaMore specifically, these changes ranges from -32% (Portugal) to -6% (Jordan)scenario and from -23% (Morocco) to +1% (Spain) in B2 scenarios (Fig. 3c). - Tuber crops. Tuber cthe exception of those on Jordan and Spain. More specifically these change-35% (Morocco) to -1% (Jordan) in A2 scenario and from -31% (Egypt) toin B2 scenarios (Fig. 3d). - Cereals. Cereals showed a g
from -23% (Morocco) to -2% (Turkey) in A2 scenario and from -24% (Liby(Turkey) in B2 scenarios (Fig.3e). The general picture showed a substantial reduction for all the crop types in alspots’ grid cells. This was due to the increases in temperature and reduction inprecipitation predicted for both future climate scenarios (A2 and B2), that detreduction of the length of the growing period (i.e. higher rate of crop deve3) and the water available for crop growth, respectively. These decreases were summer and not irrigated crops (e.g. C3 summer crops, legumes), since the
58
0 2 4 6
Portugal
Spain
France
Italy
Serbia
Greece
Turkey
Jordan
Egypt
Libya
Tunisia
Algeria
Morocco
8b
0 2 4 6
Portugal
Spain
France
Italy
Serbia
Greece
Turkey
Jordan
Egypt
Libya
Tunisia
Algeria
Morocco
a8
c0 2 4 6
Portugal
Spain
France
Italy
Serbia
Greece
Turkey
Jordan
Egypt
Libya
Tunisia
Algeria
Morocco
8d
0 2 4 6
Portugal
Spain
France
Italy
Serbia
Greece
Turkey
Jordan
Egypt
Libya
Tunisia
Algeria
Morocco
8
e0 2 4 6
Portugal
Spain
Serbia
Greece
Turkey
Jordan
Egypt
Libya
Tunisia
Algeria
Morocco
France
Italy
8
Figure 2- Crop yields (t ha-1) in the selected ‘hot spots’ grid cells: a) C4 summer crop, b) legumes, c) C3 summer crop, d) tuber crops, e) cereals.
59
-55 -45 -35 -25 -15 -5 5 15
Portugal
Spain
France
Italy
Serbia
Greece
Turkey
Jordan
Egypt
Libya
Tunisia
Algeria
Morocco
B2A2
b-55 -45 -35 -25 -15 -5 5 15
Portugal
Spain
France
Italy
Serbia
Greece
Turkey
Jordan
Egypt
Libya
Tunisia
Algeria
Morocco
B2A2
a
-55 -45 -35 -25 -15 -5 5 15
Portugal
Spain
France
Italy
Serbia
Greece
Turkey
Jordan
Egypt
Libya
Tunisia
Algeria
Morocco
B2A2
d-55 -45 -35 -25 -15 -5 5 15
Portugal
Spain
France
Italy
Serbia
Greece
Turkey
Jordan
Egypt
Libya
Tunisia
Algeria
Morocco
B2A2
c
e-55 -45 -35 -25 -15 -5 5 15
Serbia
Greece
Turkey
Jordan
Egypt
Libya
Tunisia
Algeria
Morocco
Figure 3- Impact of climate change on crop yields without CO2 effect: a) C4 summer crop, b) legumes, c) C3 summer crop, d) tuber crops, e) cereals. The changes reported in the figures were expressed as % and obtained as differences between the mean yields of the two futures and the present yields.
Portugal
Spain
France
Italy B2A2
60
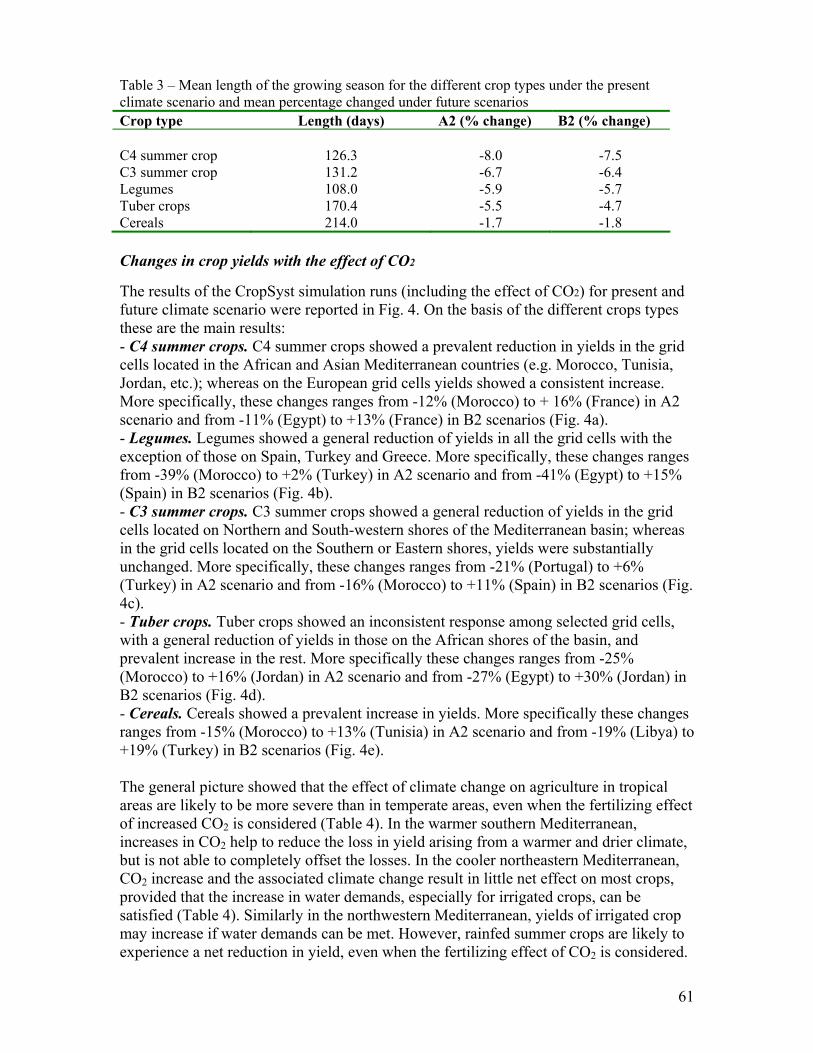
Table 3 – Mean length of the growing season for the different crop types under the present cenario and me hange ce
Crop type Length (days) A2 (% change) B2 (% change) climate s an percentage c d under future s narios
C4 summer crop 126.3 -8.0 -7.5
mer crop 131.2 -6.7 -6.4 108.0 -5.9 -5.7
crops 170.4 -5.5 -4.7 -1.7 -1.8
C3 sumLeguTuber
mes
Cereals 214.0
Syst simulation runs (including the effect of CO2) for present and ops types
lds in the grid , Tunisia,
increase. ce) in A2
a general reduction of yields in all the grid cells with the
anges ranges ) to +15%
the grid ls located on Northern and South-western shores of the Mediterranean basin; whereas
antially al) to +6% B2 scenarios (Fig.
r crops showed an inconsistent response among selected grid cells, nd
cenario and from -27% (Egypt) to +30% (Jordan) in
e changes m -19% (Libya) to
n tropical lizing effect an, er climate,
but is not able to completely offset the losses. In the cooler northeastern Mediterranean, CO2 increase and the associated climate change result in little net effect on most crops, provided that the increase in water demands, especially for irrigated crops, can be satisfied (Table 4). Similarly in the northwestern Mediterranean, yields of irrigated crop may increase if water demands can be met. However, rainfed summer crops are likely to experience a net reduction in yield, even when the fertilizing effect of CO2 is considered.
Changes in crop yields with the effect of CO2 The results of the Cropfuture climate scenario were reported in Fig. 4. On the basis of the different crthese are the main results: - C4 summer crops. C4 summer crops showed a prevalent reduction in yiecells located in the African and Asian Mediterranean countries (e.g. MoroccoJordan, etc.); whereas on the European grid cells yields showed a consistentMore specifically, these changes ranges from -12% (Morocco) to + 16% (Franscenario and from -11% (Egypt) to +13% (France) in B2 scenarios (Fig. 4a). - Legumes. Legumes showedexception of those on Spain, Turkey and Greece. More specifically, these chfrom -39% (Morocco) to +2% (Turkey) in A2 scenario and from -41% (Egypt(Spain) in B2 scenarios (Fig. 4b). - C3 summer crops. C3 summer crops showed a general reduction of yields in celin the grid cells located on the Southern or Eastern shores, yields were substunchanged. More specifically, these changes ranges from -21% (Portug(Turkey) in A2 scenario and from -16% (Morocco) to +11% (Spain) in4c). - Tuber crops. Tubewith a general reduction of yields in those on the African shores of the basin, aprevalent increase in the rest. More specifically these changes ranges from -25%(Morocco) to +16% (Jordan) in A2 sB2 scenarios (Fig. 4d). - Cereals. Cereals showed a prevalent increase in yields. More specifically thesranges from -15% (Morocco) to +13% (Tunisia) in A2 scenario and fro+19% (Turkey) in B2 scenarios (Fig. 4e). The general picture showed that the effect of climate change on agriculture iareas are likely to be more severe than in temperate areas, even when the fertiof increased CO2 is considered (Table 4). In the warmer southern Mediterraneincreases in CO2 help to reduce the loss in yield arising from a warmer and dri
61
-40 -30 -20 -10 0 10 20 30
Portugal
Spain
France
Italy
Serbia
Greece
Turkey
Jordan
Egypt
Libya
Tunisia
Algeria
Morocco
B2A2
b-40 -30 -20 -10 0 10 20 30
Portugal
Spain
France
Italy
Serbia
Greece
Turkey
Jordan
Egypt
Libya
Tunisia
Algeria
Morocco
B2A2
a
c-40 -30 -20 -10 0 10 20 30
Portugal
Spain
France
Italy
Serbia
Greece
Turkey
Jordan
Egypt
Libya
Tunisia
Algeria
Morocco
B2A2
d-40 -30 -20 -10 0 10 20 30
Portugal
Spain
France
Italy
Serbia
Greece
Turkey
Jordan
Egypt
Libya
Tunisia
Algeria
Morocco
B2A2
e
-40 -30 -20 -10 0 10 20 30
Portugal
Serbia
Greece
Turkey
Jordan
Egypt
Libya
Tunisia
Algeria
Morocco
Figure 4- Impact of climate change on crop yields with CO2 effect: a) C4 summer crop, b) legumes, c) C3 summer crop, d) tuber crops, e) cereals. The changes reported in the figures were expressed as % and obtained as differences between the mean yields of the two futures and the present yields.
Spain
France
Italy B2A2
62
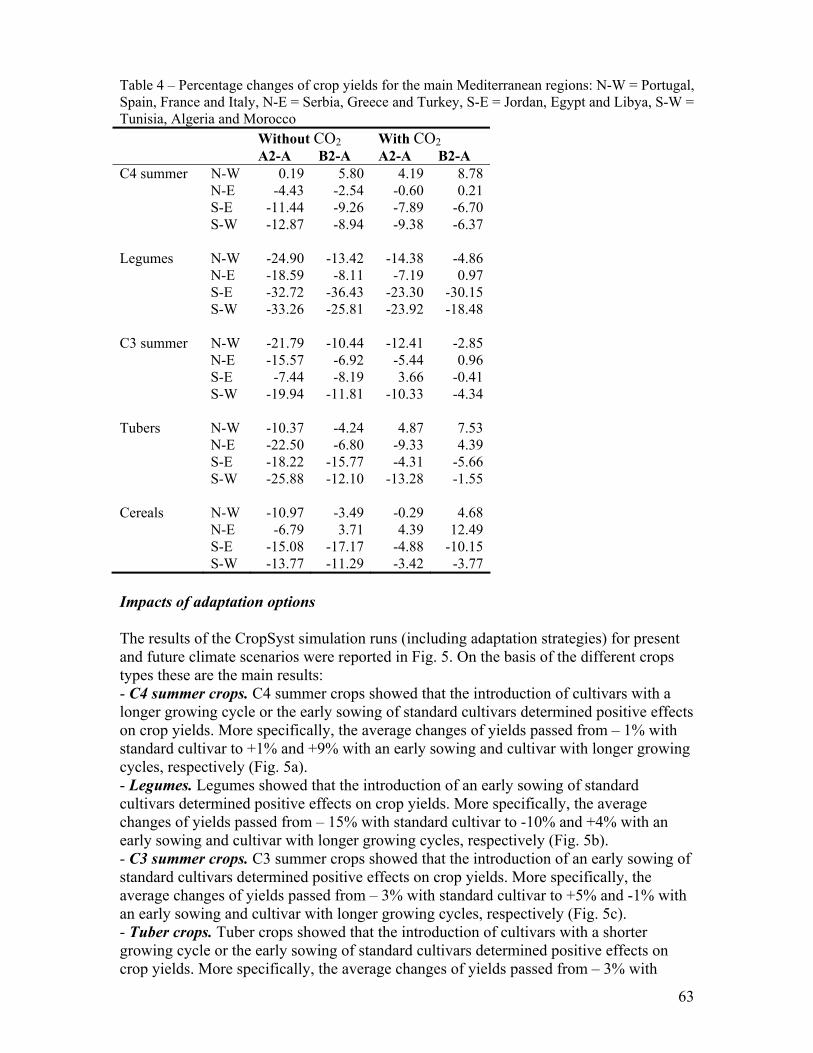
Table 4 – Percentage changes of crop yields for the main Mediterranean regions: N-WSpain, France and Italy, N
= Portugal, -E = Serbia, Greece and Turkey, S-E = Jordan, Egypt and Libya, S-W =
Tunisia, Al ria a it O W O2
ge nd Morocco W hout C 2 ith C
A2-A -A B2-A C4 summe 0.1 5 4 8.78
B2 A2-A r N-W 9 .80 .19
NS
-4.43 -1
.54
.260.607.89 1. 4 -9 -
S -1 .87 8.94 9.38
-2 .90 - 3.42 4.38N -1 .59 8.11 -7.19
2. -2 S -3 .26 - 5.81 3.92
r N -2 .79 - 0.44 2.41
5. -6 - S -7.44 9 .66
S -1 4 - .81 .33
-1 .37 4.24 4.872. -6 -
SS
-1 2 - .77 4.31 -2 .88 - .10 3.28
-E -2 - 0.21 -E 4 -6.70
-W 2 - - -6.37 Legumes N-W 4 1 -1 -4.86 -E 8 - 0.97 S-E -3 72 -36.43 3.30 -30.15
-W 3 2 -2 -18.48 C3 summe -W 1 1 -1 -2.85 N-E -1 57 .92 5.44 0.96
-E -8.1 3 -0.41 -W 9.9 11 -10 -4.34 Tubers N-W 0 - 7.53 N-E -2 50 .80 9.33 4.39
-E 8.2 15 - -5.66 -W 5 12 -1 -1.55 Cereals N-W -10.97 -3.49 -0.29 4.68
9 3.71 4.39 12.49 S-E -15.08 -17.17 -4.88 -10.15 N-E -6.7
S-W -13.77 -11.29 -3.42 -3.77 Impacts of adaptation options
r present nt crops
ultivars with a d positive effects
– 1% with with longer growing
tandard rage
+4% with an .
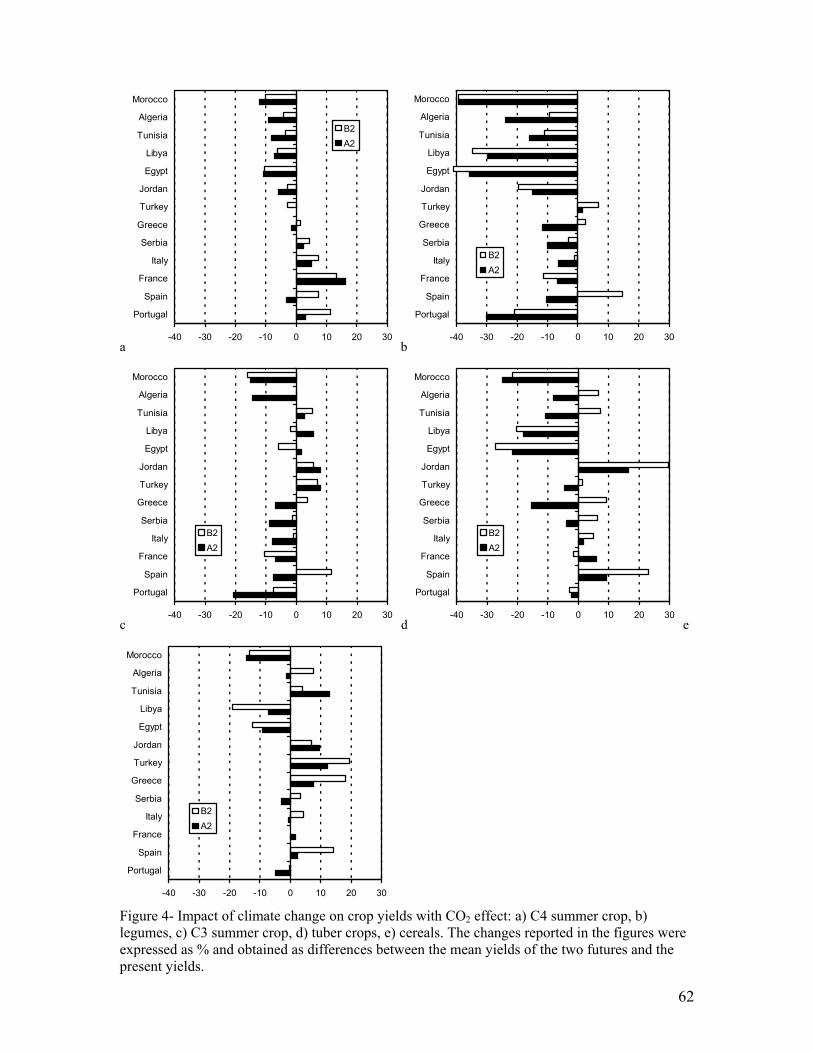
early sowing of standard cultivars determined positive effects on crop yields. More specifically, the average changes of yields passed from – 3% with standard cultivar to +5% and -1% with an early sowing and cultivar with longer growing cycles, respectively (Fig. 5c). - Tuber crops. Tuber crops showed that the introduction of cultivars with a shorter growing cycle or the early sowing of standard cultivars determined positive effects on crop yields. More specifically, the average changes of yields passed from – 3% with
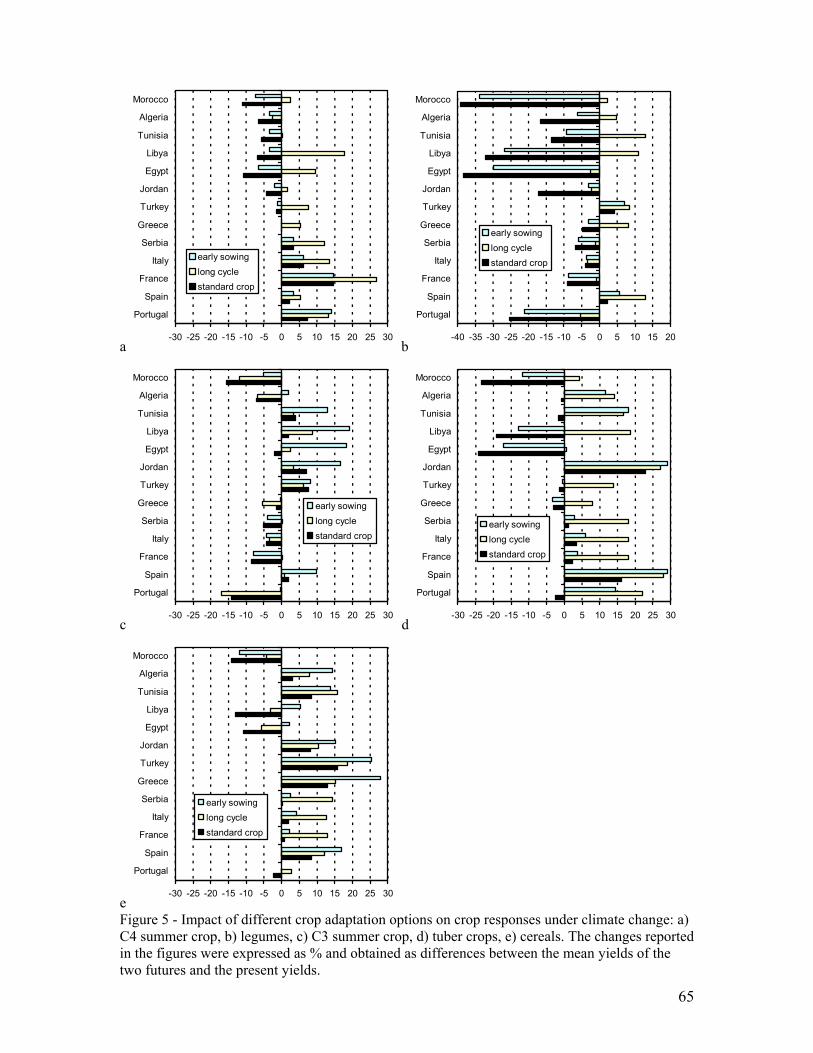
The results of the CropSyst simulation runs (including adaptation strategies) foand future climate scenarios were reported in Fig. 5. On the basis of the differetypes these are the main results: - C4 summer crops. C4 summer crops showed that the introduction of clonger growing cycle or the early sowing of standard cultivars determineon crop yields. More specifically, the average changes of yields passed fromstandard cultivar to +1% and +9% with an early sowing and cultivarcycles, respectively (Fig. 5a). - Legumes. Legumes showed that the introduction of an early sowing of scultivars determined positive effects on crop yields. More specifically, the avechanges of yields passed from – 15% with standard cultivar to -10% andearly sowing and cultivar with longer growing cycles, respectively (Fig. 5b)- C3 summer crops. C3 summer crops showed that the introduction of an
63
standard cultivar to +16% and +6% with cultivars with longer growing cycles an early
ing cycle p yields. More
ltivar to d +9% with cultivars with longer growing cycles and early sowing, respectively
(Fig. 5e).
gative n of the sowing date
owing cycle. of he increasing
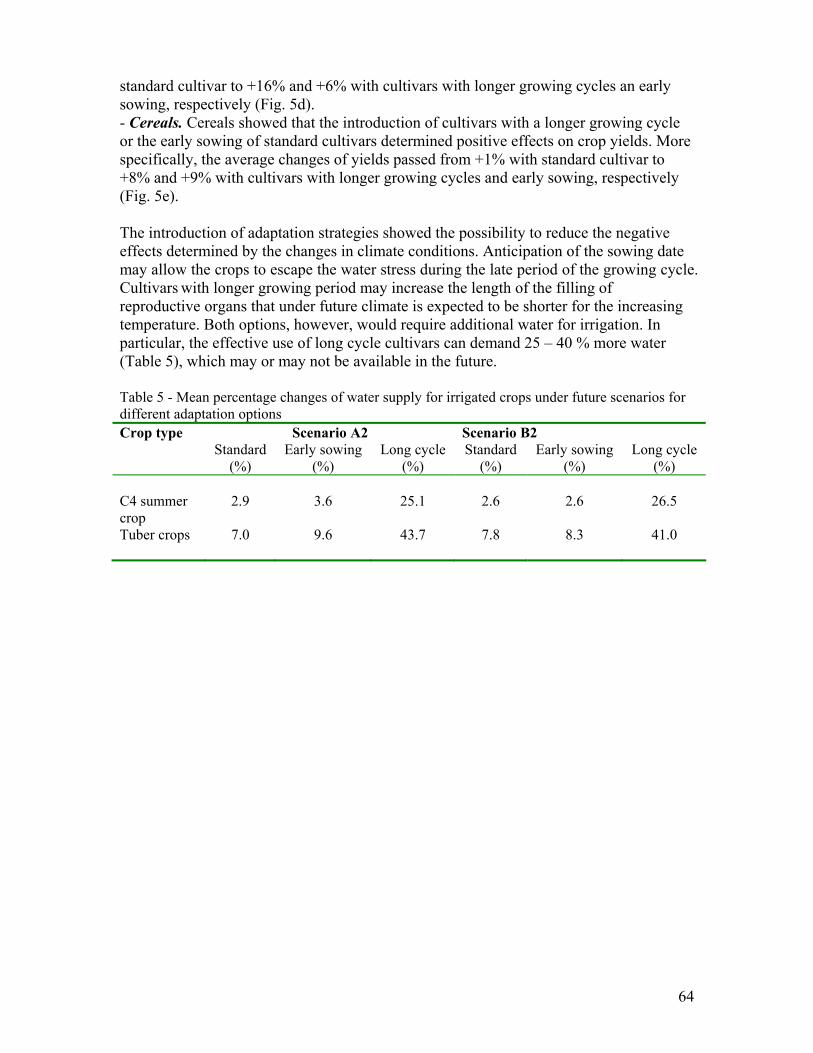
dditional water for irrigation. In particular, the effective use of long cycle cultivars can demand 25 – 40 % more water
Table 5 - M n o p ga e narios for different adaptation optionCrop type cenario A2 Scenario B2
sowing, respectively (Fig. 5d). - Cereals. Cereals showed that the introduction of cultivars with a longer growor the early sowing of standard cultivars determined positive effects on crospecifically, the average changes of yields passed from +1% with standard cu+8% an
The introduction of adaptation strategies showed the possibility to reduce the neeffects determined by the changes in climate conditions. Anticipatiomay allow the crops to escape the water stress during the late period of the grCultivars with longer growing period may increase the length of the fillingreproductive organs that under future climate is expected to be shorter for ttemperature. Both options, however, would require a
(Table 5), which may or may not be available in the future.
ean perce tage changess
f water sup ly for irri ted crops und r future sce
S Standard
(%) ly sowin
(%) ong cy
(%) Standa
(%) Early sowing
(%Long cycle
(%)
Ear g L cle rd )
C4 summer crop
2.9
3.6
25.1
2.6
2.6
26.5
Tuber crops 7.0
9.6
43.7
7.8
8.3
41.0
64
-30 -25 -20 -15 -10 -5 0 5 10 15 20 25 30
Portugal
Spain
France
Italy
Serbia
Greece
Turkey
Jordan
Egypt
Libya
Tunisia
Algeria
Morocco
early sowinglong cyclestandard crop
b-40 -35 -30 -25 -20 -15 -10 -5 0 5 10 15 20
Portugal
Spain
France
Italy
Serbia
Greece
Turkey
Jordan
Egypt
Libya
Tunisia
Algeria
Morocco
early sowinglong cyclestandard crop
a
-30 -25 -20 -15 -10 -5 0 5 10 15 20 25 30
Portugal
Spain
France
Italy
Serbia
Greece
Turkey
Jordan
Egypt
Libya
Tunisia
Algeria
Morocco
early sowinglong cyclestandard crop
d-30 -25 -20 -15 -10 -5 0 5 10 15 20 25 30
Portugal
Spain
France
Italy
Serbia
Greece
Turkey
Jordan
Egypt
Libya
Tunisia
Algeria
Morocco
early sowinglong cyclestandard crop
c
e-30 -25 -20 -15 -10 -5 0 5 10 15 20 25 30
Serbia
Greece
Turkey
Jordan
Egypt
Libya
Tunisia
Algeria
Morocco
early sowing
Figure 5 - Impact of different crop adaptation options on crop responses under climate change: a) C4 summer crop, b) legumes, c) C3 summer crop, d) tuber crops, e) cereals. The changes reported in the figures were expressed as % and obtained as differences between the mean yields of the two futures and the present yields.
Portugal
Spain
France
Italy long cyclestandard crop
65
Discussions and Conclusions
ion reduction of
uction of the ons in
ler northern account.
ields due to editerranean, the effects of climate
change and its associated increase in CO2 may have little or small positive impacts on
ates may be crop yield determined
re up to 40%
heric losses under a of ground d (Morgan et
d by it, zone concentrations are expected to increase globally. Thus, if the effects of to be included in an assessment of crop yields in the Mediterranean under a
n presented in
References -air CO2
tosynthesis, -372
2001) Ecosystems and their goods and services, In: Climate Change 2001: Impacts, Adaptation and Vulnerability, McCarthy, JJ
BA, Kobayashi K, Bindi M (2002) Responses of agricultural crops to free-air CO enrichment. Advances in Agronomy, 77: 293-368
Long SP (2003) How does elevated ozone impact soybean? A meta-analysis of photosynthesis, growth and yield. Plant, Cell and Environment 2003 26:8 1317 Stockle CO, Donatelli M, Nelson R (2003) CropSyst, a cropping systems simulation model. Eur J Agron 18: 289-307
Our study showed that the increases in temperature and reduction in precipitatpredicted for both future climate scenarios (A2 and B2) lead to a substantial yields for all the crop types in all the ‘hot spots’ grid cells, through the redlength of the growing period and the water available for crop growth. Reductiyields are more severe in the warmer southern Mediterranean than in the cooMediterranean, even when the fertilizing effect of increased CO2 is taken intoThe southern Mediterranean is likely to experience an overall reduction of yclimate change. In some locations in the northern M
yields, provided that additional water demands can be met. Strategies such as early sowing dates or cultivar with slower development rconsidered as helpful options to reduce some of the reductions in by the changes in climate conditions. However, such options could requimore water for irrigation, which may or may not be available in the future. Moreover, according to recent studies on the effects on crop yields of troposppollutants such ozone, there is reason to believe that our estimates of yieldfuture scenario may be conservative. Current and increased concentrationslevel ozone have been shown to lead to decreases in plant biomass and yielal., 2003; Gitay et al., 2001). Independently of climate change, but exacerbatesurface oozone are future climate scenario, the results are likely to greater yield reductions thathis report.
Ainsworth EA, Long SP (2005) What have we learned from 15 years of freeenrichment (FACE)? A meta-analytic review of responses to rising CO2 in phocanopy properties and plant production. New Phytol., 165:351 Gitay H, Brown S, Easterling W and Jallow B. (
Canziani, OF, Leary, NA, Dokken DJ and White KS (ed.), p.735-800. Kimball
2
Morgan PB, Ainsworth EA,
66

67