Climate change impacts and adaptation in the Carolinas · USGCRP SAP 1.1 . In the context of...
51
Climate change impacts and adaptation in the Carolinas Kirstin Dow, USC Geography Greater Piedmont Chapter of the Explorers Club September 12, 2014
Transcript of Climate change impacts and adaptation in the Carolinas · USGCRP SAP 1.1 . In the context of...

Climate change impacts and adaptation in the Carolinas
Kirstin Dow, USC Geography Greater Piedmont Chapter of the
Explorers Club September 12, 2014
Climate is what you expect Weather is what you get– Mark Twain
Today: 3 lines of evidence and adaptation options for the Carolinas

Climate Change Means Changing…
• Weather (Temp., Precip., storms, droughts)
• Water levels in rivers, oceans, and aquifers
• Melting snow, sea ice, permafrost, and glaciers
• Species ranges, communities, and life cycles
• Changes to human health, economy, security, natural hazards, agriculture, land use
3 lines of evidence
supporting the projections

1. Established Theory and Process Svante Arrhenius, Swedish scientist (1859-1927), in 1895 presented “On the Influence of Carbonic Acid in the Air upon the Temperature of the Ground.”
First presentation of the theory and calculations on the effect of carbon dioxide and other chemicals in the atmosphere on the heat budget of the Earth

Source: Kiehl and Trenberth
Measurements of the Earth’s Radiation Budget

Measurements of Greenhouse Gases

Multiple sources of evidence on past temperatures
USGCRP SAP 1.1

In the context of planetary and human history

2. Models require greenhouse gas inputs to replicate observed changes
Temperature change relative to 1880-1919
Models using Natural Forcings
Models using Natural & Human Forcings
Temperature change relative to 1880-1919
IPCC 2013 SPM fig 6

Same relationship holds at the regional level Gives some confidence in the models
IPCC 2013 SPM fig 6
Models using Natural Forcings
Models using Natural & Human Forcings
Temperature change (Artic – sea ice area)

IPCC, 2013; Working Group 1, Figure 3.9 Summary for Policy Makers
3. Observations are consistent with theory

Copenhagendiagnosis.com
Arctic Sea Ice

Climate
changes are
being
observed
•Temperature
•Physical
systems
•Biological
systems •Source: IPCC 2007
Working Group 2,
Summary for Policy
Makers
# of signif.
observed
changes
% consistent
with
warming
North America
Physical Biological
355
92% 94%
455
# of signif.
observed
changes
% consistent
with
warming
Globally
Physical Biological
765
90% 94%
28,671

IPCC 2014; WG2 SPM

Increased flooding: $200 million in flood control underway in C’ton
Kayaking through the Charleston City Market, August 28, 2012
Source: www.holycitysinner.com
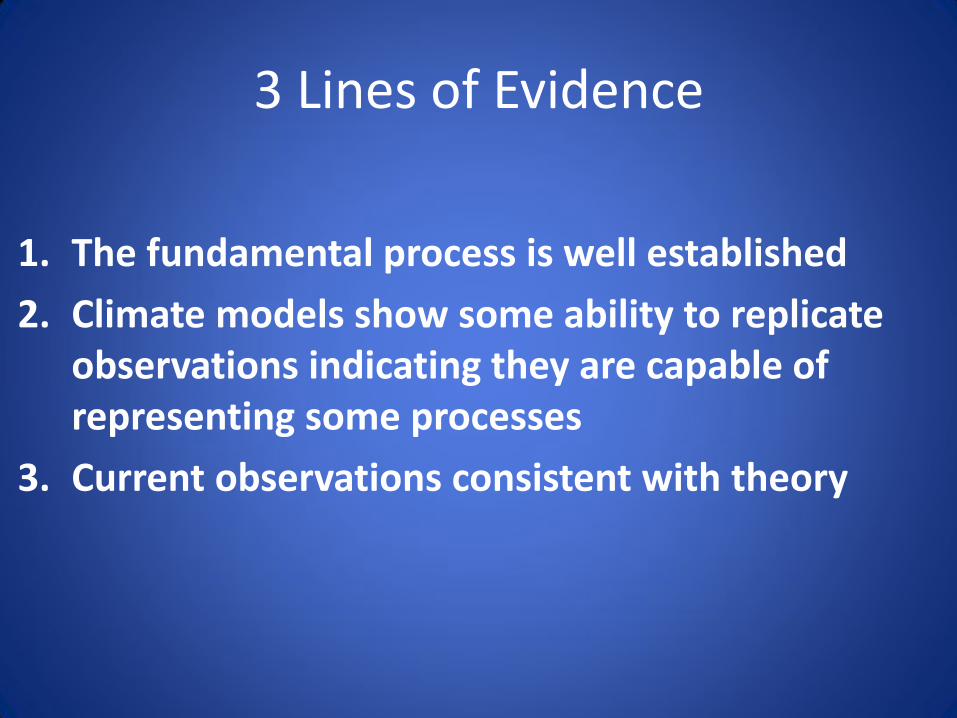
1. The fundamental process is well established
2. Climate models show some ability to replicate observations indicating they are capable of representing some processes
3. Current observations consistent with theory
3 Lines of Evidence

Currently, GHG emissions accelerate despite reduction efforts.
Most emission growth is CO2 from fossil fuel combustion and industrial processes.
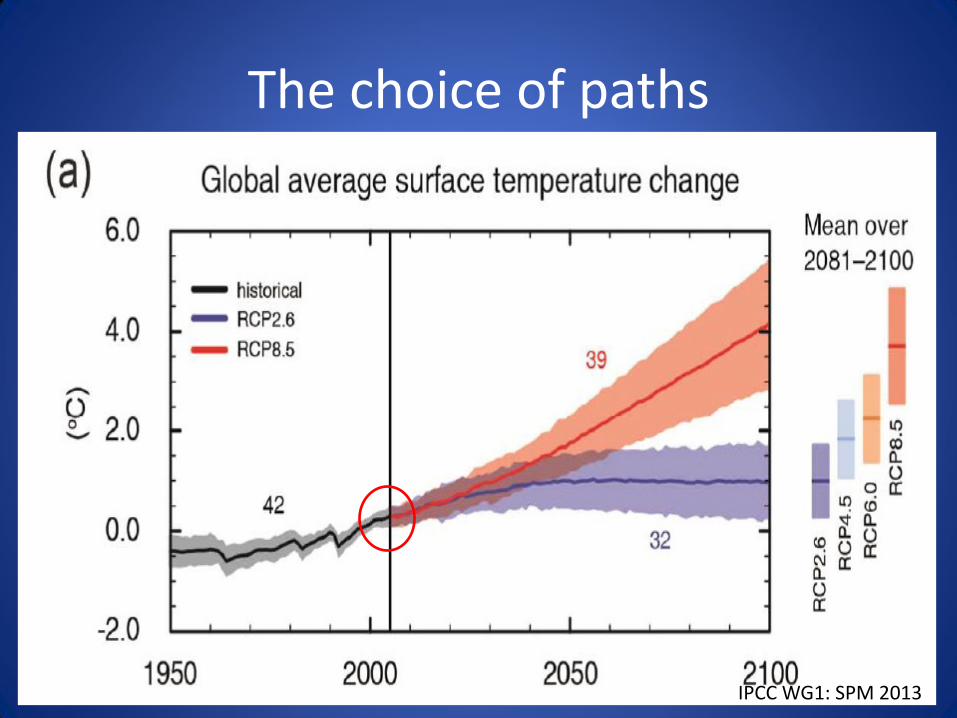
The choice of paths
IPCC WG1: SPM 2013

High and low projections for 2081-2100
All Figures © IPCC 2013

Projected Global Mean Sea Level Rise
All Figures © IPCC 2013

Impact on Crop Yields
• Projected +1 to -3.5 %
decrease in yield/decade
• In the context of
+14% growth in demand/ decade
• For 5 decades
IPCC AR5 WG2 Chap. 7
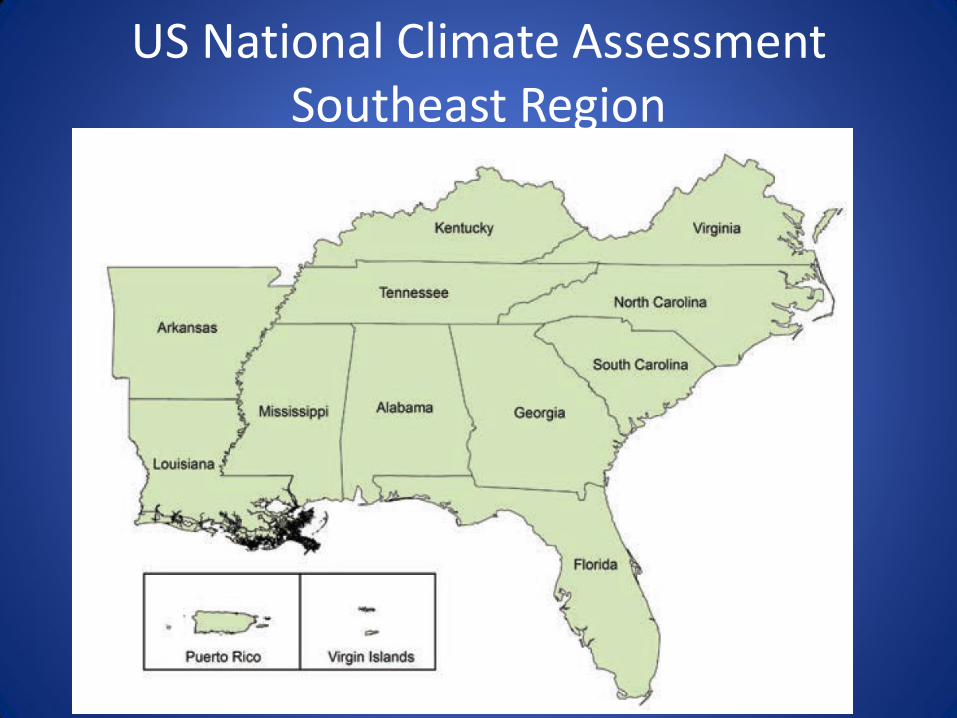
US National Climate Assessment Southeast Region

Southeast U.S. Temperature
Annual Average Temperature
Source: 3rd NCA, adapted from Kunkel et al. 2013

Sea Level Rise: Differences in Vulnerability
Source: Third NCA, Data from Hammar-Klose and Thieler 2001)
Causes of differences • Tidal range • Wave height • Coastal slope • Shoreline change,
landforms, and processes
• Historical rate of sea level rise

Hurricanes: Fewer overall, but more Cat 4 and 5

Southeast U.S. Days over 95F
Source: NOAA NCDC / CICS-NC

Southeast U.S. Total Precipitation Projections
Black line – Observed decadal mean annual precipitation change Gray lines – Model simulations from 15 CMIP3 models for the high (A2) emissions scenario.
Source: Kunkel et al. 2013
Winter Spring
Summer Fall
Colored lines – Observed decadal mean annual precipitation change Gray lines – Model simulations from 15 CMIP3 models for the high (A2) emissions scenario.

Heavy Precipitation
1-day 5-day
Source: Konrad/Kunkel

Indirect Connections
Source:blog.recovery.gov
Protecting the Capital Lincoln Reflection Pond estimated approximately $7 million to build a berm $ millions more requested for work in DC

Western Drought and Beef Prices
“Beef prices hit all-time high in U.S.” 8 April 2014 LA Times
• October 2013 McDonald's Dollar Menu becomes a “Dollar Menu & More”
• January 2013 Wendy's “Dollar Menu” be came the “right price, right size”

Vulnerability of global supply chains
Approx. 10% increase in consumer prices Slow down in Honda and Toyota car production
“Thailand Flooding Cripples Hard-Drive Suppliers” New York Times; 6 November 2011

Climate Choices

Source: NPS
Need to pursue both GHG reductions and adaptation strategies

Two Adaptation Issues
• Increased temperatures and longer duration of warm periods – heat threats
• Changing timing and distribution of public health issues

Adaptation Strategies and Considerations
• No Regrets Strategies – will provide benefits under existing conditions as well as potential future conditions
• Low Regrets Strategies
• Lock-in – making investments that will commit us to a pathway that may address a current problem but not future conditions
• Multiple Stresses – not just climate
• Timing of investments – Building adaptive capacity – preparing to act
effectively

Increased Temperatures and Longer Duration of Warm Periods
• Health threats to those with limited access to cooling
– Poor, elderly, socially isolated
– People working outdoors
– Athletes
• Budget expense
• Particular issue in urban areas due to the urban heat island effect
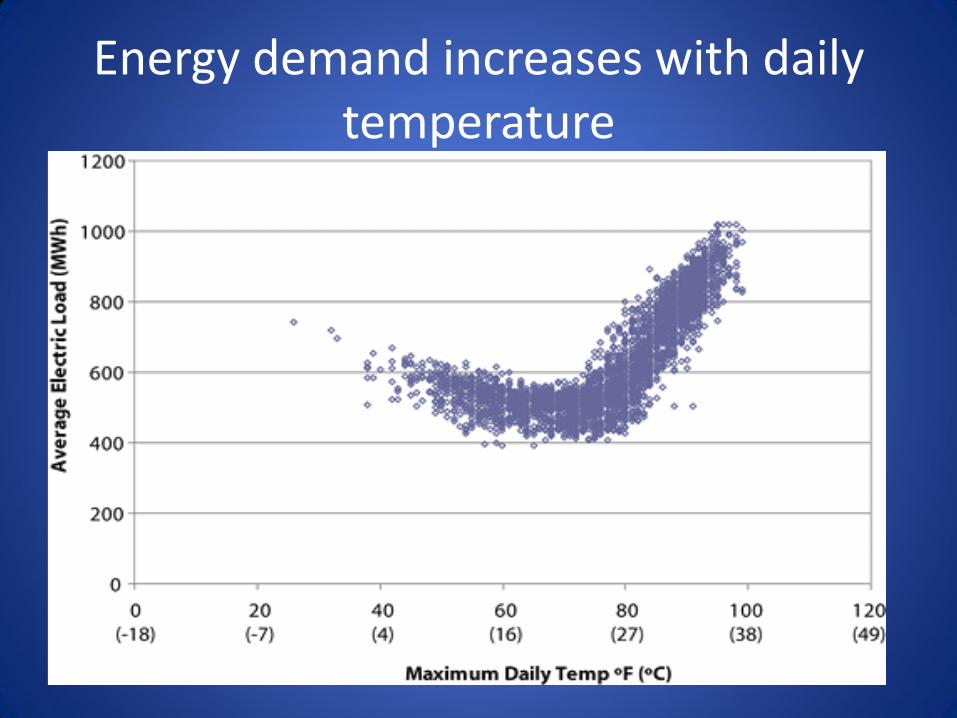
Energy demand increases with daily temperature

Urban Heat Island
Can raise temperature from 2-10⁰F
Many cities in
South Carolina
will also have
aging populations
Source: US EPA

Ozone Impacts
• Ground-level ozone is formed when Nitrous oxides (often fossil fuel emissions) and volatile organic compounds (VOCs) react in the presence of sunlight and hot weather.
• Hotter, sunnier conditions will result in greater levels of ground-level ozone production
• Increased Asthma incidences

Water Quality Impacts
• Pavement and rooftops at over 100 ⁰F can raise rainfall temperature from 70⁰F to 95 ⁰F .
• This drains to storm sewers and then to water bodies where it can result in fast increases in water temperatures and harm to aquatic life
– metabolism
– reproduction

Adaptation Options
• Green spaces
• Planting trees
• Green roofs

Adaptation Option
• Urban tree planting
– Lower summer temperatures by shading concrete and returning humidity to the air through evaporative cooling
– ALSO • Improved air quality
– Removing dust and pollutants
• Capture carbon dioxide
• Protect water quality
– Capturing and retaining stormwater

Million Tree Programs
• New York City
• Baltimore
• Chicago
• Los Angeles
• Others

Green Roofs
• Heat sensing pictures illustrate the major temperature difference between green roofing on
Chicago’s City Hall (left) and traditional roofing (right)

USC West Quad
• See Greenroofs.org
NYCPlan
Oregon Apartment roof

Public Health and Climate Change
Climate Change:
Temp. rise
Wildfires
Sea level rise
Hydro extremes
Heat
Severe weather
Air pollution
Allergies
Vector-borne Diseases
Water-borne diseases
Mental health
Heat stress, cardiovascular failure
Injuries, fatalities
Asthma, cardiovascular disease
Resp allergies, poison ivy
Malaria, dengue, Valley fever
Cholera, cryptosporidiosis, campylobacter, leptospirosis
Anxiety, post-traumatic stress, depression, despair
Source: Frumpkin, CDC

Local Specifics
• Earlier springs, longer pollen seasons • Warmer conditions favoring pathogens
– Observations of Vibrio in Gulf Coast show cases earlier and later than usual
• Harmful Algae Blooms
– Favored by warmer temperatures and changes in lake warming
– Some can become air-borne and cause respiratory problems
– Other spread into new areas as habitat conditions change • Red tide • Aedes aegypti

Vector-Borne and Zoonotic Disease
• Very Uncertain
• Spread is dependent on many factors, not just climate
• Mosquito, Aedes aegypti and A. albopictus
– very adaptable to urban conditions
– can transmit dengue and malaria
– Chikungunya – 1st case in SC
identified July 2014 – travel related


More resources are becoming available

General Resources
• In addition to federal agencies mentioned,
• CAKE – Community Adaptation Knowledge Exchange
• ICLEI – Local Governments for Sustainability
• Georgetown Climate Center Adaptation Clearinghouse
Thank You