Climate Change Impact on Temporaries Spaces Contrast at the Accumulative Coastal Zone in the...
27
Climate Change Impact on Temporaries Spaces Contrast at the Accumulative Coastal Zone in the examples of Playas del Este (Havana, Cuba) and Pernambuco (Brazil). MSc. Ramiro Reyes/IGT MSc. Carmen L. Garceandia /IGT PHD. Niedja Oliveira /UEP MSc. Miguel Sanchez /IGT PHD. J.L. Diaz /IGT MSc. Ismarys Izaguirre/IGT Tec. Alicet Molina /IGT Institute of Tropical Geography IGT/UEP
-
Upload
ramiro-reyes -
Category
Documents
-
view
22 -
download
2
Transcript of Climate Change Impact on Temporaries Spaces Contrast at the Accumulative Coastal Zone in the...

Climate Change Impact on Temporaries Spaces Contrast at the Accumulative Coastal Zone in the examples of Playas del Este (Havana, Cuba) and Pernambuco (Brazil).
MSc. Ramiro Reyes/IGT
MSc. Carmen L. Garceandia /IGT
PHD. Niedja Oliveira /UEP
MSc. Miguel Sanchez /IGT
PHD. J.L. Diaz /IGT
MSc. Ismarys Izaguirre/IGT
Tec. Alicet Molina /IGT
Institute of Tropical Geography
IGT/UEP

Guanabo River Basin
Accumulative Coastal Zone. Tarara-Rincon de Guanabo. Tarara, Itabo and Guanabo Basin

Seasonal weather and climate fluctuations have significant impacts on society, via agriculture, food security, water, health, natural disasters and the environment. These can be a major brake on economic progress in the developing world. (A multi-stakeholder review of Regional Climate Outlook Forums concluded at an international workshop October 16 – 20, 2000, Pretoria, South Africa).
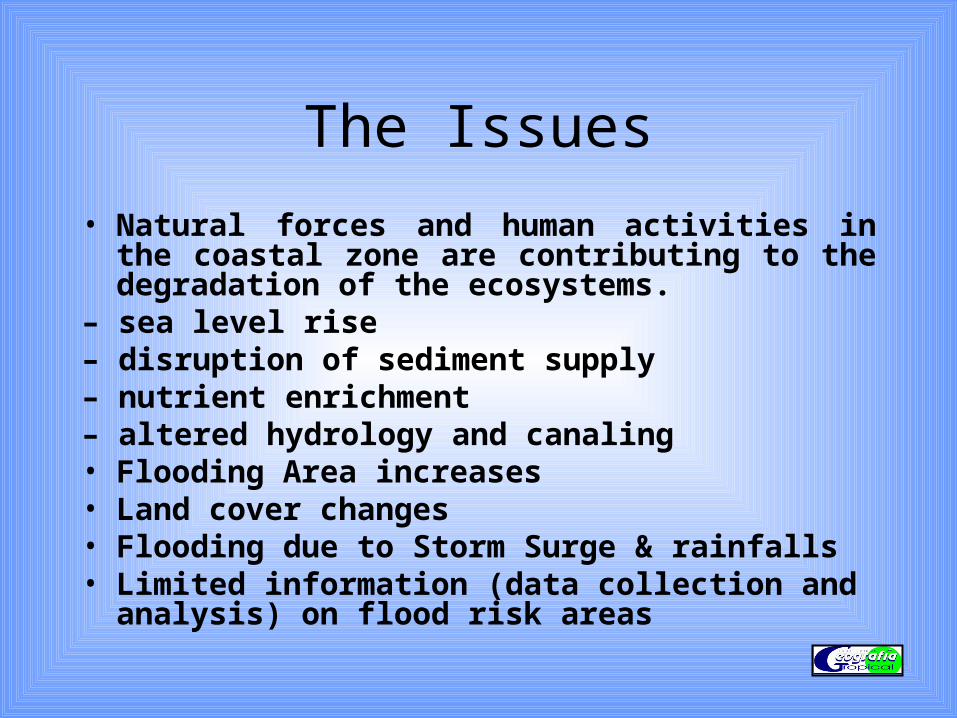
The Issues
• Natural forces and human activities in the coastal zone are contributing to the degradation of the ecosystems.
– sea level rise– disruption of sediment supply– nutrient enrichment– altered hydrology and canaling• Flooding Area increases• Land cover changes• Flooding due to Storm Surge & rainfalls• Limited information (data collection and analysis) on
flood risk areas

OBJECTIVES
Assessment environmental problems relationships with climate change and man-made activity on the accumulative coastal zone in the examples of the Playas del Este at the local scale
Ramiro Reyes

General parameter
Socio-economics parameter
Land Use
Gender, Education, Health
Hidrologic Resources
Climatic Conditions
Soils
Crop Production
Biodiversity & Forest

Materials • Topography Map at 1: 2 000 scale (GEOCUBA).
• Different thematic map in raster, polygon and segment format was using (geology, geomorphology, land use, soil, etc).
• Aerial photographs and Ortho-photos

Tabla 1. Data of Different Basin
BASINHmáxm
Hmínm
Areakm2
Hmm
Yco/oo
Yro/oo
Lkm
Ddkm/km2
Tarara 150 0 62.2 49.1 72.0 4.2 21.7 1.9
Itabo (Boca Ciega)
120 0 36.0 37.0 65.4 3.0 17.0 1.9
Guanabo 309 0 119.3 62.8 85.7 3.9 22.1 1.7
Hmáx., Hmín y Hm.- Altura máxima, mínima y media de la cuenca respectivamente; Yc – pendiente de la cuenca; Yr – pendiente del río; L – longitud del río y Dd –densidad de drenaje.
Mes Pmedia Pmáx. t media
t máxima t mínima
Enero 61,5 253,2 21,7 32,5 8,5
Febrero 44,4 143,6 21,8 33,0 9,5
Marzo 45,3 146,9 23,4 33,8 11,7
Abril 49,9 145,0 24,3 34,5 12,6
Mayo 101,7 424,1 25,4 35,8 14,9
Junio 155,5 424,1 26,3 34,6 18,8
Julio 108,8 276,6 26,9 35,1 18,8
Agosto 104,4 294,8 27,1 35,3 19,0
Setiembre 146,5 421,7 26,6 35,5 19,8
Octubre 177,9 668,3 25,2 35,4 15,6
Noviembre 81,3 203,2 23,6 27,1 20,8
Diciembre 50,6 152,6 22,2 33,0 10,1
1127,8 668,3 24,5 35,8 8,5

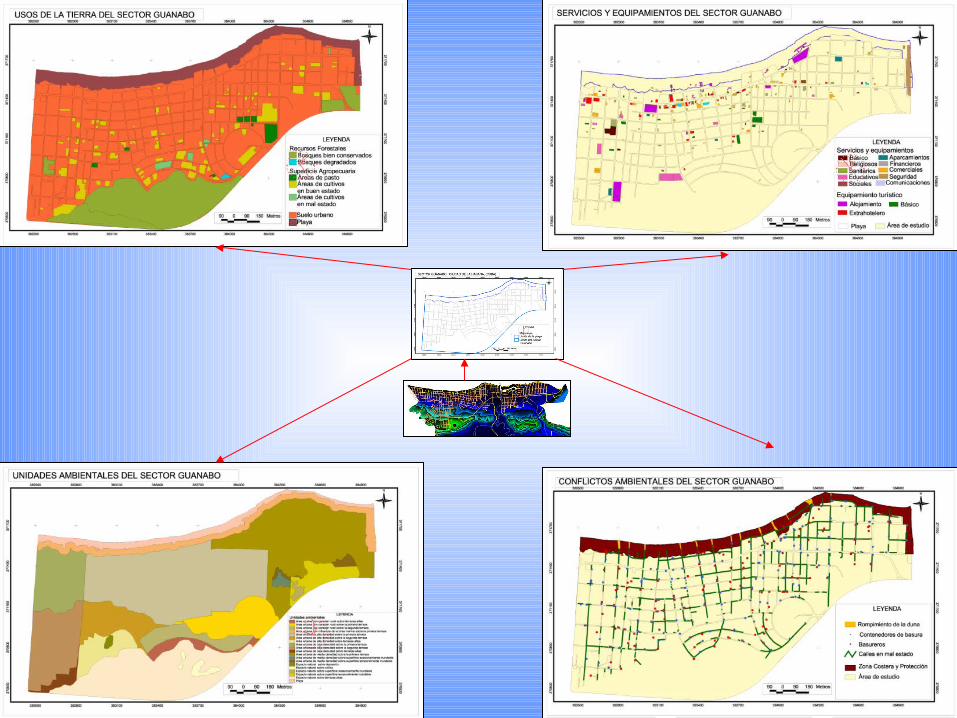
Different Thematic Maps. Guanabo Basin

Disaster Management Cycle
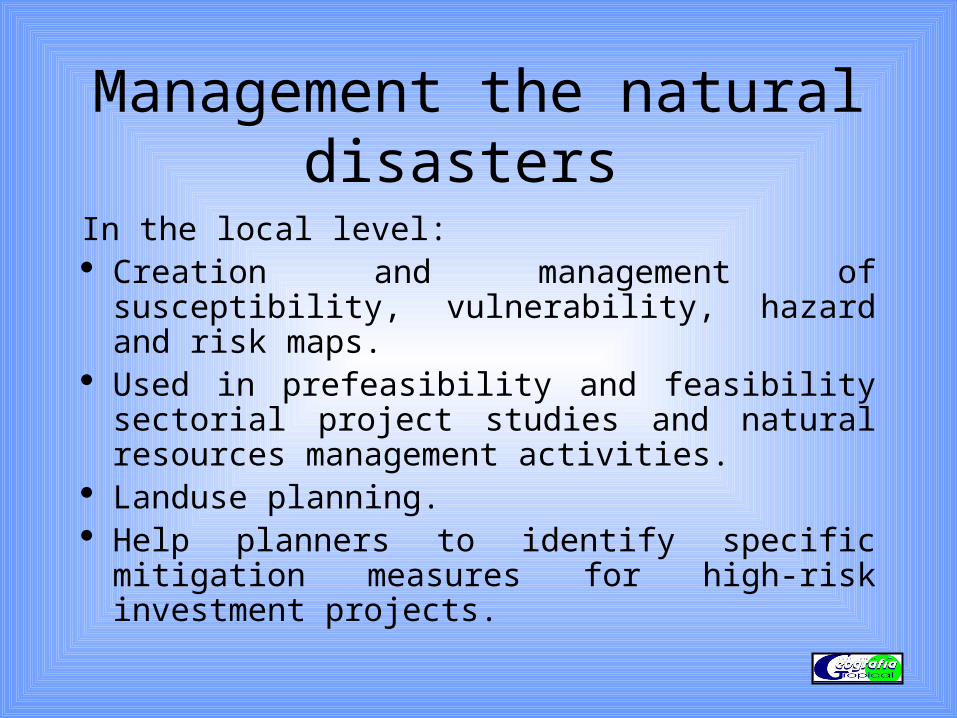
Management the natural disasters
In the local level: Creation and management of susceptibility,
vulnerability, hazard and risk maps. Used in prefeasibility and feasibility sectorial
project studies and natural resources management activities.
Landuse planning. Help planners to identify specific mitigation
measures for high-risk investment projects.
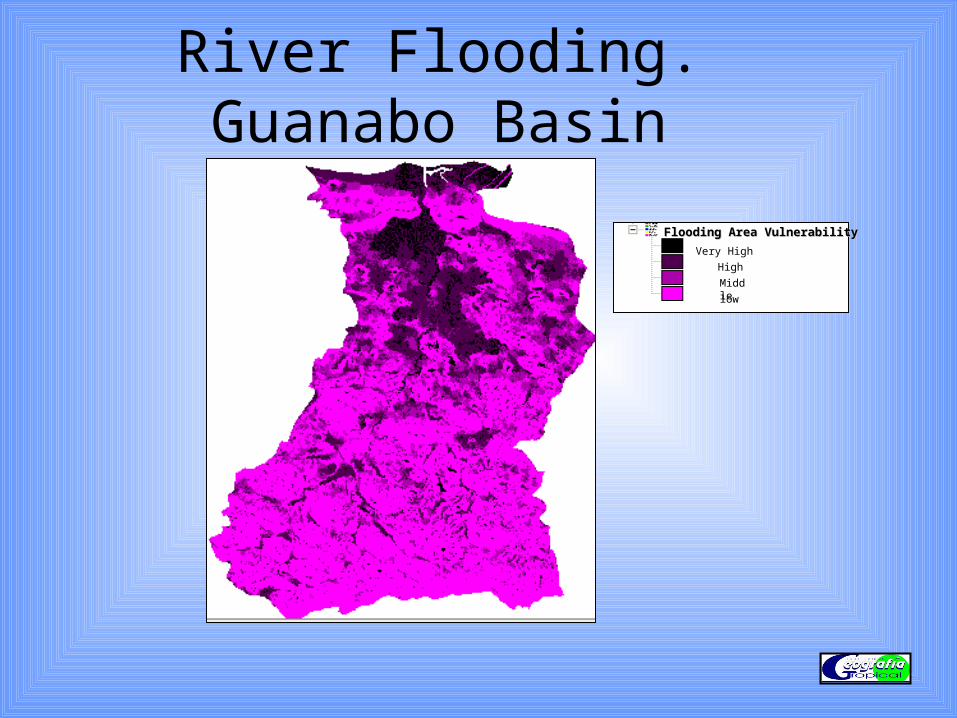
River Flooding. Guanabo Basin
Flooding Area VulnerabilityFlooding Area Vulnerability Very High
High
Middlelow

The approach used to compute and map the storm surge values for return periods
• Hazards= Meteorological Factor + Physic-geography Factor (Lezcano y Pérez ,1992 ; y Salas et al 1998, INSMET)
• The 1 in 25 year return period surge computed at these locations were 0.5 m, 2 m, 3m and 4 m respectively, indicating a range of almost 1.0 meter depending on the exact location. A base map was prepared from 1:5 000 scale topography of the area.
• The computed storm surge results for the case study have been mapped within a GIS, which has been used to evaluate infrastructure and population areas at risk.
• The land use zoning data was included . The coastal zone of the Guanabo Basin area is planned for resort, resort/residential, transportation, conservation, commercial/office, institutional, light industry, open space,, public buildings, and residential uses.
• Land elevation contours were digitized from the topography, along with the elevation points shown on the ground, to create a digital vector coverage of the study area. This would facilitate the creation of a DEM for terrain relief correction.

Karstic Area. Guanabo Basin

Thematic Map. Coastal Zone

Flooding along the coastal areas by Storm Surges
0.5 m 3.06 Km2 1/12 cases/Years
2 m 12.61 Km2 1/31cases/Years
3 m 12.68 Km2 1/125cases/Years
4 m 34.32 Km2 1/357cases/Years
Flooding boundary
Area Change
Return periods

Flooding Area
1
1
2
2
34
44a 3
5
5
5a


Conservatives Area. La Coca
BUT WE CONTINUOS WORKING
END NOW