
Climate change hits home - SPUR€¦ · Climate change hits home ... ranked in priority by greatest...
40
REPORT 05/2011 Climate change hits home Adaptation strategies for the San Francisco Bay Area
Transcript of Climate change hits home - SPUR€¦ · Climate change hits home ... ranked in priority by greatest...
1
RepoRt 05/2011
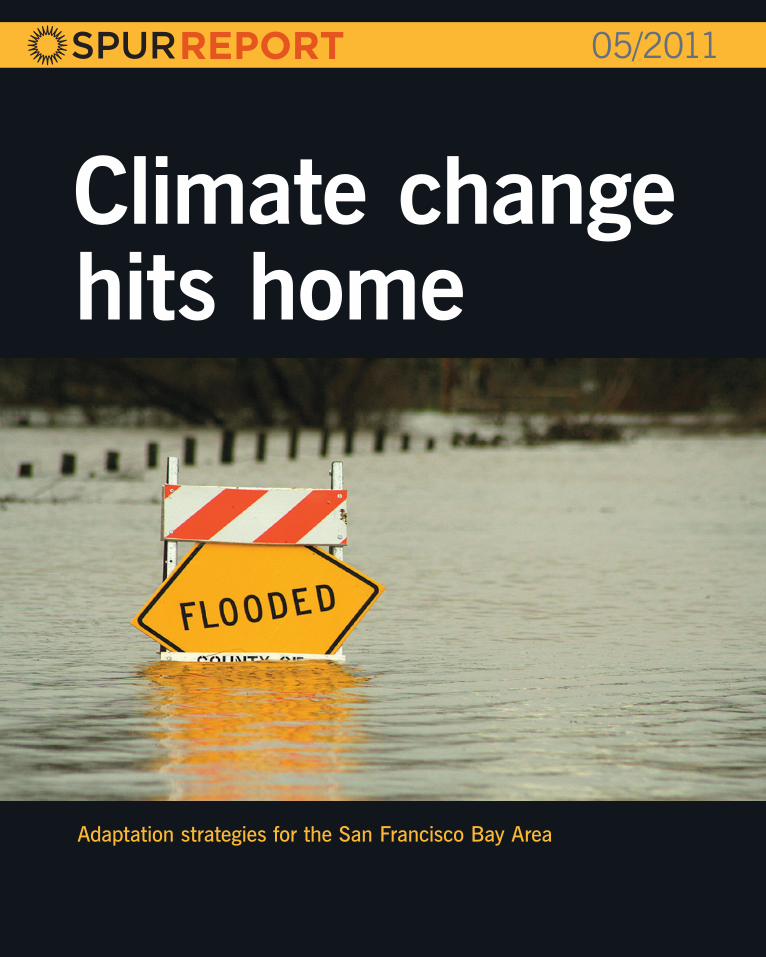
Climate change hits home
Adaptation strategies for the San Francisco Bay Area
2 SPUR Report > May 2011
Adapting to climate change in the Bay Area
Although we must do everything in our power to slow down climate change, it is too late to prevent it entirely. All levels of government, and especially local governments, must begin preparing for and building resilience to the effects of climate change, an area of planning known as climate change adaptation.
In this SPUR report, we survey the likely impacts of climate change in the San Francisco Bay Area, including extreme weather, sea level rise and more.
We recommend more than 30 strategies for local and regional agencies to begin minimizing the region’s vulnerabilities to these long-term but potentially catastrophic effects.
This report was made possible by the generous support of the San Francisco Foundation, the Richard and Rhoda Goldman Fund, and a Community Action Grant from the Urban Land Institute.
3 Introduction
4 Principles of climate adaptation
7 Climate change impacts in the Bay Area
10 Vulnerable areas and adaptation strategies
11 Public safety and health Heat Air quality Highly vulnerable populations SPUR’s recommendations
14 Transportation Ground transportation Airports Ports SPUR’s recommendations
16 Ecosystems and biodiversity Terrestrial and watershed ecosystems Estuarine ecosystems SPUR’s recommendations
20 Energy Electric-grid reliability Increases in energy demand Hydroelectricity Sea level rise and energy infrastructure SPUR’s Recommendations
22 Water management SPUR’s recommendations
25 Sea level rise Design strategies for sea level rise Financing and governance SPUR’s recommendations
29 Conclusion
32 Plan of action: SPUR’s recommendations
SPUR Report > May 2011 3
We have known about the perils of climate change for more than two decades. But global efforts to slow it down by reducing greenhouse-gas emissions have largely failed. Even where major efforts are moving forward, such as California’s Assembly Bill 32, planned reductions will not even begin for 10 years, and they only represent a fraction of world emissions. In the meantime, the concentration of atmospheric greenhouse gases has continued to rise at an increasing rate.
Even if we are somehow able to stop producing greenhouse gases tomorrow, the high concentration of carbon dioxide already in the atmosphere from historic emissions—since we began burning fossil fuels for energy in the 19th century—will cause the climate to continue to change (Figure 1). As a result we must not only intensify our efforts to reduce climate change both now and in the future, but we also must prepare for and adapt to its inevitable effects. These two planning efforts are referred to, respectively, as climate change mitigation and climate change adaptation.
In SPUR’s 2009 report Critical Cooling, we explored the challenge of mitigation at the local level, recommending a set of carbon-reduction strategies for the City of San Francisco, ranked in priority by greatest impact and least cost.1
In this report, SPUR addresses how we should adapt to climate change in the Bay Area, including which tools and strategies will make us more resilient to its most severe impacts, including extreme weather and sea level rise.2
This report was reviewed, debated and adopted as official SPUR policy by the Board of Directors on February 16, 2011.spur.org/adaptation
SPUR staff: Laura TamSPUR interns: Timothea Tway, Elizabeth Antin
SPUR blue ribbon task force: Andy Barnes, David Behar, Brad Benson, Claire Bonham-Carter, Xantha Bruso, Peter Drekmeier, Ted Droettboom, Steve Goldbeck, Noah Goldstein, Amy Hutzel, Michelle Jesperson, Laurie Johnson, Doug Kimsey, Ken Kirkey, David Lewis, Jacinta McCann, Paul Okamoto, Emily Pimentel, Julian Potter, Bruce Riordan, Rebecca Rosen, Miriam Rotkin-Ellman, Bry Sarte, Will Travis, Margaret Williams, Abby Young
SPUR654 Mission StreetSan Francisco, CA 94105tel. [email protected]
/ introduction /
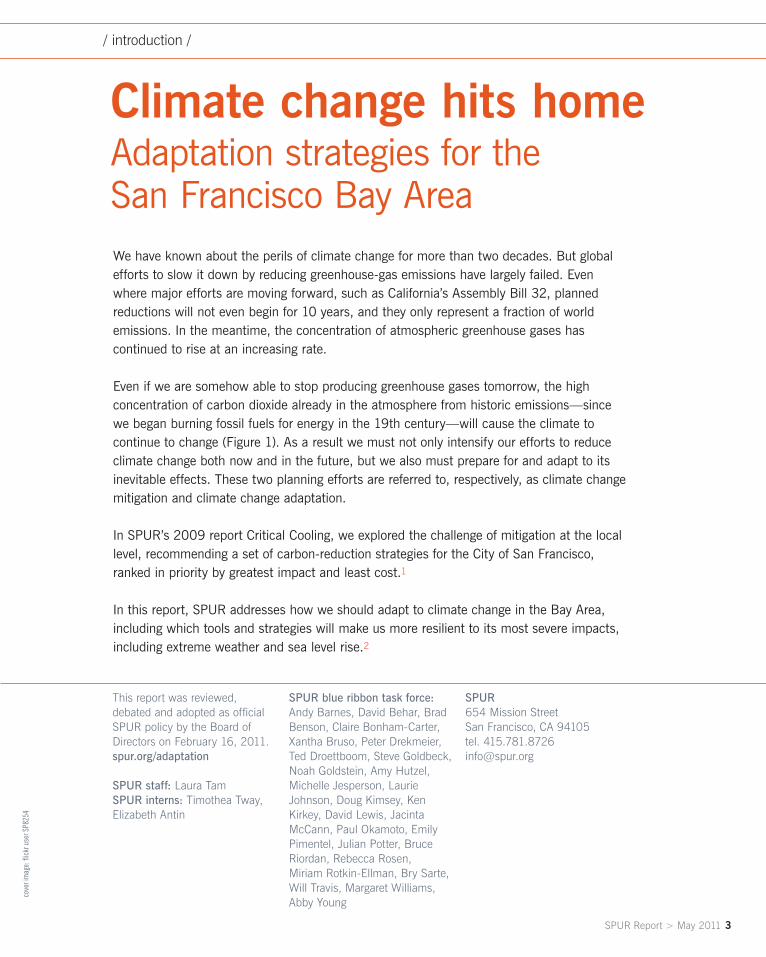
Climate change hits homeAdaptation strategies for the San Francisco Bay Area
cove
r im
age:
flick
r use
r SP8
254
4 SPUR Report > May 2011
Adapting to climate change in the Bay Area
Principles of climate adaptationSeveral key principles about climate adaptation planning are true for the Bay Area and beyond. Some of them represent a new way of doing planning altogether—making decisions based on predictable events in the future, and not at specified points in time.
1. The more mitigation we do now, the less adaptation we may have to do in the future, because climate impacts could be less severe. Climate change mitigation and adaptation are related. Without any mitigation, adaptation will be more difficult and more expensive, and more people are likely to suffer. Some policies or planning actions can support both goals, such as restoring tidal wetlands, which both sequester carbon (mitigation) and act as a buffer against sea level rise (adaptation). Some strategies, however, can pit these goals against each other: Desalination of seawater, for example, is an adaptation strategy for drought that is energy-intensive, usually producing significant levels of greenhouse-gas emissions. In selecting mitigation and adaptation strategies, it is important to consider tradeoffs and try to achieve both ends if possible.
2. Mitigation is much less expensive than adaptation. Mitigation to a stable level of atmospheric carbon would cost about 1 percent of global GDP by 2050, while unmitigated climate impacts would cost
between 5 and 20 percent of global GDP.3 In California, climate mitigation through Assembly Bill 32 is projected to have a net positive economic impact, increasing gross state product, personal income (including $4 billion in fuel savings by 2020) and job creation. But if no actions are taken, climate change-related damage across California could cost anywhere from $7 billion to $46 billion per year. Of the state’s estimated $4 trillion in real estate assets, more than $2.5 trillion will be exposed to increasing risk from extreme weather events, sea level rise and wildfires.4
3. Mitigation should happen globally. Because it is the least expensive way to prevent suffering, mitigation is the first and most important policy tool for managing climate change. Ideally, though, mitigation policy is implemented at an international or national level, where the scope of emissions is much broader. Mitigation strategies that could significantly reduce global carbon emissions include: switching to solar and wind energy; biofuels; energy, heating and transportation efficiency; carbon capture and storage; forestry; and nuclear electricity. SPUR’s 2009 policy paper “Critical Cooling” estimates the benefits and costs of 42 policies that the City of San Francisco could use to meet its own greenhouse-gas reduction targets (which are more stringent than the State of California’s). Our best local strategies for mitigation include efficient land use planning, greater recycling and composting, reducing vehicle miles traveled in a variety of ways, and investing in building efficiency and developing the “smart grid.”
Sour
ce: A
dapt
ed fr
om B
CD
C’s
“Li
ving
w
ith a
Ris
ing
Bay
,” 2
00
9. B
ased
on
data
fro
m IP
CC
.
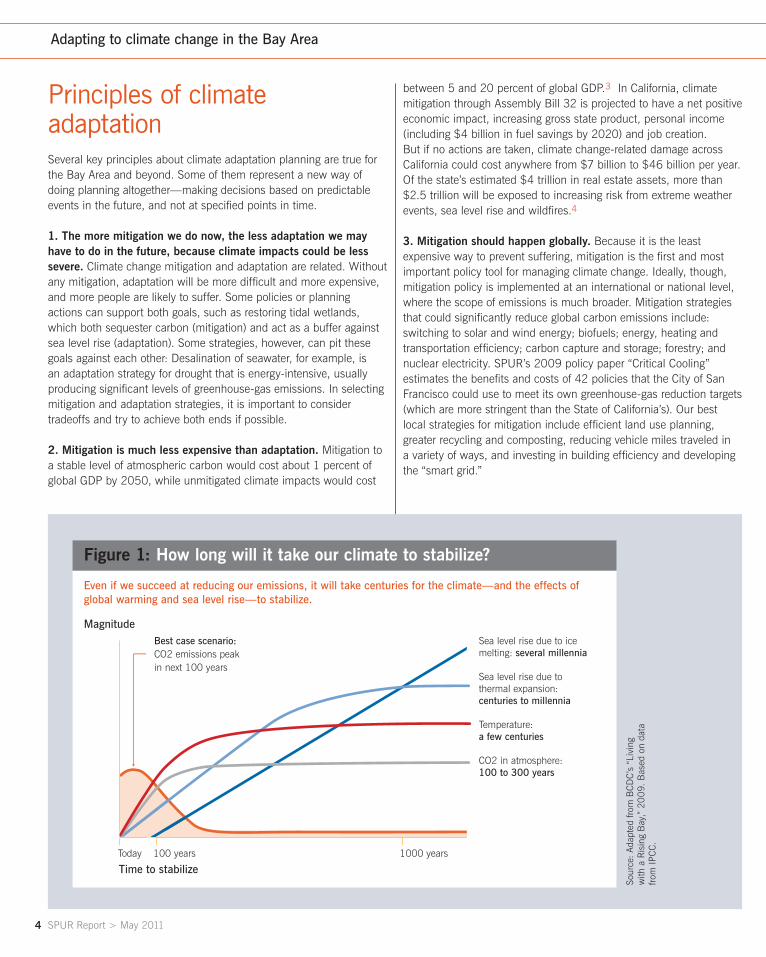
Even if we succeed at reducing our emissions, it will take centuries for the climate—and the effects of global warming and sea level rise—to stabilize.
Figure 1: How long will it take our climate to stabilize?
Sea level rise due to ice melting: several millennia
Sea level rise due to thermal expansion:centuries to millennia
Temperature:a few centuries
CO2 in atmosphere:100 to 300 years
Magnitude
Time to stabilize
Best case scenario: CO2 emissions peak in next 100 years
Today 100 years 1000 years
SPUR Report > May 2011 5
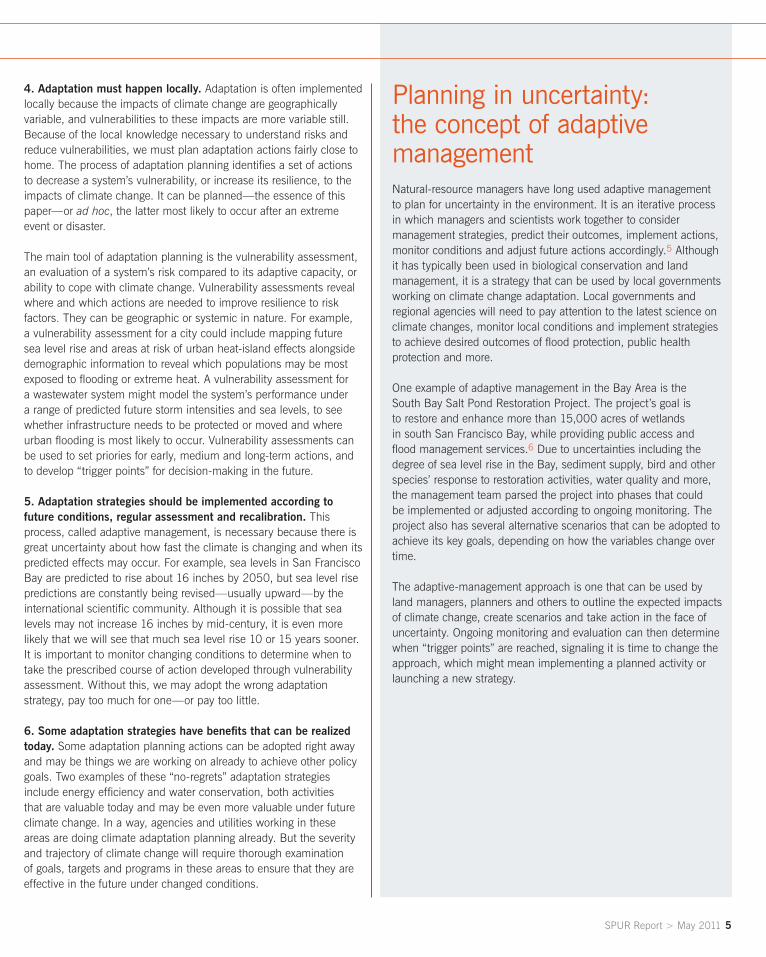
4. Adaptation must happen locally. Adaptation is often implemented locally because the impacts of climate change are geographically variable, and vulnerabilities to these impacts are more variable still. Because of the local knowledge necessary to understand risks and reduce vulnerabilities, we must plan adaptation actions fairly close to home. The process of adaptation planning identifies a set of actions to decrease a system’s vulnerability, or increase its resilience, to the impacts of climate change. It can be planned—the essence of this paper—or ad hoc, the latter most likely to occur after an extreme event or disaster.
The main tool of adaptation planning is the vulnerability assessment, an evaluation of a system’s risk compared to its adaptive capacity, or ability to cope with climate change. Vulnerability assessments reveal where and which actions are needed to improve resilience to risk factors. They can be geographic or systemic in nature. For example, a vulnerability assessment for a city could include mapping future sea level rise and areas at risk of urban heat-island effects alongside demographic information to reveal which populations may be most exposed to flooding or extreme heat. A vulnerability assessment for a wastewater system might model the system’s performance under a range of predicted future storm intensities and sea levels, to see whether infrastructure needs to be protected or moved and where urban flooding is most likely to occur. Vulnerability assessments can be used to set priories for early, medium and long-term actions, and to develop “trigger points” for decision-making in the future.
5. Adaptation strategies should be implemented according to future conditions, regular assessment and recalibration. This process, called adaptive management, is necessary because there is great uncertainty about how fast the climate is changing and when its predicted effects may occur. For example, sea levels in San Francisco Bay are predicted to rise about 16 inches by 2050, but sea level rise predictions are constantly being revised—usually upward—by the international scientific community. Although it is possible that sea levels may not increase 16 inches by mid-century, it is even more likely that we will see that much sea level rise 10 or 15 years sooner. It is important to monitor changing conditions to determine when to take the prescribed course of action developed through vulnerability assessment. Without this, we may adopt the wrong adaptation strategy, pay too much for one—or pay too little.
6. Some adaptation strategies have benefits that can be realized today. Some adaptation planning actions can be adopted right away and may be things we are working on already to achieve other policy goals. Two examples of these “no-regrets” adaptation strategies include energy efficiency and water conservation, both activities that are valuable today and may be even more valuable under future climate change. In a way, agencies and utilities working in these areas are doing climate adaptation planning already. But the severity and trajectory of climate change will require thorough examination of goals, targets and programs in these areas to ensure that they are effective in the future under changed conditions.
Planning in uncertainty: the concept of adaptive managementNatural-resource managers have long used adaptive management to plan for uncertainty in the environment. It is an iterative process in which managers and scientists work together to consider management strategies, predict their outcomes, implement actions, monitor conditions and adjust future actions accordingly.5 Although it has typically been used in biological conservation and land management, it is a strategy that can be used by local governments working on climate change adaptation. Local governments and regional agencies will need to pay attention to the latest science on climate changes, monitor local conditions and implement strategies to achieve desired outcomes of flood protection, public health protection and more.
One example of adaptive management in the Bay Area is the South Bay Salt Pond Restoration Project. The project’s goal is to restore and enhance more than 15,000 acres of wetlands in south San Francisco Bay, while providing public access and flood management services.6 Due to uncertainties including the degree of sea level rise in the Bay, sediment supply, bird and other species’ response to restoration activities, water quality and more, the management team parsed the project into phases that could be implemented or adjusted according to ongoing monitoring. The project also has several alternative scenarios that can be adopted to achieve its key goals, depending on how the variables change over time.
The adaptive-management approach is one that can be used by land managers, planners and others to outline the expected impacts of climate change, create scenarios and take action in the face of uncertainty. Ongoing monitoring and evaluation can then determine when “trigger points” are reached, signaling it is time to change the approach, which might mean implementing a planned activity or launching a new strategy.

6 SPUR Report > May 2011
Adapting to climate change in the Bay Area
The State of California has been very proactive about planning for climate change, funding research on climate impacts, creating the cross-agency California Climate Adaptation Strategy7 and providing strategies for state agencies to manage against climate threats. (See sidebar: “State and regional climate planning in brief.”) Although this guidance is extremely important, there has been less direction provided to local governments, which will probably be the lead agencies for vulnerability assessment and planning going forward due to the geographic and local nature of climate risks. Without planning guidance that local governments can begin using today to establish future “trigger points,” they risk utilizing more ad-hoc approaches, even emergency responses. Such approaches are not only more risky, but they are usually much more expensive and do not build long-term resilience.
This SPUR report describes the expected impacts of climate change in the Bay Area and recommends planning strategies for local governments and other agencies to adapt to these threats. To develop this report, we convened a climate change adaptation task force in May 2009 that met for nine months and included different agency and utility stakeholders in San Francisco and the Bay Area, along with engineering, planning and environmental experts. We also conducted focused workshops throughout 2010 to vet strategies and recommendations. This report first presents an overview of the major climate threats to our region, and then it follows with vulnerability concerns and recommended strategies for local government planning in six areas: public safety and health, transportation, energy, ecosystems and biodiversity, water management and sea level rise.
State and regional climate planning in briefThe State of California has been a nationwide leader in developing comprehensive climate change policy covering both mitigation and adaptation. In 2006, the California Legislature passed the Global Warming Solutions Act, Assembly Bill 32, capping statewide emissions at 1990 levels by 2020. Current implementation includes: regulation through the California Air Resources Board; companion legislation such as Senate Bill 375, which will reduce transportation emissions through regional planning; and executive orders of the governor.
On the adaptation side, state agencies have funded research and statewide and regional vulnerability assessments. And in 2009, the state prepared the cross-agency California Climate Adaptation Strategy,8 one of the most proactive adaptation-planning strategies in the world. The strategy used a collaborative approach to develop hundreds of near-term and long-term actions to improve California’s resilience to climate change in seven key sectors: public health, biodiversity and habitat, oceans and coastal resources, water supply, agriculture, forestry, and transportation and energy infrastructure. Although the strategy is comprehensive, it does not identify sources of funding to implement the actions it recommends. Nevertheless, state agencies, coordinated by the California Resources Agency, have since taken numerous actions to begin implementing the Adaptation Strategy. A progress report released in late 2010 can be found at http://www.climatechange.ca.gov/adaptation.
Two state-funded reports are especially relevant to the Bay Area: the San Francisco Bay Conservation and Development Commission’s (BCDC) “Living with a Rising Bay” (2009),9 a vulnerability assessment of sea level rise in San Francisco Bay, and the Pacific Institute’s “The Impacts of Sea Level Rise on the California Coast” (2009).10 These reports have significantly raised public awareness about the effects of climate change and strategies we can use to improve California’s resilience.
In 2010, the state also created the Cal-Adapt tool to visually display the climate change risks of wildfire, sea level rise, snowpack projections and other climate data in fine-grained Google Earth maps covering all of California. The highest-resolution maps project climate data for an area of about 50 square miles (about the size of San Francisco). Explore the Cal-Adapt website at http://www.climatechange.ca.gov/visualization/index.html
Adapting to climate change in the Bay Area
SPUR Report > May 2011 7
Climate change impacts in the San Francisco Bay Area
flick
r use
r Mot
the b
arbe
r
8 SPUR Report > May 2011
Adapting to climate change in the Bay Area
Global warming is caused by the retention of extra heat in the atmosphere from increasing concentrations of carbon dioxide and other greenhouse gases. Some of this extra heat is absorbed by the oceans, causing them to warm up and expand. The physical manifestations of these changes in the climate are expected to be:
1. Higher temperatures and heat waves2. Water uncertainty: drought, wildfire, extreme storms and flooding3. Sea level rise
In trying to characterize the impacts of climate change as specifically to the Bay Area as possible, SPUR found that studies and data were not always available at the regional scale. However, because the state has done so much research to predict impacts in California, we could find reliable information about state and national trends that we can also expect to occur more locally.
1. Higher temperatures and heat wavesTemperature changes are the primary marker of climate change, and they are also the key driver of changes in other natural systems such as sea levels and hydrologic cycles. However, global temperature rise is not expected to occur uniformly. There are two ways to predict future temperatures in any one place: local trend analysis and downscaling global-scale climate models. Trend analysis requires detailed and lengthy past records of temperature (which the Bay Area has), while global climate models have not been developed at regional or local scales but may be better at predicting future conditions, which are likely to be different than those of the past. In the Bay Area, analysis of historical temperature records from local weather stations since 1950 has shown either no statistical warming or a slight warming of mean temperature.11 In the future, according to downscaled global climate models, the general trend for California is forecast to be a minimum rise of 2 degrees Celsius over the next 100 years. The California Adaptation Strategy projects a rise of 2 to 5 degrees Celsius (4 to 9 degrees Fahrenheit) by 2100, the higher end of the range corresponding to higher-emission world development scenarios modeled by the Intergovernmental Panel on Climate Change.
This means that statewide average temperatures are expected to increase across California, with more pronounced increases in the summer months and nighttime temperatures. Heat waves are expected to increase in frequency, with individual heat waves becoming longer and extending over a larger area, making them more likely to encompass multiple population centers in California at the same time. 12 Inland areas are likely to experience more warming than coastal regions. In the Bay Area, the eastern and southern portions of the region are likely to see more pronounced warming than the coastal, northern and central Bay regions.
Increased temperatures will affect human health, public health systems and the energy grid. There will be an increase in the average number of “extreme heat days”—days that exceed the region’s 90th-percentile average temperature.13 From a 20th-century baseline of an average 12 extreme heat days per year in San Francisco, we may expect to see 20 such days annually through 2035, between 32 and 46 extreme heat days annually by mid-century and 70 to 94 days by the end of the century—an eightfold increase from today.14 This will increase the likelihood of heat-related illness and deaths, burdens that will fall disproportionately on vulnerable communities, especially the poor, the elderly and young children.15
Increased annual temperatures will also lead to shifts in the range, distribution and abundance of plant and animal species.16 This will lead to an overall loss of biodiversity across the state but also to increases within specific areas, such as in the coastal range, with important implications for conservation. Non-native and exotic species, disease and pests are expected to increase, negatively affecting the region’s native flora and fauna. Many species are expected to shift to the north and to higher elevations as a refuge from hotter and drier conditions.17
2. Water uncertainty: droughts, wildfire, extreme storms and floodingPrecipitation patterns that affect most of California’s water supplies are likely to change because of global warming. The Bay Area will see fresh and salt water in unusual quantities, in unusual places and at unusual times. Generally, toward the end of the century we are likely to experience more prolonged shortages in freshwater supplies, as well as extreme weather that could increase local and urban flooding from severe storms. However, we are not expected to experience significant seasonal shifts in our Mediterranean climate of wet winters and hot, dry summers.18
With respect to surface water, the Sierra snowpack that provides natural water storage for freshwater supply—essential for many Bay Area water agencies—is likely to melt earlier and more rapidly. Longer and drier droughts are predicted before the end of the century, leading to increasing frequency and magnitude of water shortages, and exacerbating conflict over an already stretched resource. Across the state, more precipitation will fall as rain instead of snow, leading to water-storage challenges in the dry season. Higher air temperatures will increase water uptake by plants, increase evaporation and decrease soil moisture, resulting in less water flowing into reservoirs.Higher temperatures will also increase water demand across all sectors: domestic, agricultural, commercial and industrial. High water temperatures could decrease water quality, especially in lakes and reservoirs, which could endanger aquatic animals such as cold-water fish, insects and crustaceans.

SPUR Report > May 2011 9
As droughts are expected to increase in frequency—due to the dry season starting earlier and ending later—wildfires are expected to increase in both frequency and intensity.
Groundwater basins used for water supply are threatened with decreased replenishment from lowered precipitation and increased evaporation. They are also at risk of increasing extraction to meet growing supply needs. For coastal freshwater aquifers, paradoxically, this may increase their vulnerability to saltwater intrusion from sea level rise. Saltwater intrusion into coastal aquifers would make some of the freshwater unusable without more intensive treatment. A combination of increased storm intensity and saltwater intrusion into the Sacramento-San Joaquin Delta could increase the risk for flood-caused levee failures, which potentially could destroy low-lying areas and contaminate freshwater supplies stored and conveyed in the Delta.
With respect to storm water and wastewater, heavier downpours and increased runoff could contribute to sewer overflows in the region’s wastewater systems. Urban flooding from extreme storms could threaten public health and safety, damage property and impair coastal water quality—threatening ecosystems, recreational use and shellfish fisheries.
There are 22 wastewater treatment plants on the Bay Area’s shoreline that are vulnerable to a 55-inch rise in sea level, the upper end of projections by 2100. Many of these facilities today lack the capacity to fully handle storm flows and frequently spill sewage into the Bay. Many treatment plants rely on gravity to discharge treated water to the Bay.19 As Bay water levels rise, this mechanism could fail and significantly affect facility operations. Saltwater intrusion into treatment facilities will alter the biotic conditions necessary for the breakdown of waste material.
3. Sea level riseSPUR has already written extensively on how sea level rise occurs and how it will be experienced in the Bay Area.20 Sea level rise occurs because of two natural processes that have been occurring since the last ice age ended approximately 10,000 years ago. One process, thermal expansion of the oceans, refers to the oceans increasing in volume as they absorb atmospheric and land-generated heat, pushing them higher up onto shore. The second process is the melting of land-based ice, such as glaciers and ice sheets that occupy vast areas of Greenland and Antarctica.
In the past 10 to 15 years, the rate of global sea level rise has increased by about 50 percent and is now averaging 3 millimeters per year. Human-induced global warming is a major contributor to this accelerated rise. Although this rate of increase may have been matched or even exceeded in past interglacial periods—the intervals of warmer temperatures between ice ages that occur every 20,000
to 40,000 years—different global conditions existed then. It is now widely accepted that the world’s coastlines and coastal cities will be faced with seas that are rising faster than ever experienced. In California, we are likely to experience a sea level rise of about 16 inches by 2050 and about 55 inches by 2100—and much more after that.21 These estimates are based on ranges that correspond to several global greenhouse-gas emissions scenarios. In the highest-emission scenario, the range of estimated end-of-century sea level rise is between 43 and 69 inches.22
There is deep uncertainty surrounding the feedback loops that could be set off by the rapid melting of large ice sheets. But the latest measurements of global warming emissions and atmospheric carbon dioxide concentrations indicate that the uncertainty is mainly on the upper boundary. That is, things may be worse than anticipated but are unlikely to be better, so an estimate of 55 inches by 2100 may be conservative. To limit this change, emissions reductions must be rapid and extensive, deeper even than what is necessary to limit world temperature increases to 2 degrees Celsius, a widely agreed-upon world policy goal to prevent catastrophic climate change.23
Sea level rise in the region will be experienced at greater or lesser levels depending on land subsidence or tectonic uplift. Some communities of the South Bay, which heavily extracted groundwater up through the 1960s, have sunk below today’s sea level by as much as 13 feet. Parts of the Sacramento-San Joaquin Delta that have been heavily channelized, diked, eroded and oxidized are now 25 feet below sea level. Areas that are sinking or losing land area or wetlands to erosion will experience the impacts of sea level rise sooner and perhaps with greater intensity.
Most of the near-term damage that sea level rise is expected to inflict on developed areas is from storm conditions that occur at the same time as high tides. Storms cause extreme lows in air pressure, allowing the sea level to instantaneously rise above predicted tides. Storms also increase winds, especially onshore winds, that cause bigger, more erosive waves. Finally, they bring rain, which increases water volume in creeks and rivers. Approximately 40 percent of California’s land drains to San Francisco Bay, which means that storm floods will last longer here than in higher-elevation regions. Under existing conditions, the combination of high tides, storm surges and river flooding can raise water levels in the Delta by 51 inches for as long as a day.24 As sea levels rise, low-lying areas protected by already fragile levees will face even greater risk.
10 SPUR Report > May 2011
Adapting to climate change in the Bay Area
Public safety and healthHeatAir qualityHighly vulnerable populationsSPUR’s recommendations
Transportation Ground transportationAirportsPortsSPUR’s recommendations
Ecosystems and biodiversityTerrestrial and watershed ecosystemsEstuarine ecosystemsSPUR’s recommendations
EnergyElectric-grid reliabilityIncreases in energy demandHydroelectricitySea level rise and energy infrastructureSPUR’s recommendations
Water managementSPUR’s recommendations
Sea level riseDesign strategies for sea level riseFinancing and governanceSPUR’s recommendations
Vulnerable areas and adaptation strategies
flick
r use
r oha
d*
Adapting to climate change in the Bay Area
SPUR Report > May 2011 11
SPUR’s task force considered how three primary physical climate changes—increased heat, water uncertainty and sea level rise—will affect various areas of planning in our region and evaluated strategies to adapt to them. In this section we discuss specific regional vulnerability concerns together with recommendations for planning for six areas: public safety and health, transportation, energy, ecosystems and biodiversity, water management and sea level rise.
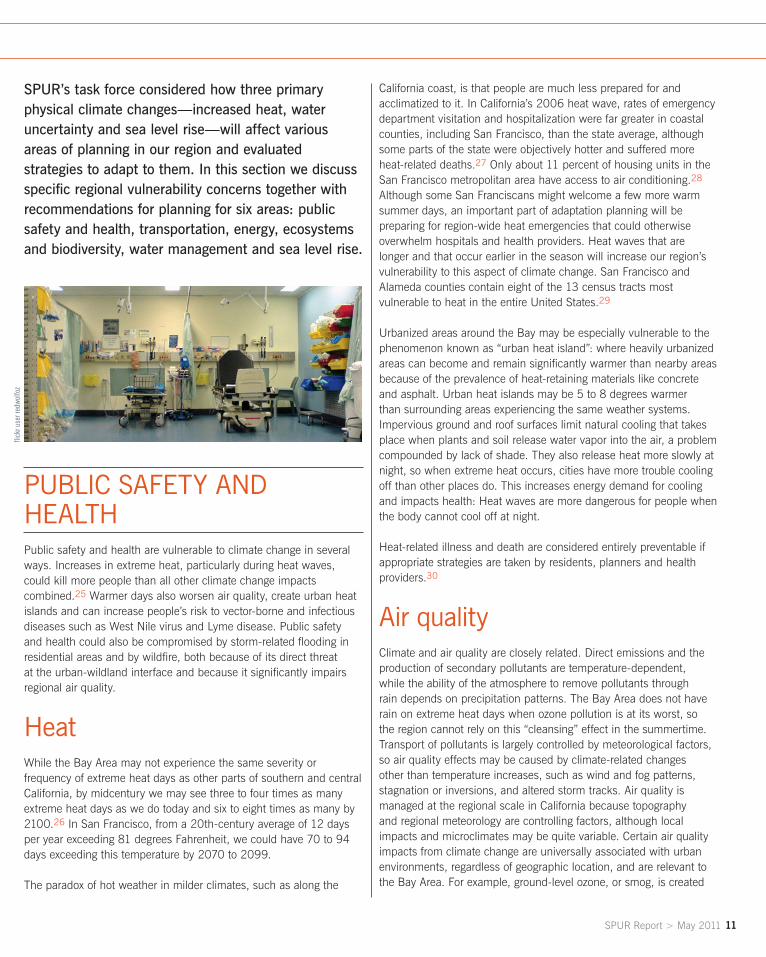
PUBlIC SAFETy AnD HEAlTHPublic safety and health are vulnerable to climate change in several ways. Increases in extreme heat, particularly during heat waves, could kill more people than all other climate change impacts combined.25 Warmer days also worsen air quality, create urban heat islands and can increase people’s risk to vector-borne and infectious diseases such as West Nile virus and Lyme disease. Public safety and health could also be compromised by storm-related flooding in residential areas and by wildfire, both because of its direct threat at the urban-wildland interface and because it significantly impairs regional air quality.
Heat While the Bay Area may not experience the same severity or frequency of extreme heat days as other parts of southern and central California, by midcentury we may see three to four times as many extreme heat days as we do today and six to eight times as many by 2100.26 In San Francisco, from a 20th-century average of 12 days per year exceeding 81 degrees Fahrenheit, we could have 70 to 94 days exceeding this temperature by 2070 to 2099.
The paradox of hot weather in milder climates, such as along the
California coast, is that people are much less prepared for and acclimatized to it. In California’s 2006 heat wave, rates of emergency department visitation and hospitalization were far greater in coastal counties, including San Francisco, than the state average, although some parts of the state were objectively hotter and suffered more heat-related deaths.27 Only about 11 percent of housing units in the San Francisco metropolitan area have access to air conditioning.28 Although some San Franciscans might welcome a few more warm summer days, an important part of adaptation planning will be preparing for region-wide heat emergencies that could otherwise overwhelm hospitals and health providers. Heat waves that are longer and that occur earlier in the season will increase our region’s vulnerability to this aspect of climate change. San Francisco and Alameda counties contain eight of the 13 census tracts most vulnerable to heat in the entire United States.29
Urbanized areas around the Bay may be especially vulnerable to the phenomenon known as “urban heat island”: where heavily urbanized areas can become and remain significantly warmer than nearby areas because of the prevalence of heat-retaining materials like concrete and asphalt. Urban heat islands may be 5 to 8 degrees warmer than surrounding areas experiencing the same weather systems. Impervious ground and roof surfaces limit natural cooling that takes place when plants and soil release water vapor into the air, a problem compounded by lack of shade. They also release heat more slowly at night, so when extreme heat occurs, cities have more trouble cooling off than other places do. This increases energy demand for cooling and impacts health: Heat waves are more dangerous for people when the body cannot cool off at night.
Heat-related illness and death are considered entirely preventable if appropriate strategies are taken by residents, planners and health providers.30
Air quality Climate and air quality are closely related. Direct emissions and the production of secondary pollutants are temperature-dependent, while the ability of the atmosphere to remove pollutants through rain depends on precipitation patterns. The Bay Area does not have rain on extreme heat days when ozone pollution is at its worst, so the region cannot rely on this “cleansing” effect in the summertime. Transport of pollutants is largely controlled by meteorological factors, so air quality effects may be caused by climate-related changes other than temperature increases, such as wind and fog patterns, stagnation or inversions, and altered storm tracks. Air quality is managed at the regional scale in California because topography and regional meteorology are controlling factors, although local impacts and microclimates may be quite variable. Certain air quality impacts from climate change are universally associated with urban environments, regardless of geographic location, and are relevant to the Bay Area. For example, ground-level ozone, or smog, is created
flick
r use
r red
wolfo
z
12 SPUR Report > May 2011
Adapting to climate change in the Bay Area
primarily on hot sunny days from the byproducts of motor vehicle emissions.
Major public health issues related to potential air quality changes from climate change (other than heat waves) in the Bay Area include:• Increasedexposuretoground-levelozone(smog)• Increasedexposuretosmallparticulatematter(PM2.5),including
black carbon•Changesinlevelsofairbornepollens,moldsandotherallergens
Increased exposure to air pollutants including ozone, particulate matter, pollens and molds can aggravate asthma and respiratory diseases, and cause premature death in certain susceptible groups. Continued monitoring and evaluation of changes in precipitation, winds, and offshore and inland conditions will be necessary to create a regional model of climate change impacts on air quality, and to make better predictions of climate change impacts on the many microclimates within the region.
Highly vulnerable populations
While every sector of the population will have to deal with flooding,
warmer temperatures, extreme weather, impaired air and other economic and health issues, some social groups will be more vulnerable than others to these changes. It has been widely known for a long time that on a global scale, the low-income, the very young and the elderly are the populations most vulnerable to climate change impacts.31 In large part, these groups’ vulnerability stems from having less ability to anticipate, cope with and/or recover from a disaster.32 Often, these vulnerable groups reside in locations where heat-related and other pollution is already problematic.
The burdens of higher temperatures and heat waves will fall disproportionately on the poor, the elderly and young children. People with pre-existing health conditions such as asthma, respiratory disease, allergies, diabetes or heart conditions are also more susceptible to the impacts of climate change due to deteriorated air quality and heat-related illness or death. Lower-income neighborhoods are also more vulnerable to urban heat-island effects because they generally have less tree coverage and more impervious ground surfaces. People who live alone are especially vulnerable to heat waves and heat-related illness.
The costs of disaster insurance, healthy food, water, and heating and cooling are expected to rise as a result of climate change.
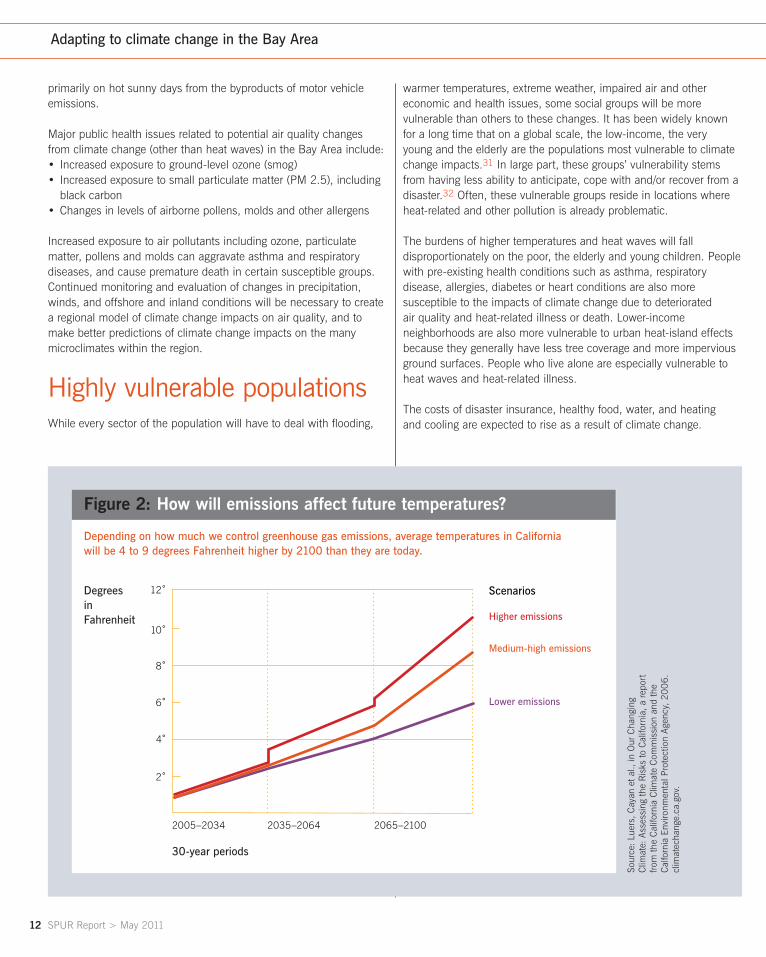
Depending on how much we control greenhouse gas emissions, average temperatures in California will be 4 to 9 degrees Fahrenheit higher by 2100 than they are today.
Sour
ce: L
uers
, Cay
an e
t al.,
in O
ur C
hang
ing
Clim
ate:
Ass
essi
ng th
e R
isks
to C
alifo
rnia
, a r
epor
t fro
m th
e C
alifo
rnia
Clim
ate
Com
mis
sion
and
the
Cal
forn
ia E
nviro
nmen
tal P
rote
ctio
n A
genc
y, 2
00
6.
clim
atec
hang
e.ca
.gov
.
Figure 2: How will emissions affect future temperatures?
DegreesinFahrenheit
30-year periods
12˚
10˚
8˚
6˚
4˚
2˚
Scenarios
Higher emissions
Medium-high emissions
Lower emissions
2035–20642005–2034 2065–2100
SPUR Report > May 2011 13
Low-income communities will spend a larger percentage of their income than middle- and high-income communities to prepare and respond to these impacts. Households without any adult English speakers are also more vulnerable than others. Low-income and linguistically isolated people are less likely to be able to afford emergency supplies or sufficient insurance, or to be able to evacuate during a disaster, either to cooler places or to escape flooding.
SPUR’s recommendations for public safety and health1. Identify populations that are vulnerable to specific climate change threats, and develop countywide climate-preparedness plans. County health agencies should work with city planning, housing and emergency-services departments to identify geographic areas and populations vulnerable to specific climate change threats, such as sea level rise, flooding, fire and urban heat islands. Susceptibility factors that should be part of the vulnerability analysis include housing quality, transportation access, age, poverty and access to health care. These analyses should be used to develop countywide climate-preparedness plans that include actions to reduce vulnerabilities and target health outreach and emergency measures for susceptible people.
2. Reduce urban heat-island effect through three principal “no regrets” strategies: expanding the urban forest, promoting white roofs and using light-colored pavement materials.a. City agencies responsible for urban forestry and street trees—
which could include public works, transportation, and recreation and park departments—should conduct a tree canopy “census” and identify opportunities for better shade-tree coverage in underserved and intensely urbanized areas. This could be done through direct plantings in the public right of way, grants to community tree-planting groups or utility rebates for planting on private property.
b. Building and public-works departments should evaluate alternatives and phase in the use of light-colored concrete, paving and roofing materials on municipal properties.
c. Cities should begin to require lighter materials or white roofs in private development by amending existing building codes for new buildings and major retrofits.
3. Build communications and public warning systems for extreme events such as heat, flooding and poor air quality.a. The Bay Area Air Quality Management District (BAAQMD) should
integrate a heat warning/heat watch system into its “Spare the Air” program.
b. County health agencies should consider the use of “Reverse 911” programs—as are used in San Mateo County, where an emergency-response message “robo-calls” people in their homes—to alert vulnerable groups to dangerous conditions and provide safety information and resources.
c. City emergency-services departments that are able to reach a more general population should incorporate heat warnings and other climate change emergency information into public warning systems, such as AlertSF in San Francisco.
4. Develop robust and comprehensive “heat response plans.” Emergency-services departments, in consultation with county health agencies, should ensure these plans include: establishment of cooling centers; targeted outreach to facilities serving vulnerable populations such as the elderly and young children; community engagement and education; and transportation. Emergency-services departments should also evaluate the preparedness of health services and providers, including community hospitals, for region-wide emergencies and develop contingency plans.
5. Conduct health surveillance and monitor environmental conditions for signs of increasing health risks. The BAAQMD should review regional air-monitoring information to detect any new air quality conditions that could occur from changing weather patterns—for example, elevated levels of particulate matter from more severe wildfires—and could in turn increase health risks. County health agencies should regularly conduct surveillance of health conditions to detect and respond to new patterns in disease or epidemics, such as Lyme disease.
6. Prepare air quality control measures to stabilize regional air quality if conditions deteriorate. The BAAQMD should develop and prioritize air quality mitigation measures, including emergency measures, that can be deployed to protect public health if significant deterioration in regional air quality occurs in the future.
14 SPUR Report > May 2011
Adapting to climate change in the Bay Area
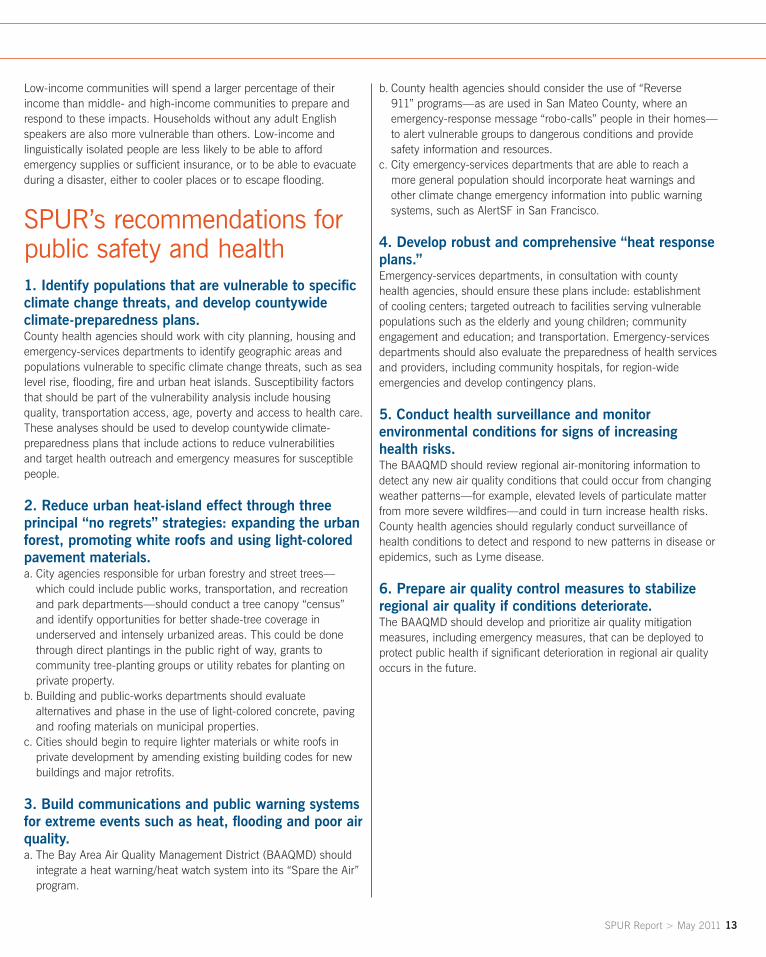
TRAnSPoRTATIonEffects related to climate change—including higher temperatures, extreme weather events, changing precipitation patterns, fire, flooding, landslides and sea level rise—could affect and disrupt transportation systems and infrastructure. Thirty-seven percent of the Bay Area’s economic output is made up of manufacturing, freight transportation and warehouse distribution, and these businesses spend about $6.6 billion annually on transportation services.33 Potential economic impacts of climate change on transportation include: lost worker productivity from delays; impeded and more expensive movement of goods through ports, airports and rail systems; and increased costs of repairs and maintenance of transportation systems. Climate change could also impair the safety of travel.
The country’s most vulnerable transportation infrastructure is that which is located on the shoreline, in the path of sea level rise and storm surges.34 The Bay Area contains about half of the roads at risk of inundation in the State of California and 60 percent of the state’s railroads at risk of a 100-year flood event.35
Climate change will affect transportation systems at all levels including planning, design, construction, operation and maintenance. Several factors contribute to the susceptibility of transportation infrastructure to climate change impacts including infrastructure age, current condition of infrastructure, proximity to other infrastructure elements and current level of service.36
Ground transportationThe regional ground-transportation network in the Bay Area provides mobility to residents and serves ports and airports in the region. Passenger rail service is provided by a variety of operators, including Amtrak, Altamont Commuter Express, Caltrain, Muni and BART. Major roads and highways are also essential for the movement of goods and people in the region. Four primary routes, interstates 880, 580 and 80 and U.S. 101, handle 80 percent of the goods movement in the region.37 The region’s road-and-highway network is
highly congested, and much of the infrastructure is currently in need of repair. Room for highways and railroads to relocate is constrained by other infrastructure, urbanized areas and sensitive wetlands in the Bay itself.
Approximately 99 miles of the major roads and highways in the Bay Area are vulnerable to inundation and flooding from a 16-inch rise in Bay water levels, and 186 miles of major roads and highways are vulnerable to a 55-inch rise. Major roads that could be affected include I-880, U.S. 101, Highway 37, I-680 and Highway 12. Pavement rutting and deterioration may occur with temperature change, resulting in a greater need for road maintenance. Erosion from heavy storm activity can undermine existing roads and support structures, and eventually increase the cost of maintenance. I-80 along the Berkeley and Albany shoreline is especially vulnerable to erosion from increased storm activity.
The Bay Area regional rail network is made up of more than 600 miles of track, of which 105 miles are vulnerable to a 55-inch rise in sea levels. The network serves both passenger carriers and freight lines including Union Pacific, Burlington Northern and Santa Fe. Passenger rail serves the major job centers in the region such as San Francisco, Oakland and San Jose, and the ports in the region rely heavily on the freight rail. With the exception of BART and Muni, these groups use the same tracks, which create congestion problems. Freight demand is expected to increase by 350 percent over the next 50 years, raising significant concerns for congestion levels on existing rail corridors.38 The increase in frequency, intensity or duration of warm weather can increase track buckling on railways, which increases repair and maintenance costs, decreases lifetime expectancy of infrastructure and causes delays in movement of goods and people.
Airports
San Francisco International Airport and Oakland International Airport could be significantly affected by sea level rise because of their low elevation. These airports provide important linkages with trading partners and serve as hubs for the national and global air-passenger system and air-cargo network. Air cargo is the fastest-growing segment of the goods-movement economy and is forecast to triple in the next 20 to 30 years. By 2035, the number of air passengers in the Bay Area is projected to increase by 67 percent, air cargo by 92 percent and business-jet activity by 56 percent.39
Of the 7.3 square miles of land Oakland and San Francisco airports are built on, 93 percent is vulnerable to storm-surge inundation with a 55-inch sea level rise. The runways at SFO were built on landfill but will be protected at least through the middle of the 21st century by a partial seawall and new planned levees in the gap areas that will significantly reduce flooding concerns. Subsidence of the runways is currently addressed through a regular program of paving
flick
r use
r SP8
254
SPUR Report > May 2011 15
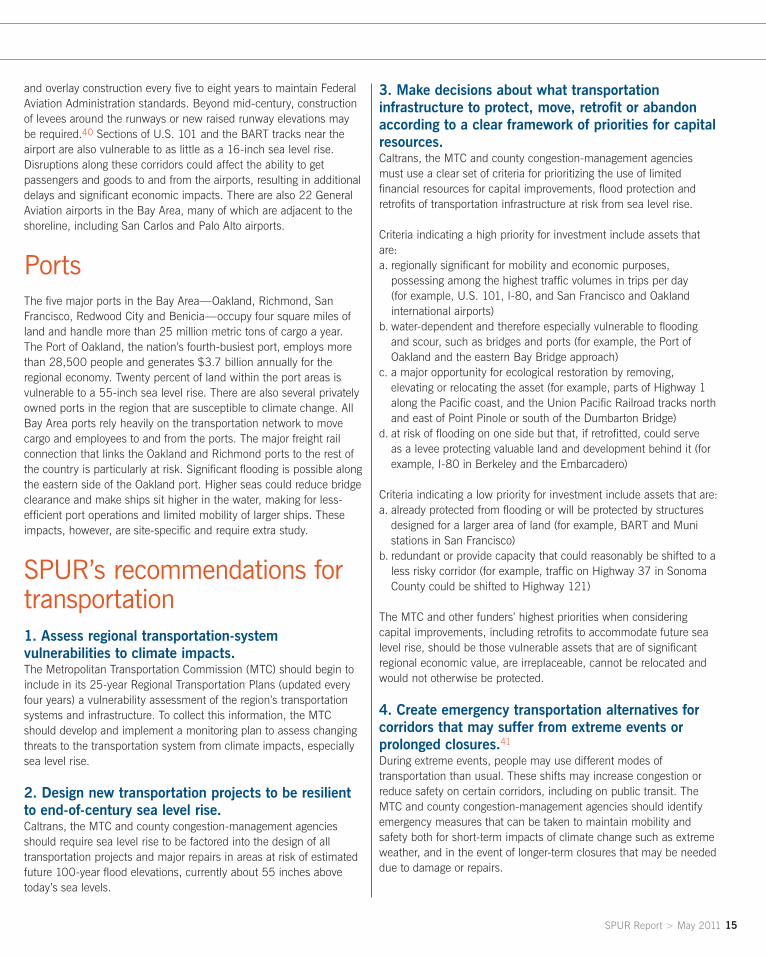
and overlay construction every five to eight years to maintain Federal Aviation Administration standards. Beyond mid-century, construction of levees around the runways or new raised runway elevations may be required.40 Sections of U.S. 101 and the BART tracks near the airport are also vulnerable to as little as a 16-inch sea level rise. Disruptions along these corridors could affect the ability to get passengers and goods to and from the airports, resulting in additional delays and significant economic impacts. There are also 22 General Aviation airports in the Bay Area, many of which are adjacent to the shoreline, including San Carlos and Palo Alto airports.
Ports The five major ports in the Bay Area—Oakland, Richmond, San Francisco, Redwood City and Benicia—occupy four square miles of land and handle more than 25 million metric tons of cargo a year. The Port of Oakland, the nation’s fourth-busiest port, employs more than 28,500 people and generates $3.7 billion annually for the regional economy. Twenty percent of land within the port areas is vulnerable to a 55-inch sea level rise. There are also several privately owned ports in the region that are susceptible to climate change. All Bay Area ports rely heavily on the transportation network to move cargo and employees to and from the ports. The major freight rail connection that links the Oakland and Richmond ports to the rest of the country is particularly at risk. Significant flooding is possible along the eastern side of the Oakland port. Higher seas could reduce bridge clearance and make ships sit higher in the water, making for less-efficient port operations and limited mobility of larger ships. These impacts, however, are site-specific and require extra study.
SPUR’s recommendations for transportation1. Assess regional transportation-system vulnerabilities to climate impacts. The Metropolitan Transportation Commission (MTC) should begin to include in its 25-year Regional Transportation Plans (updated every four years) a vulnerability assessment of the region’s transportation systems and infrastructure. To collect this information, the MTC should develop and implement a monitoring plan to assess changing threats to the transportation system from climate impacts, especially sea level rise.
2. Design new transportation projects to be resilient to end-of-century sea level rise. Caltrans, the MTC and county congestion-management agencies should require sea level rise to be factored into the design of all transportation projects and major repairs in areas at risk of estimated future 100-year flood elevations, currently about 55 inches above today’s sea levels.
3. Make decisions about what transportation infrastructure to protect, move, retrofit or abandon according to a clear framework of priorities for capital resources. Caltrans, the MTC and county congestion-management agencies must use a clear set of criteria for prioritizing the use of limited financial resources for capital improvements, flood protection and retrofits of transportation infrastructure at risk from sea level rise.
Criteria indicating a high priority for investment include assets that are:a. regionally significant for mobility and economic purposes,
possessing among the highest traffic volumes in trips per day (for example, U.S. 101, I-80, and San Francisco and Oakland international airports)
b. water-dependent and therefore especially vulnerable to flooding and scour, such as bridges and ports (for example, the Port of Oakland and the eastern Bay Bridge approach)
c. a major opportunity for ecological restoration by removing, elevating or relocating the asset (for example, parts of Highway 1 along the Pacific coast, and the Union Pacific Railroad tracks north and east of Point Pinole or south of the Dumbarton Bridge)
d. at risk of flooding on one side but that, if retrofitted, could serve as a levee protecting valuable land and development behind it (for example, I-80 in Berkeley and the Embarcadero)
Criteria indicating a low priority for investment include assets that are:a. already protected from flooding or will be protected by structures
designed for a larger area of land (for example, BART and Muni stations in San Francisco)
b. redundant or provide capacity that could reasonably be shifted to a less risky corridor (for example, traffic on Highway 37 in Sonoma County could be shifted to Highway 121)
The MTC and other funders’ highest priorities when considering capital improvements, including retrofits to accommodate future sea level rise, should be those vulnerable assets that are of significant regional economic value, are irreplaceable, cannot be relocated and would not otherwise be protected.
4. Create emergency transportation alternatives for corridors that may suffer from extreme events or prolonged closures.41
During extreme events, people may use different modes of transportation than usual. These shifts may increase congestion or reduce safety on certain corridors, including on public transit. The MTC and county congestion-management agencies should identify emergency measures that can be taken to maintain mobility and safety both for short-term impacts of climate change such as extreme weather, and in the event of longer-term closures that may be needed due to damage or repairs.

16 SPUR Report > May 2011
Adapting to climate change in the Bay Area
ECoSySTEmS AnD BIoDIVERSITyThe San Francisco Bay region is one of North America’s biodiversity hot spots, rich with a variety of habitats, a unique geology and the Bay itself — the second largest estuary in the country. The Bay estuary supports more than 500 wildlife species and is a key stopping point and overwintering grounds for millions of birds along the Pacific Flyway. More than half of North American avian species and nearly one third of California’s plant species are found in the lands of the Golden Gate National Recreation Area alone, a national park that spans 60 miles of coastline and 75,500 acres in three Bay Area counties. But increased temperatures from climate change in the Bay Area could decrease moisture availability, increase frequency of disturbance events and cause a loss of species abundance and diversity. Fragile, vital wetlands in the Bay and its tributaries are threatened by sea level rise.
Terrestrial and watershed ecosystems
The natural communities, plants and wildlife of the Bay Area’s Mediterranean ecosystem have adapted to a climate with a defined wet winter season and dry summer season, as well as a range of temperatures. In some areas, coastal fog continues to provide moisture during the dry summer months. The distinct wet and dry seasons also contribute to the occurrence of disturbance events such as fire and flood. These annual cycles have allowed the natural communities, plants and wildlife to adapt to high variations in conditions.
Temperatures in the Bay Area vary along climatic gradients (temperature as it corresponds to elevation change, and temperature as it corresponds to proximity to the coast) and a complex terrain, resulting in a rich natural community mosaic and high species diversity. Many landscape areas within the Bay region have temperature ranges that are larger than the projected temperature increases from climate change. This may allow many species
throughout the Bay Area to tolerate or adapt to higher temperatures. The Bay’s proximity to the ocean and the continued presence of fog along the coast will likely help to mitigate temperature increases, although the impacts to fog from climate change are not well understood.
Despite these “built-in” adaptive factors, changes in temperature and precipitation driven by global warming may adversely impact certain species or ecological communities by affecting moisture availability. Species with limited distribution, restricted range, inability to relocate or dependence on a finite physical setting such as soil type for their life cycle needs are most vulnerable to changes. The risk of wildfire and the intensity of fire will increase under warmer temperatures and less moisture, and this will drive vegetation shifts. Tree death rates have already more than doubled over the last few decades in old-growth forests of the western United States, and the most probable cause is warmer temperatures and longer summer drought periods.42
Range shifts may occur when a species moves from one location to another or expands its area due to changes in the environment. In California, the combination of increased temperature, changing precipitation patterns and declining soil moisture is likely to shift suitable ranges for many species to the north and to higher elevations.43 For example, modeling work to evaluate suitable habitat conditions for the native blue oak under climate change scenarios shows a loss of the species along its current range in the East Bay and an increased range north of the Bay. Narrowly distributed species and natural communities that already have restricted ranges due to urban growth or dependence on narrow environmental gradients are particularly vulnerable to temperature changes because they will have nowhere to move if their habitat becomes less suitable.44
Coastal areas of California that are already high in species diversity are likely to remain so as species migrate coastward to find suitable temperatures and moisture.45 This is an important finding that should help land managers make conservation priorities. However, high-emission scenarios of future climate change indicate overall decreases in the native biodiversity of California. Combined, the climate-driven shifts in species range, distribution and abundance could lead to a 20 to 40 percent loss of native species in California.46
Rising air temperatures will increase surface-water temperatures in the Bay and in Bay Area rivers, streams and creeks, potentially disrupting the lifecycles of cold-water fish like Chinook salmon. In watersheds that receive a significant proportion of winter precipitation in the form of both rain and snow, the increased proportion of precipitation falling as rain could lead to elevated winter peak flows, which could scour streambeds and destroy salmon eggs. Riparian ecosystems will be vulnerable to changes in seasonality, drier overall conditions and the magnitude of precipitation events.
flick
r use
r Pet
er57
6
SPUR Report > May 2011 17
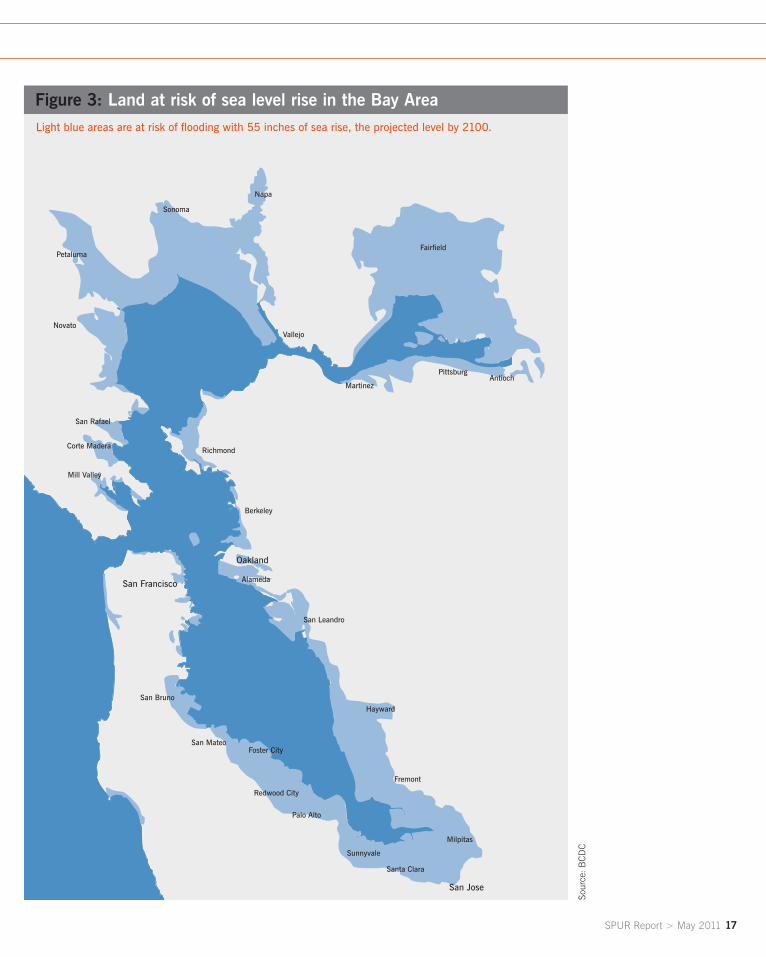
Figure 3: Land at risk of sea level rise in the Bay Area
San Rafael
Corte Madera
Mill Valley
Novato
Petaluma
Sonoma
Napa
Fairfield
San Francisco
PittsburgAntioch
Vallejo
Martinez
Berkeley
Oakland
San Leandro
Foster City
Alameda
Richmond
Fremont
Hayward
San Jose
Milpitas
Santa Clara
Sunnyvale
Redwood City
Palo Alto
San Mateo
San Bruno
Light blue areas are at risk of flooding with 55 inches of sea rise, the projected level by 2100.
Sour
ce: B
CD
C

18 SPUR Report > May 2011
Adapting to climate change in the Bay Area
Estuarine ecosystems The Bay estuary’s high biodiversity and ecological values stem from the rich wetlands along its shoreline, as well as the riparian habitats of tributary streams and rivers. These habitats are essential to the health of the myriad fish and wildlife populations of the region. The Bay hosts more shorebirds than all other coastal California estuaries combined.47 Up to half the populations of migrating West Coast waterfowl overwinter in the Bay estuary.
In addition to providing habitat for shorebirds and other plant and animal species, Bay wetlands provide many ecosystem services that benefit people and the regional economy. Wetlands provide critical flood protection by storing surface water and dissipating wave energy, simultaneously preventing shoreline erosion. Wetlands improve water quality by filtering nutrients, pollutants and particulates, and incorporating these elements in biomass or biochemical reactions. Finally, tidal wetlands sequester carbon in plants and soils, thus reducing carbon dioxide in the atmosphere and mitigating climate change.
Tidal marshes are the natural form of most of the Bay shoreline, but their realm has been reduced to about 8 percent of their historic extent due to filling, armoring and reclamation activities.48 Still, that 8 percent accounts for more than 90 percent of California’s remaining tidal wetlands. Rising sea levels have significant implications for the future persistence of the Bay’s tidal marsh and wetland areas. Tidal marshes are sustained vertically by plant growth and sedimentation that tends to maintain marsh plain elevations within a narrow band of the high intertidal range even as sea level rises. The long-term
sustainability of a marsh at any given site depends on the relative rates of sea level rise, as well as plant productivity, sediment deposition and subsidence, which interact to maintain the marsh elevation in a dynamic equilibrium with tide levels. Thus, as sea level rises, wetlands will migrate landward, assuming there is enough sediment accretion, plant growth to maintain the wetland and room to move.
Sediment deposition naturally occurs through stream and creek inputs from local watersheds, as well as the larger river systems of the Sierra Nevada mountain range, entering the Bay through the Sacramento-San Joaquin Delta. Research on sediment dynamics of the Bay and Delta indicates that sediment inputs to the Bay are decreasing. The challenge to the Bay’s wetlands from sea level rise is two-fold: (1) without room for wetlands to migrate landward with sea level rise, existing wetlands will become submerged and (2) if there is not enough sediment available in the Bay, tidal wetlands will not be able to maintain vertical elevation as sea level rises.
Modeling work evaluating the loss of tidal wetlands as a result of sea level rise indicates that San Francisco Bay could lose a significant portion of intertidal and tidal wetland areas that provide food and shelter for a myriad of shorebirds. The losses could be as great as 50 to 70 percent in the South Bay, depending on other contributing anthropogenic factors such as subsidence.49 Key ecosystem services will also be lost, resulting in the potential for increased shoreline erosion and flooding, and a degradation of the Bay’s water quality.Finally, rising sea levels in combination with changes in timing and quantities of freshwater flows from the Delta will likely increase salinity levels further into the Delta. A reduction in freshwater inputs to the Bay as a result of longer drier summer periods is
flick
r use
r Jill
Clar
dy

SPUR Report > May 2011 19
projected to shift the salinity gradient eastward during the spring and summer.50 This shift may be exacerbated by potential changes in the management of Delta water resources for water supply and agriculture. A salinity increase may reduce plant diversity even more and threaten several of the rare plants that are associated with fresh-brackish marshes in the Delta region.
SPUR’s recommendations for ecosystems and biodiversity1. Protect viable migratory paths for wetlands. Wetland species will need to gradually move landward as lower areas are inundated. Protecting viable migratory pathways is essential to the survivability of at-risk ecosystems that provide pollution filtration, flood protection, carbon sequestration, fisheries and other socioeconomic benefits. There are 417 square miles of Bay and coastal wetlands in the nine-county Bay Area today, and there are only about 57 square miles of dry land area that are viable—i.e., not developed with buildings, infrastructure or agriculture—for wetlands to migrate to.51 These areas are the highest priority for protection and non-conversion to other land uses. The California Coastal Commission, the Coastal Conservancy, BCDC and others should evaluate the vulnerability of existing areas of tidal wetlands in the Bay and on the coast, and should map their natural landward migratory paths under expected amounts of sea level rise. Wherever pathways are identified into vacant or underdeveloped areas that have the potential for substantial wetland restoration, the pathways should not be converted to land uses that would impede migration. Where there are willing landowners, privately owned land viable for wetland migration should be protected by public agencies or land trusts with fee title acquisitions, conservation easements or other agreements with landowners.
2. Prioritize land protection, conservation and restoration efforts in areas with significant topographical relief, such as in the coastal range. Areas that possess a range of elevations within a small geographic area generally have more biodiversity to begin with. Protecting gradients in the landscape will allow species to migrate or seek refuge from hotter, drier conditions.
3. Prioritize protection of habitat linkages connecting large natural areas in the greater Bay Area. The protection of linkages or corridors between large landscapes is a basic conservation tool that will become even more critical to the protection of biodiversity as the climate changes. Identification and protection of wildlife corridors will allow plants and wildlife to migrate northward, to higher elevations or toward the coast as temperatures increase.
4. Update the Baylands Habitat Goals Project to include sea level rise projections. The Baylands Ecosystem Habitat Goals Project is a multiagency effort to identify what kinds and amounts of wetland habitats around the Bay should be restored to sustain diverse wildlife.52 Conceived in 1993 and established in 1999, the goals did not account for future changes in the rate of sea level rise. BCDC, the U.S. Environmental Protection Agency, the Regional Water Quality Control Board, the Coastal Conservancy and other partners should update these goals to strategically target near-term restoration efforts along the Bay shoreline, emphasizing the protection of wetland migratory pathways.
5. Develop a regional sediment-management strategy that could help protect wetlands from sea level rise and prevent adverse water quality impacts. Sediment supply is necessary for wetlands to “keep up” with sea level rise, but it is threatened by dikes and dams upstream in the Bay’s watershed. BCDC should continue and complete its study of sediment in the Bay to contribute to this regional strategy.

20 SPUR Report > May 2011
Adapting to climate change in the Bay Area
EnERGy California’s energy system is vulnerable to climate change in four principal ways:•warmertemperaturesandseverestormscouldreduceelectric-grid
reliability;• energydemand,particularlyforcooling,maydramaticallyincrease;• changingprecipitationpatternscouldaffecthydroelectricity
supplies;• sealevelriseandincreasedstormsurgescouldpotentiallyaffect
energy infrastructure.
Electric-grid reliability While the Bay Area may not experience the same severity or frequency of major heat waves as other areas in California, all parts of the state are linked through the electric grid. If other regions endure a severe heat wave with extreme increases in electricity demand for cooling, the Bay Area’s electric reliability may be more vulnerable. Warmer nights could also lead to the breakdown of key electrical equipment that relies on cooler evening temperatures to operate efficiently. For example, during the hottest week of the July 2006 heat wave, more than 1.2 million of the 5 million PG&E customers at that time were without power at some point, due in part to the number of transformers that could not continue operating in those temperatures. PG&E lost more than 1,100 transformers during the heat wave, which, while less than one-tenth of the one million transformers in its system, was enough to interrupt the transmission of power to more than a fifth of its customers.53
Higher temperatures also decrease the efficiency of fossil fuel-burning power plants, some types of renewable power plants such as solar photovoltaic, and energy transmission lines, thus requiring either increased production or improvements in the efficiency of power generation and transmission.54 Humidity changes can also affect cooling demand and may decrease the efficiency of equipment.
Currently many Bay Area communities suffer power outages during extreme winter weather events, through either downed power lines or
flooded infrastructure. This could increase if extreme weather events increase in frequency or magnitude under climate change.
Increases in energy demandMost commercial and residential buildings in California were built to accommodate wide variations in temperature and will have few structural problems adjusting to projected end-of-century temperature increases. However, there may be significant increases in energy use by buildings with older technologies in place, poor energy efficiency or heavy reliance on active cooling strategies. As temperatures in California are expected to increase more in summer than in winter, buildings in general will exhibit higher demand for summertime cooling, largely provided through electricity. This is likely to outweigh reductions in wintertime heating demand, which is largely provided through natural gas.55 In particular, electricity demand for cooling will rise at the same time as higher temperatures threaten important electrical infrastructure, straining local and statewide electric grids. As energy demand increases, and electric grids become more vulnerable, local on-demand “peaker” power plants and backup generators may be switched on, increasing both greenhouse gas emissions and localized air pollution.
Energy efficiency to reduce demand is a “no-regrets” climate mitigation and adaptation strategy that has significant cost savings. If California improves energy efficiency by 1 percent per year, gross state product will increase by approximately $76 billion, real household incomes will increase by up to $48 billion and more than 400,000 jobs will be created.56
Hydroelectricity
Climate scientists predict that climate change will result in significant reductions in snowpack in the Sierra Nevada Mountains. This impact could, in turn, affect utilities’ hydroelectric generation. This is especially important to utilities in the Bay Area such as PG&E, the San Francisco Public Utilities Commission (SFPUC), Alameda Municipal Power and City of Palo Alto Utilities, which each obtain at least 10 percent of their electricity from hydroelectricity.
PG&E does not anticipate that reductions in Sierra Nevada snowpack alone will have a significant effect on its hydroelectric generation in the near term, due in large part to adaptation strategies possible with existing operations and resources. These include: increasing winter carryover reservoir storage levels; reducing conveyance flows in canals and flumes in response to an increased portion of precipitation falling as rain; and reducing discretionary reservoir water releases during the late spring and summer.
However, in the long term, or in the case of several successive dry years that create drought conditions, reservoir levels can be reduced
flick
r use
r Pet
er57
6
SPUR Report > May 2011 21
to levels lower than those required for hydroelectric power generation. The recent drought in California illustrates the possible negative consequences of climate change on hydroelectricity. For example, from 2006 (a wetter than average year) to 2007 (a drier than average year), PG&E’s hydroelectric generation dropped from 22 to 13 percent of its delivery mix. If Bay Area utilities’ future hydroelectric generation is reduced, that supply might be generated instead by natural gas-fired power plants, which would increase greenhouse-gas emissions and other pollutants.
The annual economic impact in California of climate-induced damage due to the loss of hydropower and the increase in demand for electricity is expected to range from $2.7 billion to $6.3 billion, with roughly $21 billion in energy assets at risk.57
Sea level rise and energy infrastructure Projected sea level rise along California’s coast may result in higher flooding potential of coastal energy infrastructure, such as natural gas pipelines and compressor stations, electrical substations, electric transmission lines and power plants.
SPUR’s recommendations for energy1. Conduct a vulnerability assessment of energy-system assets at risk of climate impacts. All energy utilities should conduct vulnerability assessments of energy-system assets at risk of climate impacts and over time should improve the reliability of energy infrastructure and equipment that is identified as most likely to fail during extreme events, in balance with cost, safety and other factors.
2. Develop plans to close the electricity supply gap under conditions where hydroelectric resources are diminished or nonexistent. PG&E, the SFPUC and other utilities that rely on hydroelectricity should develop plans for coping with diminished resources. The plans should identify ways to make up the difference through energy efficiency and demand-response first, renewable resources and distributed generation second, and clean and efficient fossil fuel generation third, in keeping with the California Energy Action Plan “loading order,” which describes the priority by which the state should meet new energy demands.
3. Evaluate existing energy-efficiency and demand-response programs for their effectiveness at shaving peak electricity demand in more frequent and
prolonged hot weather. PG&E and local government energy programs funded by ratepayers are both responsible for executing and ensuring the effectiveness of these programs. These programs must consider longer and more frequent hot-weather periods. Two promising strategies for improving demand response and load management in hot weather are smart meters and a smart grid.
4. Replace or retrofit the building stock over time with resource-efficient, climate-adaptive buildings. Codes covering new buildings and major retrofits should encourage designs that make buildings more resilient to energy-supply interruptions and droughts, employing technologies such as passive heating and cooling, daylighting, graywater reuse, water recycling, distributed generation and more. Building codes could be built upon existing third-party standards such as the U.S. Green Building Council’s LEED, Build It Green’s GreenPoint Rated or additional standards aimed specifically at resilience and passive survivability. Wider adoption of green-building standards would improve regional climate resilience—but because building-stock turnover is slow, this strategy will take decades to realize significant change.
22 SPUR Report > May 2011
Adapting to climate change in the Bay Area
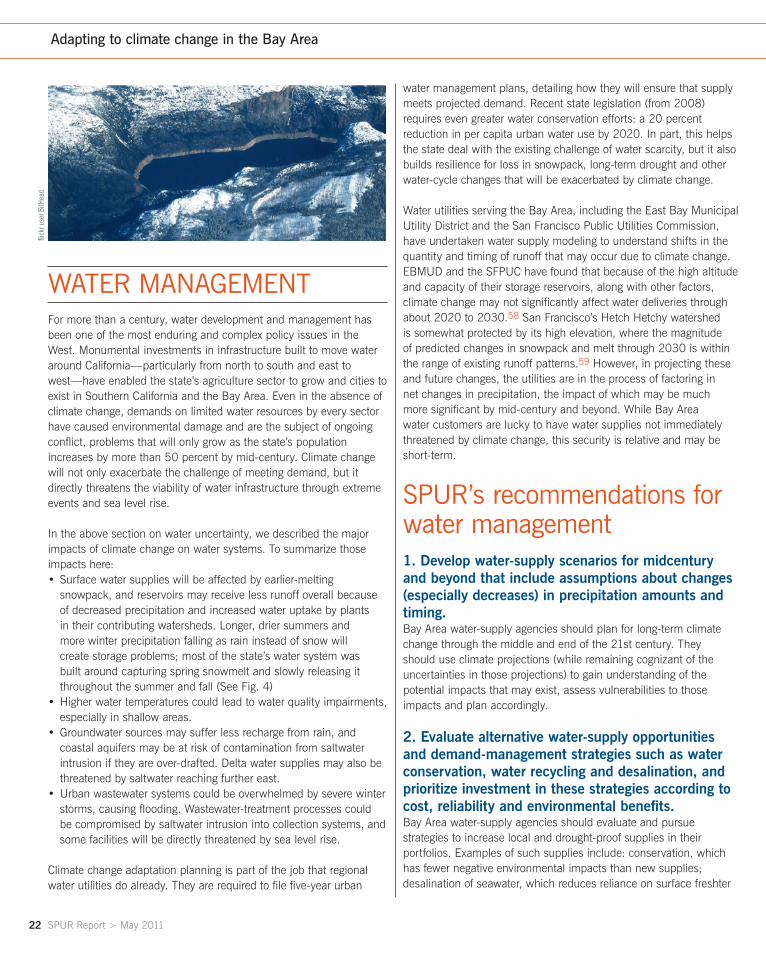
WATER mAnAGEmEnTFor more than a century, water development and management has been one of the most enduring and complex policy issues in the West. Monumental investments in infrastructure built to move water around California—particularly from north to south and east to west—have enabled the state’s agriculture sector to grow and cities to exist in Southern California and the Bay Area. Even in the absence of climate change, demands on limited water resources by every sector have caused environmental damage and are the subject of ongoing conflict, problems that will only grow as the state’s population increases by more than 50 percent by mid-century. Climate change will not only exacerbate the challenge of meeting demand, but it directly threatens the viability of water infrastructure through extreme events and sea level rise.
In the above section on water uncertainty, we described the major impacts of climate change on water systems. To summarize those impacts here:•Surfacewatersupplieswillbeaffectedbyearlier-melting
snowpack, and reservoirs may receive less runoff overall because of decreased precipitation and increased water uptake by plants in their contributing watersheds. Longer, drier summers and more winter precipitation falling as rain instead of snow will create storage problems; most of the state’s water system was built around capturing spring snowmelt and slowly releasing it throughout the summer and fall (See Fig. 4)
•Higherwatertemperaturescouldleadtowaterqualityimpairments,especially in shallow areas.
•Groundwatersourcesmaysufferlessrechargefromrain,andcoastal aquifers may be at risk of contamination from saltwater intrusion if they are over-drafted. Delta water supplies may also be threatened by saltwater reaching further east.
•Urbanwastewatersystemscouldbeoverwhelmedbyseverewinterstorms, causing flooding. Wastewater-treatment processes could be compromised by saltwater intrusion into collection systems, and some facilities will be directly threatened by sea level rise.
Climate change adaptation planning is part of the job that regional water utilities do already. They are required to file five-year urban
water management plans, detailing how they will ensure that supply meets projected demand. Recent state legislation (from 2008) requires even greater water conservation efforts: a 20 percent reduction in per capita urban water use by 2020. In part, this helps the state deal with the existing challenge of water scarcity, but it also builds resilience for loss in snowpack, long-term drought and other water-cycle changes that will be exacerbated by climate change.
Water utilities serving the Bay Area, including the East Bay Municipal Utility District and the San Francisco Public Utilities Commission, have undertaken water supply modeling to understand shifts in the quantity and timing of runoff that may occur due to climate change. EBMUD and the SFPUC have found that because of the high altitude and capacity of their storage reservoirs, along with other factors, climate change may not significantly affect water deliveries through about 2020 to 2030.58 San Francisco’s Hetch Hetchy watershed is somewhat protected by its high elevation, where the magnitude of predicted changes in snowpack and melt through 2030 is within the range of existing runoff patterns.59 However, in projecting these and future changes, the utilities are in the process of factoring in net changes in precipitation, the impact of which may be much more significant by mid-century and beyond. While Bay Area water customers are lucky to have water supplies not immediately threatened by climate change, this security is relative and may be short-term.
SPUR’s recommendations for water management1. Develop water-supply scenarios for midcentury and beyond that include assumptions about changes (especially decreases) in precipitation amounts and timing. Bay Area water-supply agencies should plan for long-term climate change through the middle and end of the 21st century. They should use climate projections (while remaining cognizant of the uncertainties in those projections) to gain understanding of the potential impacts that may exist, assess vulnerabilities to those impacts and plan accordingly.
2. Evaluate alternative water-supply opportunities and demand-management strategies such as water conservation, water recycling and desalination, and prioritize investment in these strategies according to cost, reliability and environmental benefits. Bay Area water-supply agencies should evaluate and pursue strategies to increase local and drought-proof supplies in their portfolios. Examples of such supplies include: conservation, which has fewer negative environmental impacts than new supplies; desalination of seawater, which reduces reliance on surface freshter
flick
r use
r BitH
ead
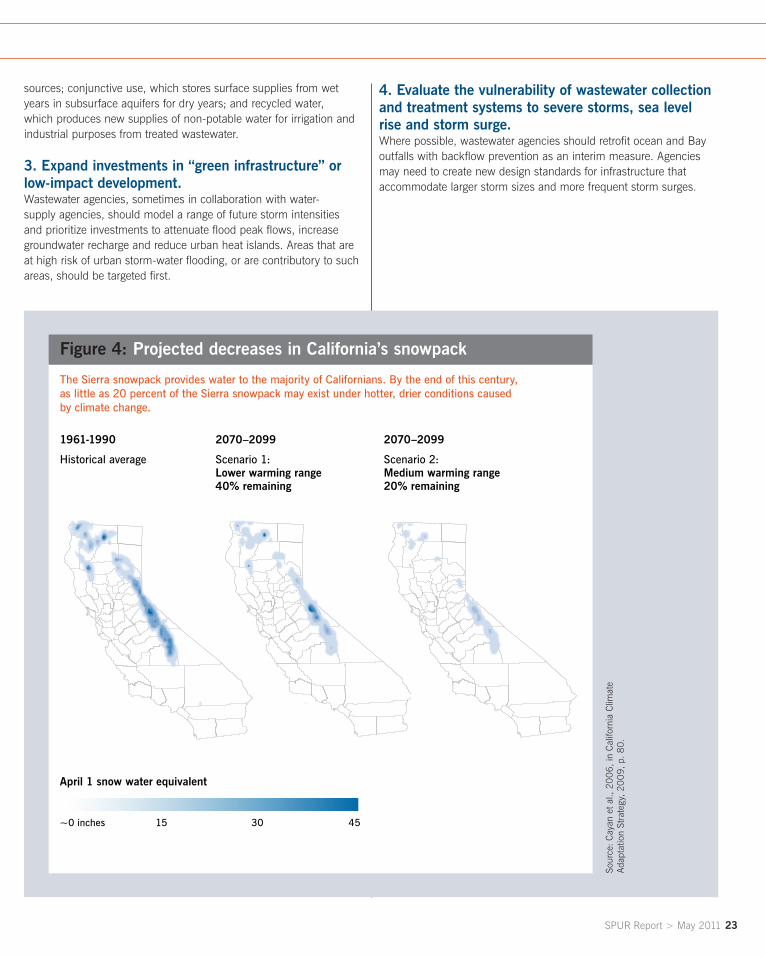
SPUR Report > May 2011 23
sources; conjunctive use, which stores surface supplies from wet years in subsurface aquifers for dry years; and recycled water, which produces new supplies of non-potable water for irrigation and industrial purposes from treated wastewater.
3. Expand investments in “green infrastructure” or low-impact development. Wastewater agencies, sometimes in collaboration with water-supply agencies, should model a range of future storm intensities and prioritize investments to attenuate flood peak flows, increase groundwater recharge and reduce urban heat islands. Areas that are at high risk of urban storm-water flooding, or are contributory to such areas, should be targeted first.
4. Evaluate the vulnerability of wastewater collection and treatment systems to severe storms, sea level rise and storm surge. Where possible, wastewater agencies should retrofit ocean and Bay outfalls with backflow prevention as an interim measure. Agencies may need to create new design standards for infrastructure that accommodate larger storm sizes and more frequent storm surges.
Sour
ce: C
ayan
et a
l., 2
00
6, in
Cal
iforn
ia C
limat
e Ad
apta
tion
Stra
tegy
, 20
09,
p. 8
0.
The Sierra snowpack provides water to the majority of Californians. By the end of this century, as little as 20 percent of the Sierra snowpack may exist under hotter, drier conditions caused by climate change.
Figure 4: Projected decreases in California’s snowpack
2070–2099 Scenario 1: Lower warming range 40% remaining
2070–2099 Scenario 2: Medium warming range 20% remaining
1961-1990 Historical average
45~0 inches 15 30
April 1 snow water equivalent
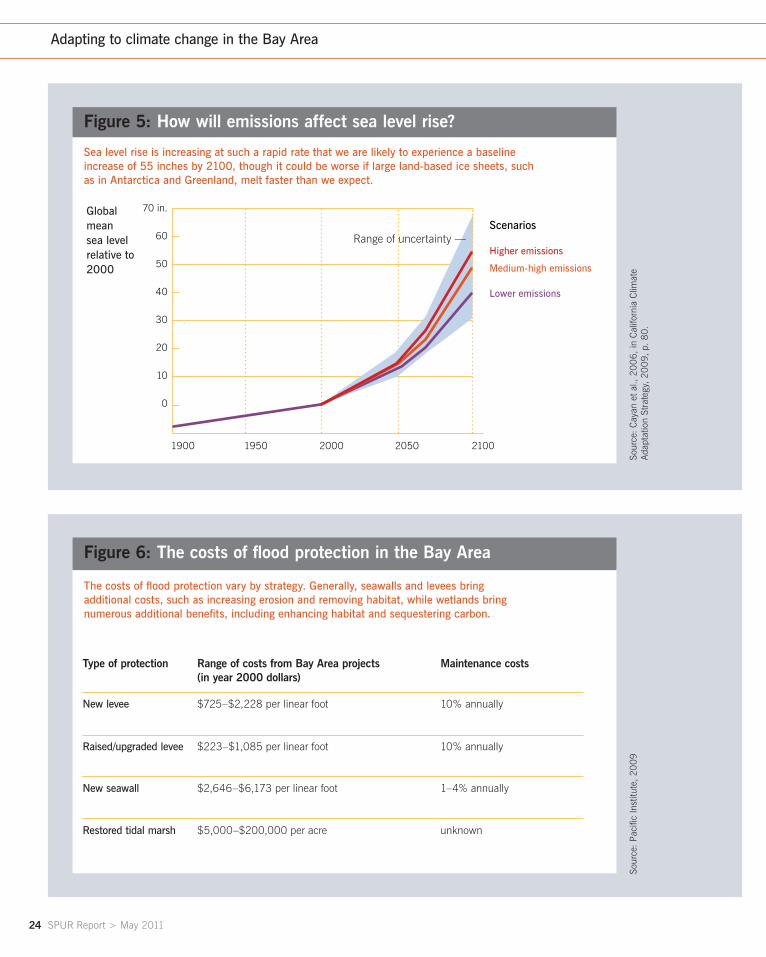
24 SPUR Report > May 2011
Adapting to climate change in the Bay Area
The costs of flood protection vary by strategy. Generally, seawalls and levees bring additional costs, such as increasing erosion and removing habitat, while wetlands bring numerous additional benefits, including enhancing habitat and sequestering carbon.
Figure 6: The costs of flood protection in the Bay Area
Type of protection Range of costs from Bay Area projects(in year 2000 dollars)
Maintenance costs
New levee $725–$2,228 per linear foot 10% annually
Raised/upgraded levee $223–$1,085 per linear foot 10% annually
New seawall $2,646–$6,173 per linear foot 1–4% annually
Restored tidal marsh $5,000–$200,000 per acre unknown
Global mean sea level relative to 2000
Range of uncertainty —Scenarios
Higher emissions
Medium-high emissions
Lower emissions
1900
70 in.
60
50
40
30
20
10
0
1950 2000 2050 2100
Sour
ce: C
ayan
et a
l., 2
00
6, in
Cal
iforn
ia C
limat
e Ad
apta
tion
Stra
tegy
, 20
09,
p. 8
0.So
urce
: Pac
ific
Inst
itute
, 20
09
Sea level rise is increasing at such a rapid rate that we are likely to experience a baseline increase of 55 inches by 2100, though it could be worse if large land-based ice sheets, such as in Antarctica and Greenland, melt faster than we expect.
Figure 5: How will emissions affect sea level rise?
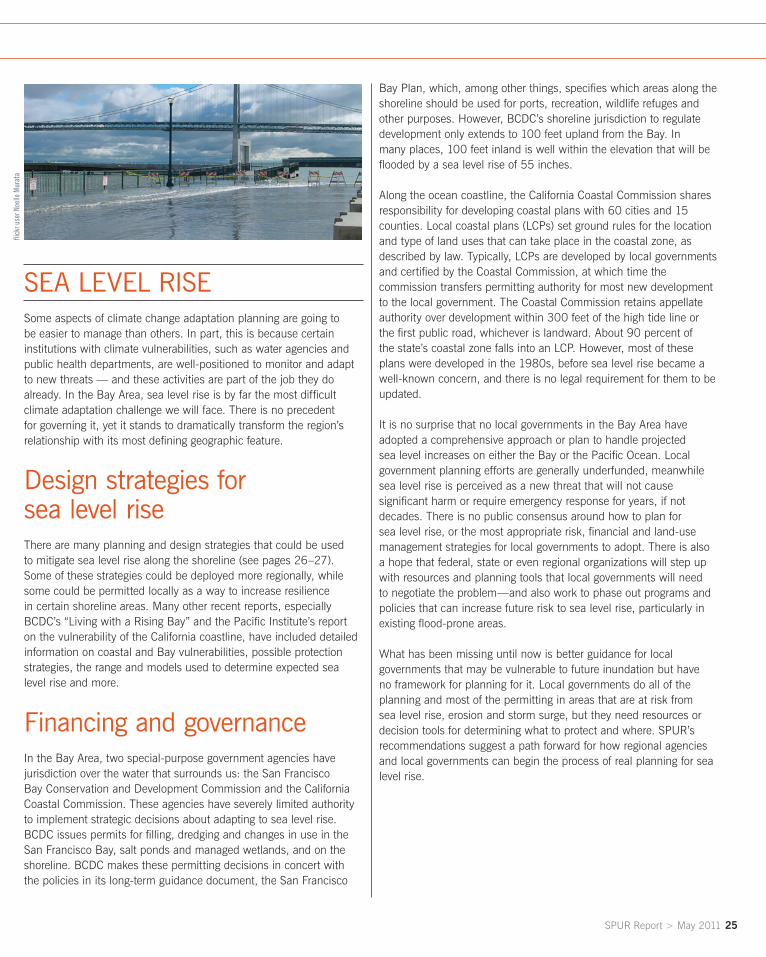
SPUR Report > May 2011 25
SEA lEVEl RISESome aspects of climate change adaptation planning are going to be easier to manage than others. In part, this is because certain institutions with climate vulnerabilities, such as water agencies and public health departments, are well-positioned to monitor and adapt to new threats — and these activities are part of the job they do already. In the Bay Area, sea level rise is by far the most difficult climate adaptation challenge we will face. There is no precedent for governing it, yet it stands to dramatically transform the region’s relationship with its most defining geographic feature.
Design strategies for sea level rise There are many planning and design strategies that could be used to mitigate sea level rise along the shoreline (see pages 26–27). Some of these strategies could be deployed more regionally, while some could be permitted locally as a way to increase resilience in certain shoreline areas. Many other recent reports, especially BCDC’s “Living with a Rising Bay” and the Pacific Institute’s report on the vulnerability of the California coastline, have included detailed information on coastal and Bay vulnerabilities, possible protection strategies, the range and models used to determine expected sea level rise and more.
Financing and governanceIn the Bay Area, two special-purpose government agencies have jurisdiction over the water that surrounds us: the San Francisco Bay Conservation and Development Commission and the California Coastal Commission. These agencies have severely limited authority to implement strategic decisions about adapting to sea level rise. BCDC issues permits for filling, dredging and changes in use in the San Francisco Bay, salt ponds and managed wetlands, and on the shoreline. BCDC makes these permitting decisions in concert with the policies in its long-term guidance document, the San Francisco
Bay Plan, which, among other things, specifies which areas along the shoreline should be used for ports, recreation, wildlife refuges and other purposes. However, BCDC’s shoreline jurisdiction to regulate development only extends to 100 feet upland from the Bay. In many places, 100 feet inland is well within the elevation that will be flooded by a sea level rise of 55 inches.
Along the ocean coastline, the California Coastal Commission shares responsibility for developing coastal plans with 60 cities and 15 counties. Local coastal plans (LCPs) set ground rules for the location and type of land uses that can take place in the coastal zone, as described by law. Typically, LCPs are developed by local governments and certified by the Coastal Commission, at which time the commission transfers permitting authority for most new development to the local government. The Coastal Commission retains appellate authority over development within 300 feet of the high tide line or the first public road, whichever is landward. About 90 percent of the state’s coastal zone falls into an LCP. However, most of these plans were developed in the 1980s, before sea level rise became a well-known concern, and there is no legal requirement for them to be updated.
It is no surprise that no local governments in the Bay Area have adopted a comprehensive approach or plan to handle projected sea level increases on either the Bay or the Pacific Ocean. Local government planning efforts are generally underfunded, meanwhile sea level rise is perceived as a new threat that will not cause significant harm or require emergency response for years, if not decades. There is no public consensus around how to plan for sea level rise, or the most appropriate risk, financial and land-use management strategies for local governments to adopt. There is also a hope that federal, state or even regional organizations will step up with resources and planning tools that local governments will need to negotiate the problem—and also work to phase out programs and policies that can increase future risk to sea level rise, particularly in existing flood-prone areas.
What has been missing until now is better guidance for local governments that may be vulnerable to future inundation but have no framework for planning for it. Local governments do all of the planning and most of the permitting in areas that are at risk from sea level rise, erosion and storm surge, but they need resources or decision tools for determining what to protect and where. SPUR’s recommendations suggest a path forward for how regional agencies and local governments can begin the process of real planning for sea level rise.
flick
r use
r Noe
lle M
urat
a
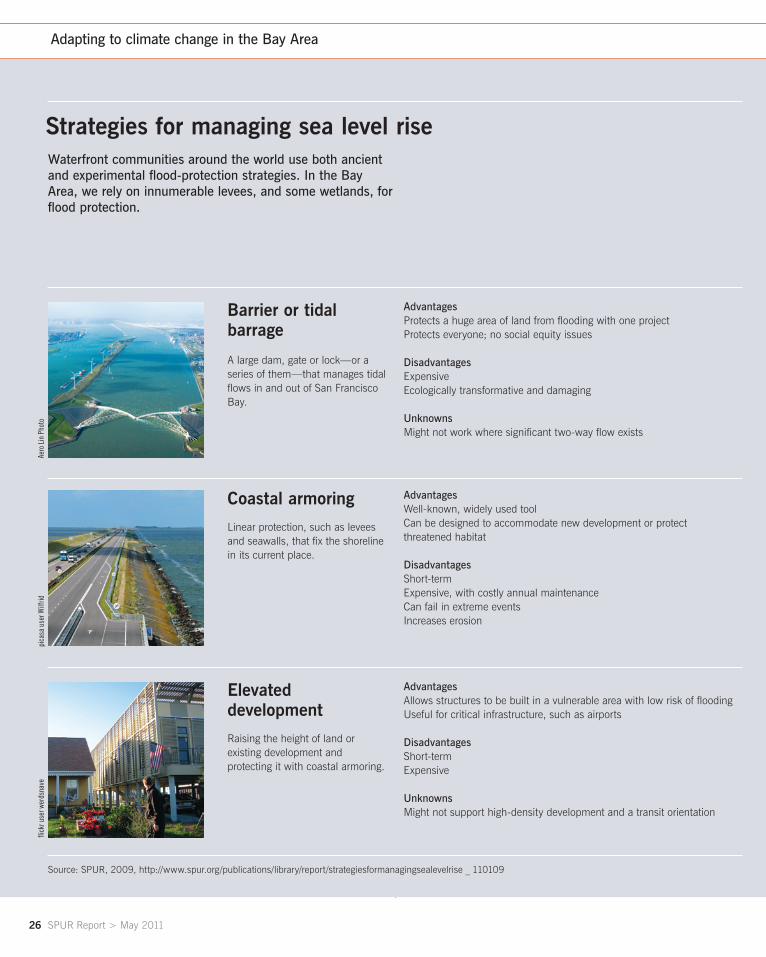
26 SPUR Report > May 2011
Adapting to climate change in the Bay Area
Strategies for managing sea level riseWaterfront communities around the world use both ancient and experimental flood-protection strategies. In the Bay Area, we rely on innumerable levees, and some wetlands, for flood protection.
Source: SPUR, 2009, http://www.spur.org/publications/library/report/strategiesformanagingsealevelrise _ 110109
Barrier or tidal barrage
A large dam, gate or lock—or a series of them—that manages tidal flows in and out of San Francisco Bay.
Coastal armoring
Linear protection, such as levees and seawalls, that fix the shoreline in its current place.
Elevated development
Raising the height of land or existing development and protecting it with coastal armoring.
AdvantagesProtects a huge area of land from flooding with one projectProtects everyone; no social equity issues
DisadvantagesExpensiveEcologically transformative and damaging
UnknownsMight not work where significant two-way flow exists
AdvantagesWell-known, widely used toolCan be designed to accommodate new development or protect threatened habitat
DisadvantagesShort-termExpensive, with costly annual maintenanceCan fail in extreme eventsIncreases erosion
AdvantagesAllows structures to be built in a vulnerable area with low risk of floodingUseful for critical infrastructure, such as airports
DisadvantagesShort-termExpensive
UnknownsMight not support high-density development and a transit orientation
Aero
Lin
Pho
topi
casa
use
r Wilf
ridfli
ckr u
ser w
erds
nave
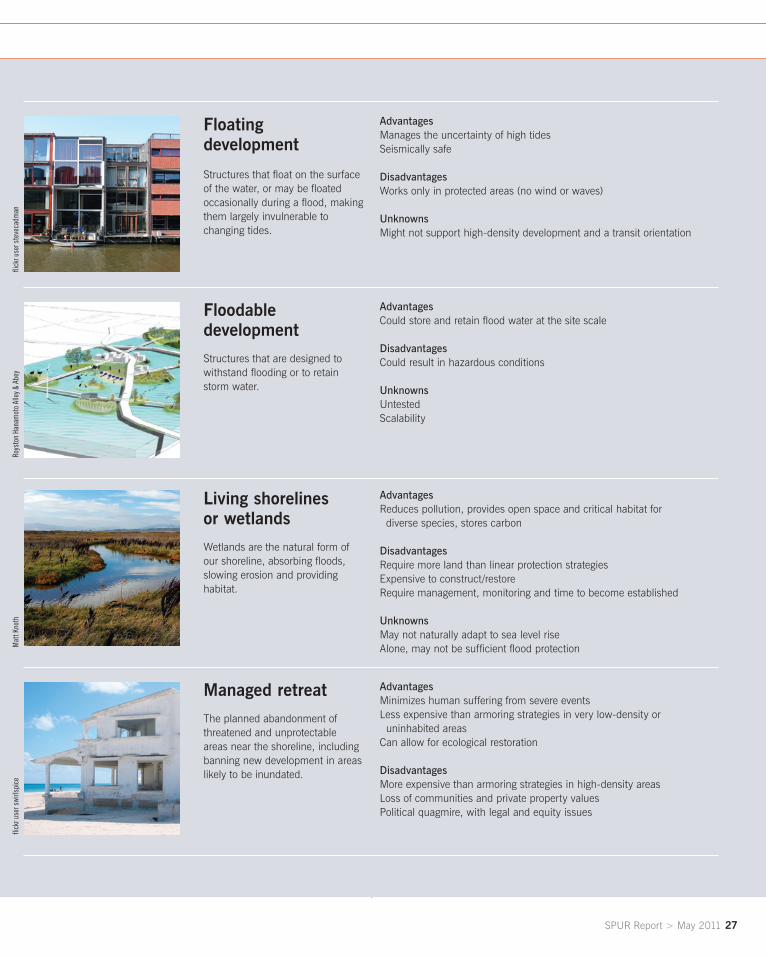
SPUR Report > May 2011 27
Floating development
Structures that float on the surface of the water, or may be floated occasionally during a flood, making them largely invulnerable to changing tides.
Floodable development
Structures that are designed to withstand flooding or to retain storm water.
Living shorelines or wetlands
Wetlands are the natural form of our shoreline, absorbing floods, slowing erosion and providing habitat.
Managed retreat
The planned abandonment of threatened and unprotectable areas near the shoreline, including banning new development in areas likely to be inundated.
AdvantagesManages the uncertainty of high tidesSeismically safe
DisadvantagesWorks only in protected areas (no wind or waves)
UnknownsMight not support high-density development and a transit orientation
AdvantagesCould store and retain flood water at the site scale
DisadvantagesCould result in hazardous conditions
UnknownsUntestedScalability
AdvantagesReduces pollution, provides open space and critical habitat for diverse species, stores carbon
DisadvantagesRequire more land than linear protection strategiesExpensive to construct/restoreRequire management, monitoring and time to become established
UnknownsMay not naturally adapt to sea level riseAlone, may not be sufficient flood protection
AdvantagesMinimizes human suffering from severe eventsLess expensive than armoring strategies in very low-density or uninhabited areasCan allow for ecological restoration
DisadvantagesMore expensive than armoring strategies in high-density areasLoss of communities and private property valuesPolitical quagmire, with legal and equity issues
flick
r use
r ste
veca
dman
Roys
ton
Hana
mot
o Alle
y & A
bey
Mat
t Kno
thfli
ckr u
ser s
wirls
pice
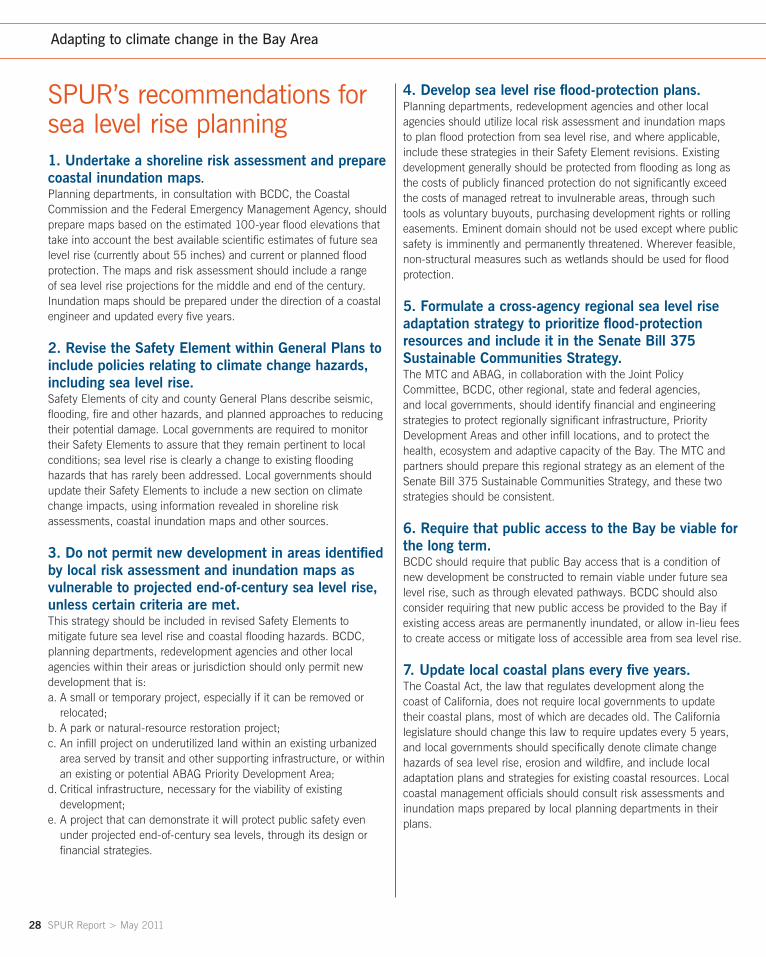
28 SPUR Report > May 2011
Adapting to climate change in the Bay Area
SPUR’s recommendations for sea level rise planning1. Undertake a shoreline risk assessment and prepare coastal inundation maps. Planning departments, in consultation with BCDC, the Coastal Commission and the Federal Emergency Management Agency, should prepare maps based on the estimated 100-year flood elevations that take into account the best available scientific estimates of future sea level rise (currently about 55 inches) and current or planned flood protection. The maps and risk assessment should include a range of sea level rise projections for the middle and end of the century. Inundation maps should be prepared under the direction of a coastal engineer and updated every five years.
2. Revise the Safety Element within General Plans to include policies relating to climate change hazards, including sea level rise. Safety Elements of city and county General Plans describe seismic, flooding, fire and other hazards, and planned approaches to reducing their potential damage. Local governments are required to monitor their Safety Elements to assure that they remain pertinent to local conditions; sea level rise is clearly a change to existing flooding hazards that has rarely been addressed. Local governments should update their Safety Elements to include a new section on climate change impacts, using information revealed in shoreline risk assessments, coastal inundation maps and other sources.
3. Do not permit new development in areas identified by local risk assessment and inundation maps as vulnerable to projected end-of-century sea level rise, unless certain criteria are met. This strategy should be included in revised Safety Elements to mitigate future sea level rise and coastal flooding hazards. BCDC, planning departments, redevelopment agencies and other local agencies within their areas or jurisdiction should only permit new development that is:a. A small or temporary project, especially if it can be removed or
relocated;b. A park or natural-resource restoration project;c. An infill project on underutilized land within an existing urbanized
area served by transit and other supporting infrastructure, or within an existing or potential ABAG Priority Development Area;
d. Critical infrastructure, necessary for the viability of existing development;
e. A project that can demonstrate it will protect public safety even under projected end-of-century sea levels, through its design or financial strategies.
4. Develop sea level rise flood-protection plans. Planning departments, redevelopment agencies and other local agencies should utilize local risk assessment and inundation maps to plan flood protection from sea level rise, and where applicable, include these strategies in their Safety Element revisions. Existing development generally should be protected from flooding as long as the costs of publicly financed protection do not significantly exceed the costs of managed retreat to invulnerable areas, through such tools as voluntary buyouts, purchasing development rights or rolling easements. Eminent domain should not be used except where public safety is imminently and permanently threatened. Wherever feasible, non-structural measures such as wetlands should be used for flood protection.
5. Formulate a cross-agency regional sea level rise adaptation strategy to prioritize flood-protection resources and include it in the Senate Bill 375 Sustainable Communities Strategy. The MTC and ABAG, in collaboration with the Joint Policy Committee, BCDC, other regional, state and federal agencies, and local governments, should identify financial and engineering strategies to protect regionally significant infrastructure, Priority Development Areas and other infill locations, and to protect the health, ecosystem and adaptive capacity of the Bay. The MTC and partners should prepare this regional strategy as an element of the Senate Bill 375 Sustainable Communities Strategy, and these two strategies should be consistent.
6. Require that public access to the Bay be viable for the long term. BCDC should require that public Bay access that is a condition of new development be constructed to remain viable under future sea level rise, such as through elevated pathways. BCDC should also consider requiring that new public access be provided to the Bay if existing access areas are permanently inundated, or allow in-lieu fees to create access or mitigate loss of accessible area from sea level rise.
7. Update local coastal plans every five years. The Coastal Act, the law that regulates development along the coast of California, does not require local governments to update their coastal plans, most of which are decades old. The California legislature should change this law to require updates every 5 years, and local governments should specifically denote climate change hazards of sea level rise, erosion and wildfire, and include local adaptation plans and strategies for existing coastal resources. Local coastal management officials should consult risk assessments and inundation maps prepared by local planning departments in their plans.
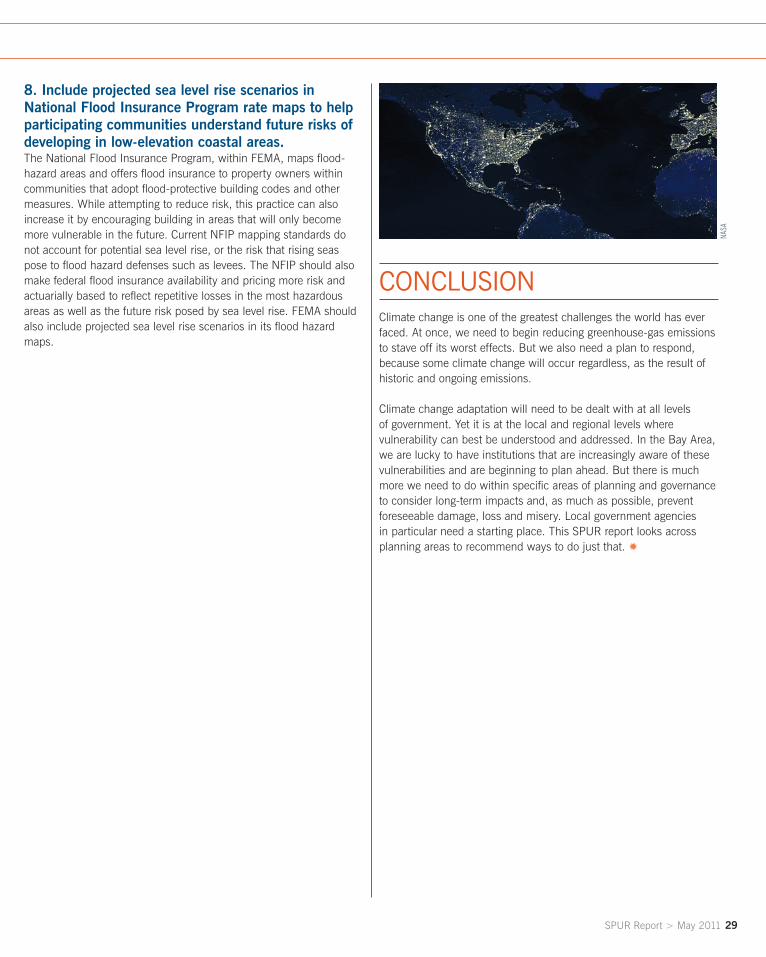
SPUR Report > May 2011 29
8. Include projected sea level rise scenarios in National Flood Insurance Program rate maps to help participating communities understand future risks of developing in low-elevation coastal areas. The National Flood Insurance Program, within FEMA, maps flood-hazard areas and offers flood insurance to property owners within communities that adopt flood-protective building codes and other measures. While attempting to reduce risk, this practice can also increase it by encouraging building in areas that will only become more vulnerable in the future. Current NFIP mapping standards do not account for potential sea level rise, or the risk that rising seas pose to flood hazard defenses such as levees. The NFIP should also make federal flood insurance availability and pricing more risk and actuarially based to reflect repetitive losses in the most hazardous areas as well as the future risk posed by sea level rise. FEMA should also include projected sea level rise scenarios in its flood hazard maps.
ConClUSIonClimate change is one of the greatest challenges the world has ever faced. At once, we need to begin reducing greenhouse-gas emissions to stave off its worst effects. But we also need a plan to respond, because some climate change will occur regardless, as the result of historic and ongoing emissions.
Climate change adaptation will need to be dealt with at all levels of government. Yet it is at the local and regional levels where vulnerability can best be understood and addressed. In the Bay Area, we are lucky to have institutions that are increasingly aware of these vulnerabilities and are beginning to plan ahead. But there is much more we need to do within specific areas of planning and governance to consider long-term impacts and, as much as possible, prevent foreseeable damage, loss and misery. Local government agencies in particular need a starting place. This SPUR report looks across planning areas to recommend ways to do just that. Y
NASA
30 SPUR Report > May 2011
Adapting to climate change in the Bay Area
Endnotes1 “Critical Cooling” can be found at http://www.spur.org/publications/library/report/critical _ cooling
2 SPUR has also written in-depth articles on sea level rise in the Bay Area and the advantages and disadvantages of seven physical strategies for adapting the shoreline to sea level rise. See http://www.spur.org/publications/library/report/sealevelrise _ 110109 3 Nicholas Stern, Stern Review on the Economics of Climate Change (Cambridge, UK: Cambridge University Press, 2006). 4 David Roland-Holst and Fredrich Kahrl, “California Climate Risk and Response,” research paper no. 08102801. (University of California, Department of Agricultural and Resource Economics, 2008), http://www.next10.org/pdf/report _ CCRR/California _ Climate _ Risk _ and _ Response.pdf 5 According to the USGS, http://biology.usgs.gov/wter/adaptive _ mngmt.html 6 Bay Conservation and Development Commission, “Living with a Rising Bay: Vulnerability and Adaptation in San Francisco Bay and on its Shoreline” draft staff report, 137, (BCDC, 2009), http://www.bcdc.ca.gov/proposed _bay _ plan/bp _ 1-08 _ cc _ draft.pdf. More information on the South Bay Salt Ponds can be found at www.southbayrestoration.org 7 The California Adaptation Strategy is available at http://www.climatechange.ca.gov/adaptation/ 8 Ibid.
9 San Francisco Bay Conservation and Development Commission, “Living with a Rising Bay” (BCDC, 2009). Supra note 6. 10 Matthew Heberger, Heather Cooley, Pablo Herrera, Peter H. Gleick, and Eli Moore of the Pacific Institute. “The Impacts of Sea-level Rise on the California Coast,” report no. CEC-500-2009-024-F, (California Climate Change Center, the Pacific Institute, 2009), http://www.pacinst.org/reports/sea _ level _ rise/report.pdf
11 S. LaDochy, R. Medina, and W. Patzert. “Recent California climate variability: spatial and temporal patterns in temperature trends,” Climate Research 33 (2007): 159-169. 12 California Natural Resources Agency, “California Adaptation Strategy,” (California Natural Resources Agency, 2009): 16, http://www.climatechange.ca.gov/adaptation/
13 Paul English, California Department of Public Health, Presentation at SPUR Blue Ribbon task force, San Francisco, CA, April 2010. Based on data from the University of California at Berkeley and Texas Tech University.
14 Norman L. Miller, Jiming Jin, Katharine Hayhoe, and Maximilian Auffhammer. “Climate Change, Extreme Heat, and Energy Demand in California,” CEC-500-2007-023 (California Energy Commission, PIER Energy-Related Environmental Research Program, 2007).
15 Rachel Morello-Frosch, Manuel Pastor, James Sadd, and Seth B. Shonkoff. “The Climate Gap: Inequalities in How Climate Change Hurts Americans and How to Close the Gap” (2009), http://college.usc.edu/pere/documents/The _Climate _ Gap _ Full _ Report _ FINAL.pdf 16 “Climate Change and the Future of California’s Endemic Flora and Fauna,” PLos ONE, 3(6): e2502, http://www.plosone.org/article/info%3Adoi%2F10.1371%2Fjournal.pone.0002502
17 Camille Parmesan and Gary Yohe, “A Globally Coherent Fingerprint of Climate Change Impacts Across Natural Systems,” Nature 421, no. 2 (2003): 37–43, http://www.nature.com/nature
18 California Natural Resources Agency, “California Adaptation Strategy,” (California Natural Resources Agency, 2009): 17, http://www.climatechange.ca.gov/adaptation/
19 Pacific Institute, 2009. Supra note 10. 20 See SPUR’s two articles about Ocean Beach available at http://www.spur.org/publications/library/report/sealevelrise _ 110109 21 San Francisco Bay Conservation and Development Commission, “Living with a Rising Bay,” (BCDC, 2009).
22 Based on a 2000 baseline in the State of California Sea Level Rise Interim Guidance Document, October 2010, developed by the Coastal and Ocean Working Group of the California Climate Action Team. 16 inches by midcentury and 55 inches by end of century have been adopted by State agencies including the State Lands Commission and the Coastal Conservancy as planning estimates.
23 M. Vermeer and Stefan Rahmstorf, “Global sea level linked to global temperature,” Proceedings of the National Academy of Sciences 106, no. 51 (2009): 21527-21532, http://www.pnas.org/content/106/51/21527.full.pdf 24 San Francisco Bay Conservation and Development Commission, “Living with a Rising Bay,” (BCDC, 2009). 25 Paul English, Presentation to SPUR’s task force in April 2010, supra note 12.
26 Miller et al, 2007. Supra note 14. 27 K. Knowlton et al. “The 2006 California Heat Wave: Impacts on Hospitalizations and Emergency Department Visits” Environmental Health Perspectives 117 (2009): 61-67. 28 SPUR analysis of data from the U.S. Census Bureau, American Housing Survey for the San Francisco Metropolitan Area: 1998, November 2000, Series H170/98-39. http://www.census.gov/prod/2000pubs/h170-98-39.pdf
29 C. Reid, et al, “Mapping Community Determinants of Heat Vulnerability” Environmental Health Perspectives 117, (2009): 1730-1736. 30 Climate Change Public Health Impacts Assessment and Response Collaborative, “Public Health Impacts of Climate Change in California: Community Vulnerability Assessments and Adaptation Strategies,” (California State Environmental Health Investigations Branch, 2007).
31 M.L. Parry, O.F. Canziani, J.P. Palutikof, P.J. van der Linden and C.E. Hanson, Eds., “Summary for Policymakers,” contribution of Working Group II to the Fourth Assessment Report of the Intergovernmental Panel on Climate Change, Climate Change 2007: Impacts, Adaptation and Vulnerability, (Cambridge University Press, Cambridge, UK: 2007) 6 and 12. 32 Rachel Morello-Frosch, Manuel Pastor, James Sadd and Seth B. Shonkoff, The Climate Gap: Inequalities in How Climate Change Hurts Americans and How to Close the Gap, (USC Center for Sustainable Communities 2009). 33 Metropolitan Transportation Commission, “Regional Goods Movement Study for the San Francisco Bay Area,” final summary report. (Metropolitan Transportation Commission, 2004), http://www.mtc.ca.gov/planning/rgm/
SPUR Report > May 2011 31
34 Transportation Research Board, “Potential Impacts of Climate Change on US Transportation,” 5, special report 290. (Transportation Research Board, 2008), http://onlinepubs.trb.org/onlinepubs/sr/sr290summary.pdf 35 Pacific Institute, May 2009. Supra note 10.
36 Federal Highway Administration, “Regional Climate Change Effects: Useful Information for Transportation Agencies,” Highways and Climate Change, (Federal Highway Administration, 2009), http://www.fhwa.dot.gov/hep/climate/climate _ effects/effects00.cfm 37 Living with a Rising Bay, 82. Supra note 6. 38 Metropolitan Transportation Commission, “San Francisco Bay Area Regional Rail Plan – Final Report,” (Metropolitan Transportation Commission, 2007), http://www.mtc.ca.gov/planning/rail/ 39 Metropolitan Transportation Commission, “Regional Airport Study,” (Metropolitan Transportation Commission, ongoing as of 2010), http://www.regionalairportstudy.com/about.html 40 (BCDC, 2009) 94. Supra note 6. 41 Transportation and rebuilding task force, “Transportation and Rebuilding,” Urbanist (SPUR: 2010), http://www.spur.org/publications/library/report/resilient _ city _ part3. SPUR has conducted extensive work to evaluate what we need to ensure transportation viability in the event of a major earthquake; some of those recommendations may be consulted in the event that major corridor travel is disrupted by flooding, fire, landslides, or other extreme weather events. 42 Phillip Mantgem et al, “Widespread increase of tree mortality rates in the western United States,” Science 323, no. 5913, (2009): 521-524. 43 Parmesan and Yohe, 2003, supra note 16. 44 David R. Easterling, Gerald A. Meehl et al, “Climate Extremes: Observations, Modeling, and Impacts,” Science 289, New Series, no. 5487 (2000): 2068-2074. 45 Loarie et. al, 2008, supra note 16.
46 Glen Martin, “Taking the Heat,” Bay Nature, (2009), http://baynature.org/articles/jan-mar-2009/taking-the-heat/taking-the-heat
47 San Francisco Bay Joint Venture, “Restoring the Estuary: A Strategic Plan for Restoring the Wetlands and Wildlife in the San Francisco Bay Area,” http://www.sfbayjv.org/strategy.php 48 San Francisco Bay Area Wetlands Ecosystem Goals Project, “Baylands Ecosystem Habitat Goals: A report of habitat recommendations,” (U.S. Environmental Protection Agency, San Francisco, Calif./S.F. Bay Regional Water Quality Control Board, Oakland, Calif, 1999), http://www.sfei.org/node/2123 49 H. Galbraith et al, “Global Climate Change and Sea Level Rise: Potential Losses of Intertidal Habitat for Shorebirds,” Waterbirds 25 no.2 (2002): 173-183. 50 N. Knowles, D.R. Cayan, “Potential Effects of global warming on the Sacramento/San Joaquin watershed and the San Francisco estuary,” Geophysical Research Letters 29 no.18 (2002): 1891. 51 SPUR analysis of data in the Pacific Institute report, 2009, 67-69, supra note 10. 52 The Baylands Ecosystem Habitat Goals is available from the SF Estuary Institute at http://www.sfei.org/node/2123/
53 California Energy Markets newsletter, 7/28/06, 6. 54 California Adaptation Strategy, 2009, 124. Supra note 12. 55 California Adaptation Strategy, 2009, 123. Supra note 12. 56 Roland-Holst and Kahrl, 2008, ES-2. Supra note 4. 57 Roland-Holst and Kahrl, 2008, ES-5. Supra note 4.
58 San Francisco Planning Department, “Programmatic EIR for the SFPUC Water System Improvement Program,” case no. 2005.0159E, Master Responses to Comments, Section 14.11: Master Responses on Climate Change, (San Francisco Planning Department, 2008), http://www.sf-planning.org/Modules/ShowDocument.aspx?documentid=8016. 59 ibid., p. 14-11.20.
32 SPUR Report > May 2011
Adapting to climate change in the Bay Area
Plan of action
flick
r use
r AGr
inbe
rg
Addressing climate change impacts in the San Francisco Bay Area
Recommendations for local and regional agencies
Adapting to climate change in the Bay Area
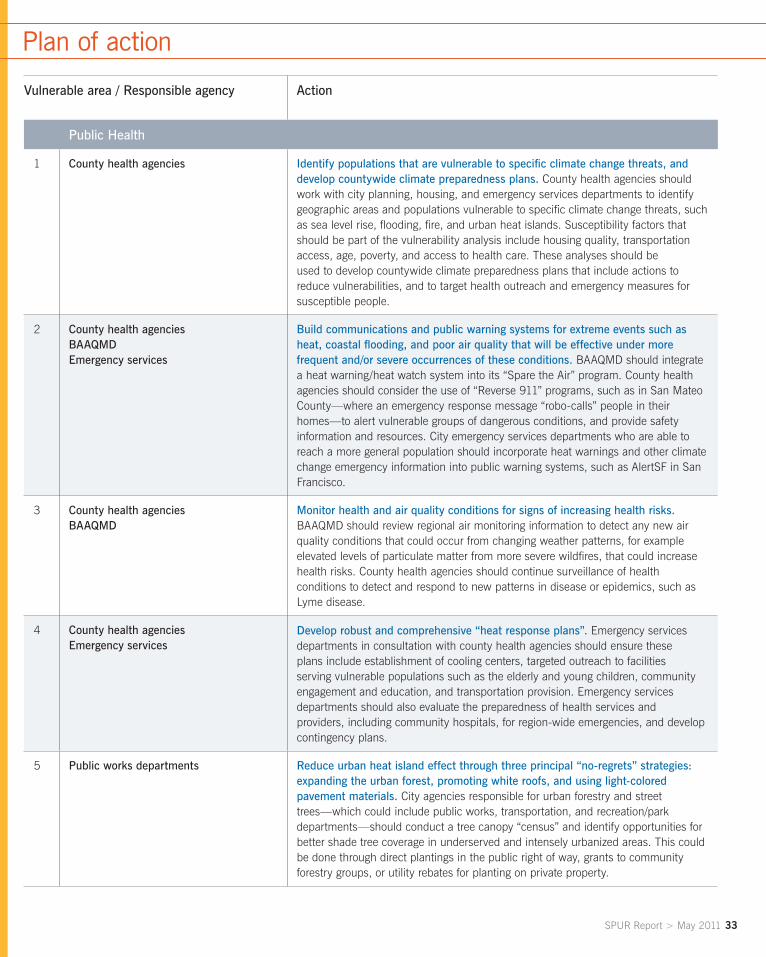
SPUR Report > May 2011 33
Vulnerable area / Responsible agency Action
Public Health
1 County health agencies Identify populations that are vulnerable to specific climate change threats, and develop countywide climate preparedness plans. County health agencies should work with city planning, housing, and emergency services departments to identify geographic areas and populations vulnerable to specific climate change threats, such as sea level rise, flooding, fire, and urban heat islands. Susceptibility factors that should be part of the vulnerability analysis include housing quality, transportation access, age, poverty, and access to health care. These analyses should be used to develop countywide climate preparedness plans that include actions to reduce vulnerabilities, and to target health outreach and emergency measures for susceptible people.
2 County health agenciesBAAQMDEmergency services
Build communications and public warning systems for extreme events such as heat, coastal flooding, and poor air quality that will be effective under more frequent and/or severe occurrences of these conditions. BAAQMD should integrate a heat warning/heat watch system into its “Spare the Air” program. County health agencies should consider the use of “Reverse 911” programs, such as in San Mateo County—where an emergency response message “robo-calls” people in their homes—to alert vulnerable groups of dangerous conditions, and provide safety information and resources. City emergency services departments who are able to reach a more general population should incorporate heat warnings and other climate change emergency information into public warning systems, such as AlertSF in San Francisco.
3 County health agencies BAAQMD
Monitor health and air quality conditions for signs of increasing health risks. BAAQMD should review regional air monitoring information to detect any new air quality conditions that could occur from changing weather patterns, for example elevated levels of particulate matter from more severe wildfires, that could increase health risks. County health agencies should continue surveillance of health conditions to detect and respond to new patterns in disease or epidemics, such as Lyme disease.
4 County health agenciesEmergency services
Develop robust and comprehensive “heat response plans”. Emergency services departments in consultation with county health agencies should ensure these plans include establishment of cooling centers, targeted outreach to facilities serving vulnerable populations such as the elderly and young children, community engagement and education, and transportation provision. Emergency services departments should also evaluate the preparedness of health services and providers, including community hospitals, for region-wide emergencies, and develop contingency plans.
5 Public works departments Reduce urban heat island effect through three principal “no-regrets” strategies: expanding the urban forest, promoting white roofs, and using light-colored pavement materials. City agencies responsible for urban forestry and street trees—which could include public works, transportation, and recreation/park departments—should conduct a tree canopy “census” and identify opportunities for better shade tree coverage in underserved and intensely urbanized areas. This could be done through direct plantings in the public right of way, grants to community forestry groups, or utility rebates for planting on private property.
Plan of action
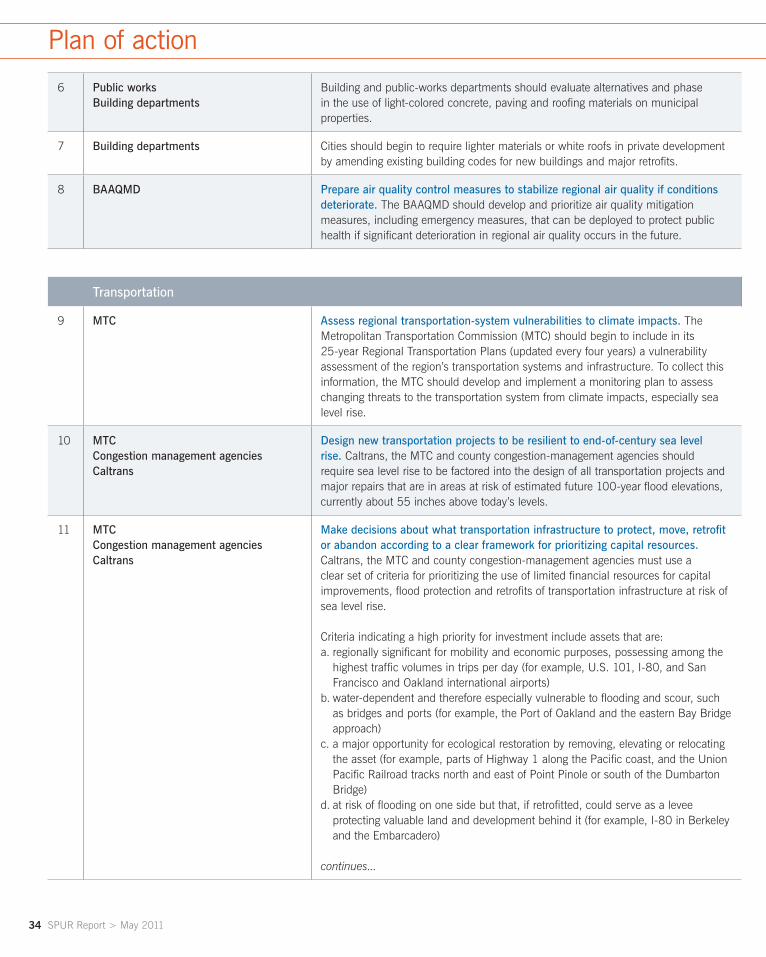
34 SPUR Report > May 2011
6 Public worksBuilding departments
Building and public-works departments should evaluate alternatives and phase in the use of light-colored concrete, paving and roofing materials on municipal properties.
7 Building departments Cities should begin to require lighter materials or white roofs in private development by amending existing building codes for new buildings and major retrofits.
8 BAAQMD Prepare air quality control measures to stabilize regional air quality if conditions deteriorate. The BAAQMD should develop and prioritize air quality mitigation measures, including emergency measures, that can be deployed to protect public health if significant deterioration in regional air quality occurs in the future.
Transportation
9 MTC Assess regional transportation-system vulnerabilities to climate impacts. The Metropolitan Transportation Commission (MTC) should begin to include in its 25-year Regional Transportation Plans (updated every four years) a vulnerability assessment of the region’s transportation systems and infrastructure. To collect this information, the MTC should develop and implement a monitoring plan to assess changing threats to the transportation system from climate impacts, especially sea level rise.
10 MTCCongestion management agenciesCaltrans
Design new transportation projects to be resilient to end-of-century sea level rise. Caltrans, the MTC and county congestion-management agencies should require sea level rise to be factored into the design of all transportation projects and major repairs that are in areas at risk of estimated future 100-year flood elevations, currently about 55 inches above today’s levels.
11 MTCCongestion management agenciesCaltrans
Make decisions about what transportation infrastructure to protect, move, retrofit or abandon according to a clear framework for prioritizing capital resources. Caltrans, the MTC and county congestion-management agencies must use a clear set of criteria for prioritizing the use of limited financial resources for capital improvements, flood protection and retrofits of transportation infrastructure at risk of sea level rise.
Criteria indicating a high priority for investment include assets that are:a. regionally significant for mobility and economic purposes, possessing among the
highest traffic volumes in trips per day (for example, U.S. 101, I-80, and San Francisco and Oakland international airports)
b. water-dependent and therefore especially vulnerable to flooding and scour, such as bridges and ports (for example, the Port of Oakland and the eastern Bay Bridge approach)
c. a major opportunity for ecological restoration by removing, elevating or relocating the asset (for example, parts of Highway 1 along the Pacific coast, and the Union Pacific Railroad tracks north and east of Point Pinole or south of the Dumbarton Bridge)
d. at risk of flooding on one side but that, if retrofitted, could serve as a levee protecting valuable land and development behind it (for example, I-80 in Berkeley and the Embarcadero)
continues...
Plan of action
SPUR Report > May 2011 35
Adapting to climate change in the Bay Area
11 ... continued
MTCCongestion management agenciesCaltrans
Criteria indicating a low priority for investment include assets that are:•alreadyprotectedfromfloodingorwillbeprotectedbystructuresdesignedfora
larger area of land (for example, BART and Muni stations in San Francisco)•redundantorprovidecapacitythatcouldreasonablybeshiftedtoalessrisky
corridor (for example, traffic on Highway 37 in Sonoma County could be shifted to Highway 121)
The MTC and other funders’ highest priorities for capital improvements, including retrofits to accommodate future sea level rise, should be those vulnerable assets that are of significant regional economic value, are irreplaceable, cannot be relocated and would not otherwise be protected.
12 MTCCongestion management agenciesCaltrans
Create emergency transportation alternatives for corridors that may suffer from extreme events or prolonged closures. During extreme events, people may use different modes of transportation than usual. These shifts may increase congestion or reduce safety on certain corridors, including on public transit. The MTC and county congestion-management agencies should identify emergency measures that can be taken to maintain mobility and safety both for short-term impacts of climate change such as extreme weather, and in the event of longer-term closures that may be needed due to damage or repairs.
Ecosystems
13 Coastal CommissionCoastal ConservancyBCDCPlanning departmentsOthers
Protect viable migratory paths for wetlands. Wetland species will need to gradually move landward as lower areas are inundated. Protecting viable migratory pathways is essential to the survivability of at-risk ecosystems that provide pollution filtration, flood protection, carbon sequestration, fisheries and other socioeconomic benefits. There are 417 square miles of Bay and coastal wetlands in the nine-county Bay Area today, and there are only about 57 square miles of dryland area viable—i.e., not developed with buildings, infrastructure or agriculture—for wetlands to migrate upland. These areas are the highest priority for protection and non-conversion to other land uses. The California Coastal Commission, the Coastal Conservancy, BCDC and others should evaluate the vulnerability of existing areas of tidal wetlands in the Bay and on the coast and should map their landward natural migratory paths under expected amounts of sea level rise. Wherever pathways are identified into vacant, underdeveloped areas that have the potential for substantial wetland restoration, the pathways should not be converted to land uses that would impede migration. Where there are willing landowners, privately owned land viable for wetland migration should be protected by public agencies or land trusts with fee title acquisitions, conservation easements or other agreements with landowners.
14 BCDCEPARWQCBCoastal Conservancy
Update the Baylands Habitat Goals Project to include sea level rise projections. The Baylands Ecosystem Habitat Goals Project is a multi-agency effort to identify what kinds and amounts of wetland habitats around the Bay should be restored to sustain diverse wildlife. Conceived of in 1993 and established in 1999, the goals did not account for future changes in the rate of sea level rise. BCDC, the U.S. Environmental Protection Agency, the Regional Water Quality Control Board, the Coastal Conservancy and other partners should update these goals to strategically target near-term restoration efforts along the Bay shoreline, particularly toward protecting wetland migratory pathways.

36 SPUR Report > May 2011
15 BCDCCoastal Conservancy
Develop a regional sediment-management strategy that could help protect wetlands from sea level rise and prevent adverse water quality impacts. Sediment supply is necessary for wetlands to “keep up” with sea level rise, but it is threatened by dikes and dams upstream in the Bay’s watershed. BCDC should continue and complete its study of sediment in the Bay to contribute to this regional strategy.
16 Coastal ConservancyDept. of Fish and GameU.S. Fish and Wildlife ServiceNational Park ServiceOther land-conservation groups
Prioritize land protection, conservation and restoration efforts in areas with significant topographical relief, such as in the coastal range. Areas that possess a range of elevations within a small geographic area generally have more biodiversity to begin with. Protecting gradients in the landscape will allow species to migrate or seek refuge from hotter, drier conditions.
17 Coastal ConservancyDepartment of Fish and GameU.S. Fish and Wildlife ServiceNational Park Serviceother land-conservation groupsCalTrans
Prioritize protection of habitat linkages connecting large natural areas in the greater Bay Area. The protection of linkages or corridors between large landscapes is a basic conservation tool that will become even more critical to the protection of biodiversity as the climate changes. Identification and protection of wildlife corridors will allow plants and wildlife to migrate northward, to hi
Energy
18 Energy utilitiesPG&ESFPUCOthers
Conduct a vulnerability assessment of energy-system assets at risk of climate impacts. All energy utilities should conduct vulnerability assessments of energy-system assets at risk of climate impacts and over time should improve the reliability of energy infrastructure and equipment that is identified as most likely to fail during extreme events, in balance with cost, safety and other factors.
19 Energy utilitiesPG&ESFPUCOthers
Develop plans to close the electricity supply gap under conditions where hydroelectric resources are diminished or nonexistent. PG&E, the SFPUC and other utilities that rely on hydroelectricity should develop plans for coping with diminished resources. The plans should identify ways to make up the difference through energy efficiency and demand-response first, renewable resources and distributed generation second, and clean and efficient fossil fuel generation third, in keeping with the California Energy Action Plan “loading order,” which describes the priority by which the state should meet new energy demands.
20 PG&ELocal governments
Evaluate existing energy-efficiency and demand-response programs for their effectiveness at shaving peak electricity demand in more frequent and prolonged hot weather. PG&E and local government energy programs funded by ratepayers are both responsible for executing and ensuring the effectiveness of these programs. These programs must consider longer and more frequent hot-weather periods. Two promising strategies for improving demand response and load management in extreme weather are smart meters and a smart grid.
Plan of action
SPUR Report > May 2011 37
21 Building departments Replace or retrofit the building stock over time with resource-efficient, climate-adaptive buildings. Codes covering new buildings and major retrofits should encourage designs that make buildings more resilient to energy-supply interruptions and droughts, employing technologies such as passive heating and cooling, daylighting, graywater reuse, water recycling, distributed generation and more. Building codes could be built upon existing third-party standards such as the U.S. Green Building Council’s LEED, Build It Green’s GreenPoint Rated or additional standards aimed specifically at resilience and passive survivability. Wider adoption of green-building standards would improve regional climate resilience — but because building-stock turnover is slow, this strategy will take decades to realize significant change.
Water
22 Water utilities Develop water-supply scenarios for mid-century and beyond that include assumptions about changes (especially decreases) in precipitation amounts and timing. Bay Area water-supply agencies should plan for long-term climate change through the middle and end of the 21st century. They should use climate projections (while remaining cognizant of the uncertainties in those projections) to gain understanding of the potential impacts that may exist, assess vulnerabilities to those impacts and plan accordingly.
23 Water utilities Evaluate alternative water-supply opportunities and demand-management strategies such as water conservation, water recycling and desalination, and prioritize investment in these strategies according to cost, reliability and environmental benefits. Bay Area water-supply agencies should evaluate and pursue strategies to increase local and drought-proof supplies in their portfolios. Examples of such supplies include: conservation, which has fewer negative environmental impacts than new supplies; desalination of seawater, which reduces reliance on surface freshwater sources; conjunctive use, which stores surface supplies from wet years in subsurface aquifers for dry years; and recycled water, which produces new supplies of non-potable water for irrigation and industrial purposes from treated wastewater.
24 Wastewater utilities Expand investments in “green infrastructure” or low-impact development. Wastewater agencies, sometimes in collaboration with water-supply agencies, should model a range of future storm intensities and prioritize investments to attenuate flood peak flows, increase groundwater recharge and reduce urban heat islands. Areas that are at high risk of urban storm-water flooding, or are contributory to such areas, should be targeted first.
25 Wastewater utilities Evaluate the vulnerability of wastewater collection and treatment systems to severe storms, sea level rise and storm surge. Where possible, wastewater agencies should retrofit ocean and Bay outfalls with backflow prevention as an interim measure. Agencies may need to create new design standards for infrastructure that accommodate larger storm sizes and more frequent storm surges.
Adapting to climate change in the Bay Area
38 SPUR Report > May 2011
Sea level rise
26 Planning departments Undertake a shoreline risk assessment and prepare coastal inundation maps. Planning departments, in consultation with BCDC, the Coastal Commission and the Federal Emergency Management Agency, should prepare maps based on the estimated 100-year flood elevations that take into account the best available scientific estimates of future sea level rise (currently about 55 inches) and current or planned flood protection. The maps and risk assessment should include a range of sea level rise projections for the middle and end of the century. Inundation maps should be prepared under the direction of a coastal engineer and updated every five years.
27 Planning departments Revise the Safety Element within General Plans to include policies relating to climate change hazards, including sea level rise. Safety Elements of city and county General Plans describe seismic, flooding, fire and other hazards, and planned approaches to reducing their potential damage. Local governments are required to monitor their Safety Elements to assure that they remain pertinent to local conditions; sea level rise is clearly a change to existing flooding hazards that has rarely been addressed. Local governments should update their Safety Elements to include a new section on climate change impacts, using information revealed in shoreline risk assessments, coastal inundation maps and other sources.
28 Planning departments Redevelopment agencies BCDC Other local agencies with permitting jurisdiction
Do not permit new development in areas identified by local risk assessment and inundation maps as vulnerable to projected end-of-century sea level rise, unless certain criteria are met. This strategy should be included in revised Safety Elements to mitigate future sea level rise and coastal flooding hazards.
BCDC, planning departments, redevelopment agencies and other local agencies within their areas or jurisdiction should only permit new development that is:•Asmallortemporaryproject,especiallyifitcanberemovedorrelocated;•Aparkornatural-resourcerestorationproject;•Aninfillprojectonunderutilizedlandwithinanexistingurbanizedareaservedby
transit and other supporting infrastructure, or within an existing or potential ABAG Priority Development Area;
•Criticalinfrastructure,necessaryfortheviabilityofexistingdevelopment;•Aprojectthatcandemonstrateitwillprotectpublicsafetyevenunderprojected
end-of-century sea levels, through its design or financial strategies.
29 Planning departments Redevelopment agencies BCDC Other local agencies with permitting jurisdiction
Develop sea level rise flood-protection plans. Planning departments, redevelopment agencies and other local agencies should utilize local risk assessment and inundation maps to plan flood protection from sea level rise, and where applicable, include these strategies in their Safety Element revisions. Existing development generally should be protected from flooding as long as the costs of publicly financed protection do not significantly exceed the costs of managed retreat to invulnerable areas, through such tools as voluntary buyouts, purchasing development rights or rolling easements. Eminent domain should not be used except where public safety is imminently and permanently threatened. Wherever feasible, non-structural measures such as wetlands should be used for flood protection.
Plan of action
SPUR Report > May 2011 39
30 MTCABAG
Formulate a cross-agency regional sea level rise adaptation strategy to prioritize flood-protection resources and include it in the Senate Bill 375 Sustainable Communities Strategy. The MTC and ABAG, in collaboration with the Joint Policy Committee, BCDC, other regional, state and federal agencies, and local governments, should identify financial and engineering strategies to protect regionally significant infrastructure, Priority Development Areas and other infill locations, and to protect the health, ecosystem and adaptive capacity of the Bay. The MTC and partners should prepare this regional strategy as an element of the Senate Bill 375 Sustainable Communities Strategy, and these two strategies should be consistent.
31 BCDC Require that public access to the Bay be viable for the long term. BCDC should require that public Bay access that is a condition of new development be constructed to remain viable under future sea level rise, such as through elevated pathways. BCDC should also consider requiring that new public access be provided to the Bay if existing access areas are permanently inundated, or allow in-lieu fees to create access or mitigate loss of accessible area from sea level rise.
32 California legislature Update local coastal plans every five years. The Coastal Act, the law that regulates development along the coast of California, does not require local governments to update their coastal plans, most of which are decades old. The California legislature should change this law to require updates every 5 years, and local governments should specifically denote climate change hazards of sea level rise, erosion and wildfire, and include local adaptation plans and strategies for existing coastal resources. Local coastal management officials should consult risk assessments and inundation maps prepared by local planning departments in their plans.
33 FEMANational Flood Insurance Program
Include projected sea level rise scenarios in National Flood Insurance Program rate maps to help participating communities understand future risks of developing in low-elevation coastal areas. The National Flood Insurance Program, within FEMA, maps flood-hazard areas and offers flood insurance to property owners within communities that adopt flood-protective building codes and other measures. While attempting to reduce risk, this practice can also increase it by encouraging building in areas that will only become more vulnerable in the future. Current NFIP mapping standards do not account for potential sea level rise, or the risk that rising seas pose to flood hazard defenses such as levees. The NFIP should also make federal flood insurance availability and pricing more risk and actuarially based to reflect repetitive losses in the most hazardous areas as well as the future risk posed by sea level rise. FEMA should also include projected sea level rise scenarios in its flood hazard maps.
Adapting to climate change in the Bay Area

Adapting to climate change in the Bay Area
The mission of the San Francisco Planning and Urban Research Association is to promote good planning and good government through research, education and advocacy.
SPUR is a member-supported nonprofit organization. Join us.
www.spur.org
SPUR654 mission StreetSan Francisco, CA 94105tel. [email protected]