Climate change and shareholder value... · a longer term issue, emissions controls such as the EU...
40
Climate change and shareholder value
Transcript of Climate change and shareholder value... · a longer term issue, emissions controls such as the EU...
Climate change and shareholder value

Climate change and shareholder valueIFC1
Preface
Background to this work
Investors and companies alike arebeginning to realise that climate change,and its associated need for constraints on emissions of ‘carbon’ and othergreenhouse gases, has some significantvalue risk implications for many areas of the economy. Earlier in 2005, MercerInvestment Consulting confirmed thatunderstanding climate change risk shouldbe part of pension funds’ investmentstrategy. However, it is a complicatedarea — and to date — no comprehensivequantitative analysis has been preparedto compare its impact across differentsectors and companies.
The impact of carbon emissions tradingunder the EU Emissions Trading Scheme on the electricity sector is welldocumented, but the implications ofclimate change for other exposed sectorshas been less widely investigated by theinvestor community.
Against this background, the Carbon Trustcommissioned Cairneagle Associates towork with us to develop a methodologyfor this analysis, and test it on a range of different companies. This publicationprovides a summary of this work,together with a discussion of theimplications for both corporate seniormanagement and shareholders.
Contents1. Executive summary 1
2. Introduction to climate change 6
3. Methodology 8
4. A worked example for the chemicals sector 10
5. Summary and analysis of all ten case studies 14
6. Implications for senior management and investors 18
Appendix 1 — Case studies analysed 21
Appendix 2 — The EU Emissions Trading Scheme overview 32
Appendix 3 — Example sensitivity analyses 34
Appendix 4 — Glossary of terms 35
Set up in 2001, the Carbon Trust is an independent company, business-led and funded by government, tasked with reducing carbon emissions in business and the public sector.We work directly with UK companies of all sizes to help reduce carbon emissions anddevelop new low carbon technologies. We also periodically undertake detailed researchto improve understanding of climate change issues.

Climate change
Climate change is now recognised as a fact. Consequentlythere is a need to control and reduce the greenhouse gasesthat cause climate change. Legally binding regulation hasbeen put in place to begin to control emissions. FollowingRussian ratification, the Kyoto Protocol entered into forcein February 2005, governing developed world emissions in 2008-12.
From 1st January 2005, major sources of industrial carbondioxide1 emissions in the EU have been subject to the capand trade regulation surrounding the EU Emissions TradingScheme. Carbon dioxide accounts for 80% of the developedworld greenhouse gas impact. It is heavily linked to energyconsumption, being released wherever fossil fuels are burnt,whether in industry, power stations, domestic householdsor vehicle exhausts.
Longer term, greenhouse gas reductions of around 50-60%from 1990 levels are thought necessary, and discussionshave already begun on post-Kyoto international targets,governing emissions from 2013. High priority is beingplaced on engaging with countries not currently regulatedby the Kyoto Protocol, particularly the USA, India and China.
Even if steps are taken now to dramatically reducegreenhouse gas emissions, climate change will still happento some extent because greenhouse gases remain in theatmosphere for decades and impacts accumulate for evenlonger. The forecast impacts include changes to temperatureand precipitation (rainfall) patterns, together with agreater frequency of extreme events — such as flooding,storms and drought.
Calculating shareholder value at risk from climate change
During 2005, the Carbon Trust worked with CairneagleAssociates (a strategic management consultancy firm) to develop a methodology for analysing shareholder value at risk from climate change.
Companies across a wide range of sectors are exposedto climate change — both in terms of the physical risks(e.g. asset damage from increasingly frequent extremeweather events, production downtime) and theconstraints and cost of carbon dioxide and othergreenhouse gases imposed by regulatory (and voluntary)mitigation measures. The challenges also bring newmarket opportunities in areas such as renewables andenergy efficiency. Whilst climate change is seen as a longer term issue, emissions controls such as the EU Emissions Trading Scheme are already in place.
The model developed offers a robust, replicable, top-downapproach to analysing such value at risk. In addition to a company’s own energy linked (‘direct’ and electricity-linked ‘indirect’) carbon emissions, it looks further alongthe value chain and considers broader potential risk. Incalculating the financial impact, the analysis quantifies the potential impact on profits, using the shape of the business in 2004, but applying a potential 2013emissions regulatory regime.
Executive summary 1
1 Executive summary
1 Carbon dioxide is often referred to as just ‘carbon’.
This analysis illustrates what a determinedshareholder (or other onlooker) could deriveabout value at risk from climate change,based upon what companies disclose today.

Why use 2013?
2013 was chosen as the first year after the end of the2008-2012 Kyoto compliance period (which also equates to Phase Two in the EU Emissions Trading Scheme).
Greenhouse gas targets, policy and regulation beyond this2008-2012 Kyoto compliance period are several years frombeing agreed. However, in order to meet longer term ‘safe’greenhouse gas levels, significant further reductions will berequired. We have assumed in Europe a continuation of theEU Emissions Trading Scheme, with its approach of allocatinga set (typically decreasing) number of free allowances toeach site. We have assumed that the sectoral scope of theEU Emissions Trading Scheme (or similar parallel schemes)is extended to include other corporate sectors andtransport-linked emissions.
A major uncertainty is to what extent countries notcurrently regulated by the Kyoto Protocol (particularly the USA, India and China) will be brought into committedemission reduction targets from 2013. In the case studyanalysis in Appendix 1, we have considered two scenariosfor non-EU emissions: one where they face the sameregulatory cost as activities in the EU, and one where they face no regulatory constraints.
2013 therefore represents the earliest year under thisuncertain, but likely tougher, regulatory regime. However,although this report focuses on 2013, it needs to berecognised that, for many sectors, financial impacts will be seen significantly before this time.
Ten sector ‘case study companies’
Ten ‘case study companies’ have been studied, from arange of sectors. In some cases, the ‘case study company’analysed is strictly linked to a single company within thatsector. In others, just a single corporate division has beenreviewed, and in others yet again, characteristics fromseveral companies have been combined to produce a morerepresentative example.
In order to enable analysis on a strictly like-for-like basis,the research has been based entirely upon public sourcesof information. No company interviews were conducted (in order to keep the research to just public sources),although input was sought where appropriate frominvestment analysts and other third party experts. This analysis illustrates what a determined shareholder (or other onlooker) could derive about value at risk from climate change, based upon what companiesdisclose today.
In most cases, not everything needed to quantify exposureto climate change was disclosed: a large proportion of theproject was spent drilling down into corporate and industrybody information in order to obtain robust estimates. Thisin itself is an important finding. In particular, in most cases,estimates were needed for carbon emissions associatedwith logistics, packaging and key raw materials. With care, and using a broad range of third party sources and approximations, these could be estimated.
Findings
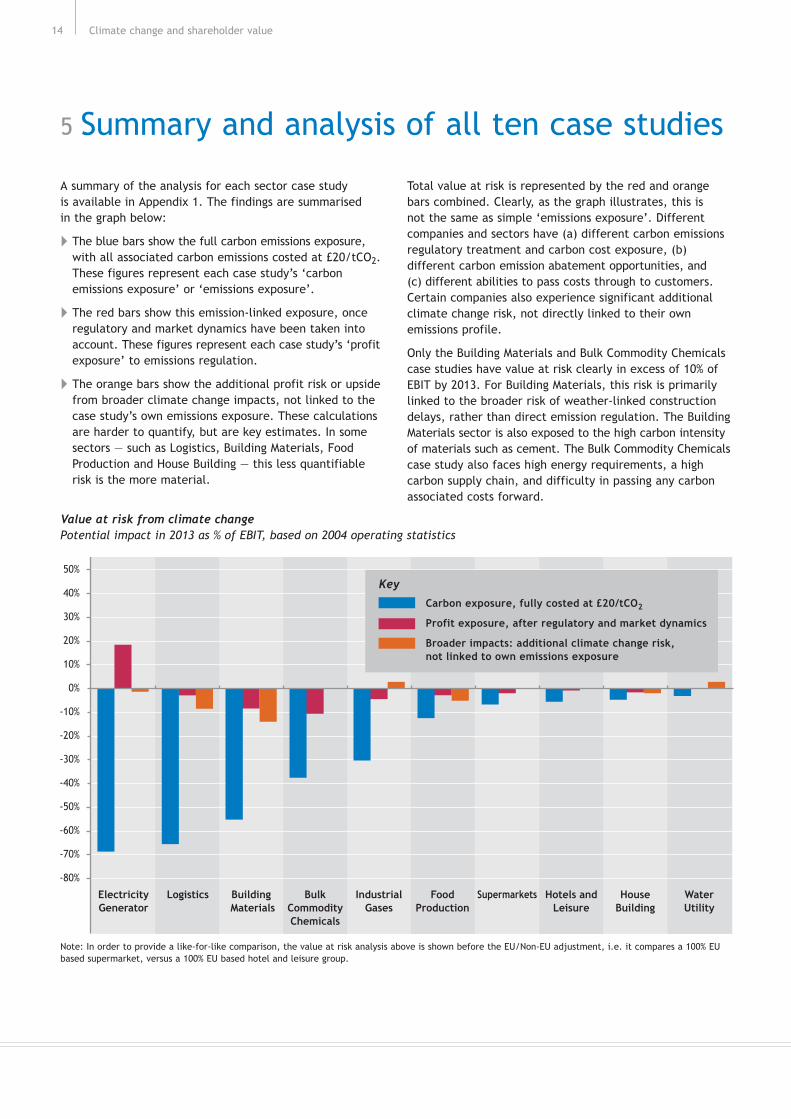
A summary of the analysis for each sector case study isavailable in Appendix 1, with the analysis for one casestudy (Bulk Commodity Chemicals) available in more detailin Section 4 of this Report. The findings are summarised in the graph opposite:
The blue bars show the full carbon emissions exposure,with all associated carbon emissions costed at £20/tCO2.These figures represent each case study’s ‘carbonemissions exposure’ or ‘emissions exposure’.
Whilst the future of carbon prices is clearly highlyuncertain, £20/tCO2 is in line with longer term carbonprice assumptions in recent other Carbon Trust and thirdparty publications (including Trucost/Henderson’s Carbon100 publication2). It is also similar to long term estimatesfor the gas/coal switching price — a key technical pricedriver for the carbon market.3
The red bars show this emission-linked exposure, onceregulatory and market dynamics have been taken intoaccount. These figures represent each case study’s‘profit exposure’ to emissions regulation.
The orange bars show the additional profit risk or upsidefrom broader climate change impacts, not linked to thecase study’s own emissions exposure. These calculationsare harder to quantify, but are key estimates. In somesectors — such as Logistics, Building Materials, FoodProduction and House Building — this less quantifiablerisk is the more material.
Total value at risk is represented by the red and orangebars combined. Clearly, as the graph illustrates, this is not the same as simple ‘emissions exposure’. Differentcompanies and sectors have (a) different carbon emissionsregulatory treatment and carbon cost exposure, (b)different carbon emission abatement opportunities, and (c) different abilities to pass costs through tocustomers. Certain companies also experience significantadditional climate change risk, not directly linked to theirown emissions profile.
Climate change and shareholder value2
2 June 2005, The Carbon 100, Henderson Global Investors and Trucost. Available through www.trucost.com/henderson.html.3 Coal-fired electricity generation emits considerably more CO2 per MWh than electricity generated from gas. Above a certain price level, inclusion of themarginal cost of CO2 in the marginal price of electricity generation can cause gas-fired generation to become more competitive (on a marginal cost basis)than coal-fired.

What do the results mean?
The analysis has been based around a single regulatoryscenario for 2013:4
We have assumed a 70% free allowance allocation,versus business as usual. We have assumed a cost ofcarbon of £20/tCO2. We have assumed that by 2013 theelectricity sector passes through 50% of the marginalcost impact that valuing carbon at £20/tCO2 wouldhave on the cost of coal fired generation. (Coal firedgeneration is assumed to be the ‘technology at themargin’ — i.e. the technology that sets the market price.)
For most of our case studies, the methodology indicatesthat, under our scenario, climate change is not likely to bethat financially material (using the typical investor metricthat materiality has a 5% impact on profit or value). Whilstfully costing all associated emissions at £20/t (see the bluebars) can imply a high exposure, this exposure reducessignificantly after regulatory treatment and pass throughconsiderations take place.
Under our scenario, only the Building Materials andBulk Commodity Chemicals case studies potentiallyhave value at risk clearly in excess of 10% of EBIT in2013. For Building Materials, this risk is primarily linkedto the broader risk of weather-linked constructiondelays, rather than direct emissions regulation. Logisticsmay also see value at risk of this magnitude, if its long-haul air freight growth rates are hit.
However, a harsher regime, with a higher carbon price orthe need to purchase a greater proportion of allowances,could make the impact significantly higher.
The profit exposure and ‘broader impacts’ risk for othersectors is significantly lower. The Electricity Generatorcase study sees significant profit upside (as alreadyforecast in commentary surrounding Phase One of the EU ETS), due to the mechanics of marginal cost pricing(see page 11).
New business opportunities and cost effective emissionsabatement measures can improve the situation still further.
Executive summary 3
Value at risk from climate changePotential impact in 2013 as % of EBIT, based on 2004 operating statistics
SupermarketsLogisticsElectricityGenerator
Building Materials
BulkCommodityChemicals
IndustrialGases
FoodProduction
Hotels andLeisure
HouseBuilding
WaterUtility
50%
40%
30%
20%
10%
0%
-10%
-20%
-30%
-40%
-50%
-60%
-70%
-80%
Carbon exposure, fully costed at £20/tCO2
Profit exposure, after regulatory and market dynamics
Broader impacts: additional climate change risk,not linked to own emissions exposure
Key
Note: In order to provide a like-for-like comparison, the value at risk analysis above is shown before the EU/Non-EU adjustment, i.e. it compares a 100% EU based supermarket, versus a 100% EU based hotel and leisure group.
4 Appendix 3 includes a summary of regulatory scenarios for two of the case studies.
An issue for both senior management and investors
The results clearly show that companies need to lookfurther than just their own emissions and energy use in order to understand their exposure to climate change.Raw materials which involve significant carbon in theirextraction or production, and associated services (such as logistics and packaging) can be key. For some sectors,merely looking at ‘direct’ and electricity linked ‘indirect’carbon emissions overlooks broader more significantbusiness risks.
Large companies — in most cases — represent a portfolio of assets, whether in different product or industry areas,or different geographic locations. Whilst some assets maybe significantly exposed to climate change, others may bemore protected. Smaller companies, with more restrictedoperations, may be more affected.
Many companies are already taking actions to reduce energyuse which both cuts costs and emissions. Some have alsostarted looking at logistics, again reducing costs as well asemissions. Very few companies, however, are incorporatingtheir full climate change risk exposure into their strategicthinking and it could have a significant impact.
Whilst initially climate change can appear a highly materialrisk, properly managed, this downside risk can be minimised.For some sectors, the analysis even suggests an uplift inprofits. What is critical is that companies need to fullyunderstand the risks and opportunities associated with thiscomplex area, and develop robust plans to address them.There will be large creation and distribution of shareholdervalue in the transition to a low carbon economy — therewill be winners and losers at sector level and within sectorsat company level. The winners are more likely to be thosebusinesses that take the time to understand and addressthis complex area.
Senior company management needs to ensure thatemissions regulation is fully understood and integratedinto the company’s business planning and operations, in addition to the potential weather-related/physicalimpacts. If the company fully understands the implicationsof emission constraints, it will know where to focus its lobbying and negotiation attention — whether withgovernment regulators, higher-carbon suppliers, orpricing discussions with customers. For many, emissionconstraints and the ‘cost of carbon’ should influencecapex and investment plans. Other financial opportunities(such as CDM investments5, technology developments or new markets) should be seriously explored.
Investors, particularly in those sectors more highlyexposed to the issue, should ensure that climate changeforms part of their ongoing dialogue with the companiesthey invest in. From a governance perspective, they willwant to ensure risks are being appropriately managed.From a valuation perspective, the companies themselvesare best placed to provide information on the financialimpacts of regulatory announcements (such as theannouncement of 2008-12 National Allocation Plans duein mid-2006, and any ongoing developments on post-2012regulations) and other drivers.
Accordingly, this document provides seven questions thatinvestors could ask companies, and companies should askthemselves. Derived from the financial outputs of thisanalysis, these questions allow attention to be focusedupon those areas of greatest materiality. They are outlinedon the opposite page.
The Carbon Trust will continue to lead financialunderstanding of this issue going forward. This is a movingarea, and if you would like to be kept informed as newresearch is brought out, please contact the Carbon Trust’sinvestor engagement team [email protected].
For all other enquiries on the Carbon Trust’s activities,including its Carbon Management programme working withlarge corporates, please email [email protected].
Tom DelayChief ExecutiveThe Carbon Trust
Emma JohnsonHead of Investor EngagementThe Carbon Trust
Climate change and shareholder value4
5 The Clean Development Mechanism (CDM) is a mechanism linked to the Kyoto Protocol, under which companies and investors can gain tradable emission allowances from investments in greenhouse gas reduction projects in the developing world.
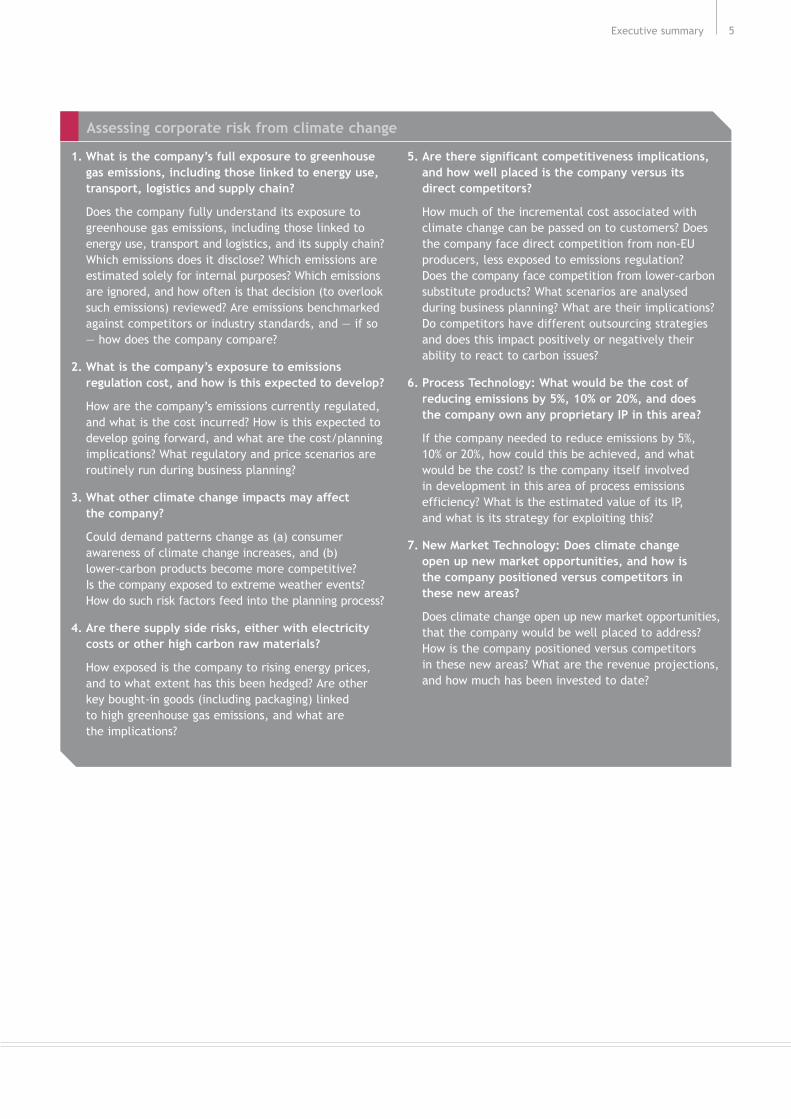
1. What is the company’s full exposure to greenhousegas emissions, including those linked to energy use,transport, logistics and supply chain?
Does the company fully understand its exposure togreenhouse gas emissions, including those linked toenergy use, transport and logistics, and its supply chain?Which emissions does it disclose? Which emissions areestimated solely for internal purposes? Which emissionsare ignored, and how often is that decision (to overlooksuch emissions) reviewed? Are emissions benchmarkedagainst competitors or industry standards, and — if so— how does the company compare?
2. What is the company’s exposure to emissionsregulation cost, and how is this expected to develop?
How are the company’s emissions currently regulated,and what is the cost incurred? How is this expected todevelop going forward, and what are the cost/planningimplications? What regulatory and price scenarios areroutinely run during business planning?
3. What other climate change impacts may affect the company?
Could demand patterns change as (a) consumerawareness of climate change increases, and (b) lower-carbon products become more competitive? Is the company exposed to extreme weather events?How do such risk factors feed into the planning process?
4. Are there supply side risks, either with electricitycosts or other high carbon raw materials?
How exposed is the company to rising energy prices,and to what extent has this been hedged? Are otherkey bought-in goods (including packaging) linked to high greenhouse gas emissions, and what are the implications?
5. Are there significant competitiveness implications,and how well placed is the company versus its direct competitors?
How much of the incremental cost associated withclimate change can be passed on to customers? Doesthe company face direct competition from non-EUproducers, less exposed to emissions regulation? Does the company face competition from lower-carbonsubstitute products? What scenarios are analysedduring business planning? What are their implications?Do competitors have different outsourcing strategiesand does this impact positively or negatively theirability to react to carbon issues?
6. Process Technology: What would be the cost ofreducing emissions by 5%, 10% or 20%, and does the company own any proprietary IP in this area?
If the company needed to reduce emissions by 5%, 10% or 20%, how could this be achieved, and whatwould be the cost? Is the company itself involved in development in this area of process emissionsefficiency? What is the estimated value of its IP, and what is its strategy for exploiting this?
7. New Market Technology: Does climate change open up new market opportunities, and how is the company positioned versus competitors in these new areas?
Does climate change open up new market opportunities,that the company would be well placed to address?How is the company positioned versus competitors in these new areas? What are the revenue projections,and how much has been invested to date?
Executive summary 5
Assessing corporate risk from climate change

Climate change
Climate change is caused by emissions of greenhouse gasesinto the atmosphere — concentrations of which have beenincreasing since the start of the industrial revolution.Whilst some details of the science remain uncertain,climate change is now fully recognised as a reality, andlegally binding regulations to address it have already beenput in place.
Carbon dioxide (CO2) accounts for around 80% of thedeveloped world greenhouse gas impact. It is heavily linkedto energy consumption, being released wherever fossilfuels are burnt. Other greenhouse gases include methane(CH4), nitrous oxide (N2O), sulphur hexafluoride (SF6),together with various HFCs and CFCs.
Carbon dioxide is often referred to as just ‘carbon’.
The Kyoto Protocol and longer term targets
Following Russian ratification, the UN’s Kyoto Protocolentered into force in February 2005, restricting developedworld emissions of greenhouse gases for 2008-2012. EU-15countries were allocated a single target of an 8% reductionin ‘CO2 equivalent’ versus 1990 levels; within this the UK’starget is a 12.5% reduction.6
The Kyoto Protocol does not include greenhouse gasemissions targets for emerging countries, including Indiaand China, nor targets for countries that did not ratify theProtocol — most notably the USA and Australia. Early stagediscussions have started on post-2012 emissions regulation.
The UK’s Energy White Paper confirmed the UK’s aim for a 60% reduction in its greenhouse gas emissions by 2050.Other EU member states have similarly tough medium andlong term targets.7
EU and UK climate change legislation
The European Climate Change Programme (ECCP) covers a broad range of measures to meet the EU’s greenhousegas reduction targets. There are 41 Directives in total — covering topics as diverse as transport policy, energylabelling, non-CO2 greenhouse gases, the energyperformance of buildings, emissions trading, renewables,and combined heat and power (CHP).
A major component of the ECCP is the EU Emissions TradingScheme (the EU ETS). From January 2005, major sources ofindustrial carbon emissions have been subject to the ‘capand trade’ regulation surrounding this new scheme. As withany limited resource, the EU ETS places a value on eachtonne of carbon. Appendix 2 provides a brief overview.
Within the UK, industrial users of energy have been subjectto climate change legislation in the form of the ClimateChange Levy and Climate Change Levy Agreements since2001. The Climate Change Levy (CCL) is a tax on industrialenergy use, thereby indirectly addressing energy-linkedcarbon emissions. The Climate Change Levy Agreements(CCLAs) offer an 80% levy reduction for companies whosatisfy agreed energy efficiency improvement targets. UK companies with agreed CCLA targets are able to opt out of the EU ETS until 2008. Other UK-specific climatechange legislation includes the Renewables Obligation.
EU ETS mechanics and the concept of ‘free allowances’
Under the EU ETS, each Member State’s National AllocationPlan sets out its allocation of carbon emission allowances(generally referred to as just ‘emission allowances’) to eachsite covered by the trading scheme.
These emission allowances are issued for free — meaningthat regulated sites only face the cost associated with any shortfall. They do not face a cost on each tonne ofcarbon emitted.
Whilst the Kyoto Protocol, and other measures such as the Clean Development Mechanism, address allgreenhouse gases, the EU ETS currently only coverscarbon emissions.
At the end of each calendar year, each EU ETS regulatedsite must submit sufficient emission allowances to coverthat year’s verified carbon emissions. If it does not havesufficient emission allowances, it may purchase themthrough the EU ETS; if it has an excess, it can be a seller. There are significant penalties in place (seeAppendix 2) if these requirements are not met.
Through allocating with a small shortfall, the EU ETSencourages a reduction in carbon emissions to take place, in whichever sites have the lowest cost abatementopportunities.
Appendix 2 provides more details on the EU EmissionsTrading Scheme (EU ETS).
Climate change and shareholder value6
2 Introduction to climate change
6 The UK has also set itself a tougher domestic target of a 20% reduction versus 1990 levels by 2010.7 See Investor Guide to Climate Change, The Carbon Trust, January 2005.8 For more information on CDM see Investor Guide to Climate Change, The Carbon Trust, January 2005. CDM is a mechanism under which companies and governments can meet part of their Kyoto commitment through investing in greenhouse gas emission reductions in the developing world.

What happens in 2005-7 and 2008-12?
Phase One of the EU ETS is already underway, coveringcarbon emissions from energy intensive industry in the EUfor the three year period 2005-7. It regulates around halfof the EU’s total greenhouse gas emissions. The carbonprice on the EU ETS is currently is around €27/tonne CO2(mid-February 2006).
Emission allowance allocations for Phase Two (covering 2008-2012 and corresponding to the Kyoto complianceperiod) are due to be announced in each Member State’sPhase Two National Allocation Plan by mid-2006. These will be subject to review by the European Commission, for competitive consistency and alignment with individualMember State’s Kyoto compliance strategies.
During Phase Two, the EU ETS may be extended to includeother sectors such as aviation, and may be linked intoother trading schemes (including potentially Norway,Switzerland, Canada and Japan).
Various chemical, industrial and agricultural processes also emit other greenhouse gases. Whilst not covered by the EU ETS at present (which only covers carbonemissions), they have a potent greenhouse gas effect.These non-CO2 greenhouse gases are included within thebroader Kyoto Protocol regulatory regime — for example,developing world reductions in any of these gases canqualify for Clean Development Mechanism (CDM) credits.8
What happens from 2013?
International discussions have started on post-2012emissions regulation. High priority is being placed onengaging with countries not currently regulated by theKyoto Protocol — particularly the USA, India and China.
Regardless of progress on international negotiations, theEU ETS is expected to continue post-2012, with tighteningcontrols on carbon emissions and a widening scope.9
Emissions from transport (including aviation), property and the service sector are likely to receive more attention.The scheme may also be extended to cover emissions fromnon-CO2 greenhouse gases.
As constraints on emissions of carbon and other greenhousegases become tighter, the underlying carbon price (pertonne of CO2 equivalent) in schemes such as the EU ETSwould typically be expected to increase.
The inevitability of at least some weather impacts
Even if steps are taken now to dramatically reducegreenhouse gas emissions, climate change will still happento some extent because such gases remain in the atmospherefor decades and impacts accumulate for even longer.
The forecast impacts include changes to temperature andprecipitation (rainfall) patterns, together with a greaterfrequency of extreme events — such as flooding, stormsand drought.10
Broader implications
Climate change is also expected to bring some less tangibleeffects on business and industries.
Demand patterns are likely to change, both as (a) consumersbecome more aware of climate change, and (b) low-carbonproducts and services become relatively more competitive.In 2005, the Carbon Trust published analysis on Brand Value at Risk from Climate Change, investigating the value at risk if a company’s products are not seen to be as environmentally responsible in the future.11
To meet long term emission targets, and regulatoryrequirements, new technology developments are required:from renewable energy development to energy efficiencyand energy management technologies, to more radicalproduct redesign. This potentially opens up new businessareas across a range of industries.
There will be large creation and distribution of shareholdervalue in the transition to a low-carbon economy — therewill be winners and losers at sector level and within sectorsat company level. The winners are likely to come fromthose businesses that take the time to understand andaddress this complex area.
Introduction to climate change 7
9 It is worth noting that the EU put in place legally binding legislation surrounding the EU ETS, before the Kyoto Protocol entered into force. From a company perspective, it would be prudent to assume that EU legislation will continue, even if the broader international process is stalled.
10 For more information on the science of climate change and the anticipated impacts, see The Climate Change Challenge, The Carbon Trust, March 2005.11 See Brand Value at Risk from Climate Change, The Carbon Trust, March 2005.
During 2005, the Carbon Trust worked with CairneagleAssociates (a strategic management consultancy firm) todevelop a methodology for analysing shareholder value atrisk from both climate change and its associated carbonemissions regulation.
Companies across a wide range of sectors are exposedto climate change — both in terms of the physical risks(e.g. asset damage from increasingly frequent extremeweather events, production downtime) and theconstraints and cost of carbon dioxide and othergreenhouse gases imposed by regulatory (and voluntary)mitigation measures. The challenges also bring newmarket opportunities in areas such as renewables andenergy efficiency. Whilst climate change is seen as a longer term issue, emissions controls such as the EU Emissions Trading Scheme are already in place.
The approach
The model developed offers a robust, replicable approach to analysing such value at risk. It follows a four stepmethodology as outlined on the following page. The modelhas been tested and developed through the analysis of ten‘case study companies’, which are discussed in Appendix 1on an unnamed basis.
The methodology is by nature a top-down approach. In calculating the financial impact, we have quantified the potential impact on profits, using the shape of thebusiness in 2004, but applying a potential 2013 emissionsregulation regime.
Why use 2013?
2013 was chosen as the first year after the end of the2008-2012 Kyoto compliance period (which also equates to Phase Two in the EU ETS).
Greenhouse gas targets, policy and regulation beyond this2008-2012 Kyoto compliance period are several years frombeing agreed. However, in order to meet longer term ‘safe’greenhouse gas levels, significant further reductions will berequired. We have assumed in Europe a continuation of theEU Emissions Trading Scheme, with its approach of allocatinga set (typically decreasing) number of free allowances toeach site. We have assumed that the sectoral scope of theEU Emissions Trading Scheme (or similar parallel schemes)is extended to include other corporate sectors andtransport-linked emissions.
A major uncertainty is to what extent countries notcurrently regulated by the Kyoto Protocol (particularly the USA, India and China) will be brought into committedemission reduction targets from 2013. In the case studyanalysis in Appendix 1, we have considered two scenariosfor non-EU emissions: one where they face the sameregulatory cost as activities in the EU, and one where they face no regulatory constraints.
2013 therefore represents the earliest year under thisuncertain, but likely tougher, regulatory regime.
Although this report focuses on 2013, it needs to berecognised that, for many sectors, financial impacts will be seen significantly before this time. Energy intensiveindustry in the EU has been regulated by the EU ETS since the start of 2005, and free allowance allocations are expected to be reduced in the second phase of tradingfrom 2008. In addition, a much broader range of businessesare also already seeing the early impact of carbon pricingthrough electricity costs.
The case studies
All of the ‘case study companies’ have been based on real examples. In some cases, the ‘case study company’analysed is strictly linked to a single company within thatsector. In others, just a single corporate division has beenreviewed, and in others yet again, characteristics fromseveral companies have been combined, to produce a more representative example.
Restriction to just published sources of information
In order to enable analysis on a strictly like-for-like basis,the research has been based entirely upon public sourcesof information. No company interviews were conducted (in order to keep the research to just public sources),although input was sought where appropriate frominvestment analysts and other third party experts. Thisanalysis illustrates what a determined shareholder (or other onlooker) could derive about value at risk from climate change, based upon what companiesdisclose today.
In most cases, not everything needed to quantify exposureto climate change was disclosed: a large proportion of theproject was spent drilling down into corporate and industrybody information in order to obtain robust estimates. Thisin itself is an important finding. In particular, in most cases,estimates were needed for carbon emissions associatedwith logistics, packaging and key raw materials. With care, and using a broad range of third party sources andapproximations, these could be estimated.
Climate change and shareholder value8
3 Methodology

Methodology 9
1. Assess value chain and impacts
Begin by assessing the company, its sector and relatedvalue chain. For some industries, such as automotivemanufacture, even though the company’s own carbonemissions are relatively low, carbon emissions elsewherein the value chain dominate. Is use or disposal of thecompany’s products particularly exposed to climatechange? Do key raw materials or suppliers representhigh sources of carbon emissions?
2. Quantify carbon emissions — direct and indirect
This needs to include both direct carbon emissions,and those indirect emissions linked to purchasedelectricity, bought-in goods (including packaging) and distribution. These should be costed at an agreedcarbon price — for this report and analysis we haveused £20/tCO2 — for calculation of the company’s‘emissions exposure’.
3. How is financial exposure to carbon emissions minimised?
Regulatory:
How many emissions are allocated for free? This willbe influenced by the perceived availability of cost-effective carbon reductions within that sector, andbroader competitive and economic considerations.
Competitive dynamics:
What proportion of additional costs will be passedon by the supply chain?
What proportion of additional costs will thecompany be able to pass through to its customers?What implications may this have for market share or revenue?
How much of business is within the EU, versuselsewhere (where regulatory regimes may be less costly)?
4. Other broader impacts
Implications of broader carbon emission constraints:
Are there implications (positive or negative) ofbroader carbon emission constraints on demand for a company’s products?
Will competitive positioning change — by companyor sector? Is there a risk of low-carbon substituteproducts?
Are there new business opportunities?
Implications of physical impacts of climate change:
Do changing weather patterns (hotter, driersummers; warmer, wetter winters; more extremeevents) have any implications?
Potential impact on customer needs and behaviours:
Will customers increasingly value ‘climate friendly’products?
Could brand values be affected (positively or negatively)?
In order to obtain a better indication of the likelyimpact on value, the methodology quantifies theimpact on profits using the shape of the business in2004, but applying the likely carbon managementregime in 2013. This long term profit impact is usedas a proxy for value at risk.
The analysis focuses on carbon emissions, as carbonis the only greenhouse gas currently covered by the EUETS. However, where relevant, non-CO2 greenhousegases are also measured and their materialityindicated.
Value at risk methodology
Impact on relative competitivenessof alternative technologies
Customer perception that some products are bad for the environment
Carbon and other
GHGconstraints
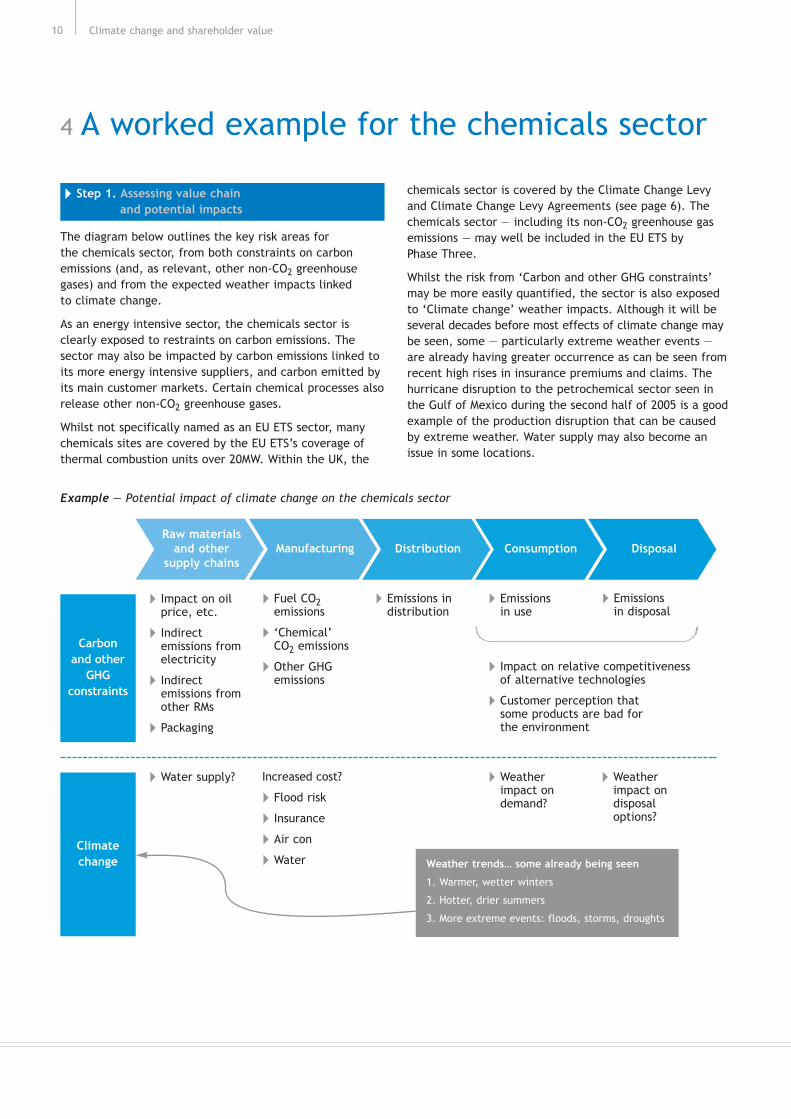
Step 1. Assessing value chain and potential impacts
The diagram below outlines the key risk areas for the chemicals sector, from both constraints on carbonemissions (and, as relevant, other non-CO2 greenhousegases) and from the expected weather impacts linked to climate change.
As an energy intensive sector, the chemicals sector isclearly exposed to restraints on carbon emissions. Thesector may also be impacted by carbon emissions linked toits more energy intensive suppliers, and carbon emitted byits main customer markets. Certain chemical processes alsorelease other non-CO2 greenhouse gases.
Whilst not specifically named as an EU ETS sector, manychemicals sites are covered by the EU ETS’s coverage ofthermal combustion units over 20MW. Within the UK, the
chemicals sector is covered by the Climate Change Levyand Climate Change Levy Agreements (see page 6). Thechemicals sector — including its non-CO2 greenhouse gasemissions — may well be included in the EU ETS by Phase Three.
Whilst the risk from ‘Carbon and other GHG constraints’may be more easily quantified, the sector is also exposedto ‘Climate change’ weather impacts. Although it will beseveral decades before most effects of climate change maybe seen, some — particularly extreme weather events —are already having greater occurrence as can be seen fromrecent high rises in insurance premiums and claims. Thehurricane disruption to the petrochemical sector seen inthe Gulf of Mexico during the second half of 2005 is a goodexample of the production disruption that can be causedby extreme weather. Water supply may also become anissue in some locations.
Climate change and shareholder value10
4 A worked example for the chemicals sector
Example — Potential impact of climate change on the chemicals sector
Impact on oilprice, etc.
Indirectemissions fromelectricity
Indirectemissions fromother RMs
Packaging
Fuel CO2emissions
‘Chemical’CO2 emissions
Other GHGemissions
Emissions indistribution
Water supply? Weatherimpact ondemand?
Weatherimpact ondisposaloptions?
Climatechange
Raw materialsand other
supply chainsManufacturing Distribution Consumption Disposal
Increased cost?
Flood risk
Insurance
Air con
Water
Emissions in disposal
Emissions in use
Weather trends… some already being seen
1. Warmer, wetter winters
2. Hotter, drier summers
3. More extreme events: floods, storms, droughts
Step 2. Quantifying carbon emissions — direct and indirect
Gathering reliable and comparable data on carbonemissions is not straightforward.
The chemical companies reviewed all disclosed their‘direct’ and electricity-linked ‘indirect’ carbon emissions.However, carbon emissions associated with packaging,logistics and ‘high carbon’ raw materials needed to beestimated in all cases. For the bulk commodity chemicalscase study used here, this resulted in an ‘emissionsexposure’ roughly twice that reported.
The carbon emissions were then costed at a carbon priceof £20/tCO2. Whilst the future of prices is clearly highlyuncertain, this is in line with longer term carbon priceassumptions in recent other Carbon Trust and third partypublications (including Trucost/Henderson’s Carbon 100publication12). It is also similar to long term estimates forthe gas/coal switching price — a key technical price driverfor the EU ETS carbon price.13
Step 3(a). Impact of free allowances and supply chain pass through
Applying a straight cost of £20/tCO2 to every tonne ofcarbon emissions, however, clearly overestimates andoversimplifies the situation. Different companies andsectors can pass through different proportions of increasesin operating costs. They also have different regulatoryexposure and different potential abatement costs.
Our case study Bulk Commodity Chemicals company wasassumed to receive sufficient free allowances to cover 70% of its own direct emissions (those linked to direct fuel, direct chemical emissions and distribution). Freeallowances are allocated through each Member State’sNational Allocation Plan.
A large component of supply chain carbon emissions are from purchased electricity. In this analysis, we haveassumed that the electricity sector passes through costs at 50% of the marginal cost impact that valuing carbon at£20/tCO2 would have on the cost of coal-fired generation— the ‘technology at the margin’.
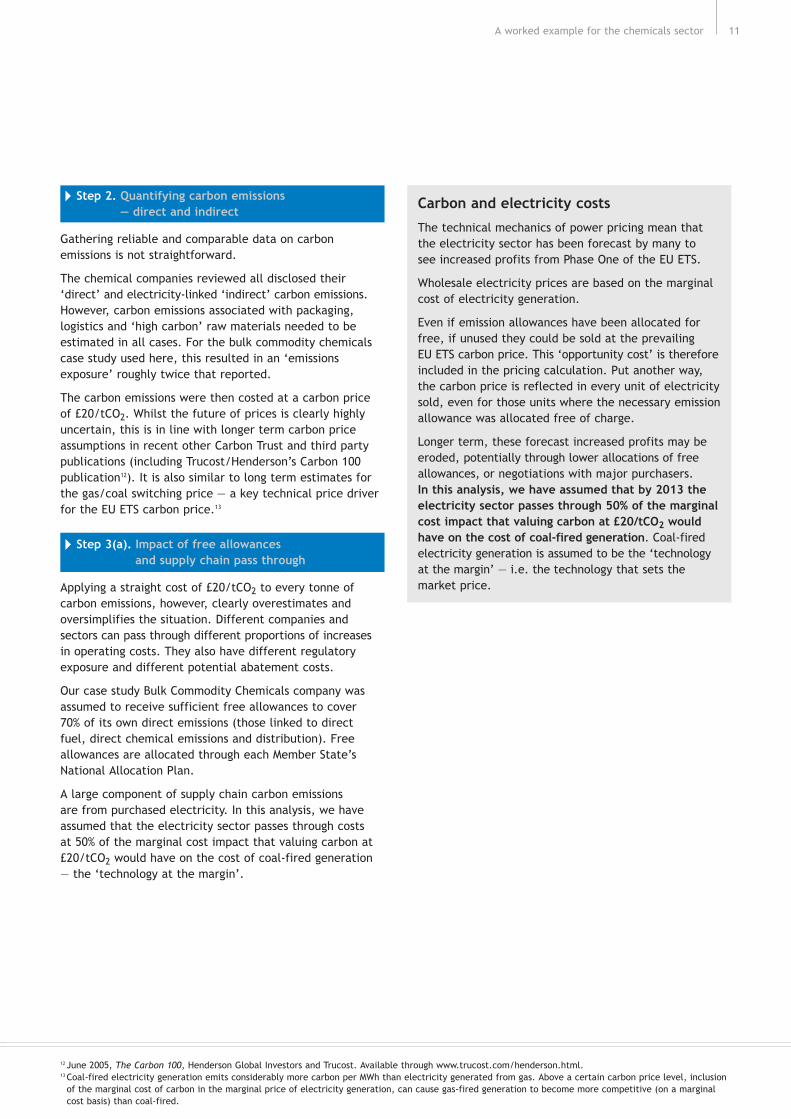
Carbon and electricity costs
The technical mechanics of power pricing mean thatthe electricity sector has been forecast by many to see increased profits from Phase One of the EU ETS.
Wholesale electricity prices are based on the marginalcost of electricity generation.
Even if emission allowances have been allocated forfree, if unused they could be sold at the prevailing EU ETS carbon price. This ‘opportunity cost’ is thereforeincluded in the pricing calculation. Put another way,the carbon price is reflected in every unit of electricitysold, even for those units where the necessary emissionallowance was allocated free of charge.
Longer term, these forecast increased profits may beeroded, potentially through lower allocations of freeallowances, or negotiations with major purchasers. In this analysis, we have assumed that by 2013 theelectricity sector passes through 50% of the marginalcost impact that valuing carbon at £20/tCO2 wouldhave on the cost of coal-fired generation. Coal-firedelectricity generation is assumed to be the ‘technologyat the margin’ — i.e. the technology that sets themarket price.
A worked example for the chemicals sector 11
12 June 2005, The Carbon 100, Henderson Global Investors and Trucost. Available through www.trucost.com/henderson.html.13 Coal-fired electricity generation emits considerably more carbon per MWh than electricity generated from gas. Above a certain carbon price level, inclusion
of the marginal cost of carbon in the marginal price of electricity generation, can cause gas-fired generation to become more competitive (on a marginalcost basis) than coal-fired.
Climate change and shareholder value12
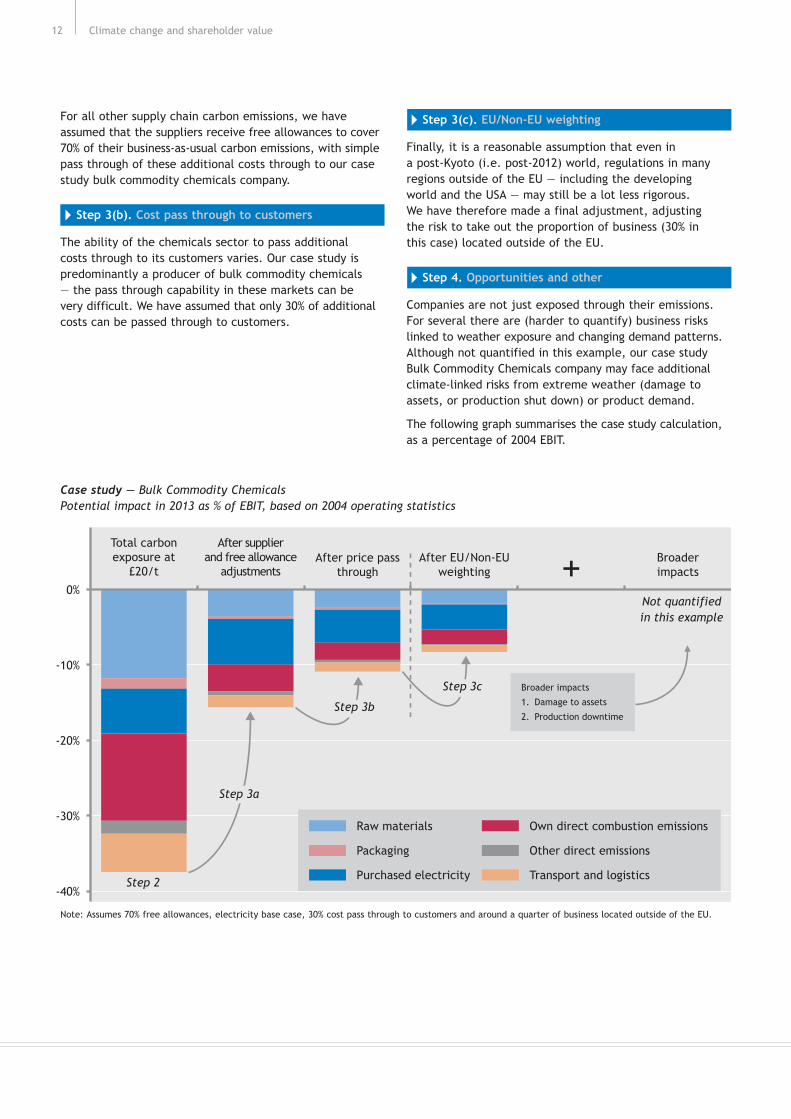
Case study — Bulk Commodity ChemicalsPotential impact in 2013 as % of EBIT, based on 2004 operating statistics
0%
-10%
-20%
-30%
-40%
Total carbon exposure at
£20/t
After supplierand free allowance
adjustmentsAfter price pass
throughAfter EU/Non-EU
weightingBroader impacts+
Raw materials
Packaging
Purchased electricity
Own direct combustion emissions
Other direct emissions
Transport and logisticsStep 2
Not quantified in this example
Step 3a
Step 3b
Step 3c Broader impacts
1. Damage to assets
2. Production downtime
Note: Assumes 70% free allowances, electricity base case, 30% cost pass through to customers and around a quarter of business located outside of the EU.
For all other supply chain carbon emissions, we haveassumed that the suppliers receive free allowances to cover70% of their business-as-usual carbon emissions, with simplepass through of these additional costs through to our casestudy bulk commodity chemicals company.
Step 3(b). Cost pass through to customers
The ability of the chemicals sector to pass additional costs through to its customers varies. Our case study ispredominantly a producer of bulk commodity chemicals — the pass through capability in these markets can be very difficult. We have assumed that only 30% of additionalcosts can be passed through to customers.
Step 3(c). EU/Non-EU weighting
Finally, it is a reasonable assumption that even in a post-Kyoto (i.e. post-2012) world, regulations in many regions outside of the EU — including the developing world and the USA — may still be a lot less rigorous. We have therefore made a final adjustment, adjusting the risk to take out the proportion of business (30% in this case) located outside of the EU.
Step 4. Opportunities and other
Companies are not just exposed through their emissions.For several there are (harder to quantify) business riskslinked to weather exposure and changing demand patterns.Although not quantified in this example, our case studyBulk Commodity Chemicals company may face additionalclimate-linked risks from extreme weather (damage toassets, or production shut down) or product demand.
The following graph summarises the case study calculation,as a percentage of 2004 EBIT.
What does this analysis tell us?
Whilst total carbon emissions exposure (with all emissionscosted at £20/tCO2) is around 38% of EBIT, this reduces tojust 11% once free allowances, supplier adjustments andprice pass through have been taken into account. Adjustingto remove any regulatory cost on operations outside the EU reduces this profit exposure further to 8%.
The analysis clearly helps understand where the companyis most impacted.
Although actual electricity-linked emissions are relativelylow as a proportion of the total emissions exposure (see the first column), the energy pricing mechanics discussedabove mean that this becomes the most material costelement, after adjustments are made for free allowancesand supply chain pass through. Put another way, electricity-linked emissions still represent c. 6% of EBIT in the secondcolumn, whilst everything else has decreased. Electricity-linked emissions are the largest cost exposure (column 2),despite not representing the largest actual emissionsexposure (column 1).
The case study’s largest areas of emissions exposure(column 1) are through its direct fuel combustion and rawmaterials. Direct fuel combustion is easy to monitor, andcontrolling energy usage will have been a cost issue, evenbefore carbon emissions increased attention in this area.However, much less is known or reported by the companyon the carbon intensity and regulatory treatment ofemissions from key raw materials. This would appear to bean area that should be understood and disclosed in muchgreater detail than appeared to be currently the case inthe chemical companies reviewed.
The other major issue is clearly price pass through. Theadditional cost incurred (16% of EBIT in the second column)is pretty significant, yet only 30% of this additional costcan be passed through. Is this 30% cost assumption correct,and how is it expected to develop going forward?
Finally, although the analysis did not quantify a broaderimpact risk in this case14 this is an area of potentialimportance. As already discussed, production in certainchemical sites could become increasingly exposed toweather-linked disruption. In addition, commodity chemicalsis a complex area, with demand for each product oftenfocused on a few specific uses. If one of these end marketsis subject to significant emissions regulation, consumerpressure or other climate change-linked influence, thatcould have further significant impact on our chemicalcompanies specialising in that area.
Selected other climate-linked opportunities can exist in the chemicals sector. In the autumn of 2005, the Frenchcompany Rhodia announced that it had reached agreementon CDM approval for a N2O reduction project in itssubsidiaries in Korea and Brazil,15 generating a sizeable newrevenue stream for the company.
A worked example for the chemicals sector 13
14 See Appendix 1 for case studies where one or two specific risks exist, and hence this element has been quantified.15 The Clean Development Mechanism (CDM) is discussed in Appendix 2, but can briefly be summarised as a tool through which a developed world investor can
gain emission credits for an investment in the developing world which will result in a reduction in CO2 or other greenhouse gases emissions. One tonne N2O(nitrous oxide) is equivalent to 23t CO2 in global warming impact.
A summary of the analysis for each sector case study is available in Appendix 1. The findings are summarised in the graph below:
The blue bars show the full carbon emissions exposure,with all associated carbon emissions costed at £20/tCO2.These figures represent each case study’s ‘carbonemissions exposure’ or ‘emissions exposure’.
The red bars show this emission-linked exposure, onceregulatory and market dynamics have been taken intoaccount. These figures represent each case study’s ‘profitexposure’ to emissions regulation.
The orange bars show the additional profit risk or upsidefrom broader climate change impacts, not linked to thecase study’s own emissions exposure. These calculationsare harder to quantify, but are key estimates. In somesectors — such as Logistics, Building Materials, FoodProduction and House Building — this less quantifiablerisk is the more material.
Total value at risk is represented by the red and orangebars combined. Clearly, as the graph illustrates, this is not the same as simple ‘emissions exposure’. Differentcompanies and sectors have (a) different carbon emissionsregulatory treatment and carbon cost exposure, (b)different carbon emission abatement opportunities, and (c) different abilities to pass costs through to customers.Certain companies also experience significant additionalclimate change risk, not directly linked to their ownemissions profile.
Only the Building Materials and Bulk Commodity Chemicalscase studies have value at risk clearly in excess of 10% ofEBIT by 2013. For Building Materials, this risk is primarilylinked to the broader risk of weather-linked constructiondelays, rather than direct emission regulation. The BuildingMaterials sector is also exposed to the high carbon intensityof materials such as cement. The Bulk Commodity Chemicalscase study also faces high energy requirements, a highcarbon supply chain, and difficulty in passing any carbonassociated costs forward.
Climate change and shareholder value14
5 Summary and analysis of all ten case studies
Value at risk from climate changePotential impact in 2013 as % of EBIT, based on 2004 operating statistics
SupermarketsLogisticsElectricityGenerator
Building Materials
BulkCommodityChemicals
IndustrialGases
FoodProduction
Hotels andLeisure
HouseBuilding
WaterUtility
50%
40%
30%
20%
10%
0%
-10%
-20%
-30%
-40%
-50%
-60%
-70%
-80%
Carbon exposure, fully costed at £20/tCO2
Profit exposure, after regulatory and market dynamics
Broader impacts: additional climate change risk,not linked to own emissions exposure
Key
Note: In order to provide a like-for-like comparison, the value at risk analysis above is shown before the EU/Non-EU adjustment, i.e. it compares a 100% EUbased supermarket, versus a 100% EU based hotel and leisure group.

Under our assumptions, only the Building Materials and BulkCommodity Chemicals case studies have potential value at riskclearly in excess of 10% of EBIT by 2013. For Building Materials, this risk is primarily linked to the broader risk of weather-linkedconstruction delays, rather than direct emissions regulation.Logistics may also see value at risk of this magnitude, if its long-haul air freight growth rates are hit.
Logistics may also see value at risk of this magnitude, if its long-haul air freight growth rates are hit. Despitehaving such high emissions exposure, the logistics sector isassumed to pass virtually all of these additional emissions-linked costs on to its customer base.
The profit exposure and broader impacts risk for othersectors is significantly lower. The Electricity Generatorcase study sees significant profit upside (as alreadyforecast in commentary surrounding Phase One of the EU ETS), due to the mechanics of marginal cost pricing(see page 11).
Carbon exposure is clearly not the same as value at risk
Different companies and sectors have:
Different carbon emissions regulatory treatment and carbon cost exposure
Different carbon emission abatement opportunities
Different abilities to pass through costs to customers.
Certain companies also experience climate change risk,not directly linked to their own emissions profile — thiscan be from weather risk or changing demand patterns.
Despite its relatively high emissions intensity, IndustrialGases is not especially exposed financially, due to the highpercentage of costs that can be passed through to customers.It also sees potential upside from new markets surroundingcarbon sequestration and hydrogen infrastructure.
Out of the five lower emissions exposed case studies, FoodProduction and House Building are potentially the mostexposed, in part due to their weather risks (potentiallydisrupting supply for Food Production, and entailingconstruction delays and potential asset write down forHouse Building).
Hotels and Leisure can pass a high proportion of coststhrough to customers and energy is a low component ofcosts. For Supermarkets, packaging would appear to be its most significant, but hardest to quantify, issue.
Water Utilities, as a regulated industry, are assumed to be able to pass through all additional costs to customers.They are expected to need to make increased investmentsfor climate-linked storm and flood defence and also tocope with droughts, but the mechanics of their regulationmeans this increased asset base will allow a rise in profits.
A significant risk that can be reducedsubstantially if properly managed
When analysed on a fully costed basis at £20/tCO2 (theblue bars), emissions exposure is clearly a material risk,with five of our ten case studies seeing a potential impactin excess of 20% of EBIT.
However, properly managed, this risk is reduced. Regulatoryand market dynamics mean that the actual profit exposure(the red bars) is much lower.
If the company fully understands the implications of emissionconstraints, it will know where to focus its lobbying andnegotiation attention — whether with governmentregulators, higher-carbon suppliers or pricing discussionswith customers. For many, emission constraints and the‘cost of carbon’ should influence capex and investmentplans: a low value at risk can be reduced even further ifemissions can be cut at less than the ongoing trading priceof carbon, reducing the number of allowances the companyneeds to purchase, or even allowing excess allowances to be sold. Other financial opportunities (such as CDMinvestments16, technology developments or new markets)can be relevant, and should be explored and followed as appropriate.
The risk reduction (from the blue bars to the red bars) is an estimate, based upon the competitive and regulatoryassumptions discussed in Appendix 1. For a well managedcompany this risk could be reduced even further, and couldeven turn positive, as is currently the case in ourElectricity Generator example. Alternatively, the risk couldremain higher, if negotiations on allocation and pricing fail,and if inappropriate investments are made.17
Summary and analysis of all ten case studies 15
16 The CDM (Clean Development Mechanism) is a mechanism under which companies and governments can meet part of their Kyoto commitment throughinvesting in greenhouse gas emission reductions in the developing world. Emission credits generated from CDM investments can be used on the EU ETS,alongside other emission allowances.
17 For example, investing in less energy efficient process equipment capex, without recognising the cost and emission implications a few years down the line.
Assumptions
The analysis has been based around a single regulatoryscenario for 2013:18
We have assumed a 70% free allowance allocation,versus business as usual. We have assumed a cost ofcarbon of £20/tCO2. We have assumed that by 2013 the electricity sector passes through 50% of the marginalcost impact that valuing carbon at £20/tCO2 wouldhave on the cost of coal-fired generation. (Coal-firedgeneration is assumed to be the ‘technology at themargin’ — i.e. the technology that sets the market price).
A harsher regime, with a higher carbon price or theneed to purchase a greater proportion of allowances,could make the impact significantly higher.
Broader impacts may be the higher risk or opportunity
Companies also need to be aware of the potential broaderimpacts (the orange bars), representing climate change risknot specifically linked to their emissions exposure. Thegraph on page 14 highlights that for Logistics, BuildingMaterials, Food Production and House Building, non-emissions linked exposure is most significant. Thismostly derives from weather risk and some changingdemand patterns, assuming a gradual trend away fromhigher carbon products.
For Industrial Gases and the Water Utility, these broaderimpacts represented EBIT upside, due to new developingmarkets (hydrogen and carbon sequestration) for the gasessector and weather-linked investments increasing the WaterUtility’s regulated asset base.
Sources of exposure vary
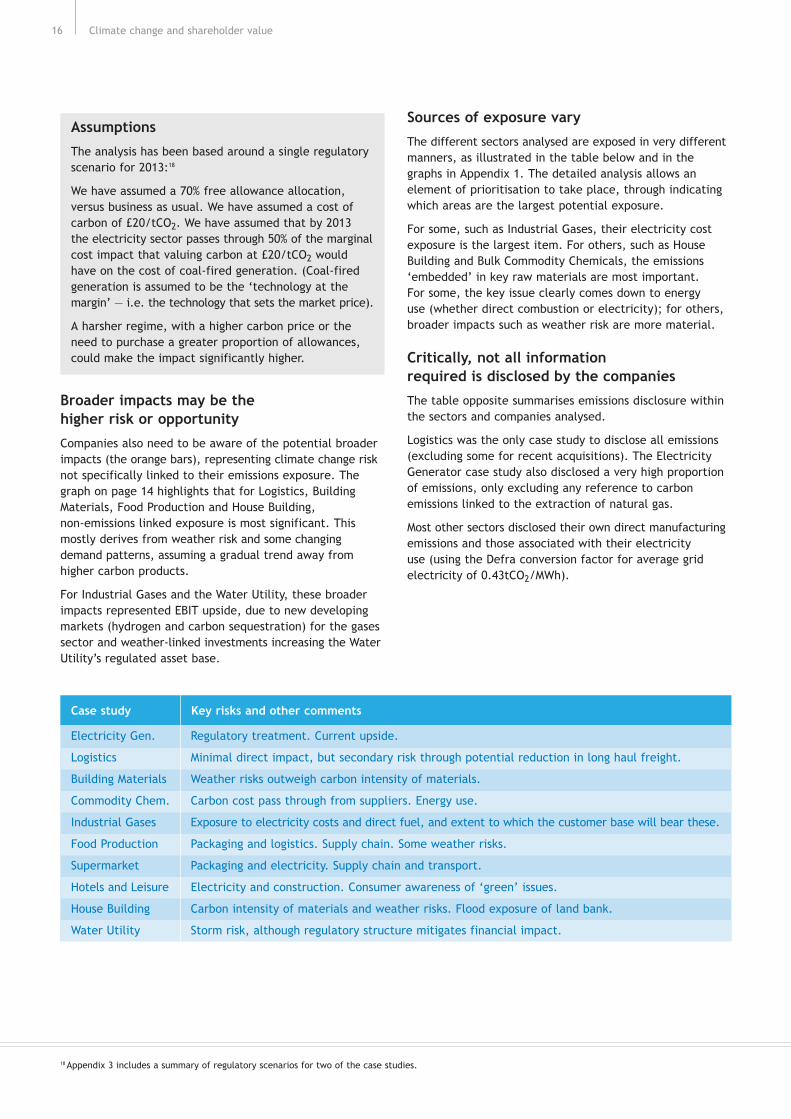
The different sectors analysed are exposed in very differentmanners, as illustrated in the table below and in thegraphs in Appendix 1. The detailed analysis allows anelement of prioritisation to take place, through indicatingwhich areas are the largest potential exposure.
For some, such as Industrial Gases, their electricity costexposure is the largest item. For others, such as HouseBuilding and Bulk Commodity Chemicals, the emissions‘embedded’ in key raw materials are most important. For some, the key issue clearly comes down to energy use (whether direct combustion or electricity); for others,broader impacts such as weather risk are more material.
Critically, not all information required is disclosed by the companies
The table opposite summarises emissions disclosure withinthe sectors and companies analysed.
Logistics was the only case study to disclose all emissions(excluding some for recent acquisitions). The ElectricityGenerator case study also disclosed a very high proportionof emissions, only excluding any reference to carbonemissions linked to the extraction of natural gas.
Most other sectors disclosed their own direct manufacturingemissions and those associated with their electricity use (using the Defra conversion factor for average gridelectricity of 0.43tCO2/MWh).
Climate change and shareholder value16
18 Appendix 3 includes a summary of regulatory scenarios for two of the case studies.
Case study Key risks and other comments
Electricity Gen. Regulatory treatment. Current upside.
Logistics Minimal direct impact, but secondary risk through potential reduction in long haul freight.
Building Materials Weather risks outweigh carbon intensity of materials.
Commodity Chem. Carbon cost pass through from suppliers. Energy use.
Industrial Gases Exposure to electricity costs and direct fuel, and extent to which the customer base will bear these.
Food Production Packaging and logistics. Supply chain. Some weather risks.
Supermarket Packaging and electricity. Supply chain and transport.
Hotels and Leisure Electricity and construction. Consumer awareness of ‘green’ issues.
House Building Carbon intensity of materials and weather risks. Flood exposure of land bank.
Water Utility Storm risk, although regulatory structure mitigates financial impact.

Emissions associated with raw materials production,packaging, transport and distribution were typicallyexcluded. Occasionally, a company discloses some materialon this, often just for one business unit. These analyses,together with third party research (e.g. on packaging,carbon in buildings, etc.) allowed estimates to be made, in most cases. Where the estimated numbers are highlysignificant, more work should be done by companies (andtheir shareholders) in that sector on understanding this.
Some of this missing material may exist within companies.However, for consistency, this analysis has been basedstrictly on public domain information. Part of its valuehas been to show what an independent third party couldfind out about different companies’ exposure from suchcurrent public information. Where possible, interviewswere held with selected investment analysts and otherthird party experts covering the different areas.
Uncertainties need to be recognised
As highlighted above, not everything needed for this analysiswas disclosed by the companies, and hence estimates wererequired in several areas.
A second area of uncertainty surrounds the regulatoryassumptions made. The approach has analysed value at riskunder a theoretical 2013 regulatory framework and using asingle estimate in each case for allowance allocation, pricepass through and other competitive dynamics.
Regulatory assumptions — a recap
We have assumed a 70% free allowance allocation,versus business as usual. We have assumed a cost ofcarbon of £20/tCO2. We have assumed that by 2013 theelectricity sector passes through 50% of the marginalcost impact that valuing carbon at £20/tCO2 wouldhave on the cost of coal-fired generation. (Coal-firedgeneration is assumed to be the ‘technology at themargin’ — i.e. the technology that sets the market price).
We have also needed to make assumptions on thepotential for price pass through.
The assumptions made are consistent and have beenoutlined for each case study in Appendix 1. Appendix 3includes two examples of scenario analysis.
Summary and analysis of all ten case studies 17
Emissions disclosed in companies analysed
Sector Disclosed Estimates required
Logistics 100% Electricity, Own Direct Fuel 0% —
Electricity Gen. 96% Own Direct 4% Raw Material (gas) Supply
Industrial Gases 87% Electricity, Own Direct 13% Raw Material, Packaging, Distribution
Water Utility 77% Electricity, Own Direct, CH4 in some 23% N2O, Bought in Materials, CH4 in some
Hotels and Leisure 61% Electricity and Gas 39% Bought in goods, Transport
Commodity Chem. 51% Electricity, Own Direct 49% Raw Materials, Packaging, Distribution
Food Production 47% Electricity, Own Direct 53% Raw Materials (sugar), Packaging,Distribution
Supermarket 35% Electricity, Own Direct 65% Packaging, Distribution
Building Materials 29% Electricity, Own Direct 71% Raw Materials, Packaging, Transport and Distribution
House Building 0% None 100% Electricity, Own Direct, Raw Materials,Transport and Logistics
The findings of this research clearly show that companiesneed to look further than just their own emissions andenergy use in order to understand their exposure toclimate change. Raw materials which involve significantcarbon in their extraction or production, and associatedservices (such as logistics and packaging) can be key. Forsome sectors, merely looking at ‘direct’ and electricity-linked ‘indirect’ carbon emissions overlooks broader moresignificant business risks.
Large companies — in most cases — represent a portfolio of assets, whether in different product or industry areas,or different geographic locations. Whilst some assets maybe significantly exposed to climate change, others may bemore protected. Smaller companies, with more restrictedoperations, may be more affected.
Many companies are already taking actions to reduce energyuse which both cuts costs and emissions. Some have alsostarted looking at logistics, again reducing costs as well asemissions. Very few companies, however, are incorporatingtheir full climate change risk exposure into their strategicthinking and it could have a significant impact.
An issue for both senior management and investors
Whilst initially climate change can appear a highly materialrisk, properly managed, this downside risk can be minimised.For some sectors, the analysis even suggests an uplift inprofits. What is critical is that companies need to fullyunderstand the risks and opportunities associated with thiscomplex area, and develop robust plans to address them.There will be large creation and distribution of shareholdervalue in the transition to a low carbon economy — therewill be winners and losers at sector level and within sectorsat company level. The winners are more likely to be thosebusinesses that take the time to understand and addressthis complex area.
Senior company management needs to ensure thatemissions regulation is fully understood and integratedinto the company’s business planning and operations, in addition to the potential weather-related/physicalimpacts. If the company fully understands the implicationsof emission constraints, it will know where to focus its
lobbying and negotiation attention — whether withgovernment regulators, higher-carbon suppliers, or pricingdiscussions with customers. For many, emission constraintsand the ‘cost of carbon’ should influence capex andinvestment plans. Other financial opportunities (such as CDM investments19, technology developments or newmarkets) should be seriously explored.
Investors, particularly in those sectors more highlyexposed to the issue, should ensure that climate changeforms part of their ongoing dialogue with the companiesin which they invest. From a governance perspective,they will want to ensure risks are being appropriatelymanaged. From a valuation perspective, the companiesthemselves are best placed to provide information on the financial impacts of regulatory announcements (suchas the announcement of 2008-12 National AllocationPlans due in mid-2006, and any decisions on post-2012regulation) and other drivers.
The facing page outlines a list of questions that the Carbon Trust believes could be asked in order to ascertainwhether this appropriate risk management is taking place.
The Carbon Trust
Set up in 2001, the Carbon Trust is an independentcompany, business led and funded by government, taskedwith reducing greenhouse gas emissions in business and the public sector. We work directly with UK companies ofall sizes to help reduce carbon emissions and develop newlow carbon technologies. We also periodically undertakedetailed research to improve understanding of climatechange issues.
The Carbon Trust, through its Carbon Managementprogramme, helps UK companies understand the strategicimpact of climate change on their businesses, and takeaction. For more details on this programme, and otherCarbon Trust activity, please email [email protected] visit www.thecarbontrust.co.uk.
Quantifying value at risk from climate change in financialterms is an ongoing area of activity for the Carbon Trust.We are organising a range of workshops and projects aroundthis area over the coming months. If you are interested intaking part, please email [email protected].
Climate change and shareholder value18
6 Implications for senior management and investors
19 The Clean Development Mechanism (CDM) is a mechanism linked to the Kyoto Protocol, under which companies and investors can gain tradable emission allowances from investments in greenhouse gas reduction projects in the developing world.

Implications for senior management and investors 19
1. What is the company’s full exposure to greenhousegas emissions, including those linked to energy use,transport, logistics and supply chain?
Does the company fully understand its exposure togreenhouse gas emissions, including those linked toenergy use, transport and logistics, and its supply chain?Which emissions does it disclose? Which emissions areestimated solely for internal purposes? Which emissionsare ignored, and how often is that decision (to overlooksuch emissions) reviewed? Are emissions benchmarkedagainst competitors or industry standards, and — if so— how does the company compare?
2. What is the company’s exposure to emissionsregulation cost, and how is this expected to develop?
How are the company’s emissions currently regulated,and what is the cost incurred? How is this expected todevelop going forward, and what are the cost/planningimplications? What regulatory and price scenarios areroutinely run during business planning?
3. What other climate change impacts may affect the company?
Could demand patterns change as (a) consumerawareness of climate change increases, and (b) lower-carbon products become more competitive? Is thecompany exposed to extreme weather events? How do such risk factors feed into the planning process?
4. Are there supply side risks, either with electricitycosts or other high carbon raw materials?
How exposed is the company to rising energy prices,and to what extent has this been hedged? Are otherkey bought-in goods (including packaging) linked to high greenhouse gas emissions, and what are the implications?
5. Are there significant competitiveness implications,and how well placed is the company versus its direct competitors?
How much of the incremental cost associated withclimate change can be passed on to customers? Doesthe company face direct competition from non-EUproducers, less exposed to emissions regulation? Does the company face competition from lower-carbonsubstitute products? What scenarios are analysedduring business planning? What are their implications?Do competitors have different outsourcing strategiesand does this impact positively or negatively theirability to react to carbon issues?
6. Process Technology: What would be the cost ofreducing emissions by 5%, 10% or 20%, and does the company own any proprietary IP in this area?
If the company needed to reduce emissions by 5%, 10% or 20%, how could this be achieved, and whatwould be the cost? Is the company itself involved in development in this area of process emissionsefficiency? What is the estimated value of its IP, and what is its strategy for exploiting this?
7. New Market Technology: Does climate change open up new market opportunities, and how is the company positioned versus competitors in these new areas?
Does climate change open up new market opportunities,that the company would be well placed to address?How is the company positioned versus competitors in these new areas? What are the revenue projections,and how much has been invested to date?
Assessing corporate risk from climate change

Climate change and shareholder value20

Appendices 21
The analysis included five high carbon and five lower carboncase studies. Their carbon intensity of EBIT is shown below,in terms of kg CO2 emitted per £ EBIT in 2004.
These estimates, when costed at £20/tCO2 give the first column in each of the charts below.
Appendix 1 Case studies analysed
High carbon case studies and description Kg CO2e/£ EBIT1
Electricity GeneratorElectricity generator, with mix of hydro and fossil fuel generation. Also distribution. Mainly UK. 35
LogisticsGlobal freight management and contract logistics. 33
Building MaterialsSupplier of bulk aggregates, including concrete. EU and international. 28
Commodity ChemicalsSupplier of bulk commodity chemicals. Mainly EU based, but subject to wider competition. 19
Industrial GasesSupplier of industrial gases for a range of industries and applications. High electricity use. EU and international. 15
1 Estimated 2004 total associated CO2e emissions, divided by 2004 EBIT.
Lower carbon case studies and description Kg CO2e/£ EBIT1
Food ProductionA blend of food and drink producers. Around 50% of operations based outside the EU. Some exposure to high carbon raw materials such as sugar. 6.1
SupermarketsUK based supermarket chain. 3.3
Hotel and Leisure GroupHotel chain, primarily in the UK. 2.7
House BuildingUK based house builder. Domestic new build homes. 2.3
Water UtilityRegulated water utility operating in England/Wales. Supply of fresh water, and removal and treatment of waste water — for households and industry. 1.5
1 Estimated 2004 total associated CO2e emissions, divided by 2004 EBIT.

The analysis of the impact of the EU ETS on the electricitysector has been widely documented, but has been includedhere for comparison too. We have assumed that the priceof carbon gets passed through at 50% of the carbon priceimpact on the marginal cost of coal-fired generation — see page 11. This results in a profit uplift for the sector.
The analysis below includes recognition of the significantenergy-linked CO2 emissions associated with the productionand delivery of natural gas.
The sector faces some downside risk: a potential reduction in electricity demand due to rising prices andenergy efficiency programmes and potential risk to hydrogeneration of electricity from lower rainfall. There may besome demand upside from increased air conditioning. Theremay also be a substitution risk from renewables, or upsidefrom Renewable Obligation Certificates for those companiesinvolved in renewable generation. The figure calculatedbelow in the final column is a Cairneagle estimate of thesecombined factors.
Climate change and shareholder value22
Case study — Electricity GeneratorPotential impact in 2013 as % of EBIT, based on 2004 operating statistics
20%
0%
-20%
-40%
-60%
-80%
Total carbon exposure at
£20/t
After supplierand free allowance
adjustmentsAfter price pass
throughAfter EU/Non-EU
weightingBroader impacts+
Downside Risk
1. Potential decrease in electricity demand, due to energy efficiency
2. Rainfall impacting hydro
Partially offset by upside from ROCs and increased air conditioning
Raw materials (CO2 ‘embedded’ in gas supply)
Own direct combustion emissions
Other (operations, etc.) negligible
Power pricing based on 50% of marginal coal CO2 cost
Broader impacts
Note: Assumes 70% free allowances and just less than 10% of business located outside the EU. The electricity sector is assumed pass through costs at the 50% of the CO2 impact on the marginal cost of coal generation (the technology at the margin).
1.1 Electricity Generator

Appendices 23
The logistics case study is clearly heavily associated withcarbon emissions, due to its high exposure to transport.This covers both its own emissions, and those of third partycontractors (airlines, etc.).
Our analysis assumes that transport emissions (particularlyair freight transport) will be covered by the EU ETS by2013, resulting in a cost (after free allowances) of 23% of EBIT. However, most (90%) of these additional costs will be passed straight through to customers.
A more significant risk is a reduction in demand for airfreight for relatively low value, high weight products. In order to estimate this, a simple valuation model wascreated for the case study analysed, split by division, and based on broker estimates. The future growth rateassumed by analysts for Far East air freight was thenhalved. This resulted in a (roughly estimated) potentialdownside risk of 8%.
1.2 Logistics
Case study — Logistics companyPotential impact in 2013 as % of EBIT, based on 2004 operating statistics
0%
-20%
-40%
-60%
-80%
Total carbon exposure at
£20/t
After supplierand free allowance
adjustmentsAfter price pass
throughAfter EU/Non-EU
weightingBroader impacts+
Purchased electricity
Transport emissions
Broader impacts
Impact of potential lower growth in longhaul freight
Note: Assumes 70% free allowances, electricity base case, 90% cost pass through to customers and around 40% of business located outside of the EU.

Climate change and shareholder value24
The Building Materials case study chosen is a bulk supplierof aggregates (including sand, gravel and ready mixconcrete) and specific building products (e.g. bricks, blocksand precast concrete products such as concrete pipes).
Interviews with investment analysts suggested that thecement industry has relatively high price pass throughpotential, pointing out that cement margins have not beenimpacted by recent increases in energy costs. However, for concrete and brick suppliers, such price pass through is much harder. We have assumed an average of 50% ofadditional costs incurred is passed through to customers.
In this example we have quantified broader potentialimpacts. These reflect a potential 5% decrease in revenue,equivalent to a c. 18% decrease in operating profits due to:
Longer term risk from substitute products as the cost of cement and concrete products rise due to theirembedded CO2
Downside due to weather halting both the company’s ownproduction and customer construction, both of which candelay revenue and increase stock.
This has been netted off against a c. 1% potential revenueuplift in new opportunities such as flood defences, resultingin a net negative ‘broader impact’ of around 14-15% of EBIT.
Case study — Building MaterialsPotential impact in 2013 as % of EBIT, based on 2004 operating statistics
0%
-10%
-20%
-30%
-40%
-50%
-60%
Total carbon exposure at
£20/t
After supplierand free allowance
adjustmentsAfter price pass
throughAfter EU/Non-EU
weightingBroader impacts+
Raw materials
Purchased electricity
Own direct combustion emissions
Other direct ‘material’ emissions
Transport and logistics
Broader impacts
Downside due to weather halting production and construction projects, partially negated by opportunities such as demand for flood defence
Note: Assumes 70% free allowances, electricity base case, 50% cost pass through to customers and around two thirds of business located outside of the EU.
75% of raw materials emissions are from cement or steel: these are covered by the EU ETS and have been assessed using our methodology’s standardapproach of 70% free EU ETS allowances — resulting in a net cost to our case study of £6/tCO2 for these emissions.
The remaining 25% of raw material emissions are from raw materials such as bitumen — which whilst not in the EU ETS is subject to the CCL and CCLAs (seeglossary or page 6). These have been assessed using the current CCL, assuming the 80% discount requirements are met — resulting in a net cost to our casestudy of £2/tCO2 for these emissions.
1.3 Building Materials

Appendices 25
The next example looks at our Bulk Commodity Chemicalscase study. What is a relatively high potential exposure (in terms of % of 2004 EBIT, fully costed at £20/t) reduceswhen free allowances, pass through and non-EU adjustmentsare taken into account.
A 30% cost pass through to customers was assumed: thisreflects the highly competitive nature of such a company’scommodity products, and the existence of internationalcompetition (especially Middle East for petroleum basedcommodity chemicals). A speciality chemicals companywould typically have a higher pass through rate.
No broader impacts were quantified, although there is a financial risk associated with potential weather linkedasset damage, and production downtime due to extremeweather affecting either the case study company or itssuppliers (e.g. the impact on Texas based facilities with2005 hurricanes).
1.4 Bulk Commodity Chemicals
Case study — Bulk Commodity ChemicalsPotential impact in 2013 as % of EBIT, based on 2004 operating statistics
0%
-10%
-20%
-30%
-40%
Total carbon exposure at
£20/t
After supplierand free allowance
adjustmentsAfter price pass
throughAfter EU/Non-EU
weightingBroader impacts
Not quantified
+
Own direct combustion emissions
Other direct ‘material’ emissions
Transport and logistics
Raw materials
Packaging
Purchased electricity
Broader impacts
1. Damage to assets
2. Production downtime
Note: Assumes 70% free allowances, electricity base case, 30% cost pass through to customers and around a quarter of business located outside of the EU.
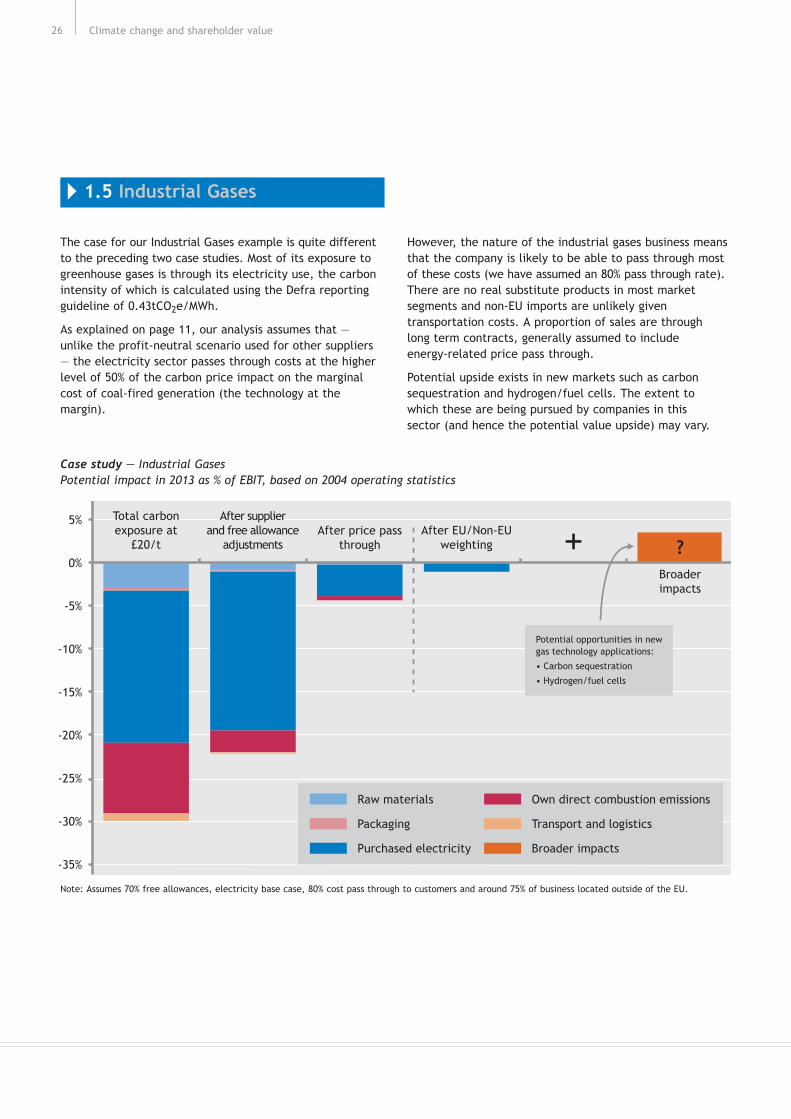
Climate change and shareholder value26
The case for our Industrial Gases example is quite differentto the preceding two case studies. Most of its exposure togreenhouse gases is through its electricity use, the carbonintensity of which is calculated using the Defra reportingguideline of 0.43tCO2e/MWh.
As explained on page 11, our analysis assumes that —unlike the profit-neutral scenario used for other suppliers— the electricity sector passes through costs at the higherlevel of 50% of the carbon price impact on the marginalcost of coal-fired generation (the technology at themargin).
However, the nature of the industrial gases business meansthat the company is likely to be able to pass through mostof these costs (we have assumed an 80% pass through rate).There are no real substitute products in most marketsegments and non-EU imports are unlikely giventransportation costs. A proportion of sales are through long term contracts, generally assumed to include energy-related price pass through.
Potential upside exists in new markets such as carbonsequestration and hydrogen/fuel cells. The extent to which these are being pursued by companies in this sector (and hence the potential value upside) may vary.
1.5 Industrial Gases
Case study — Industrial GasesPotential impact in 2013 as % of EBIT, based on 2004 operating statistics
5%
0%
-5%
-10%
-15%
-20%
-25%
-30%
-35%
Total carbon exposure at
£20/t
After supplierand free allowance
adjustmentsAfter price pass
throughAfter EU/Non-EU
weighting
Broader impacts
+
Own direct combustion emissions
Transport and logistics
Broader impacts
Raw materials
Packaging
Purchased electricity
Potential opportunities in new gas technology applications:
• Carbon sequestration
• Hydrogen/fuel cells
?
Note: Assumes 70% free allowances, electricity base case, 80% cost pass through to customers and around 75% of business located outside of the EU.

The Food Production case study is exposed to a wide range of sources of emissions. These include emissions associatedwith transport and distribution, its own fuel and purchasedelectricity, packaging (more significant than expected) and some key high carbon/high energy raw materials (such as sugar). We have assumed an average 50% cost pass through to customers.
There may be some changes to demand patterns forspecific products, although for diversified manufacturersthe impact is likely to be small as such impacts will onlyaffect part of the business. There may also be some supply chain issues. In March 2005, analysis published by the
Carbon Trust on Brand Value at Risk highlighted the food and beverage production sector as one considerably more exposed to such intangible matters than its carbonintensity would suggest.
The Food Production case study was based on a blend offood and drink producers. Other companies in the foodsector which could perhaps be more exposed to climatechange are those that own farms or plantations in a limitedgeographic area, or those that rely heavily on importsusing air freight.
Appendices 27
1.6 Food Production
Case study — Food ProductionPotential impact in 2013 as % of EBIT, based on 2004 operating statistics
0%
-2%
-4%
-6%
-8%
-10%
-12%
-14%
Total carbon exposure at
£20/t
After supplierand free allowance
adjustmentsAfter price pass
throughAfter EU/Non-EU
weightingBroader impacts+
Physical impacts of climate change:
1. Some changes to demandpatterns for specific products
2. Some supply chain issues
3. Some manufacturing implications if small temperature rise and extreme events
Own direct combustion emissions
Transport and logistics
Broader impacts
Raw materials
Packaging
Purchased electricity
Note: Assumes 70% free allowances, electricity base case, 50% cost pass through to customers and around 50% of business located outside of the EU.
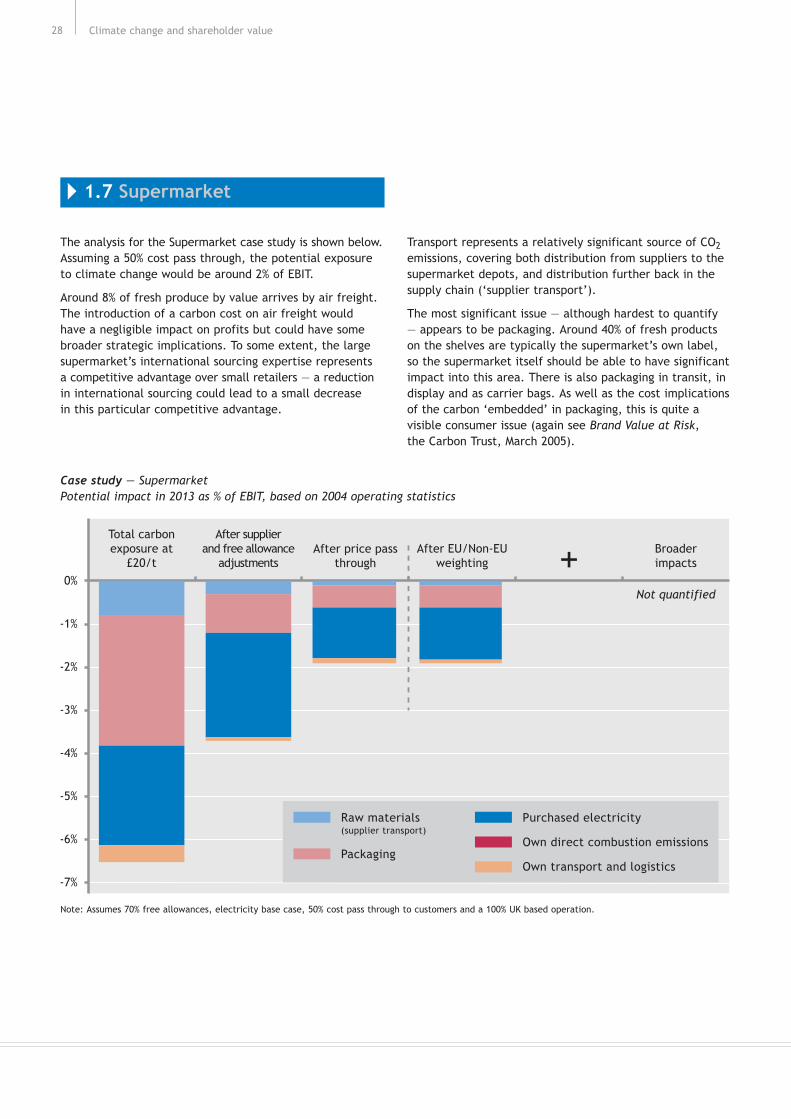
The analysis for the Supermarket case study is shown below.Assuming a 50% cost pass through, the potential exposureto climate change would be around 2% of EBIT.
Around 8% of fresh produce by value arrives by air freight.The introduction of a carbon cost on air freight would have a negligible impact on profits but could have some broader strategic implications. To some extent, the largesupermarket’s international sourcing expertise represents a competitive advantage over small retailers — a reductionin international sourcing could lead to a small decrease in this particular competitive advantage.
Transport represents a relatively significant source of CO2emissions, covering both distribution from suppliers to thesupermarket depots, and distribution further back in thesupply chain (‘supplier transport’).
The most significant issue — although hardest to quantify — appears to be packaging. Around 40% of fresh productson the shelves are typically the supermarket’s own label,so the supermarket itself should be able to have significantimpact into this area. There is also packaging in transit, indisplay and as carrier bags. As well as the cost implicationsof the carbon ‘embedded’ in packaging, this is quite avisible consumer issue (again see Brand Value at Risk,the Carbon Trust, March 2005).
Climate change and shareholder value28
1.7 Supermarket
Case study — SupermarketPotential impact in 2013 as % of EBIT, based on 2004 operating statistics
0%
-1%
-2%
-3%
-4%
-5%
-6%
-7%
Total carbon exposure at
£20/t
After supplierand free allowance
adjustmentsAfter price pass
throughAfter EU/Non-EU
weightingBroader impacts
Not quantified
+
Purchased electricity
Own direct combustion emissions
Own transport and logistics
Raw materials(supplier transport)
Packaging
Note: Assumes 70% free allowances, electricity base case, 50% cost pass through to customers and a 100% UK based operation.
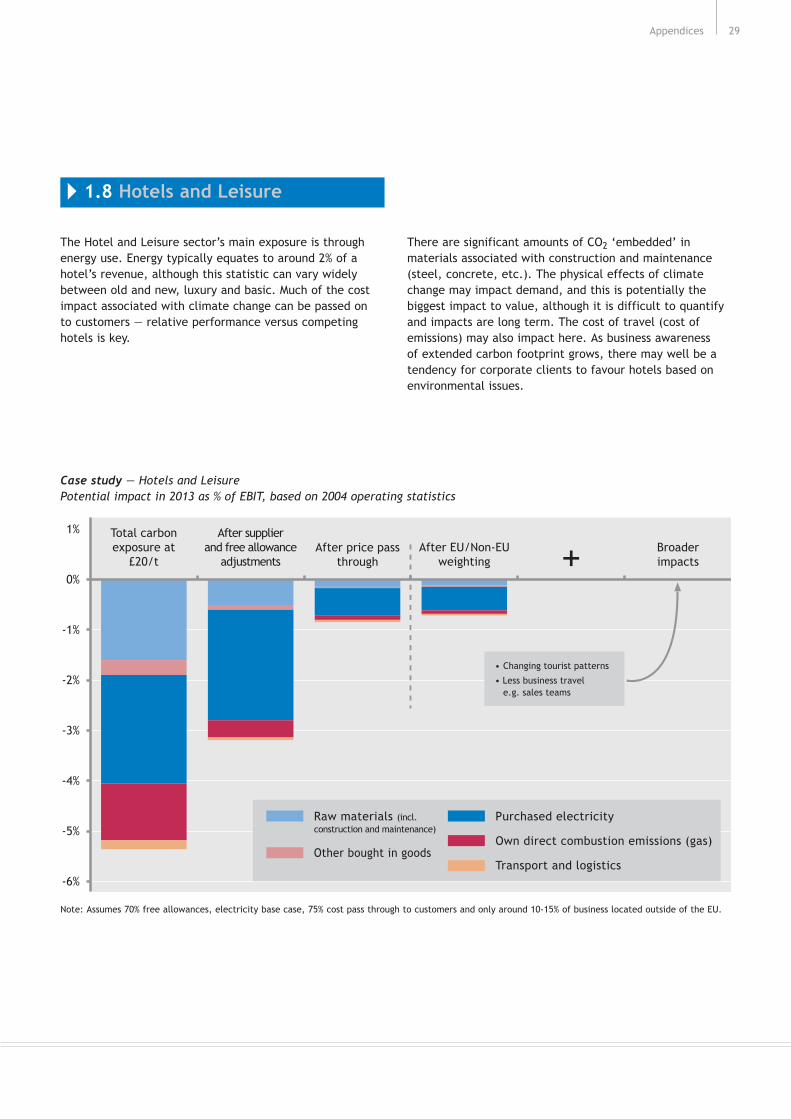
The Hotel and Leisure sector’s main exposure is throughenergy use. Energy typically equates to around 2% of ahotel’s revenue, although this statistic can vary widelybetween old and new, luxury and basic. Much of the costimpact associated with climate change can be passed on to customers — relative performance versus competinghotels is key.
There are significant amounts of CO2 ‘embedded’ inmaterials associated with construction and maintenance(steel, concrete, etc.). The physical effects of climatechange may impact demand, and this is potentially thebiggest impact to value, although it is difficult to quantifyand impacts are long term. The cost of travel (cost ofemissions) may also impact here. As business awareness of extended carbon footprint grows, there may well be atendency for corporate clients to favour hotels based onenvironmental issues.
Appendices 29
1.8 Hotels and Leisure
Case study — Hotels and LeisurePotential impact in 2013 as % of EBIT, based on 2004 operating statistics
1%
0%
-1%
-2%
-3%
-4%
-5%
-6%
Total carbon exposure at
£20/t
After supplierand free allowance
adjustmentsAfter price pass
throughAfter EU/Non-EU
weightingBroader impacts+
• Changing tourist patterns
• Less business travel e.g. sales teams
Purchased electricity
Own direct combustion emissions (gas)
Transport and logistics
Raw materials (incl. construction and maintenance)
Other bought in goods
Note: Assumes 70% free allowances, electricity base case, 75% cost pass through to customers and only around 10-15% of business located outside of the EU.
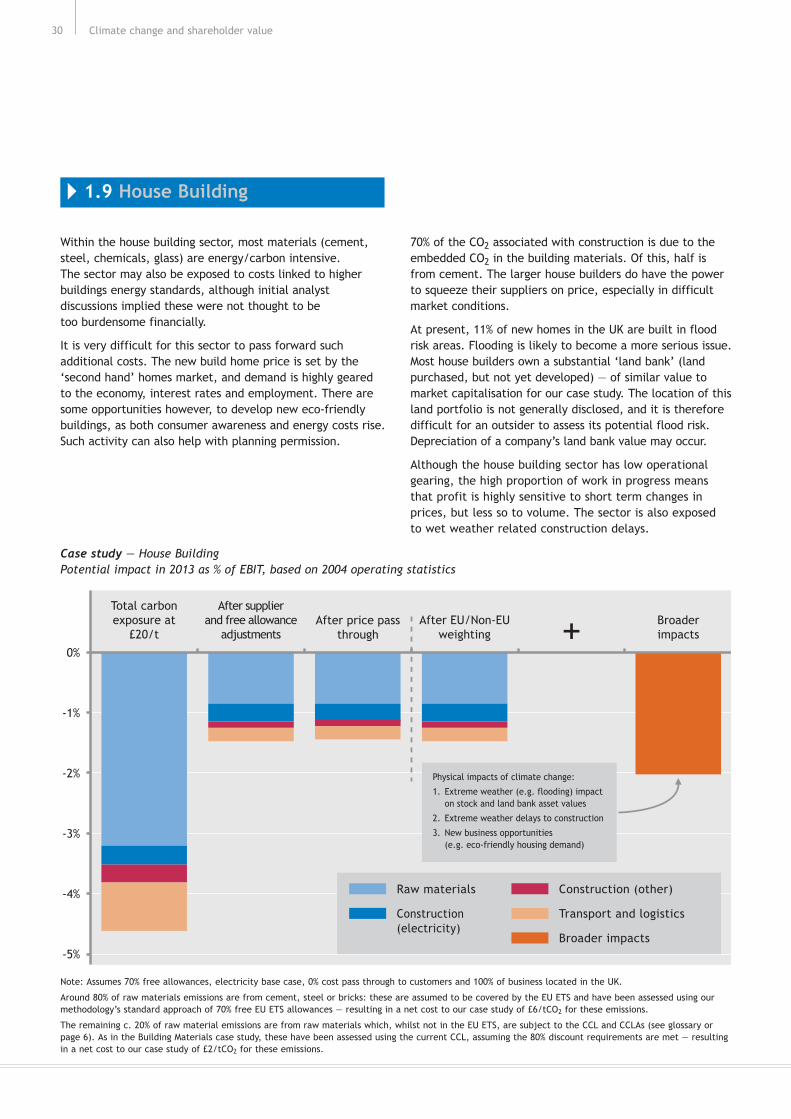
Within the house building sector, most materials (cement,steel, chemicals, glass) are energy/carbon intensive. The sector may also be exposed to costs linked to higherbuildings energy standards, although initial analystdiscussions implied these were not thought to be too burdensome financially.
It is very difficult for this sector to pass forward suchadditional costs. The new build home price is set by the‘second hand’ homes market, and demand is highly geared to the economy, interest rates and employment. There are some opportunities however, to develop new eco-friendlybuildings, as both consumer awareness and energy costs rise.Such activity can also help with planning permission.
70% of the CO2 associated with construction is due to theembedded CO2 in the building materials. Of this, half is from cement. The larger house builders do have the powerto squeeze their suppliers on price, especially in difficultmarket conditions.
At present, 11% of new homes in the UK are built in floodrisk areas. Flooding is likely to become a more serious issue.Most house builders own a substantial ‘land bank’ (landpurchased, but not yet developed) — of similar value tomarket capitalisation for our case study. The location of thisland portfolio is not generally disclosed, and it is thereforedifficult for an outsider to assess its potential flood risk.Depreciation of a company’s land bank value may occur.
Although the house building sector has low operationalgearing, the high proportion of work in progress means that profit is highly sensitive to short term changes inprices, but less so to volume. The sector is also exposed to wet weather related construction delays.
Climate change and shareholder value30
1.9 House Building
Case study — House BuildingPotential impact in 2013 as % of EBIT, based on 2004 operating statistics
0%
-1%
-2%
-3%
-4%
-5%
Total carbon exposure at
£20/t
After supplierand free allowance
adjustmentsAfter price pass
throughAfter EU/Non-EU
weightingBroader impacts+
Construction (other)
Transport and logistics
Broader impacts
Raw materials
Construction(electricity)
Physical impacts of climate change:
1. Extreme weather (e.g. flooding) impact on stock and land bank asset values
2. Extreme weather delays to construction
3. New business opportunities (e.g. eco-friendly housing demand)
Note: Assumes 70% free allowances, electricity base case, 0% cost pass through to customers and 100% of business located in the UK.
Around 80% of raw materials emissions are from cement, steel or bricks: these are assumed to be covered by the EU ETS and have been assessed using ourmethodology’s standard approach of 70% free EU ETS allowances — resulting in a net cost to our case study of £6/tCO2 for these emissions.
The remaining c. 20% of raw material emissions are from raw materials which, whilst not in the EU ETS, are subject to the CCL and CCLAs (see glossary orpage 6). As in the Building Materials case study, these have been assessed using the current CCL, assuming the 80% discount requirements are met — resultingin a net cost to our case study of £2/tCO2 for these emissions.

The water industry in England and Wales is a regulatedindustry, overseen by the water regulator, Ofwat. Giventhe current regulatory framework, we have assumed thatadditional costs linked to energy/carbon use will be passedthrough directly to consumers.
It is widely acknowledged that the water sector will need to invest in infrastructure to cope with the forecastextreme events (primarily flooding and drought). Due tothe regulatory mechanism, an increase in agreed annualcapex will allow higher prices to be charged — resulting in a small positive uplift to EBIT.
Appendices 31
1.10 Water Utility
Case study — Water Utility Potential impact in 2013 as % of EBIT, based on 2004 operating statistics
3%
2%
1%
0%
-1%
-2%
-3%
-4%
Total carbon exposure at
£20/t
After supplierand free allowance
adjustmentsAfter price pass
throughAfter EU/Non-EU
weighting
Broader impacts
+
Own direct combustion emissions
Transport and logistics
Broader impacts
Raw materials
Purchased electricity
Revenue uplift allowed, due to increased investment requirements (at OFWAT cost of capital)
N20
CH4
Note: Assumes 70% free allowances, electricity base case, 100% cost pass through to customers and 100% of business located in the UK.

The EU Emissions Trading Scheme (EU ETS) is a ‘cap and trade’ scheme regulating industrial carbon dioxideemissions in the (now enlarged) European Union. PhaseOne of the scheme runs from 1st January 2005 to 31stDecember 2007. Phase Two runs from 1st January 2008 to 31st December 2012, coinciding with the KyotoProtocol’s commitment period.
Around half of EU carbon dioxide emissions are covered by the scheme.
National Allocation Plans
Each country produces a National Allocation Plan (NAP) in advance for each Phase of the scheme. Each country’sNAP outlines the total number of emissions allowances thatwill be allocated, and allocates these amongst the variousinstallations (individual operating sites) within that country’sjurisdiction.
The allowances are currently being allocated for free;however, clearly they have a value, represented by thetrading price for carbon. For this reason, the allocationmechanism has been subject to much lobbying and debate.
The NAPs must be approved by the European Commissionfor consistency. Each installation is allocated a set numberof emission allowances to cover its operations. If it holdsinsufficient allowances to cover its emissions it is able topurchase additional allowances from other installations inthe trading scheme. If it holds an excess of allowances it is able to sell these to other parties. At the centre of thescheme is a desire to achieve the EU’s greenhouse gastarget at the minimum cost.
The NAPs must keep a proportion of allowances to one side for use by new entrants.
End of year reconciliation
At the end of each year, each site must surrender sufficientallowances to cover its CO2 emissions for that year. Thesesurrendered allowances are then cancelled. If a site isunable to surrender sufficient allowances, it is penalised at a cost of €40/t in the first phase, rising to €100/t inthe second phase. In addition, the amount of the deficit in allowances is carried over to the following year.
Unused allowances can be carried forward within a Phase,but no such ‘banking’ is permitted between Phase One and Phase Two.
Climate change and shareholder value32
Appendix 2 The EU Emissions Trading Scheme overview
EU marginal abatement curve
Cost
orpr
ice
£/tC
0 2eq
… this will be the carbon
price (theory)
‘Harder’
Gas/coal switching
‘Easy wins’ If demand forcarbon is here …
Carbon reduction, below business as usual tCO2eq

Sectors covered
The scheme currently covers a range of named sectors as outlined in the table below. These include all thermalcombustion installations above a 20MW threshold capacity.The scheme is expected to be expanded in the future, to include other gases and industries (including aviation),and potentially link into other geographic trading schemes.
The EU ETS and similar trading schemes represent just partof the ‘flexible mechanisms’ permitted under the KyotoProtocol. Other flexible mechanisms include CDM (CleanDevelopment Mechanism) and JI (Joint Implementation),which both enable a company or country to receive emissioncredits for an investment in a greenhouse gas reducingproject in another country (the ‘host country’). The processis defined as Joint Implementation when the host countryis a developed world country with an emissions target ofits own. Projects in developing countries, with no targets,are covered under the Clean Development Mechanism.
Carbon price — theory
The diagram opposite outlines the simple theory behindhow the carbon price is set. Each phase of the EU ETS (e.g. Phase One 2005-2007) can be viewed as a ringfencedsupply/demand balance. Assuming there is a shortage ofcarbon allowances in the market, the trading price for‘carbon’ is set by the marginal abatement cost.
The trading scheme encourages emission reductions to takeplace where most cost effective. A site which could cheaplyreduce emissions (‘Easy wins’), or even do so at zero cost,can make this reduction, and sell its resulting unusedallowances through the trading scheme. Another site,which only had more expensive (‘Harder’) emissionreduction opportunities, could purchase these allowancesat a price below its own cost of emissions reduction.
If it is assumed that all the most cost effective reductions(‘Easy wins’) are made, the theoretical carbon tradingprice can be derived from the ‘marginal abatement costcurve’ as illustrated in blue.
‘Easy wins’ typically cover cost effective energy efficientmeasures. The next — large — potential carbon saving interms of cost effectiveness typically comes from switchingbetween gas-fired and coal-fired thermal electricitygeneration in the European power sector. As explained onpage 11, gas-fired electricity generation emits significantlyless CO2 per MWh than coal-fired electricity generation. If further reductions are needed, over and above thoseachieved through ‘Easy wins’ and ‘Gas/coal switching’,these are typically more costly (‘Harder’) productionupgrades, requiring a much higher carbon price to makethem cost effective.
Appendices 33
Sectors covered by the EU ETS — Phase One
Energy activities Combustion installations (above 20MW threshold capacity)Oil refineriesCoke ovens
Ferrous metals Iron and steel production
Mineral industries Glass manufactureCement clinker and lime productionBrick and tile manufacturingCeramic products
Other activities PulpPaper

The sensitivity to key issues is summarised below for two of the case studies.
For Industrial Gases, the biggest uncertainty appears to be the extent to which the company will be exposed to higher electricity prices, and how much can these be passed on to customers.
For Building Materials, the largest uncertainty appears to be its allocation of free allowances, and the extent to which suppliers (of bulk aggregates) will pass on any of their raw material costs.
Climate change and shareholder value34
Appendix 3 Example sensitivity analyses
Scenario % of EBIT
Base Case 4.4
Allowances 60-80% (Base case 70%) 4.2-4.7
Price pass through 70-90% (Base case 80%) 2.2-6.7
Electricity 1. Electricity sector profit neutral 1.82. Pass through at 50% of marginal coal price 4.43. Pass through at 75% of marginal coal price 6.3
Scenario % of EBIT
Base Case 8.5
Allowances 60-80% (Base case 70%) 6.4-10.7
Price pass through 40-60% (Base case 50%) 6.8-10.3
Electricity 1. Electricity sector profit neutral 7.42. Pass through at 50% of marginal coal price 8.53. Pass through at 75% of marginal coal price 9.4
Suppliers Only half of Raw Material carbon costs 6.3incurred passed through to company (assumed unlikely)
Example 1 Industrial Gases
Example 2 Building Materials

Appendices 35
Appendix 4 Glossary of terms
Capex Capital investment expenditure.
Carbon dioxide (CO2) Carbon dioxide accounts for around 80% of the developed world greenhouse gas impact, andaround 60% of the impact globally. It is heavily linked to energy consumption, being releasedwherever fossil fuels are burnt, whether in industry, power stations, domestic households orvehicle exhausts.
Carbon dioxide Different greenhouse gases have different climate change impact per tonne of gas. For ease equivalent (CO2e) of analysis, these are often converted into ‘CO2 equivalent’. For example, 1 tonne of methane
is equivalent to 23 tonnes of CO2, or 23 tonnes CO2e.
Carbon emissions A shorthand term to describe carbon dioxide emissions. Linked terms include high-carbonand low-carbon, to describe processes and products that involve particularly high or lowlevels of carbon dioxide emissions.
When discussing the EU Emissions Trading Scheme, the term ‘carbon emissions’ is oftenshortened still further to ‘emissions’.
Carbon emissions A measure of how exposed the company’s operations are to carbon emissions, including its exposure, or exposure to carbon emissions elsewhere in its supply chain. Costed at £20/tCO2, this gives emissions exposure the first column in each of the graphs.
Linked terms include cost exposure (after adjustments have been made for supplier passthrough and free allowances) and profit exposure (after the potential for passing pricesthrough to customers has also been taken into account).
Carbon price The cost of an emission allowance covering one tonne of CO2. The current EU ETS carbon price is around €27/tCO2, as at mid-February 2006. For the 2013 analysis, we have used aprice of £20/tCO2 (see page 11).
Case study The analysis published focuses on ten case study companies.
Ten ‘case study companies’ have been studied, from a range of sectors. In some cases, the ‘case study company’ analysed is strictly linked to a single company within that sector. In others, just a single corporate division has been reviewed, and in others yet again,characteristics from several companies have been combined, to produce a more representative example.
Clean Development A mechanism under which companies and governments can meet part of their Kyoto Mechanism (CDM) commitment through investing in greenhouse gas emission reductions in the developing world.
Emission credits generated from CDM investments can be used on the EU ETS, alongside other emission allowances.
Climate change Climate change is caused by emissions of greenhouse gases into the atmosphere —concentrations of which have been increasing since the start of the industrial revolution.Weather changes include warming, changes in precipitation patterns and an increasingfrequency of extreme events.
Climate Change A tax on industrial energy use in the UK (see page 6).Levy (CCL)
Climate Change Levy Agreed energy efficiency improvement targets (agreed either by individual companies or on Agreements (CCLAs) a sector basis) that offer an 80% reduction in the CCL, provided they are met (see page 6).
Direct/indirect Carbon dioxide emissions linked to energy use. Direct energy-linked emissions arise from energy emissions the company’s own combustion of fuel on site. Indirect energy-linked emissions arise from
the company’s electricity use. Indirect energy emissions are often called electricity-linked emissions.
EBIT Earnings before interest and tax, a commonly used measure of profit.

Climate change and shareholder value36
EU-15 The fifteen EU Member States at the time the Kyoto Protocol was agreed. The EU-15 was given a single Kyoto target of an ‘8% reduction in ‘CO2 equivalent’ versus 1990 levels’, whichwas allocated out through the Burden Sharing Agreement. Within this, the UK’s target is a12.5% reduction.
EU European Climate A broad range of measures to meet greenhouse gas reduction targets in the EU (see page 6).Change Programme (ECCP)
EU Emissions A ‘cap and trade’ scheme to regulate industrial carbon dioxide emissions in the European Trading Scheme Union (EU). The scheme began on 1st January 2005. Further details can be found on (EU ETS) pages 6-7, and in Appendix 2.
Emission allowances At the end of each calendar year, each site regulated by the EU ETS must submit sufficient(industrial carbon dioxide) emission allowances to cover its verified emissions for that year.These can either be the ‘free allowances’ allocated to that site under its host country’sNational Allocation Plan, or further allowances purchased from other participants under the EU ETS.
Free emission The (industrial carbon dioxide) emission allowances allocated for free to each site under, allowances, or its host country’s National Allocation Plan. Through allocating such allowances with a small free allowances shortfall, the EU ETS encourages a reduction in greenhouse gases to take place, in whichever
sites have the lowest cost abatement opportunities (see page 6 and Appendix 2).
Greenhouse gas The category of gases responsible for climate change. Carbon Dioxide (CO2) is the largestcontributor, responsible for 80% of the greenhouse gas impact. Other greenhouse gases include methane (CH4), nitrous oxide (N2O), sulphur hexafluoride (SF6), together with variousHFCs and CFCs.
Kyoto Protocol A UN governed, legally binding international treaty restricting developed world (excluding the USA and Australia) greenhouse gas emissions from 2008-2012. Further details can be found on page 6.
Kyoto compliance The five year period covering 2008-2012. This is the same time period as Phase Two of the period EU Emissions Trading Scheme.
Post-Kyoto A generic description to describe 2013 and beyond. International emissions targets andregulatory details for this time period are not yet known, but are expected to involve tighterconstraints and broadening coverage. Longer term, greenhouse gas emission reductions of around 50-60% from 1990 levels are thought necessary. Discussions on this have already begun. High priority is being placed on engaging with countries not currently regulated by the Kyoto Protocol, particularly the USA, India and China.
National Allocation The plan detailing each EU Member State’s allocation of Free Allowances within the EU Plan Emissions Trading Scheme (see page 6 and Appendix 2).
Non-CO2 A term to describe the greenhouse gases apart from carbon dioxide. These are not included greenhouse gas within the EU Emissions Trading Scheme (which only covers energy-linked CO2), although
they are included — on a CO2e basis — within the Kyoto Protocol, and can qualify for CDM investments.
Phase One Phase One of the EU Emissions Trading Scheme, covers the three years 2005-2007.
Phase Two Phase Two of the EU Emissions Trading Scheme, covers the five years 2008-2012.
Renewables Obligation An obligation on UK electricity suppliers to supply an increasing proportion of their electricityfrom renewable sources. Part of the UK climate change programme.

The Carbon Trust
The Carbon Trust is an independent, not for profit company, set up in2001 by the UK Government to take the lead on low carbon technologyand innovation within the public and private sector in the UK. It isfunded by the Department for Environment, Food and Rural Affairs, the Scottish Executive, the Welsh Assembly Government and InvestNorthern Ireland. Full information on the organisation’s activities canbe found on the Carbon Trust website: www.thecarbontrust.co.uk.
The Carbon Trust engages directly with UK companies in a number of ways, including through its Carbon Management service. This offerswide support on energy efficiency and other low carbon issues, andenables companies to take a broad view of the implications of climatechange on their activities.
In addition to its work with UK companies, the Carbon Trust alsoengages with the financial community, through its Investor Engagementprogramme. The company has also produced a wide variety ofpublications which are available online, free of charge. For furtherinformation, please visit www.thecarbontrust.co.uk/investors, orcontact Emma Johnson and the Investor Engagement team [email protected].
Cairneagle Associates
Cairneagle Associates is a strategic management consultancy thatprovides top level support to major corporations, financial institutionsand ambitious entrepreneurs. Its core expertise is in providing support for complex decision-making where the consultancy offers powerfulanalytics, practical experience and bespoke solutions via small teams of senior advisors. For more details see www.cairneagle.com or contactDavid Sanders at [email protected].
www.thecarbontrust.co.uk0800 085 2005
The Carbon Trust is an independent company set up by the Government to help the UK meet its climate changeobligations through business-focused solutions to carbon emission reduction. The Carbon Trust is grant funded by Defra, the Scottish Executive, the Welsh Assembly Government and Invest Northern Ireland.
The Carbon Trust works with business and the public sector to cut carbon emissions and capture the commercialpotential of low carbon technologies.
This information is being made available to you as part of the Carbon Trust’s general activity of promotingdeployment of, and investment in, low carbon technology.
The quantitative analysis in this Report is drawn from work carried out for the Carbon Trust by CairneagleAssociates during 2005. It has been based on public information sources only.
Whilst reasonable steps have been taken to ensure that the information contained in this Report is correct,neither the Carbon Trust nor Cairneagle Associates give any warranty or make any representation as to itsaccuracy, nor do they accept any liability for any errors or omissions or for any loss arising from reliance on it.The publication of this Report should not be taken as implying any endorsement by the Carbon Trust of any of the assumptions made in this Report’s analysis.
Neither the Carbon Trust nor Cairneagle Associates are giving investment advice in this document, and you musttake your own view on the merits of, and the risks attached to, any investment decision you may undertake.You may wish to obtain professional advice.
The content of this document (with the exception of that information accredited to third party sources other thanthe Carbon Trust or Cairneagle Associates) is the copyright of the Carbon Trust. Reproduction is permitted only onthe following terms. All or any part of the contents may be copied or downloaded to a hard disk for personal use.The supply of any copy to third parties is also permitted provided that the Carbon Trust is acknowledged as thesource of the material on the copy, it is not supplied as part of another work or publication, and it is not supplieddirectly in return for commercial gain. The supply of any copy to a third party is conditional upon their being madeaware of the fact that the terms of this disclaimer and copyright statement apply equally to them.
The Carbon Trust is a company limited by guarantee. Registered in England and Wales Number 4190230.Registered at: 8th Floor, 3 Clement’s Inn, London WC2A 2AZ.
This brochure has been printed using recycled paper.
Published March 2006.
© The Carbon Trust 2006. All rights reserved. CTC602