HUMANITY & THE WORLD BIOMES Unit 2-1a Understanding Terrestrial Biomes.
Upload
wilfred-lyonsCategory
view
216download
2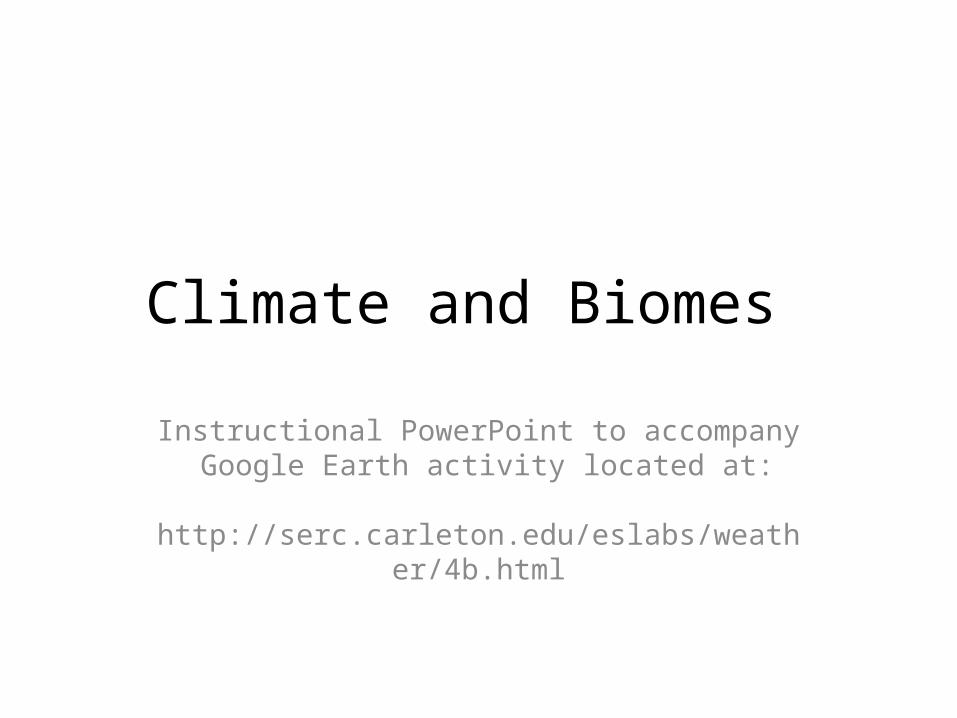
Climate and Biomes
Instructional PowerPoint to accompany Google Earth activity located at:
http://serc.carleton.edu/eslabs/weather/4b.html

Teaching Instructions:
This PowerPoint is designed to be used as a supplement to the Google Earth activity described on this page: http://serc.carleton.edu/eslabs/weather/4b.html Pre-lab Preparation: 1. Print the PowerPoint 2 slides per page, preferably in color. If possible, laminate the
cards for longevity. Prepare enough sets of cards for each of the lab teams.2. Print the a copy of the Whittaker classification scheme diagram for each lab team. 3. Optional: Provide a world map or globe for each lab team. Calculators may also be
helpful for calculating average annual precipitation and temperature.
Day of Activity: Students read the information on the cards and then sort the cards into stacks matching them to the Whittaker classification scheme.
When teams are finished sorting the cards, share the PowerPoint with the class. Discuss their answers, and compare with the Biome Type information given in the PPT (notes).
Alternately, have the students fill in a chart with the following information: name of the city; average precipitation and temperature; and biome type. Collect and grade the charts.
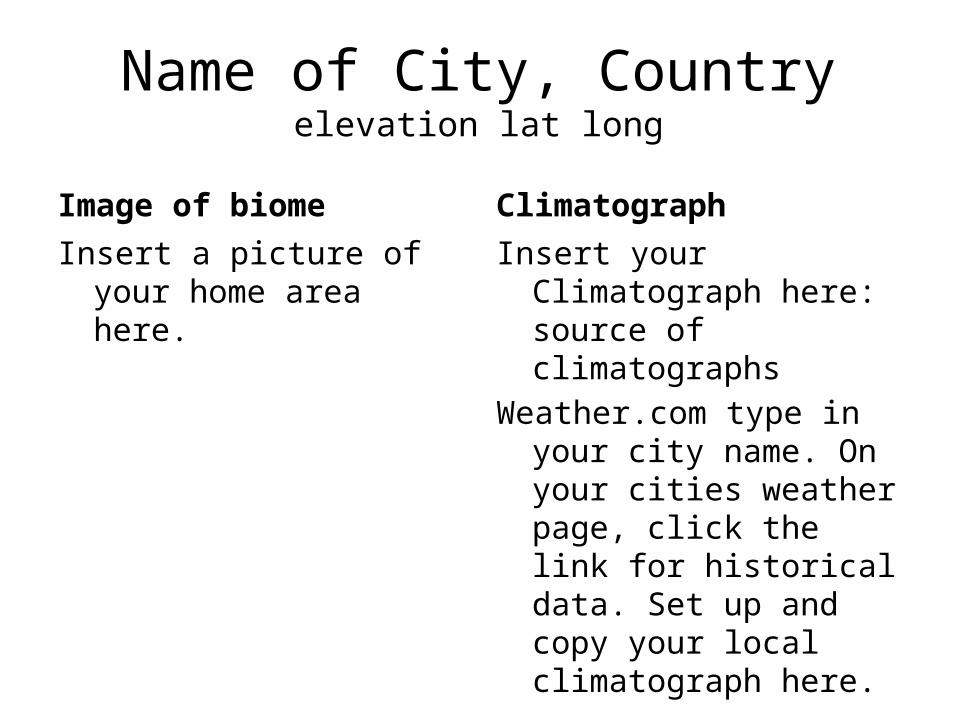
Name of City, Countryelevation lat long
Image of biomeInsert a picture of your home
area here.
ClimatographInsert your Climatograph here:
source of climatographsWeather.com type in your city
name. On your cities weather page, click the link for historical data. Set up and copy your local climatograph here.

Sample biome worksheet chart


Acapulco, MexicoElev: 3 m Lat: 16 ° 50' N Long: 99 ° 56'W
Image of biome Climatograph

Addis Ababa, EthiopiaElev: 2450m Lat: 09 ˚ 20' N Long:38 ˚ 45' E
Image of biome Climatograph
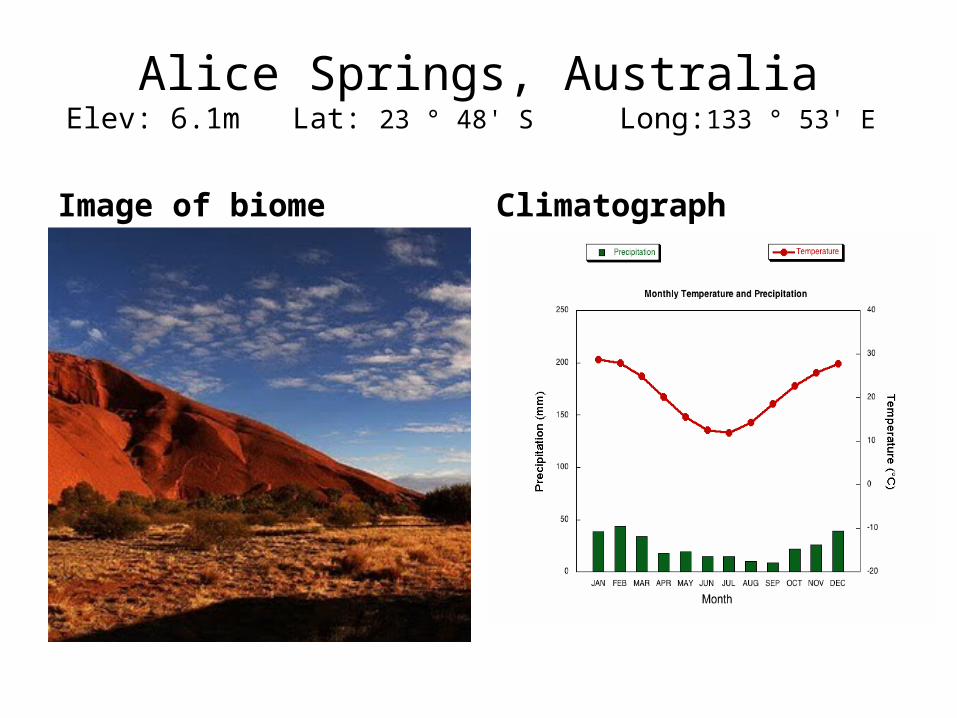
Alice Springs, AustraliaElev: 6.1m Lat: 23 ° 48' S Long:133 ° 53' E
Image of biome Climatograph

Anchorage, AK (USA)Elev: 34.7 m Lat:61° 11'N Long:150° 00'W
Image of biome Climatograph
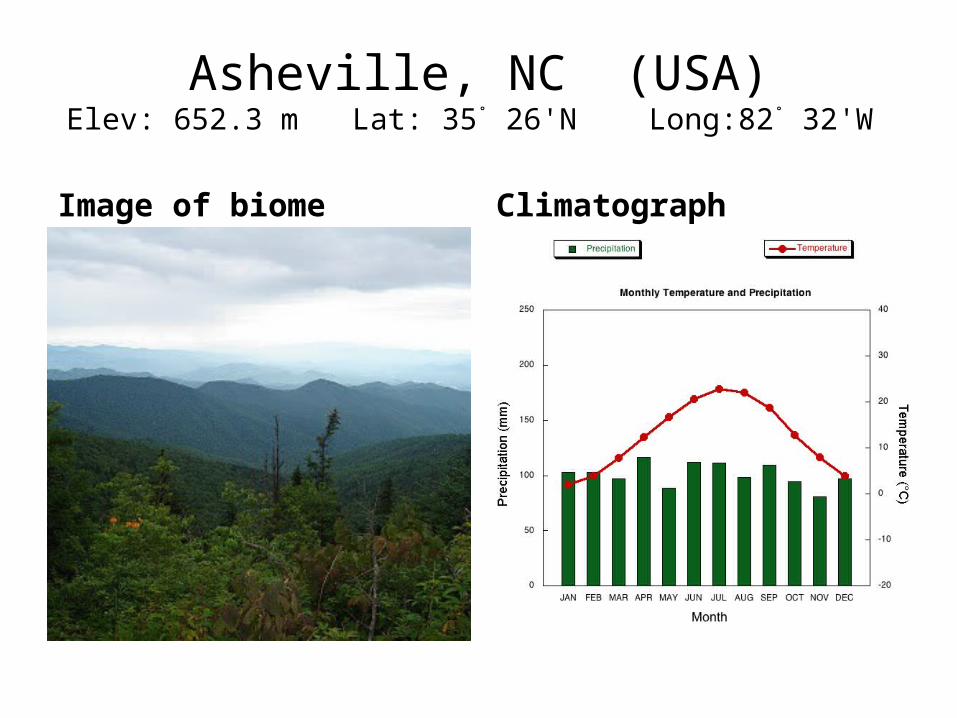
Asheville, NC (USA)Elev: 652.3 m Lat: 35˚ 26'N Long:82˚ 32'W
Image of biome Climatograph
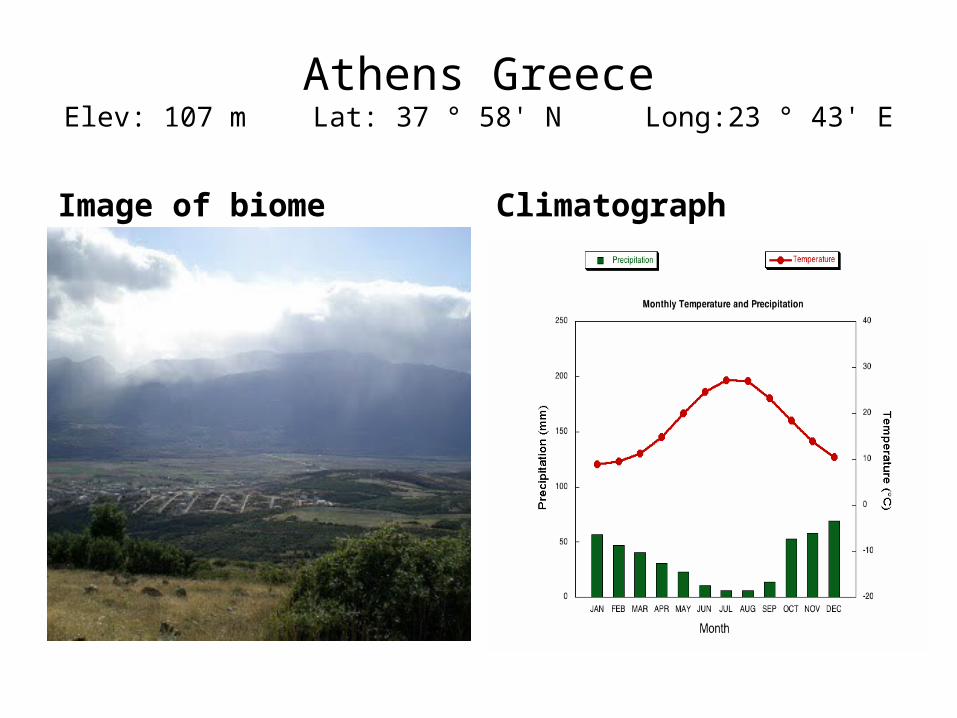
Athens GreeceElev: 107 m Lat: 37 ° 58' N Long:23 ° 43' E
Image of biome Climatograph

Atlanta, GA (USA)Elev: 307.8 m Lat: 33˚ 38'N Long:84˚ 26'W
Image of biome Climatograph
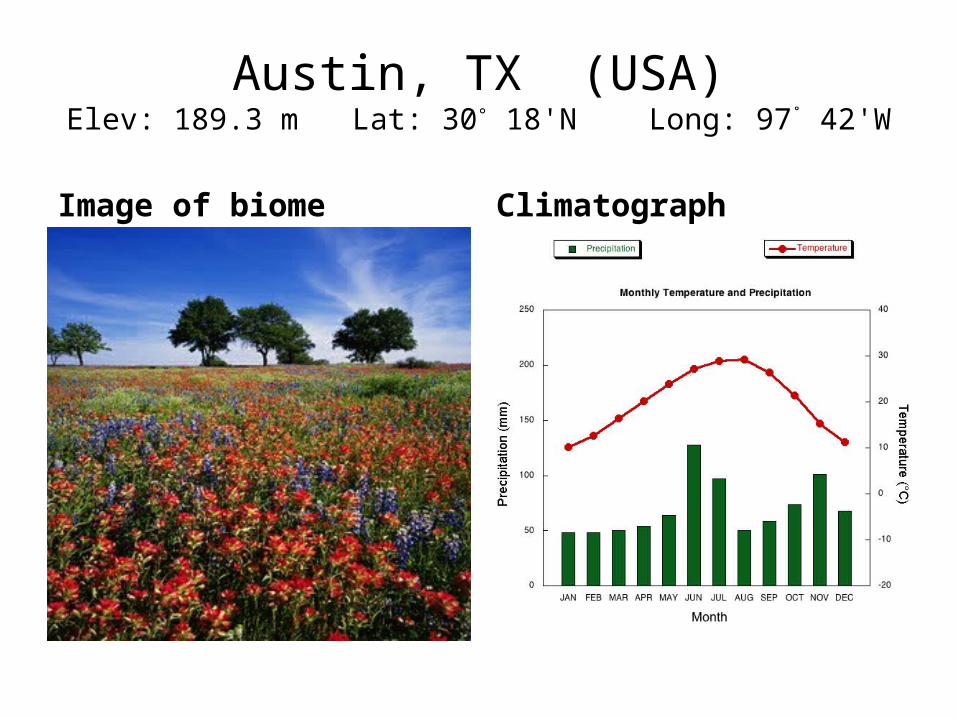
Austin, TX (USA)Elev: 189.3 m Lat: 30° 18'N Long: 97˚ 42'W
Image of biome Climatograph

Baltimore, Maryland, (USA)Elev: 45.1 m Lat: 39o 10'N Long: 76o 41'W
Image of biome Climatograph

Bangkok , Thailand Elev: 16.2 m Lat: 13 ° 44' N Long: 100 ° 30' E
Image of biome Climatograph
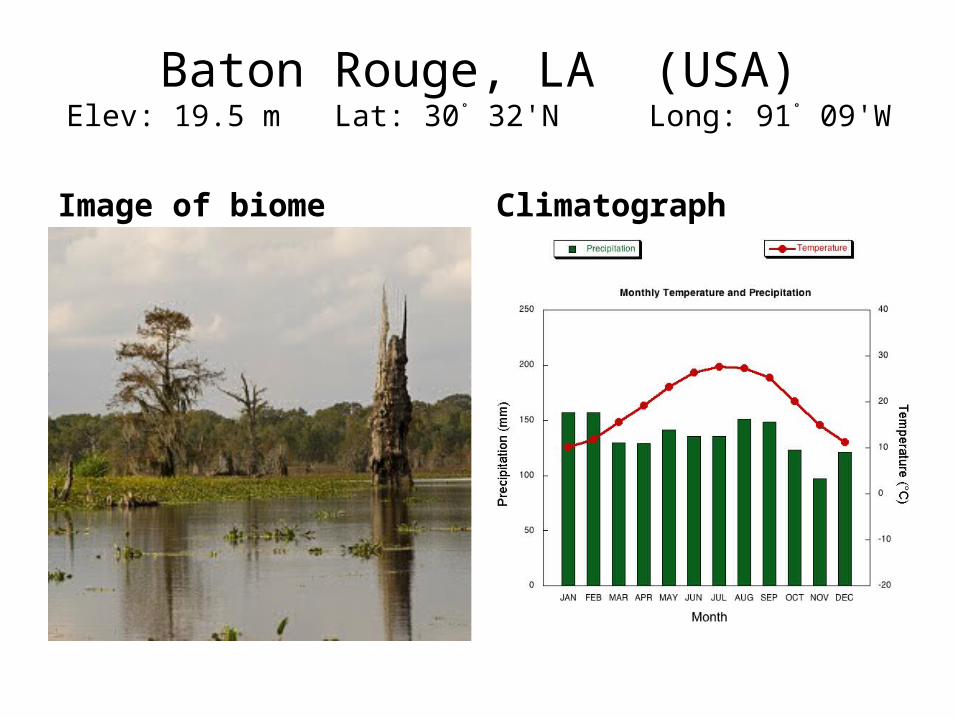
Baton Rouge, LA (USA)Elev: 19.5 m Lat: 30˚ 32'N Long: 91˚ 09'W
Image of biome Climatograph

Belem, Brazil Elev: 12.8 m Lat: 01 ° 27' S Long: 48 ° 29'W
Image of biome Climatograph

Bismark, ND (USA) Elev: 503.2 m Lat: 46˚ 47'N Long: 100˚ 45'W
Image of biome Climatograph

Boston, MA (USA)Elev: 6.1 m Lat: 42˚ 22'N Long: 71˚ 01'W
Image of biome Climatograph
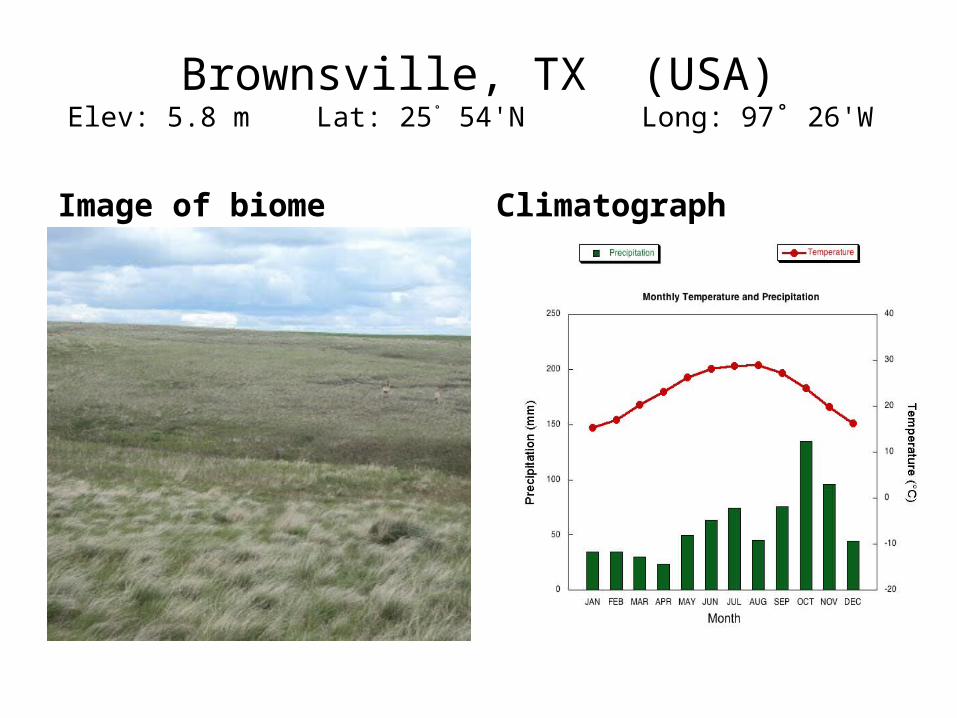
Brownsville, TX (USA)Elev: 5.8 m Lat: 25˚ 54'N Long: 97˚ 26'W
Image of biome Climatograph

Buffalo, New York (USA)Elev: 214.9 m Lat: 42o 56'N Long: 78o 44'W
Image of biome Climatograph

Burlington, VT (USA)Elev: 100.6 m Lat: 44˚ 28'N Long: 73˚ 09'W
Image of biome Climatograph

Cairo, EygptElev: 116.1 m Lat: 29 ˚ 52' N Long: 31 ˚ 20' E
Image of biome Climatograph

Calgary, Alberta (Canada)Elev: 1079 m Lat: 51° 06' N Long: 114° 01'W
Image of biome Climatograph

Caribou, ME (USA)Elev: 109.2 m Lat: 46° 52'N Long: 68° 02'W
Image of biome Climatograph

Charleston, SC (USA)Elev: 12.2 m Lat: 32° 54'N Long: 80˚ 02'W
Image of biome Climatograph

Christchurch, New ZealandElev: 36 m Lat: 43 ° 29' S Long: 172 ° 36' E
Image of biome Climatograph
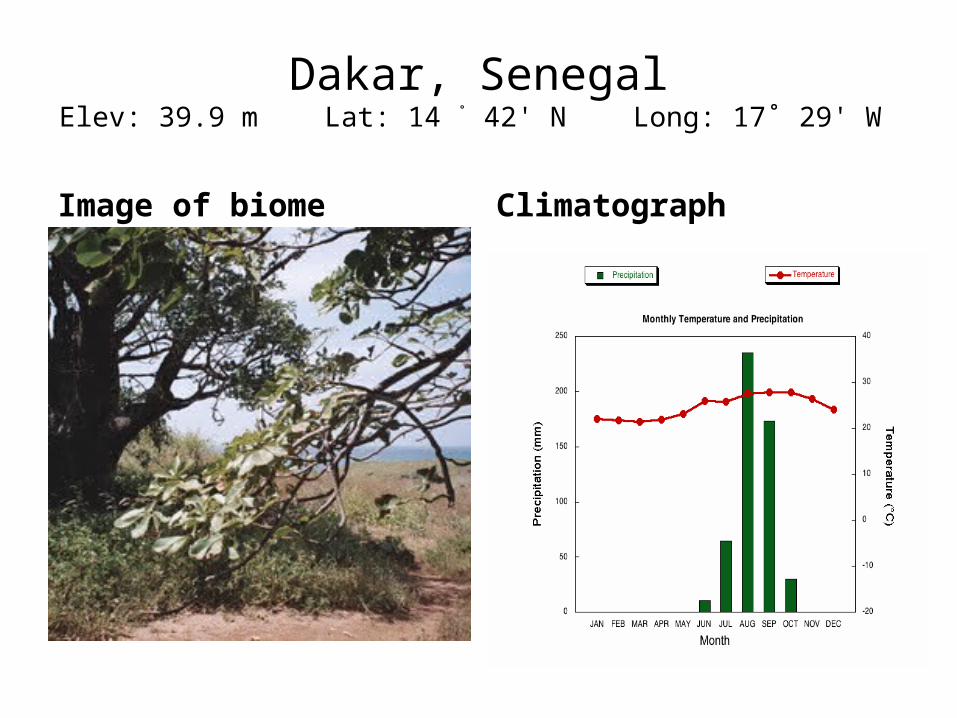
Dakar, SenegalElev: 39.9 m Lat: 14 ˚ 42' N Long: 17˚ 29' W
Image of biome Climatograph
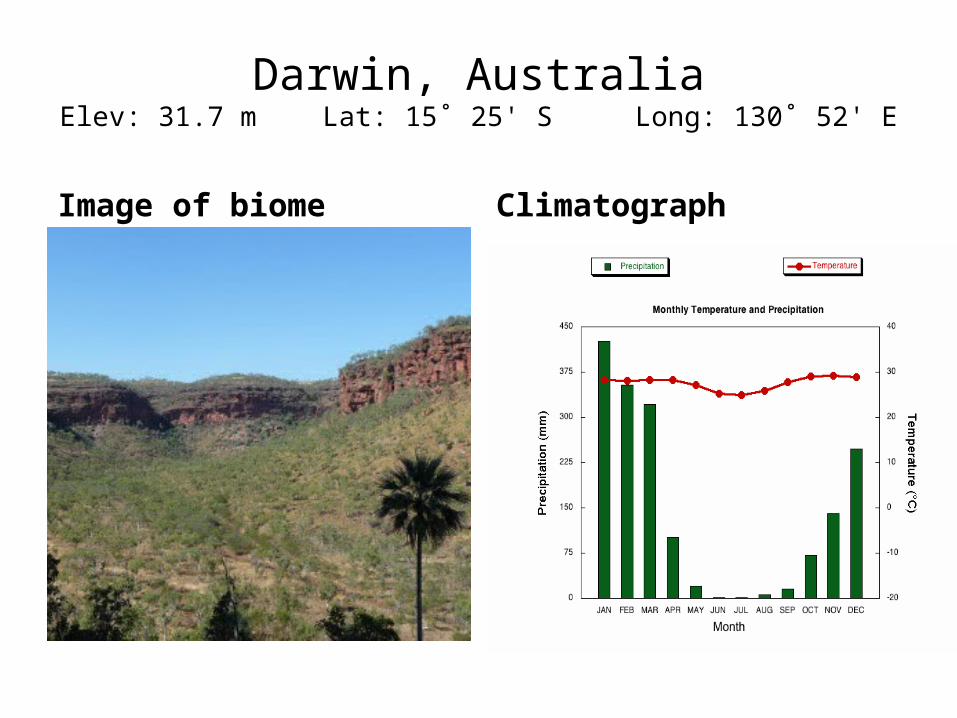
Darwin, AustraliaElev: 31.7 m Lat: 15˚ 25' S Long: 130˚ 52' E
Image of biome Climatograph

Denver, CO (USA)Elev: 1611.2 m Lat: 39° 46'N Long: 104˚ 52'W
Image of biome Climatograph

Des Moines, IA (USA)Elev: 291.7 m Lat: 41˚ 32'N Long: 93˚ 40'W
Image of biome Climatograph

Fairbanks, AK (USA)Elev: 141.1 m Lat: 64˚ 49'N Long: 147˚ 51'W
Image of biome Climatograph

Fresno, CA (USA)Elev: 101.5 m Lat: 36° 47'N Long: 119° 43'W
Image of biome Climatograph

Green Bay, WI (USA)Elev: 209.7 m Lat: 44˚ 29'N Long: 88˚ 08'W
Image of biome Climatograph

Hilo, HI (USA)Elev: 9.1 m Lat: 19˚ 43'N Long: 155˚ 04'W
Image of biome Climatograph
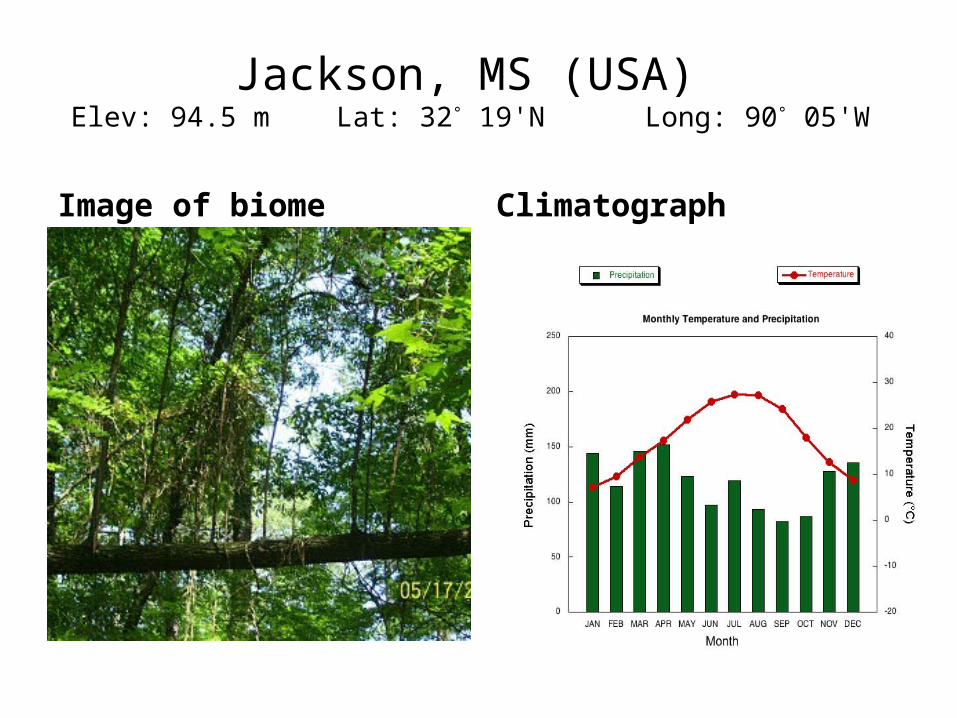
Jackson, MS (USA) Elev: 94.5 m Lat: 32° 19'N Long: 90° 05'W
Image of biome Climatograph

Lubbock, TX (USA)Elev: 991.8 m Lat: 33˚ 39'N Long: 101˚ 49'W
Image of biome Climatograph
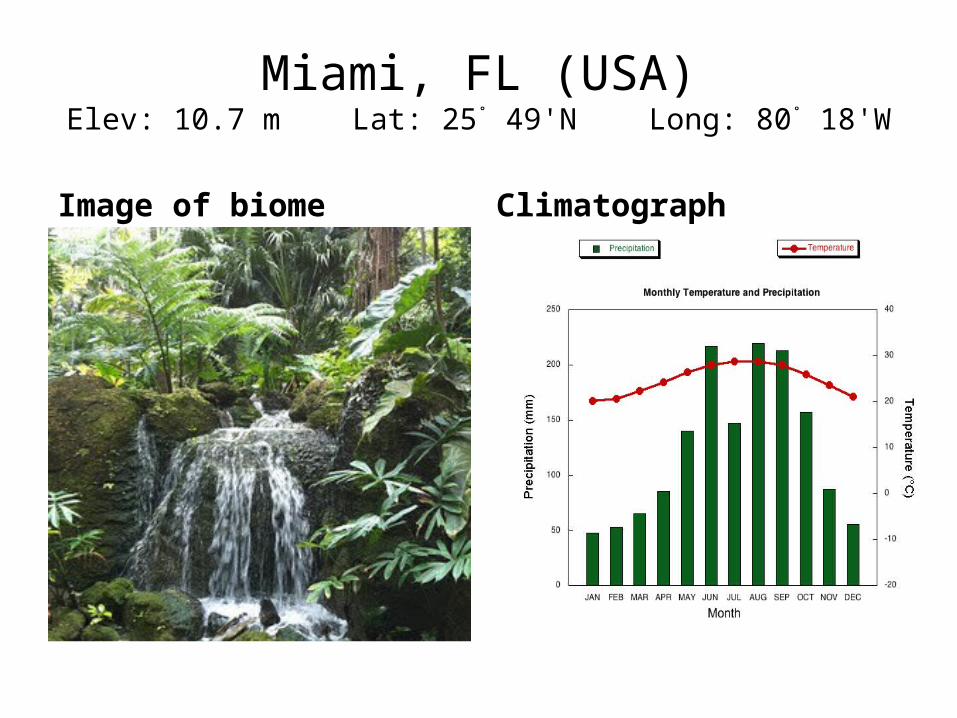
Miami, FL (USA)Elev: 10.7 m Lat: 25˚ 49'N Long: 80˚ 18'W
Image of biome Climatograph
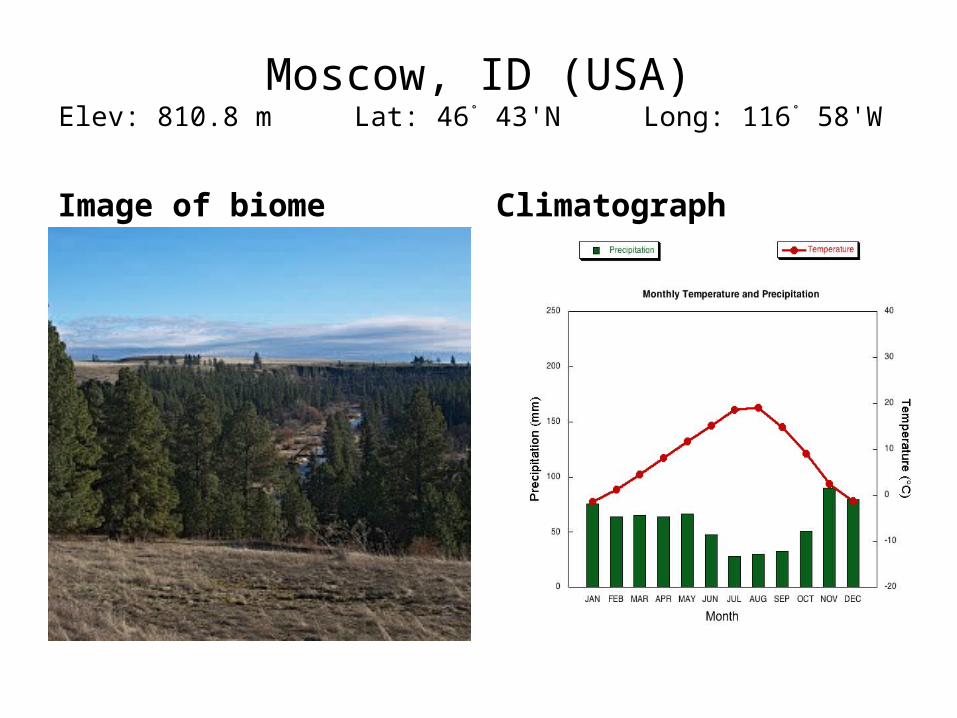
Moscow, ID (USA)Elev: 810.8 m Lat: 46˚ 43'N Long: 116˚ 58'W
Image of biome Climatograph

Omsk, RussiaElev: 85 m Lat: 54˚ 58' N Long: 73˚ 20' E
Image of biome Climatograph

Phoenix, AZ (USA)Elev: 337.4 m Lat: 33° 26'N Long: 112˚ 00'W
Image of biome Climatograph

Portland, OR (USA)Elev: 13.7 m Lat: 43° 39'N Long: 70° 18'W
Image of biome Climatograph
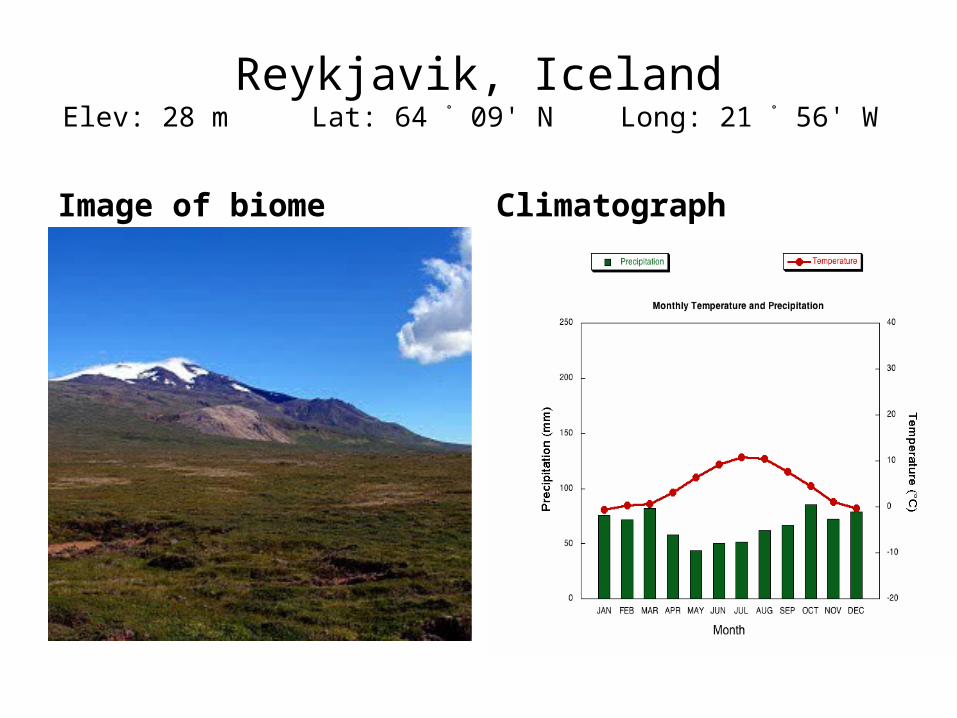
Reykjavik, IcelandElev: 28 m Lat: 64 ˚ 09' N Long: 21 ˚ 56' W
Image of biome Climatograph

Salt Lake City, UT (USA)Elev: 1287.8 m Lat: 40˚ 47'N Long: 111˚ 58'W
Image of biome Climatograph

San Diego, CA (USA)Elev: 4.0 m Lat: 32˚ 44'N Long:117˚ 10'W
Image of biome Climatograph

Santiago, ChileElev: 520 m Lat: 33˚ 27' S Long: 70˚ 42'W
Image of biome Climatograph

Saskatoon, CanadaElev: 515.1 m Lat: 52˚ 08' N Long: 106˚ 38'W
Image of biome Climatograph
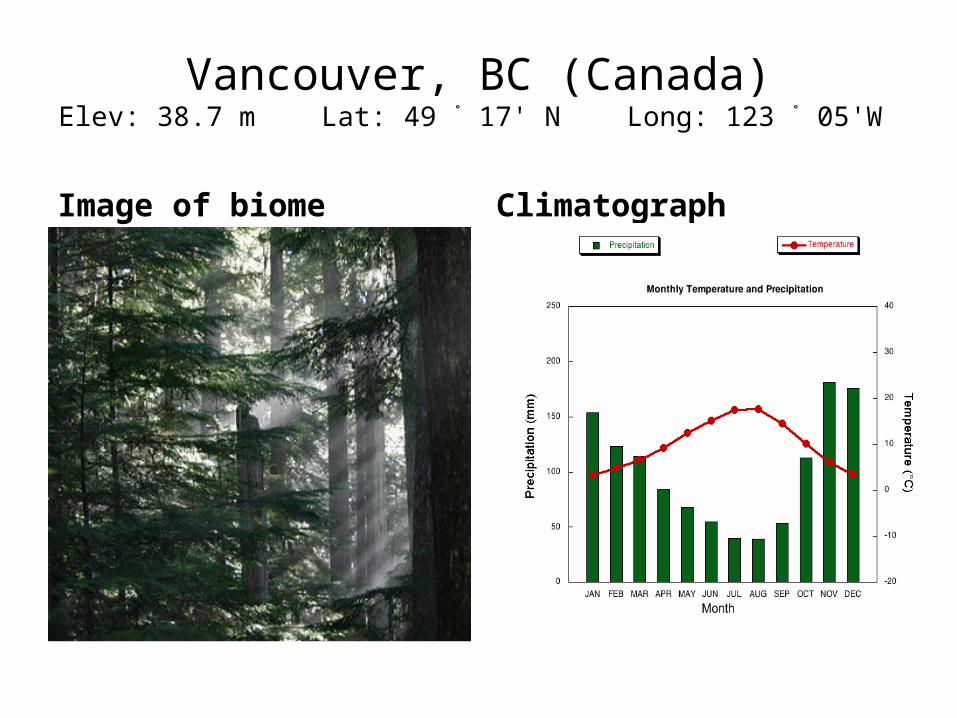
Vancouver, BC (Canada)Elev: 38.7 m Lat: 49 ˚ 17' N Long: 123 ˚ 05'W
Image of biome Climatograph