The Transition toward a Carbon Constrained Economy: The EPA Approach

1
CLIMACT - ACTING FOR THE TRANSITION TO A LOW CARBON ECONOMY IN
SCHOOLS – DEVELOPMENT OF SUPPORT TOOLS
KPI Performance Indicators
June 2017

2
CONTENTS
Executive Summary ............................................................................................................. 3
1 Introduction ................................................................................................................. 4
1.1 Introduction ..................................................................................................................................... 5
2 KPI List ......................................................................................................................... 6
2.1 Energy .............................................................................................................................................. 7
2.2 Water ............................................................................................................................................... 9
2.3 Waste ............................................................................................................................................. 11
2.4 IAQ – Indoor Air Quality ................................................................................................................. 12
2.5 Transport ....................................................................................................................................... 13
2.6 Green Spaces ................................................................................................................................. 15
2.7 Green procurement ....................................................................................................................... 18
2.8 Annex 1 – List of selected pollutants for analysis ........................................................................... 20
3 Variable list ................................................................................................................ 22

3
The ClimACT KPI performance indicators is an internal document of the ClimACT project, in the context of
WP2 – Development of tools to support the transition to a low-carbon economy in schools. One of the
objectives of WP2 is to develop an integrated tool able to support decision making with respect to the
transition to a LCE (Low Carbon Economy) in schools. This tool will incorporate 5 modules that will be
developed in the framework of Act. 2.2-2.6 while providing a user-friendly interface suitable for schools
managers and other stakeholders.
The goal of this document is to state clearly what are those KPIs, the metrics they depend on, as well as
how these metrics will be obtained. Therefore, the present document is essential to bring all the
participants together on a common vision of what are the most important indicators.
The KPIs here presented will also be used as a basis to the Building Scenario module, being the benchmark
of how well the tested scenario would work and its real impact on the school energetic behavior.
This document is not intended to be a final static version, but instead it will be maintained and updated as
needed by the project participants.
Executive Summary

4
1 Introduction
5
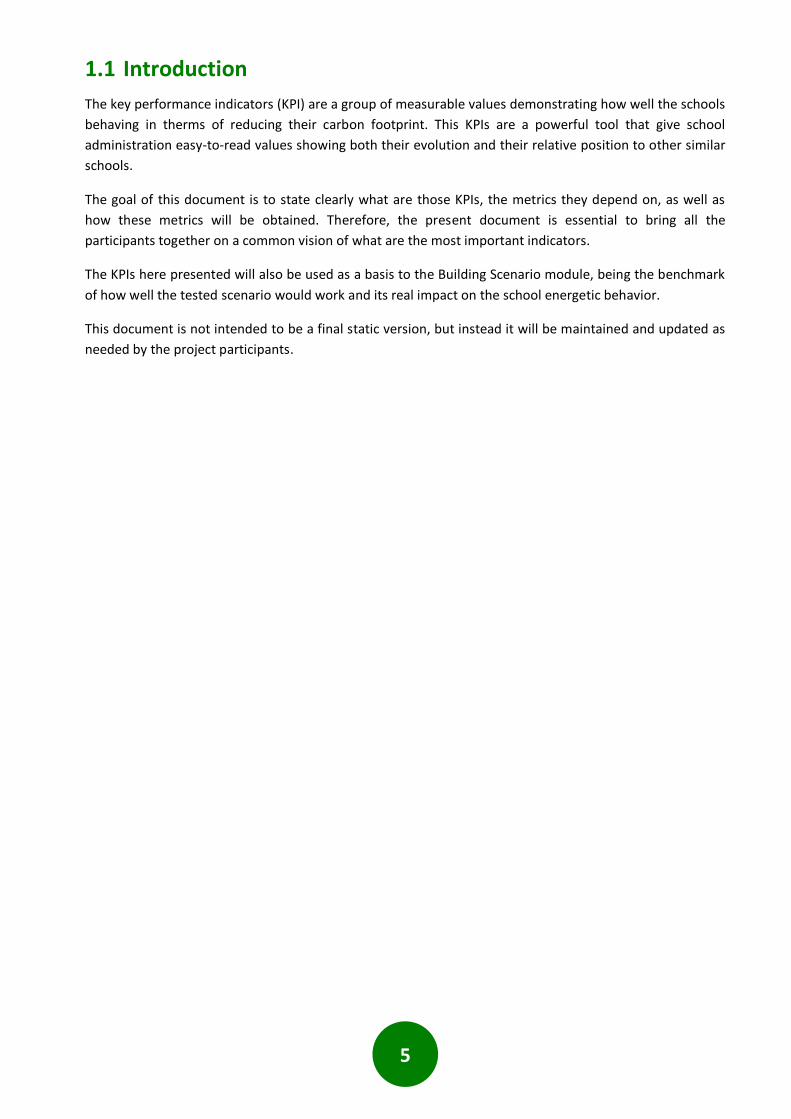
1.1 Introduction
The key performance indicators (KPI) are a group of measurable values demonstrating how well the schools
behaving in therms of reducing their carbon footprint. This KPIs are a powerful tool that give school
administration easy-to-read values showing both their evolution and their relative position to other similar
schools.
The goal of this document is to state clearly what are those KPIs, the metrics they depend on, as well as
how these metrics will be obtained. Therefore, the present document is essential to bring all the
participants together on a common vision of what are the most important indicators.
The KPIs here presented will also be used as a basis to the Building Scenario module, being the benchmark
of how well the tested scenario would work and its real impact on the school energetic behavior.
This document is not intended to be a final static version, but instead it will be maintained and updated as
needed by the project participants.

6
2 KPI List

7
For each environmental sector (energy, water, waste, Indoor Air Quality (IAQ), transport, green spaces and
green procurement) KPIs have been defined by the leaders and participants of each sector, according to
table 1.
Table 1 - Environmental sectors, leaders and participants.
SECTOR LEADER PARTICIPANTS
Energy ISQ Edigreen, USE
Water ISQ IST
Waste ISQ IST
Mobility IST UniGib
Indoor Air Quality (IAQ) ULR IST
Green spaces IST VLR
Green procurement IST UniGib
2.1 Energy
The energy consumption can be divided as presented on figure 1. The KPI and score energy measured are
presented on table 2 and table 3.
Figure 1 – Different uses for the energy in the school sector.
Table 2 - List of Energy KPI.
KPI designation
KPI calculation
Energy consumption
per useful area
KPIE1
=∑ annual consumption of eletricidade𝑖𝑖 + ∑ (annual consumption of fuel𝑗 × density𝑗𝑗 × FC𝑗)
useful area
Where: i = type of electricity (provide by the grid; onsite produced);
𝑗 = type of fuel (diesel; LPG; natural gas);
Energy
Consumption
Heating
Cooling
Ventilation
SHWLighting
Water distribuition
Others

8
KPI designation
KPI calculation
FC𝑗 = conversion factor to kWh of fuel j
Energy consumption per student
KPIE2
=∑ annual consumption of eletricidade𝑖𝑖 + ∑ (annual consumption of fuel𝑗 × density𝑗𝑗 × FC𝑗)
student
Where: i = type of electricity (provide by the grid; onsite produced);
𝑗 = type of fuel (diesel; LPG; natural gas); FC𝑗 = conversion factor to kWh of fuel j
Percentage of
renewable energy
production
KPIE3
=Renewable energy produced for onsite comsumption + renewable energy production sold to grid
∑ annual consumption of eletricidade𝑖𝑖 + ∑ (annual consumption of fuel𝑗 × density𝑗𝑗 × FC𝑗)
Where: i = type of electricity (provide by the grid; onsite produced);
𝑗 = type of fuel (diesel; LPG; natural gas); FC𝑗 = conversion factor to kWh of fuel j
Energy costs per useful
area KPIE4 =
energy annual costs
useful area
Energy costs per student
KPIE5 =energy annual costs
nr of studentss
CO2 annual emissions
KPIE6
=(electricity consumption − REP × GL) × FE𝑒 + ∑ (consumption of fuel 𝑖 × density𝑖𝑖 × FC𝑖) × FE𝑖)
nr of students
Where: i = type of fuel (diesel; LPG; natural gas);
FC𝑖 = conversion factor to kWh of fuel 𝑖 FE𝑒 = emission factor associated to electrical energy consumption.
FE𝑖 = emission factor associated to fuel. REP = Renewable electrical production
GL = Grid losses
Table 3 - List of energy scores.
Score designation Score calculation Less
favourable scenario
More favourable
scenario
Weighting for final
score
Energy consumption per useful area
SE1
=(max (KPIE1) − KPIE1) × 5
max (KPIE1) − min (KPIE1) × 0.95
Highest KPIE1 found
Lowest KPIE1 found less
5%
1
2
Energy consumption per student
SE2
=(max (KPIE1) − KPIE1) × 5
max (KPIE1) − min (KPIE1) × 0.95
Highest KPIE2 found
Lowest KPIE2 found less
5%
1
2
Percentage of renewable energy
production SE3 = KPIE3 × 5
0% renewable
energy
100% renewable
energy 1
Energy costs per useful area
SE4
=(max (KPIE5) − KPIE5) × 5
max (KPIE5) − min (KPIE5) × 0.95
Highest KPIE4 found
Lowest KPIE4 found less
5%
1
2

9
Energy costs per student
SE5
=(max (KPIE6) − KPIE6) × 5
max (KPIE6) − min (KPIE6) × 0.95
Highest KPIE5 found
Lowest KPIE5 found less
5%
1
2
CO2 annual emissions SE6
=(max (KPIE7) − KPIE7) × 5
max (KPIE7) − min (KPIE7) × 0.95
Highest KPIE6 found
Lowest KPIE6 found less
5% 1
2.2 Water
The water consumption can be divided as presented on figure 2. Once again, the first approach is to
determine the water used in each distinct area. In addition, for each water use the KPI listed on table 4 will
be measured, as well the score presented on table 5
Figure 2 - Different uses for the water in the school sector.
Table 4 - List of water KPI
KPI designation KPI calculation
Water consumption per useful area KPIW1 =
annual water consumption
useful area
Water consumption per student KPIW2 =
annual water consumption
nr of students
Water costs per useful area KPIW3 =
annual water costs
useful area
Water costs per student KPIW4 =
annual water costs
nr of students
Table 5 - List of variables needs for water consumption evaluation.
Water Consumption
HVAC
SHWCooking
Others

10
Score designation Score calculation Less
favourable scenario
More favourable
scenario
Weighting for final
score
Water consumption per useful area
Sw1
=(max (KPIw1) − KPIw1) × 5
max (KPIw1) − min (KPIw1) × 0.95
Highest KPIw1 found
Lowest KPIw1 found
less 5%
1
2
Water consumption per student
Sw2
=(max (KPIw2) − KPIw2) × 5
max (KPIw2) − min (KPIw2) × 0.95
Highest KPIw2 found
Lowest KPIw2 found
less 5%
1
2
Water costs per useful area
Sw3
=(max (KPIw3) − KPIw3) × 5
max (KPIw3) − min (KPIw3) × 0.95
Highest KPIw3 found
Lowest KPIw3 found
less 5%
1
2
Water costs per student
Sw4
=(max (KPIw4) − KPIw4) × 5
max (KPIw4) − min (KPIw4) × 0.95
Highest KPIw4 found
Lowest KPIw4 found
less 5%
1
2

11
2.3 Waste
The typical school waste is presented on figure 3, to the analysis is important to know the different
quantities of each type of waste (plastic, metals, paper, food, glass and others). In table 6 presents the
possible KPI to assess the waste production in schools and the table 7the waste scores.
Figure 3 - Different types of waste in the school sector.
Table 6 - List of waste KPI.
KPI designation KPI calculation
Annual production of urban solid waste (USW) per student 𝐊𝐏𝐈𝐑𝟏 =
𝐰𝐞𝐞𝐤𝐥𝐲 𝐩𝐫𝐨𝐝𝐮𝐜𝐭𝐢𝐨𝐧 𝐨𝐟 𝐔𝐒𝐖
𝐧𝐫 𝐨𝐟 𝐬𝐭𝐮𝐝𝐞𝐧𝐭𝐬
Annual production of recyclables per student 𝐊𝐏𝐈𝐑𝟐 =
𝐰𝐞𝐞𝐤𝐥𝐲 𝐩𝐫𝐨𝐝𝐮𝐜𝐭𝐢𝐨𝐧 𝐨𝐟 𝐫𝐞𝐜𝐲𝐜𝐥𝐚𝐛𝐥𝐞 𝐰𝐚𝐬𝐭𝐞
𝐧𝐫 𝐨𝐟 𝐬𝐭𝐮𝐝𝐞𝐧𝐭𝐬
Annual production of reusables per student 𝐊𝐏𝐈𝐑𝟑 =
𝐰𝐞𝐞𝐤𝐥𝐲 𝐩𝐫𝐨𝐝𝐮𝐜𝐭𝐢𝐨𝐧 𝐨𝐟 𝐫𝐞𝐮𝐬𝐚𝐛𝐥𝐞 𝐰𝐚𝐬𝐭𝐞
𝐧𝐫 𝐨𝐟 𝐬𝐭𝐮𝐝𝐞𝐧𝐭𝐬
Table 7 - List of waste scores.
Score designation Score calculation Less
favourable scenario
More favourable
scenario
Weighting for final
score Annual production of
urban solid waste (USW)
SR1 =(max (KPIR1) − KPIR1) × 5
max (KPIR1) − min (KPIR1) × 0.95
Highest KPIR1 found
Lowest KPIR1
found less 5%
2
Annual production of recyclables
SR2 =KPI𝑅2 × 5
max (KPI𝑅2) × 1.05
Without recyclable
waste
Highest KPIR2 found
plus 5% 1
Waste
Plastic
Metals
Papers
Glass
Food
Others

12
Annual production of reusables
SR3 =KPI𝑅3 × 5
max (KPI𝑅3) × 1.05
Without reusable
waste
Highest KPIR3 found
plus 5% 1
2.4 IAQ – Indoor Air Quality
The IAQ analysis requires a measure of different pollutants in the classroom, these ones are listed on Annex
I. In Table 8 is presented the possible KPI to assess the IAQ in schools.
Table 8 - List of IAQ, ventilation and comfort KPI
Description Formulation Units
Indoor Air Quality Index 𝐼𝐼𝐴𝑄 =∑ 𝛿𝑝𝑝
30 %
Ventilation effectiveness Index 𝐼𝑣𝑒𝑛𝑡 =∑ 𝛿𝑣𝑣
𝑁𝑣 %
Thermal Comfort Index 𝐼𝑐𝑜𝑚𝑓𝑜𝑟𝑡 =∑ 𝛿𝑖𝑖
𝑁𝑖 %
• with p =1 if Cp > TLVp and p =0 otherwise;
• v =1 if CCO2,v > 1250 ppm and v =0 otherwise
• with i =1 if Top,i > Top,max or Top,i < Top,min, and i =0 otherwise.
The Database should contemplate the variables listed on Table 9 for the presented analysis.
Table 9 - List of variables needs for IAQ, ventilation and comfort evaluation.
Variable Information source
Pollutants quantity Data logger over time
Classroom surrounding information (highway, green space, city, village, others)
Audits
Ventilation rate (outside air) Audits
Classroom volume Audits

13
2.5 Transport
The transport sector analyzes the parking conditions, the public transport network and the users’ behavior.
figure 4 shows the points focused to perform the analysis and table 10 and table 11 presents the KPIs
defined for the transport sector and the scores.
Figure 4 – Parameters analyzed in the transport sector.
Table 10 - List of transport KPIs
KPI designation KPI calculation
Charging stations for electric cars per student KPIT1 =
nr of charging stations for eletric cars
nr of students
Parking places for bicycle per student KPIT2 =
nr of parking places for bicycle
nr of students
Public Transports per hour per student KPIT3 =
nr of public transports per hour within a 1000m radius
nr of students
CO2 annual emissions per student
𝐏𝐄𝒊
=(#𝐧𝐞𝐯𝐞𝐫 × 𝟎 + #𝐚𝐥𝐦𝐨𝐬𝐭 𝐧𝐞𝐯𝐞𝐫 × 𝟏/𝟑 + #𝐚𝐥𝐦𝐨𝐬𝐭 𝐚𝐥𝐰𝐚𝐲𝐬 × 𝟐/𝟑 + #𝐚𝐥𝐰𝐚𝐲𝐬 × 𝟏) × 𝐧𝐫 𝐨𝐟 𝐩𝐞𝐫𝐬𝐨𝐧𝐬 𝐨𝐟 𝐭𝐡𝐞 𝐬𝐜𝐡𝐨𝐨𝐥
𝐧𝐫 𝐨𝐟 𝐩𝐞𝐫𝐬𝐨𝐧𝐬 𝐭𝐡𝐚𝐭 𝐚𝐧𝐬𝐰𝐞𝐫𝐞𝐝 𝐭𝐨 𝐭𝐡𝐞 𝐪𝐮𝐞𝐬𝐭𝐢𝐨𝐧𝐧𝐚𝐢𝐫𝐞
Where: i = transport mean (motorbike; car; boat; tram; train; subway; bus;
bicycle; on foot); PE𝑖 = person equivalent of the transport mean i.
Transport
Parking
Walking & cycling
Car & Motorcycle
Public transports
Users' behavior

14
KPI designation KPI calculation
𝐂𝐎𝟐 𝒊𝐄𝐦𝐢𝐬𝐬𝐢𝐨𝐧𝐬
= ∑(𝐅𝐄𝒊 × 𝐏𝐄𝒊)
𝒊
× 𝐝𝐚𝐢𝐥𝐲 𝐚𝐯𝐞𝐫𝐚𝐠𝐞 𝐝𝐢𝐬𝐭𝐚𝐧𝐜𝐞 × 𝟐𝟐
× 𝟏𝟎 Where:
CO2 𝑖 Emissions = Annual emissions associated to the transport mean i.
𝐅𝐄𝒊 = emission factor of the transport mean i [1].
KPIT4 = ∑ CO2 𝑖𝑖 Emissions
nr of students
Table 11 - List of transport scores
Score designatio
n Score calculation
Less favourable scenario
More favourable scenario
Weighting for final
score Charging
stations for electric cars
ST1 =KPIT1 × 5
1.05 × max (KPIT1)
Without charging stations
Highest KPIT2 found
plus 5% 1
Parking places for
bicycle ST2 =
KPIT2 × 5
1.05 × max (KPIT2)
Without parking places
Highest KPIT3 found
plus 5% 1
Public Transports
ST3 =KPIT3 × 5
1.05 × max (KPIT3)
Without public
transports
Highest KPIT4 found
plus 5% 1
CO2 annual emissions
ST4 = 5 −
−school emissions × 5
emissions of 100% of students going by car
100% of the
students go by car
100% of the
students go on foot or by bicycle
2

15
2.6 Green Spaces
In the green space sector the following parameters are assessed: biodiversity in the school, the green
spaces, the impacts associated with the maintenance of the spaces and the CO2 sinked. figure 5 shows the
parameters focused to perform the green spaces analysis, figure 6 presents the areas definition, table 12
shows the KPIs defined to assess the impact of the green space on the school and the table 13 the green
spaces score.
Figure 5 - Parameters analyzed in the green spaces sector.
Green
Spaces
Green areas
Trees
Chemical products
CO2 emissions
CO2 sequestrati
on

16
Figure 6 – Areas definition in school for the calculation of green spaces KPIs.
Table 12 - List of green spaces KPI.
KPI designation KPI calculation
Trees per non-covered area KPIGS1 =nr of trees
non − covered area
Trees per student KPIGS2 =nr of trees
nr of students
Green area per non-covered area KPIGS3 =green area
non − covered area x 100
Green area per student KPIGS4 =green area
nr of students
Annual usage of chemicals per green area
KPIGS5 =quantity of fertilizers and pesticides
green area
Annual CO2 sequestration per non-covered area
KPIGS6 =nr of trees × SRdominant species + lawn area × SRlawn
non − covered area
Where: SR = sequestration rate [2].
Annual CO2 emissions per non-covered area
KPIGS7
=Combustível × FEfuel + water × FEwater + electicity × FEelectricity
non − covered area
Where: FE = factor emission [1].
Table 13 - List of green spaces scores.
Score designation Score calculation Less
favourable scenario
More favourable
scenario
Weighting for final
score
Trees per non-covered area
SGS1 =KPI𝐺𝑆1 × 5
1.05 × max (KPI𝐺𝑆1)
Without trees
Highest KPIGS1 found
plus 5% 0.5
Green area per non-covered area
SGS2 = KPI𝐺𝑆3 × 5
1.05 × max (KPI𝐺𝑆3)
Without green area
Highest KPIGS3 found
plus 5% 0.5
Annual usage of chemicals per green
area SGS3 = 5 −
KPI𝐺𝑆4 × 5
max (KPI𝐺𝑆4)
Highest KPIGS4 found
Without chemicals
1
Annual CO2
sequestration per non-covered area
SGS4 =KPI𝐺𝑆5 × 5
1.05 × max (KPI𝐺𝑆5)
Without sequestration
Highest KPIGS5 found
plus 5% 1

17
Annual CO2 emissions per green area
SGS5 = 5 −KPI𝐺𝑆6 × 5
max (KPI𝐺𝑆6)
Highest KPIEV7 found
Without emissions
1

18
2.7 Green procurement
The green procurement evaluates the environmental impact associated with the purchase of products and
services by the school. figure 7 shows the parameters focused to perform the green procurement analysis.
table 14 shows the green procurement KPIs and table 15 the green procurement scores.
Figure 7 - Different variables that impact on green procurement.
Table 14 - List of green procurement KPI
KPI designation KPI calculation
Equipment efficiency KPIGP1 =nr of equipment A + or higher EU energy label
total nr of equipments
Recycled paper KPIGP2 =quantity of recycled paper
total quantity of paper
Biological food KPIGP3 = quantity of food with biological certificate
total quantity of food
Eco driving certification KPIGP4 =nr of employees with eco − driving certificates
total nr of employees
Training in green procurement KPIGP5 =nr of employees with training in green procurement
total nr of employees
Local suppliers 𝐊𝐏𝐈𝐆𝐏𝟔 =𝐧𝐫 𝐨𝐟 𝐥𝐨𝐜𝐚𝐥 𝐬𝐮𝐩𝐩𝐥𝐢𝐞𝐫𝐬
𝐭𝐨𝐭𝐚𝐥 𝐧𝐫 𝐨𝐟 𝐬𝐮𝐩𝐩𝐥𝐢𝐞𝐫𝐬
Green
Procurement
Suppliers
Paper
Equipment information
Certification & training
Food
19
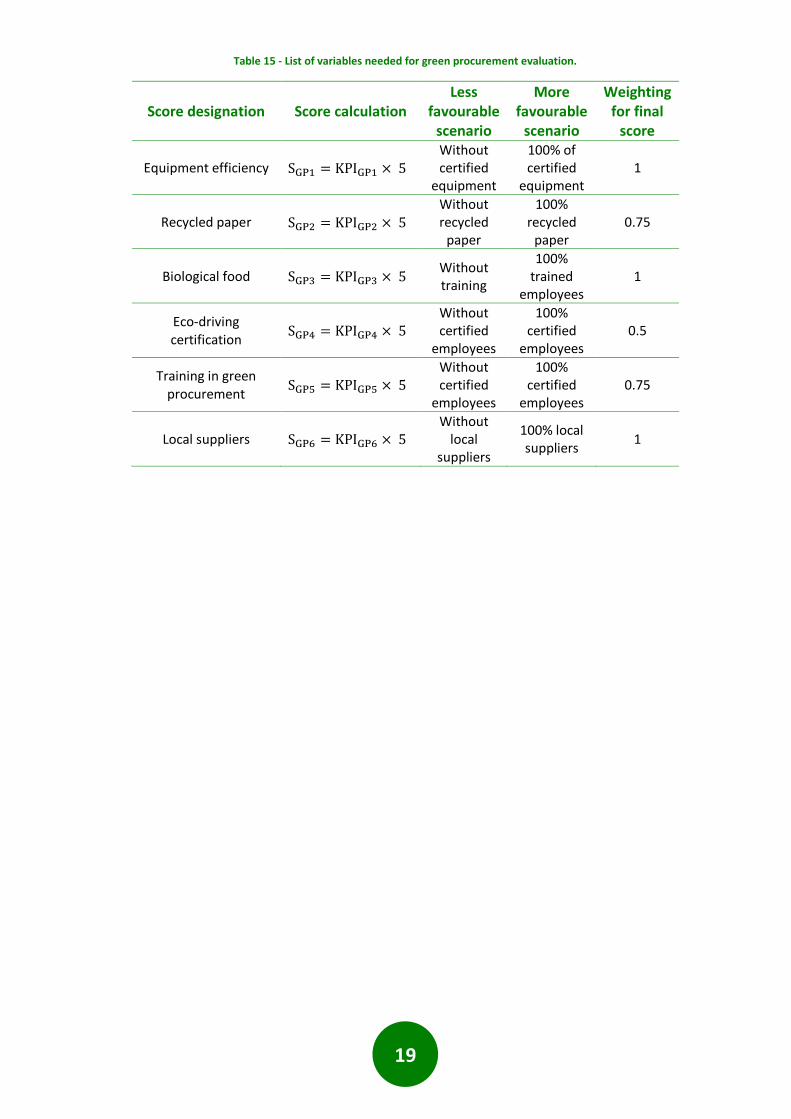
Table 15 - List of variables needed for green procurement evaluation.
Score designation Score calculation Less
favourable scenario
More favourable
scenario
Weighting for final
score
Equipment efficiency SGP1 = KPIGP1 × 5
Without certified
equipment
100% of certified
equipment 1
Recycled paper SGP2 = KPIGP2 × 5
Without recycled
paper
100% recycled
paper 0.75
Biological food SGP3 = KPIGP3 × 5 Without training
100% trained
employees 1
Eco-driving certification
SGP4 = KPIGP4 × 5 Without certified
employees
100% certified
employees 0.5
Training in green procurement
SGP5 = KPIGP5 × 5 Without certified
employees
100% certified
employees 0.75
Local suppliers SGP6 = KPIGP6 × 5 Without
local suppliers
100% local suppliers
1
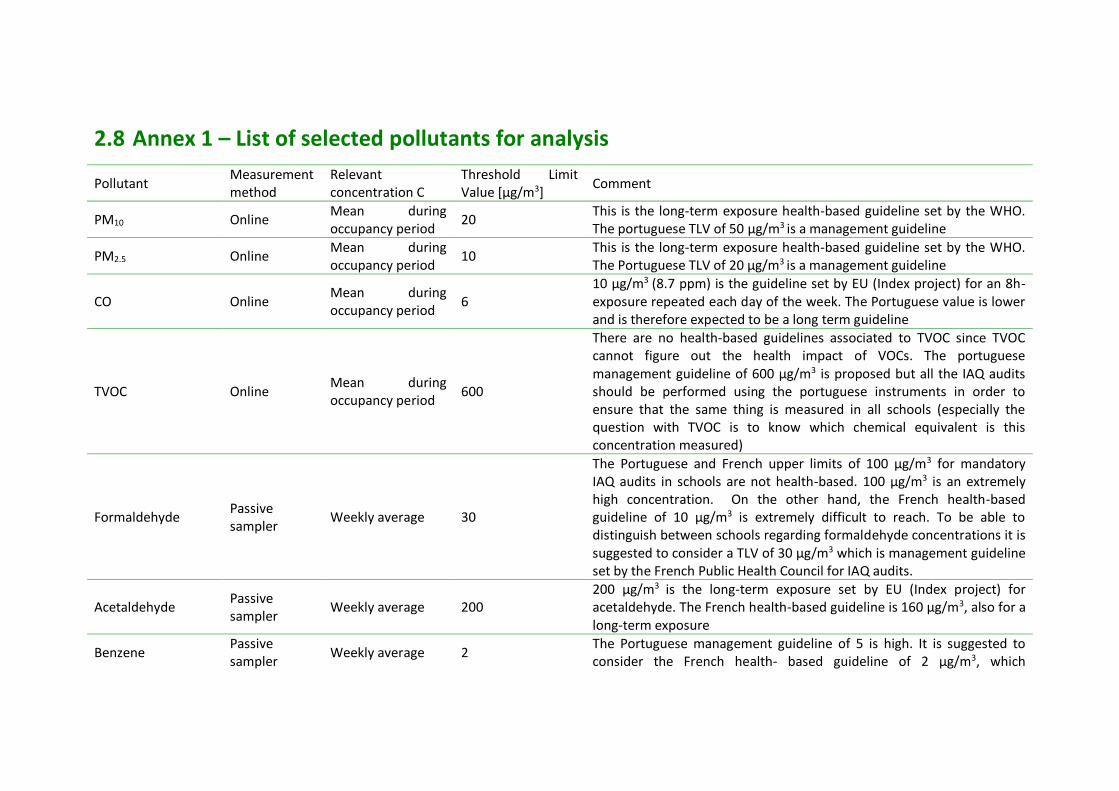
2.8 Annex 1 – List of selected pollutants for analysis
Pollutant Measurement method
Relevant concentration C
Threshold Limit Value [µg/m3]
Comment
PM10 Online Mean during occupancy period
20 This is the long-term exposure health-based guideline set by the WHO. The portuguese TLV of 50 µg/m3 is a management guideline
PM2.5 Online Mean during occupancy period
10 This is the long-term exposure health-based guideline set by the WHO. The Portuguese TLV of 20 µg/m3 is a management guideline
CO Online Mean during occupancy period
6 10 µg/m3 (8.7 ppm) is the guideline set by EU (Index project) for an 8h-exposure repeated each day of the week. The Portuguese value is lower and is therefore expected to be a long term guideline
TVOC Online Mean during occupancy period
600
There are no health-based guidelines associated to TVOC since TVOC cannot figure out the health impact of VOCs. The portuguese management guideline of 600 µg/m3 is proposed but all the IAQ audits should be performed using the portuguese instruments in order to ensure that the same thing is measured in all schools (especially the question with TVOC is to know which chemical equivalent is this concentration measured)
Formaldehyde Passive sampler
Weekly average 30
The Portuguese and French upper limits of 100 µg/m3 for mandatory IAQ audits in schools are not health-based. 100 µg/m3 is an extremely high concentration. On the other hand, the French health-based guideline of 10 µg/m3 is extremely difficult to reach. To be able to distinguish between schools regarding formaldehyde concentrations it is suggested to consider a TLV of 30 µg/m3 which is management guideline set by the French Public Health Council for IAQ audits.
Acetaldehyde Passive sampler
Weekly average 200 200 µg/m3 is the long-term exposure set by EU (Index project) for acetaldehyde. The French health-based guideline is 160 µg/m3, also for a long-term exposure
Benzene Passive sampler
Weekly average 2 The Portuguese management guideline of 5 is high. It is suggested to consider the French health- based guideline of 2 µg/m3, which

21
Pollutant Measurement method
Relevant concentration C
Threshold Limit Value [µg/m3]
Comment
corresponds to an ERU of 1 x 10⁻⁵. Measurements made in French schools show that most concentrations are below this guideline.
Toluene Passive sampler
Weekly average 250 The Portuguese guideline. No guideline was set by the WHO or EU
Xylenes Passive sampler
Weekly average 200 EU guideline (Index project) for a long-term exposure
Trichloroethylene Passive sampler
Weekly average 20 The Portuguese guideline is 25 µg/m3 but it is suggested to take the French one which is of 20 µg/m3. It is health-based and corresponds to an ERU of 1 x 10⁻⁵
Tetrachloroethylene Passive sampler
Weekly average 250 Portuguese, French and WHO guideline for a long-term exposure
Styrene Passive sampler
Weekly average 250 This is the EU health-based guideline, which is very close from the Portuguese one (260 µg/m3)
NB: In a general way, it is more relevant to consider health-based guidelines than management guidelines since here there will have no mandatory actions
to undertake if measured concentrations exceed the guideline. In a similar way, long term exposure guidelines should be considered first considering that
children spend long times in their classrooms.

3 Variable list

23
This chapter resumes in table 16 and table 17 the list of variables needs to perform the KPI
evaluation.
Table 16 - List of all the variables read by sensors.
Variable
Energy consumption by end use
Energy consumption by source
Energy consumption over time
Water consumption by end use
Water consumption over time
Pollutants quantity
Table 17 - List of all the variables known by pre-audits, audits and questioners.
Variable
Useful floor area
Number of students
Energy bills
Water bills
Biodiversity
Quantity of CO2 absorbed by the green space
Waste quantity by type
Waste sent for recycling
Ventilation rate (outside air)
Typical energy source of the region / country
Transportation used by student / staff
Daily traveled distance home-school by student / staff
Equipment transported to the school and distance traveled
Food transported for the school and distance traveled
Tons of chemists used on green space maintenance
CO2 used for the green space maintenance
Quantity of electric and electronic equipment with A+ or higher EU Energy Label used in school
Recycled paper used in school per time
Training in green procurement per staff
Eco-driving certificate per staff
Food with biological certificate
Local suppliers