Client Perception of Therapist Body Size: Effect on ...
134
Client Perception of Therapist Body Size: Effect on Evaluations by Ashley Nichole Malchow A dissertation submitted to the Graduate Faculty of Auburn University in partial fulfillment of the requirements for the Degree of Doctor of Philosophy Auburn, Alabama December 13, 2014 Keywords: body weight, therapist competency, counseling effectiveness, counselor characteristics, counselor evaluation, stereotypes Copyright 2014 by Ashley Nichole Malchow Approved by Annette Kluck, Chair, Associate Professor of Counseling Psychology Randolph Pipes, Professor of Counseling Psychology Amanda Evans, Assistant Professor of Counselor Education
Transcript of Client Perception of Therapist Body Size: Effect on ...
Client Perception of Therapist Body Size: Effect on Evaluations
by
Ashley Nichole Malchow
A dissertation submitted to the Graduate Faculty of Auburn University
in partial fulfillment of the requirements for the Degree of
Doctor of Philosophy
Auburn, Alabama December 13, 2014
Keywords: body weight, therapist competency, counseling effectiveness, counselor characteristics, counselor evaluation, stereotypes
Copyright 2014 by Ashley Nichole Malchow
Approved by
Annette Kluck, Chair, Associate Professor of Counseling Psychology Randolph Pipes, Professor of Counseling Psychology
Amanda Evans, Assistant Professor of Counselor Education
ii
Abstract
The present study sought to determine whether there are differences in the competency
ratings assigned to counselors of varying body sizes and whether the relationship between these
variables is moderated by the client’s self-reported level of impulsivity and the counselor’s
gender. A total of 307 women were recruited from Amazon Mechanical Turk. Participants
completed a demographic questionnaire and the Barratt Impulsiveness Scale-Brief. Additionally,
they were presented with a computer generated image of a counselor, along with a brief
description, and asked to rate the counselor’s competency using the Counselor Rating Form-
Short. Hierarchical regression analyses were employed to test the extent to which counselor
body size related to assigned competency scores and the extent to which participant impulsivity
and counselor gender moderated the relationship. Counselor body size predicted counselor
competency scores such that smaller body size was associated with higher competency ratings.
Study results did not support the hypothesis that participant impulsivity would interact with
counselor body size to predict counselor competency ratings such that the significance of the
relationship between perceived counselor body size and perceived competency was greater at
higher levels of participant impulsivity. Instead, the negative relationship between counselor
body size and counselor competency scores was found to be stronger for participants who
reported low levels of impulsivity. The hypothesis that counselor gender would interact with
counselor body size to predict counselor competency scores was not supported. Future research
iii
needs to explore additional variables that may moderate or otherwise impact the relationship
between counselor body size and counselor competency scores.

iv
Acknowledgments
I want to begin by saying how grateful I am for the support of my family. Mom, you
have always been there to encourage me every step of the way. Thank you for helping me to
keep going even when I wanted to give up! Dad, I am finally going to be a doctor! I do not
think I will be able to buy you that new yacht quite yet though! Grandma, thank you so much for
all the prayers! I could not have done this without them! Brenton and Kelly, I have so
appreciated the support that you’ve given me throughout and I cannot wait until Kelly and I are
both completely DONE with school!! To my amazing sisters, Staci, Martha, Alicia, and
Courtney, I am so glad to have you in my life and greatly appreciate all of the support that you
have given me. I cannot believe how much we have grown since undergrad and I love you all!
Joe, I do not even know what to say. You have become such an amazing part of my life. Thank
you so much for supporting me through this dissertation and my internship! I cannot wait to start
the next phase of our life together. To the wonderful women who were part of my Dissertation
Club, I cannot say thank you enough! Kori, Stephanie, and Elizabeth, I do not think that I could
have made it through this without you girls. We are finally DONE and this process has brought
us so close. I see many non-dissertation Skype sessions in our future. Finally, to my committee,
Dr. Kluck, Dr. Evans, and Dr. Pipes, thank you so much for everything that you have done to
make me the professional I am today. So many people have touched my life during my career at
Auburn and it has been an amazing journey! I am grateful to everyone who has been a part of it
and will hold you all in my heart! WAR EAGLE!

v
Table of Contents
Abstract ........................................................................................................................................... ii
Acknowledgments.......................................................................................................................... iv
List of Tables ............................................................................................................................... viii
List of Figures ..................................................................................................................................x
Chapter I. Introduction .....................................................................................................................1
Summary of Weight Bias in Counseling .............................................................................7
Statement of the Problem and Research Hypotheses ...........................................................8
Operational Definitions ........................................................................................................9
Purpose ...............................................................................................................................10
Summary ............................................................................................................................11
Chapter II. Literature Review ........................................................................................................12
Stereotyping .......................................................................................................................12
Stereotypes in Counseling......................................................................................19
Weight Stereotypes in Counseling .........................................................................24
Weight Stigma Today ............................................................................................27
Impulsivity and Weight..........................................................................................30
Weight Stigma and Gender ....................................................................................31
Summary ............................................................................................................................32

vi
Chapter III. Methods ......................................................................................................................34
Methodology ......................................................................................................................35
Participants .............................................................................................................35
Measures ................................................................................................................41
Demographic Questionnaire ......................................................................41
Counselor Rating Form–Short (CRF–S) ....................................................41
Barratt Impulsiveness Scale–Brief (BIS–Brief).........................................43
Models....................................................................................................................45
Design and Procedures ...........................................................................................48
Data Analytic Strategy .......................................................................................................50
Summary ............................................................................................................................51
Chapter IV. Results .......................................................................................................................53
Overview ............................................................................................................................53
Descriptive Statistics ..........................................................................................................53
Reliability Statistics ...........................................................................................................54
Simple Correlations between Variables .............................................................................55
Model Size Predicting Counselor Competency Scores .....................................................60
Participant Impulsivity as a Moderator ..............................................................................62
Model Gender as a Moderator ...........................................................................................65
Interaction between Model Gender, Model Size, and Participant Impulsivity ..................67
Preference for an Average Sized Counselor …………………………………………….71
Chapter V. Discussion ...................................................................................................................73
Meaning and Interpretation of Findings ............................................................................73

vii
Limitations .........................................................................................................................81
Sampling Bias ........................................................................................................81
Methodological ......................................................................................................81
Computer Generated Models .................................................................................82
Relevance to Clinical Sample ................................................................................83
Cross-Cultural Relevance ......................................................................................84
Measures ................................................................................................................84
Implications........................................................................................................................85
Future Directions ...............................................................................................................86
References ......................................................................................................................................90
Appendices:
Appendix A. Demographic Questionnaire ......................................................................106
Appendix B. Counselor Models ......................................................................................108
Appendix C. Written Description to Accompany Models of Counselors ......................116
Appendix D. Sample Screen Shot of Ad with Model from Survey ................................117
Appendix E. Description of Task to be Posted on MTurk.com .....................................118
Appendix F. Information Letter .....................................................................................119
Appendix G. Debriefing Letter .......................................................................................122
viii
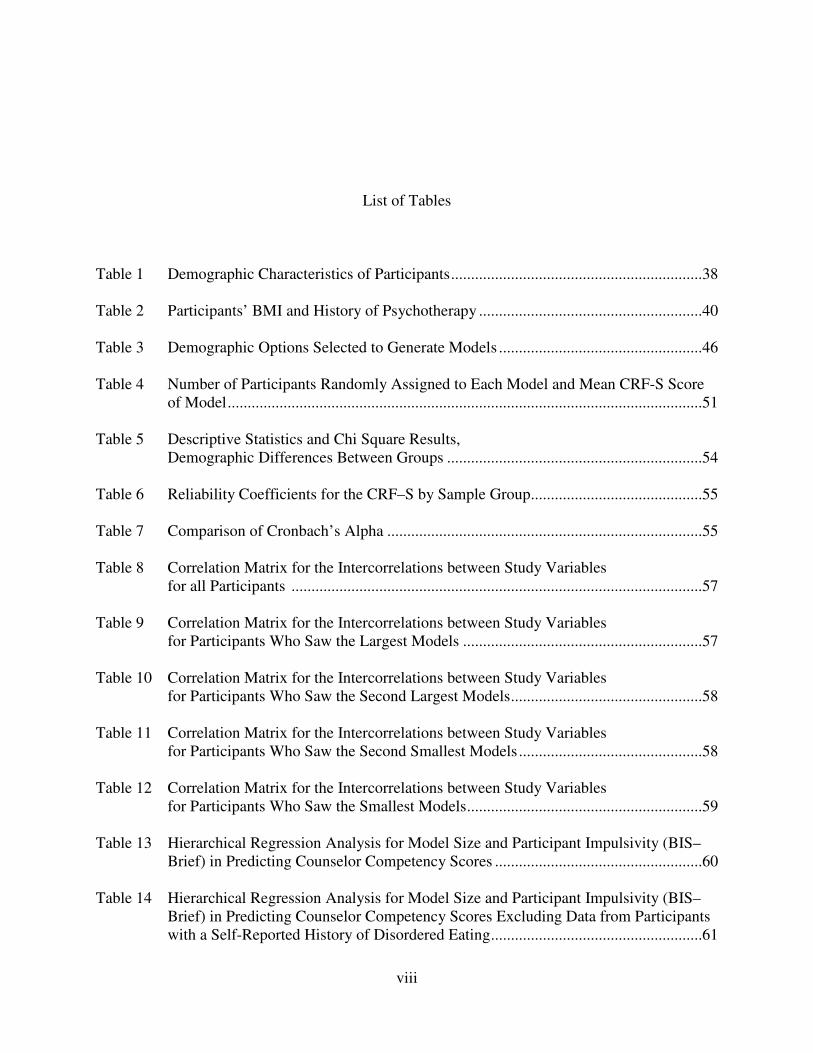
List of Tables
Table 1 Demographic Characteristics of Participants ...............................................................38
Table 2 Participants’ BMI and History of Psychotherapy ........................................................40
Table 3 Demographic Options Selected to Generate Models ...................................................46
Table 4 Number of Participants Randomly Assigned to Each Model and Mean CRF-S Score of Model .......................................................................................................................51
Table 5 Descriptive Statistics and Chi Square Results, Demographic Differences Between Groups ................................................................54
Table 6 Reliability Coefficients for the CRF–S by Sample Group...........................................55
Table 7 Comparison of Cronbach’s Alpha ...............................................................................55
Table 8 Correlation Matrix for the Intercorrelations between Study Variables for all Participants .......................................................................................................57
Table 9 Correlation Matrix for the Intercorrelations between Study Variables for Participants Who Saw the Largest Models ............................................................57
Table 10 Correlation Matrix for the Intercorrelations between Study Variables for Participants Who Saw the Second Largest Models ................................................58
Table 11 Correlation Matrix for the Intercorrelations between Study Variables for Participants Who Saw the Second Smallest Models ..............................................58
Table 12 Correlation Matrix for the Intercorrelations between Study Variables for Participants Who Saw the Smallest Models ...........................................................59
Table 13 Hierarchical Regression Analysis for Model Size and Participant Impulsivity (BIS–Brief) in Predicting Counselor Competency Scores ....................................................60
Table 14 Hierarchical Regression Analysis for Model Size and Participant Impulsivity (BIS–
Brief) in Predicting Counselor Competency Scores Excluding Data from Participants with a Self-Reported History of Disordered Eating .....................................................61

ix
Table 15 Hierarchical Regression Analysis for Model Size and Model Gender in Predicting Counselor Competency Scores for All Participants.....................................................66
Table 16 Hierarchical Regression Analysis for Model Size and Model Gender in Predicting Counselor Competency Scores for Participants without a History of Disordered Eating .............................................66
Table 17 Hierarchical Regression Analysis for Interactions between Model Size, Model Gender, and Participant Impulsivity in Predicting Counselor Competency Scores for All Participants.............................................................................................................68
Table 18 Hierarchical Regression Analysis for Interactions between Model Size, Model
Gender, and Participant Impulsivity in Predicting Counselor Competency Scores for Participants without a History of Disordered Eating ...................................................69
Table 19 Bonferroni Results, CRF-S score differences Between Groups ..................................72

x
List of Figures
Figure 1 Graph showing the interaction between participant impulsivity (BIS–Brief scores) and model size in predicting counselor competency (CRF–S) scores ...........................64
1
CHAPTER I. INTRODUCTION
On a typical day, the average person is bombarded with an extraordinary amount of
sensory and cognitive input. Given the rapid influx of information that requires processing at
nearly all times, human brains rely heavily on pre-existing beliefs, among other techniques (e.g.,
desensitization), to efficiently and effectively process the world and the people in it (Gilbert &
Hixon, 1991; Macrae & Bodenhausen, 2000). In order to alleviate some of the cognitive load
associated with consciously and individually evaluating every contact, new individuals (targets)
may be categorized according to pre-existing beliefs or stereotypes (Gilbert & Hixon, 1991;
Macrae & Bodenhausen, 2000). This process typically occurs rapidly at an implicit, not
consciously examined, level (Greenwald & Banaji, 1995; Kahneman, 2003; Macrae &
Bodenhausen, 2000; Stanovich & West, 2000). Such implicit categorizations typically rely upon
readily available knowledge about the target, which is often drawn from physical characteristics
and appearance (Dion, Berscheid, & Walster, 1972; Etcoff, Stock, Haley, Vickery, & House,
2011; Greenwald & Banaji, 1995; Naumann, Vazire, Rentfrow, & Gosling, 2009; Willis &
Todorov, 2006), and tend to be stable over time. In fact, people have been shown to make
reasonably precise and enduring evaluations of others with as little as 100 milliseconds worth of
data (Etcoff et al., 2011; Greenwald & Banaji, 1995; Willis & Todorov, 2006).
When the brain is less busy, stereotype-inconsistent information is readily recognized and
processed (Macrae & Bodenhausen, 2000; Snyder, Tanke, & Berscheid, 1977), but people more
readily notice, remember, and bring to mind information that is consistent with stereotypes

2
during periods of cognitive busyness (Macrae & Bodenhausen, 2000; Snyder et al., 1977).
Stereotypes can be valuable in alleviating cognitive load, but in order for the stereotype to be
useful it must first be activated. Activation is dependent upon factors both internal and external
to the individual. Internal factors include the individual’s cognitive load, the individual’s
motivation to avoid the use of stereotypes, and the likelihood that the use of a stereotype will
improve the individual’s self-esteem (Gilbert & Hixon, 1991; Kahneman, 2003; Krieglmeyer &
Sherman, 2012; Macrae & Bodenhausen, 2000). External factors that influence the activation of
stereotypes include the salience of the stereotype to the situation and the type of judgment that is
being made.
Even if the conditions are favorable, a stereotype may not always be activated. In most
social interactions, each party has multiple noticeable traits (e.g., race, gender, etc.) that may be
linked with a stereotype. In such cases, some stereotypes will be activated while others are
inhibited, or not activated (Macrae & Bodenhausen, 2000; Sinclair & Kunda, 1999). Which
stereotype is activated depends on the individual’s background, the context of the situation, and
the “prototypicallity” of the target (Gilbert & Hixon, 1991; Kahneman, 2003; Krieglmeyer &
Sherman, 2012; Macrae & Bodenhausen, 2000)
Once activation occurs, the stereotype may be applied, or used in developing judgments
about the target (Gilbert & Hixon, 1991; Krieglmeyer & Sherman, 2012; Macrae &
Bodenhausen, 2000). Application typically occurs at an implicit level and may influence the
individual’s behavior without their awareness (Greenwald & Banaji, 1995; Macrae &
Bodenhausen, 2000). Like activation, application does not always occur and is dependent upon
the following factors: the individual’s cognitive load, the likelihood that the use of a stereotype
will improve the individual’s self-concept, and the individual’s level of motivation to avoid
3
stereotype application (Gilbert & Hixon, 1991; Krieglmeyer & Sherman, 2012; Macrae &
Bodenhausen, 2000).
Typically both activation and application of stereotypes, if they occur, arise rapidly upon
the initiation of social interaction (Etcoff et al., 2011; Greenwald & Banaji, 1995; Willis &
Todorov, 2006). Although both activation and application are implicit processes, an individual,
if highly motivated, is able to thwart both process. In order to be successful, the individual must
be aware of their biases (Macrae & Bodenhausen, 2000) and the availability of additional
individuating information about the target is helpful (Krieglmeyer & Sherman, 2012).
Furthermore, efforts to prevent activation and application may, counterintuitively, increase
accessibility of the stereotype and may result in increased stereotyping during periods of relaxed
effort (Macrae & Bodenhausen, 2000).
A large percentage of mental health clients terminate treatment following the first
counseling session, and most people who terminate treatment prematurely do so between
sessions one and four (Brogan, Prochaska, & Prochaska, 1999; Garfield, 1994; Gearing,
Townsend, Elkins, El-Bassel, & Osterberg, 2014). Therefore, judgments about treatment and
determinations about continuation can likely be attributed to first impressions, which are often
based on implicit stereotypes (Etcoff et al., 2011; Greenwald & Banaji, 1995; Willis & Todorov,
2006). In other words, we might be able to better understand treatment termination through
examination of stereotype activation and application.
Counseling is a social interaction and the client’s relationship with the counselor
significantly impacts outcome (Norcross, 2011; Wampold, 2001). Therefore, stereotypes that
include information about a counselor’s social and interpersonal competence are likely to be
relevant to the client’s decision to terminate treatment (Ackerman & Hilsenroth, 2003; Chang &

4
Berk, 2009; Evans-Jones, Peters, & Barker, 2009; Fuertes & Brobst, 2002; Luborsky, Auerback,
Chandler, Cohen, & Bachrach, 1971; Orlinsky, Grawe, & Parks, 1994). Importantly, some
research has shown that the “what is beautiful is good” stereotype applies most prominently to
social and interpersonal domains (Eagly, Ashmore, Makhijani, & Longo, 1991; Etcoff et al.,
2011; Fuertes & Brobst, 2002; Snyder et al., 1977) and it is highly likely that physical attributes
and beauty will be found to impact client’s judgments about their relationship with a counselor.
In fact, research has identified significant relationships between counseling outcome and
physical characteristics of both the client and the counselor (Barocas & Vance, 1974; Cabral &
Smith, 2011; Cash & Kehr, 1978; Evans-Jones et al., 2009; Hassel, 2002; Pascal & Kurpius,
2012; Shapiro, Struening, Shapiro, & Barten, 1976; Tall & Ross, 1991; Thompson, Bazile, &
Akbar, 2004).
The literature reveals that the counselor’s physical characteristics are correlated with the
client’s judgments about the counselor and that the client’s weight is correlated with the
counselor’s impressions about the client (Pascal & Kurpius, 2012). What is less clear, however,
is the relationship between the counselor’s weight and the client’s impressions of the counselor.
Two studies conducted in the 1980s (McKee & Smouse, 1983; Wiggins, 1980) examined that
specific question. Wiggins (1980) reported a significant negative correlation between counselor
body size and perceived counselor competency, but McKee and Smouse (1983) found no
significant relationship between the two variables. No additional studies were found examining
the effect of implicit bias related to perceived counselor weight on ratings of competency
provided by clients. Extant literature in the fields of medicine and physical fitness reveal that
non-obese physicians and physical fitness instructors are viewed more positively than obese
physicians and physical fitness instructors (Bleich, Gudzune, Bennett, Jarlenski, & Cooper,

5
2013; Brudvig & Borna, 2012; Dean, Adams II, & Comeau, 2005; Evans, Cotter, & Roy, 2005;
Harsha, Saywell, Thygerson, & Panozzo, 1996; Hash, Munna, Vogel, & Bason, 2003; Lubker,
Watson II, Visek, & Geer, 2005; Melville & Maddalozzo, 1988), which suggests that similar
results may be found in counseling and the evaluation of counselors by clients.
Since the 1980s, the prevalence of obesity in the United States has been steadily rising
(Flegal, Carroll, Kuczmarski, & Johnson, 1998; Ogden, Carroll, Kit, & Flegal, 2012). Moreover,
there has been increased national attention to obesity (Cohen, Perales, & Steadman, 2005),
increasingly negative media portrayals of obesity (Sypeck, Gray, & Ahrens, 2004), and increased
stigmatization of obesity (Andreyeva, Puhl, & Brownell, 2008) in the United States. Overweight
and obese individuals report being stigmatized in nearly all settings (e.g., school, work, home,
etc.) and implicit anti-fat biases have been found in individuals from all walks of life and of all
weight statuses, including overweight individuals (Burmeister, Kiefner, Carels, & Musher-
Eizenman, 2013; Cohen et al., 2005; Hassel, 2002; Kingkade, 2013; Pascal & Kurpius, 2012;
Pingitore, Dugoni, Tindale, & Spring, 1994; Puhl & Brownell, 2001; Puhl & Heuer, 2009;
Schwartz, Vartanian, Nosek, & Brownell, 2006). Although obesity may be considered unhealthy
and has been shown to be correlated with increased likelihood for certain diseases and health
problems (Centers for Disease Control and Prevention [CDC], 2012), the bias is likely to extend
beyond a desire to promote health. A significant number of participants, both obese and non-
obese, in one study were willing to make sacrifices up to and including the loss of one year of
life and the loss of health to avoid being obese (Schwartz et al., 2006).
The focus on obesity tends to place the impetus upon on the individual to address the
“problem” (Cohen et al., 2005), which increases the belief that obesity is somehow the
individual’s fault. Stereotypes associated with obesity include laziness, lack of self-control, low
6
intelligence, and noncompliance with health recommendations (Cohen et al., 2005; Harris,
Harris, & Bochner, 1982; Jackson, 1992; Miller & Lundgren, 2010; Puhl & Brownell, 2001;
Puhl & Heuer, 2009; Saguy & Gruys, 2010). Impulsivity, or impairment of impulse control, is a
complex concept popularly defined as, “A predisposition toward rapid, unplanned reactions to
internal and external stimuli without regard to the negative consequences of these reactions to the
impulsive individual or to others” (Stanford et al., 2009, p. 1784). The prominent social
messages linking obesity and impulsivity (APA, 2013; Cohen et al., 2005; Klaczynski, Goold, &
Mudry, 2004; Puhl & Brownell, 2001) increase the likelihood that the client’s preconceived
notions about obese people will be activated if impulsivity is central to the client’s presenting
concern (Kahneman, 2003; Krieglmeyer & Sherman, 2012; Macrae & Bodenhausen, 2000).
It is possible that individuals who perceive themselves as having any trait socially
associated with obesity (Cohen et al., 2005; Harris et al., 1982; Jackson, 1992; Kahneman, 2003;
Krieglmeyer & Sherman, 2012; Macrae & Bodenhausen, 2000; Miller & Lundgren, 2010; Puhl
& Brownell, 2001; Puhl & Heuer, 2009; Saguy & Gruys, 2010), including high impulsivity, may
be more susceptible to the activation of stereotypes related to obesity. If this is the case, prior
research (e.g., Kahneman, 2003) on stereotype activation suggests those individuals would be
more likely to negatively evaluate the counselor’s competency and ability to provide treatment
than an individual who perceives themselves as having less of the trait (e.g., as being less
impulsive). Therefore, when examining the relationship between the counselor’s body size and
ratings of competency provided by clients, it is important to consider what impact the client’s
level of impulsivity might have.
One additional factor which may increase the likelihood of stereotype activation is
gender. Prior studies that have examined the relationship between a target’s perceived body size

7
and evaluations of the target by a rater have not found the gender of the target to be an important
factor (Cash & Kehr, 1978; Harris et al., 1982; Paradise, Cohl, & Zweig, 1980; Wiggins, 1980).
However, more recent studies suggest that women are held more stringently to physical
appearance standards than are men (Burmeister et al., 2013; Carpenter, Hasin, Allison, & Faith,
2000; Eagly et al., 1991; Gortmarker, Must, Perrin, Sobal, & Dietz, 1993; Harris et al., 1982;
Jackson, 1992; Miller & Lundgren, 2010; Pingitore et al., 1994; Schvey, Puhl, Levandoski, &
Brownell, 2013; Stake & Lauer, 1987). Thus, interacting with a female counselor may increase
the salience of the obesity stereotypes and thus increase the likelihood that the stereotype will be
activated.
Summary of Weight Bias in Counseling
Research has supported the importance of client and counselor physical appearance and
attractiveness variables in the development of counseling relationships (Cabral & Smith, 2011;
Carter, 1978; Cash, Begley, McCown, & Weise, 1975; Evans-Jones et al., 2009; Fuertes &
Brobst, 2002; Harris & Busby, 1998; Hollander-Goldfein, Fosshage, & Bahr, 1989; Maramba &
Nagayama Hall, 2002; Paradise et al., 1980; Shapiro et al., 1976; Tall & Ross, 1991). Despite
evidence indicating that the client’s weight is significantly related to the counselor’s impressions
about the client (Pascal & Kurpius, 2012) and that the weight status of physicians and fitness
instructors is significantly related to how competent they are perceived to be (Bleich et al., 2013;
Brudvig & Borna, 2012; Dean et al., 2005; Evans et al., 2005; Harsha et al., 1996; Hash et al.,
2003; Lubker et al., 2005; Melville & Maddalozzo, 1988), extant literature does not adequately
address the relationship between a counselor’s body size and the client’s impressions of the
counselor. The two studies that were located in the literature were conducted in the 1980s and
found contradictory results (McKee & Smouse, 1983; Wiggins, 1980). A more recent study

8
(Vocks, Legenbauer, & Peters, 2007) directly questioned participants about the importance of
their counselor’s body size and found a significant preference for average sized counselors.
However, recent literature was not found to address the relationship between counselor body size
and ratings of counselor competency and much remains unknown about how client’s implicit
weight biases may impact the counseling relationship.
Statement of the Problem and Research Hypotheses
The literature remains unclear about the relationship between counselor body size and
ratings of the counselor’s competency. This correlation, along with potentially moderating
factors, warrants further investigation. The present study sought to determine whether there are
differences in the competency ratings counselors received across counselors of varying body
sizes. This study attempted to determine the nature of the relationship (positive or negative
correlation) and if the relationship is moderated by the client’s self-reported level of impulsivity
and the counselor’s gender. Specifically, the current study addressed the following hypotheses:
• The counselor’s body size is significantly and negatively correlated with participants’
subjective ratings of the counselor’s competency.
• The participant’s level of impulsivity moderates the relationship such that the
significance of the relationship between perceived counselor body size and perceived
competency is greater at higher levels of participant impulsivity.
• The counselor’s gender moderates the relationship such that the significance of the
relationship between perceived counselor body size and perceived competency is
greater for female counselors than for male counselors.

9
These hypotheses were intended to specifically address the impact of implicit weight bias on
competency ratings provided for counselors and to collect more information about the possible
mechanism of the relationship.
Operational Definitions
Extant literature has examined this topic by categorizing pictured individuals into certain
weight status groups (e.g., normal weight and overweight). However, these and other terms
(e.g., underweight, obese, etc.) are medical terms identified with a specific Body Mass Index
(BMI) or height-weight ratio. Given that valid BMI and height-weight ratio data is often
unavailable for stock photographs and is unable to be determined for the computer-generated
models used in this study, body size was used in the place of a specific weight category. Models
were generated and, through comparison with each other, were classified as the smallest model,
the second smallest model, the second largest model, and the largest model. Thus, the models
were representatives of various points on the continuum of body size. While it is possible, and
even likely, that participants perceived the models to belong to a specific weight category, no
data was collected about which category the participants perceived the models to belong to.
Given that the beauty ideal is based on perception rather than fact and that studies have shown
the perceived weight of an individual to be more important than the actual weight (Eaton, Lowry,
Brenew, Galuska, & Crosby, 2005), it is likely that participants’ biases influenced their ratings
whether the model belonged to a specific weight group on not.
Participants in this study were asked to rate the competency of one of eight pictured
counselors. The range of opinions as to what constitutes competency makes the task of
measuring a counselor’s abilities difficult. Competency tends to be measured most effectively
from within a specific theoretical framework (Sharpless & Barber, 2009; Thompson & Hill,

10
1993). For the purposes of this study, participants used the Counselor Rating Form-Short
version (CRF–S), a cross-theoretical measure developed by Corrigan and Schmidt (1983), to
evaluate the pictured counselor’s competency. The measure specifically evaluates various
characteristics situated on three dimensions of counselor behavior (expertness, attractiveness,
and trustworthiness; Barak & LaCrosse, 1975) and overall competency was defined as the
average total score on the CRF–S.
Finally, participants’ self-reported impulsivity was evaluated as part of this study.
Impulsivity is a complex concept popularly defined as a tendency to quickly respond to internal
and external stimuli without planning or regard for outcome (Stanford et al., 2009). The Barratt
Impulsiveness Scale-11 (BIS-11; Patton et al., 1995) is considered to be one of the most widely
used measures of impulsivity in both research and clinical settings (Stanford et al., 2009) and a
validated shorter version, the BIS–Brief, was used to measure impulsivity in this study.
Specifically, the total BIS–Brief score was used to capture the overall impulsiveness of each
participant (Steinberg et al., 2013).
Purpose
The purpose of the current study was to examine, in today’s cultural milieu, the
relationship between a counselor’s body size and first impressions of therapeutic skill by
potential clients. The present study obtained information about the extent and nature of the
relationship as well as information about the potentially moderating variables of client’s impulse
control and counselor’s gender.
The results of the present study add to the existing body of knowledge regarding weight
stigma in general and provide a fuller picture of variables which may influence the direction
and/or strength of the effect of weight bias on evaluations of others. It was also designed to add

11
to psychologists’ knowledge about their specific physical attributes (e.g., body size) which may
influence the relationship development and outcome of counseling. Perhaps most importantly,
specific identified factors that may increase or decrease the likelihood of a client’s implicit
weight bias affecting the counseling relationship or outcome may aid in psychologists’ decision-
making process about if, how, and when to address weight bias with their clients. For example, a
counselor who identifies a client as being at-risk for discontinuing treatment due to weight
stigma may find it beneficial in building rapport to discuss with the client what it is like to be
working with a counselor of their body size. While not specifically addressing weight bias with
the client, such a conversation may improve rapport, bring the client’s biases into their
awareness, and allow for in-session processing.
Summary
Existing research has not adequately described the impact of weight bias on counseling
relationships and outcome. This dissertation study provides valuable information to the field of
psychology regarding weight stigma and its impact on the counseling relationship and outcome.
Results have implications for the types and timing of interventions that may be used to address
biases and their impact on counseling. The following sections further elaborate on the existing
cognitive theory of stereotyping as well as what is currently known about obesity and weight
stigma and its impact in counseling. The study methodology and procedures are also delineated.

12
CHAPTER II. LITERATURE REVIEW
Stereotyping
When an individual (the rater) comes into contact with another person (the target), he or
she forms immediate impressions of the target that influence later interactions with that target
(Krieglmeyer & Sherman, 2012). These impressions are often formed quickly, based on data
collected in as little as 100 milliseconds (Etcoff et al., 2011; Greenwald & Banaji, 1995; Willis
& Todorov, 2006), and typically develop into conscious judgments about multiple aspects of the
target’s identity (e.g., professionalism, competence, safety, trust, etc.). Once made, the initial
judgments have been shown to be stable over time (Jackson, 1992; Miller & Turnbull, 1986;
Naumann et al., 2009; Wiggins, 1980; Willis & Todorov, 2006). The stability of judgments
based on such little data is hypothesized to occur for two reasons. Initial observations are highly
salient and more easily recalled (primacy effect) and all incoming information following the first
encounter is processed in a manner consistent with the rater’s expectations (confirmation bias;
Bodenhausen & Wyer, 1985; Darley & Gross, 1983; Macrae & Bodenhausen, 2000; Snyder et
al., 1977; Wiggins, 1980). In other words, when interacting with a target, raters are exposed to a
large number of observations. Some of the observations most easily recalled are the first
observations that the rater made (primacy effect). These observations lead to the generation of
expectations about the target and, from that point forward in the interaction, all incoming
information is processed in a manner consistent with those expectations (confirmation bias).

13
Stereotypes and pre-existing expectations strongly influence the nature of the rater’s
memories of the target (Macrae & Bodenhausen, 2000) and thus set the framework for all future
encounters. During periods of high cognitive load, stereotype-consistent information is more
easily remembered, noticed, and brought to mind than stereotype-inconsistent information
whereas, during periods of low cognitive load, stereotype-inconsistent information dominates a
rater’s memory of a target (Macrae & Bodenhausen, 2000; Snyder et al., 1977). However, even
in situations when stereotype inconsistencies are prominent, it is possible that the information
will be reinterpreted in a stereotype-consistent manner (Brown, 2011; Snyder et al., 1977). For
example, an individual who tends to conserve money may be interpreted as “thrifty,” which has a
somewhat positive connotation, or as “cheap,” which has a more negative connotation (Snyder et
al., 1977), depending on the associated stereotype. Furthermore, any gaps in available
knowledge are filled with stereotype-consistent information (Brown, 2011; Snyder et al., 1977)
and preexisting expectations about a target may act as self-fulfilling prophecies (Hebl &
Dovidio, 2005; Jussim, 1986). Throughout social interactions, the rater’s actions are guided by
their expectations about the target (Macrae & Bodenhausen, 2000) and the rater’s actions, in
turn, prompt the target to behave in such a way as to fulfill pre-existing expectations (Hebl &
Dovidio, 2005; Snyder, 1992; Snyder et al., 1977). Each of these processes serves to influence
behavior, memories, and the continuation of stereotypes.
In order for stereotypes to be influential in social interactions, they must first be
activated. Cognitive processing is done through two different systems, system one and system
two. Whereas system two is more analytical, system one is “characterized as automatic, largely
unconscious, and relatively undemanding of computational capacity” (Stanovich & West, 2000,
p. 658). This type of processing is often labeled implicit and the goal of this system is to
14
interpret and predict interaction processes so as to make rapid decisions about the next step in the
interaction. This process involves the activation of previously obtained knowledge that is not
consciously remembered (Greenwald & Banaji, 1995; Kahneman, 2003; Macrae &
Bodenhausen, 2000; Stanovich & West, 2000). When a rater interacts with a target, the
stereotype associated with the target’s trait is activated at a system one level (Gilbert & Hixon,
1991; Macrae & Bodenhausen, 2000). The term ‘stereotype activation’ refers to the increased
accessibility of knowledge that is part of a stereotype (e.g., information about how members of
that social group typically behave; Krieglmeyer & Sherman, 2012). Such an activation may
influence the rater’s explicit behaviors without their conscious awareness (Macrae &
Bodenhausen, 2000). For example, studies have shown that when the African American
stereotype is activated surreptitiously in a group of participants, hostile nonverbal behaviors are
exhibited and when the elderly stereotype is activated surreptitiously, participants slow their
walking pace significantly (Macrae & Bodenhausen, 2000).
Whether or not activation occurs depends on the salience of the target’s noticeable trait to
the situation, the rater’s cognitive load, the type of judgment being made, the likelihood that the
use of a stereotype will improve the rater’s self-concept, and the rater’s level of motivation to
avoid stereotype activation (Gilbert & Hixon, 1991; Kahneman, 2003; Krieglmeyer & Sherman,
2012; Macrae & Bodenhausen, 2000). Of these conditions, it appears that the opportunity to
improve one’s self-concept through the use of stereotypes is the most important (Macrae &
Bodenhausen, 2000). In other words, if using a stereotype in developing a judgment about a
target has the potential to create a downward social comparison and/or improve the rater’s self-
concept, it is highly likely that the stereotype will be activated, no matter the other conditions
(Macrae & Bodenhausen, 2000). If the opportunity for a downward social comparison is not

15
present, the salience of the target’s noticeable trait to the situation is significantly positively
correlated with the likelihood of activation and the cognitive load of the rater is significantly
negatively correlated with the likelihood of activation (Gilbert & Hixon, 1991; Kahneman, 2003;
Krieglmeyer & Sherman, 2012; Macrae & Bodenhausen, 2000). Furthermore, the type of
judgment being made is important because subjective judgments are more likely to activate
stereotypes than objective judgments due to the inherent process of comparing the target to a
group in subjective decision-making (Macrae & Bodenhausen, 2000).
It is clear that conscious judgments can be influenced at an unconscious level by
stereotypes and the literature reveals numerous noticeable traits of targets that elicit such
stereotypes. Specifically, traits such as the target’s handshake (Bernieri & Petty 2011), facial
features (Naumann et al., 2009; Todorov, Mandisodza, Goren, & Hall, 2005; Willis & Todorov,
2006), clothing style (Lightstone, Francis, & Kocum, 2011; Naumann et al., 2009; Sebastian &
Bristow, 2008), physical attractiveness (Byrne, London, & Reeves, 1968; Dion et al., 1972;
Eagly et al., 1991; Jackson, 1992; Langlois et al., 2000; Naumann et al., 2009; Young, 1979),
and amount of make-up (Etcoff et al., 2011). Physical appearance is one of the most obvious and
accessible personal characteristics in social interactions (Dion et al., 1972; Naumann et al., 2009)
and many first impressions are based on stereotypes related to readily apparent physical
characteristics (Etcoff et al., 2011; Greenwald & Banaji, 1995; Willis & Todorov, 2006).
Each target that a rater comes into contact with has multiple noticeable traits and may fit
into a number of different categories (e.g., race/ethnicity, gender, perceived body size, perceived
social status, etc.). Which of the target’s traits activate a stereotype depends on the rater’s
background (e.g., the rater’s chronic prejudices and learning history), the context of the situation,
and the “prototypicallity” of the target (Gilbert & Hixon, 1991; Kahneman, 2003; Krieglmeyer &

16
Sherman, 2012; Macrae & Bodenhausen, 2000). A rater’s chronic prejudices, stereotypes that
are activated often, are more likely to be activated than stereotypes to which the rater is
infrequently exposed, especially in situations where the activated stereotype contains information
relevant to the interaction (e.g., level of competency) and the target exhibits highly stereotypic
(prototypical) behaviors. In a situation where these circumstances (background, context, and
prototypicallity) do not designate the same stereotype for activation, it is unclear which takes
precedence (Gilbert & Hixon, 1991; Kahneman, 2003; Krieglmeyer & Sherman, 2012; Macrae
& Bodenhausen, 2000).
One theory posits that the stereotypes that are not activated are inhibited (Macrae &
Bodenhausen, 2000). In other words, if a rater comes into contact with a multicategorical target
(e.g., an obese, Hispanic, female), one dominant trait (e.g., obese) activates one stereotype and
the other traits (e.g., Hispanic and female) are inhibited. For example, Sinclair and Kunda
(1999) provided empirical evidence that information consistent with the doctor stereotype was
more easily accessible than information consistent with the Black stereotype when participants
were provided with positive compared to neutral feedback from a Black doctor and were thus
motivated to view him as competent. The reverse was true when participants received negative
feedback; information consistent with the Black stereotype was more easily accessible and
information consistent with the doctor stereotype was inhibited (Sinclair & Kunda, 1999).
When a stereotype has been activated and stereotype-inconsistent information is present,
it is quickly recognized and activates system two for analysis of the differences. However,
dissonant information must be encountered and processed repeatedly in order to have a lasting
impact on system one knowledge and stereotypes (Kahneman, 2003; Macrae & Bodenhausen,
2000; Stanovich & West, 2000). Thus, the target is in the position of having to prove themselves

17
by repeatedly demonstrating stereotype-inconsistent traits in a manner that successfully combats
the effect of the bias. Furthermore, frequent inhibition of stereotypes that are inconsistent with
the presentation of the target may prevent exposure to and processing of stereotype-inconsistent
information that may have eventually had a long-term effect on the schema for that stereotype.
Despite the apparent implicit nature of the cognitive processes underlying stereotyping, it
is possible for the rater to make a continual concerted effort to thwart the activation of
stereotypes if they are highly motivated to do so (Macrae & Bodenhausen, 2000). In order to
successfully thwart stereotype activation, the individual must be aware of their biases and be
motivated to make an effort to thwart said biases (Macrae & Bodenhausen, 2000). Such an effort
is demanding and requires near continuous cognitive monitoring for the presence of the activated
stereotype, which, counterproductively, leads to increased accessibility of the stereotype and
associated information (Macrae & Bodenhausen, 2000). Furthermore, such an effort may result
in a rebound effect in that during periods of relaxed monitoring, increased stereotyping,
increased discriminatory behavior, and greater recall for stereotype-consistent attributes of the
target are more evident than if suppression was never attempted in the first place (Macrae &
Bodenhausen, 2000).
If a rater is unsuccessful in their attempt or unmotivated to suppress stereotype activation,
the activated stereotype may be applied when developing a judgment about the target person
(Gilbert & Hixon, 1991; Krieglmeyer & Sherman, 2012). Stereotype application is the use of the
activated knowledge in perception and judgment (Krieglmeyer & Sherman, 2012). Like
stereotype activation, stereotype application typically occurs implicitly and may occur even
when the trait that initially activated the stereotype is unrelated to the judgment being made
(Greenwald & Banaji, 1995; Krieglmeyer & Sherman, 2012). For example, a rater who is asked

18
to judge a target’s competency will rely upon any information available to them (e.g.,
information from a stereotype activated by the target’s level of physical attractiveness) to make a
judgment even though the two characteristics are completely unrelated (Greenwald & Banaji,
1995).
Stereotype application is dependent upon the rater’s cognitive load, the likelihood that the
use of a stereotype will improve the rater’s self-concept, and the rater’s level of motivation to
avoid stereotype application (Gilbert & Hixon, 1991; Krieglmeyer & Sherman, 2012; Macrae &
Bodenhausen, 2000). Similar to stereotype activation, stereotype application is highly likely to
occur in situations where the use of stereotypes to make a decision will serve an ego-protective
function (Macrae & Bodenhausen, 2000). However, whereas cognitive load decreases the
likelihood of stereotype activation, stereotype application is significantly positively correlated
with cognitive load (Gilbert & Hixon, 1991; Macrae & Bodenhausen, 2000). Thus, the busier a
rater is, the less likely the stereotype is to be activated, but stereotypes that have previously been
activated are significantly more likely to be applied during busier times (Gilbert & Hixon, 1991;
Macrae & Bodenhausen, 2000). Despite these conditions, if a rater is highly motivated to avoid
stereotypic processing, it is possible for the rater to thwart the application of stereotypes through
a method known as controlled cognitive processing (Macrae & Bodenhausen, 2000). Controlled
cognitive processing occurs when a rater is able to replace stereotypic thoughts with non-
prejudiced beliefs. However, to be effective the individual first must be aware of the stereotype,
and then should have knowledge about the magnitude and direction of the stereotype and must
make a continual concerted effort to thwart it (Krieglmeyer & Sherman, 2012; Macrae &
Bodenhausen, 2000).

19
While hindering stereotype activation and application is a difficult process, it is made
easier when additional individuating information is available about the target (Krieglmeyer &
Sherman, 2012). In contrast, the research is not clear as to whether additional and/or deeper
interactions between a target and a rater will decrease the likelihood of stereotype application. In
fact, some studies suggest that stereotype application occurs and the resulting judgments persist
despite available individuating information (Hosoda, Stone-Romero, & Coats, 2003; Jackson,
1992; Miller & Turnbull, 1986; Naumann et al., 2009; Wiggins, 1980; Willis & Todorov, 2006).
Stereotypes in Counseling
When counseling first begins, the client makes a judgment about counseling and the
counselor. We know that between 20 and 57% of outpatient mental health clients terminate after
session one (Brogan et al., 1999; Gearing et al., 2014) and that most people who prematurely
terminate mental health treatment do so between sessions one and four (Garfield, 1994; Gearing
et al., 2014). These rates are consistent with the medical and physical fitness fields, in which
noncompliance with appointments is a pervasive problem. No-show rates of at least 20% are
typical for first-time appointments in ambulatory treatment settings (Turkcan et al., 2013) and
range between 15 and 35% for follow-up appointments at primary care clinics (Salameh, Olsen,
& Howard, 2012). Approximately 45% of beginners drop out of structured exercise programs
within the first six months and psychological retention programs have been met with only
modest success (Dishman & Buckworth, 1996; Ekkekakis, Parfitt, & Petruzzello, 2011).
Therefore, judgments about treatment and determinations about continuation can likely be at
least partially attributed to first impressions, which, as discussed above, are often based on
implicit stereotypes (Etcoff et al., 2011; Greenwald & Banaji, 1995; Willis & Todorov, 2006).
The situation may be such that a decision is made about termination before additional

20
individuating information is able to be collected, deeper connections are able to be made, or the
provider has had an opportunity to prove that they do not fit the stereotype.
As mentioned previously, research has identified numerous physical characteristics that
may activate stereotypes and influence general social interactions. While we do not know
specifically what keeps individuals in counseling, we do know that the relationship is important
(Norcross, 2011; Wampold, 2001) so it is likely that a client’s initial impressions of their
counselor, and the relationship being built with the counselor, influence their decision to
terminate treatment prematurely. In fact, working alliance and counselor interpersonal skill have
been shown to be the best predictors of treatment outcomes (DiClemente, Carroll, Connors, &
Kadden, 1994; Horvath & Symonds, 1991; Meier & Davis, 2010; Najavits & Weiss, 1994;
Orlinsky et al., 1994) and studies have shown that clients who reported more positive perceptions
of their counselors stayed in treatment longer and evidenced better psychiatric functioning at
follow-up than those who did not (Kasarabada, Hser, Boles, & Huang, 2002). Furthermore,
participants who reported being satisfied with their treatment typically reported that they felt
emotionally attached or connected to their counselor whereas participants who reported being
unsatisfied with their treatment typically highlighted difficulties within the therapeutic
relationship as detracting from treatment outcomes (Ackerman & Hilsenroth, 2003; Bell,
Montoya, & Atkinson, 1997; Chang & Berk, 2009). While this might suggest that the negative
effects of bias may be offset by a strong therapeutic alliance, the client may decide to terminate
treatment before a strong alliance is developed. Thus, it is important to discuss what
characteristics may be related to stereotypes about interpersonal competency and relationship
development skills.
21
Specific counselor characteristics have been identified as being positively correlated with
the therapeutic alliance. Counselor warmth, respectfulness, trustworthiness, genuineness,
attentiveness, and empathy (as rated by the client) are often associated with therapeutic
improvement (Ackerman & Hilsenroth, 2003; Chang & Berk, 2009; Evans-Jones et al., 2009;
Fuertes & Brobst, 2002; Luborsky et al., 1971; Orlinsky et al., 1994). Additionally, client ratings
of improvement were correlated most highly with ratings of counselors as “understanding and
accepting” (Cooley & Lajoy, 1980; Hollander-Goldfein et al., 1989; Ribner & Knei-Paz, 2002),
friendly (Ribner & Knei-Paz, 2002), and caring (Ribner & Knei-Paz, 2002; Thompson & Hill,
1993). Overall, individuals rate therapeutic relationships based on various measures of counselor
social and interpersonal competence. As such, specific social and interpersonal characteristics
can be assessed to determine the client’s overall rating of the counselor’s competence.
Importantly, some research has shown that the “what is beautiful is good” stereotype
applies most prominently to areas of social and interpersonal competence such that attractive
people are rated more positively in social and interpersonal domains than unattractive people
(Eagly et al., 1991; Etcoff et al., 2011; Fuertes & Brobst, 2002; Snyder et al., 1977).
Furthermore, there has been considerable agreement about what constitutes attractiveness across
ethnicity, age, and socioeconomic status (Jackson, 1992; Langlois et al., 2000) indicating that the
relationship between the target’s attractiveness and more positive interpersonal ratings is not
dependent upon the ethnicity, age, or socioeconomic status of the rater. Therefore, it is highly
likely that physical attributes and beauty could affect ratings of the social and interpersonal
factors which influence diverse raters’ judgments of their relationship with others, including
individuals in the role of counselor.
22
In fact, there is significant empirical data to suggest that physical characteristics are
related to evaluations of the therapeutic relationship by both the counselor and the client.
Examples of such attributes found to be related to counselor impressions of the client and the
therapeutic relationship include, but are not limited to, racial/ethnic background of the client
(Thompson et al., 2004), physical attractiveness of client (Barocas & Vance, 1974; Cash & Kehr,
1978; Shapiro et al., 1976; Sue & Sue, 2012), and the client’s weight (Hassel, 2002; Pascal &
Kurpius, 2012). Typically, clinicians have been shown to favor, and therefore have better
treatment outcomes with, YAVIS (young, attractive, verbal, intelligent, and successful) clients as
opposed to QUOID (quiet, ugly, old, indigent, and dissimilar culturally) clients (Sue & Sue,
2012). Examples of attributes which have been found to be related to client impressions of the
counselor and the therapeutic relationship include, but are not limited to, racial/ethnic
background of the counselor (Cabral & Smith, 2011; Maramba & Nagayama Hall, 2002),
perceived age (Farney, Aday, & Breault, 2006; Hollander-Goldfein et al., 1989; Tall & Ross,
1991), and physical attractiveness of counselor (Carter, 1978; Cash et al., 1975; Evans-Jones et
al., 2009; Fuertes & Brobst, 2002; Harris & Busby, 1998; Paradise et al., 1980; Shapiro et al.,
1976).
Although specific physical attributes have been studied independently, some researchers
have focused more on demographic similarities between the client and the counselor. The
research is not clear, but the relationship between therapeutic alliance and demographic
similarities may be dependent upon the specific factor that the client and counselor have in
common (Cabral & Smith, 2011; Hollander-Goldfein et al., 1989; Luborsky et al., 1971). In a
meta-analytic review to clarify the literature, Montoya and Horton (2012) noted that the impact
of counselor-client similarity is dependent upon how much the counselor and client have in
23
common overall and how salient the commonality is to the client. It is likely that both individual
characteristics and similarities between the counselor and the client may impact the therapeutic
relationship, but additional factors may moderate the relationships.
Some researchers have hypothesized that attractive people actually exhibit more positive
qualities (e.g., more extraversion, more traditional attitudes, higher self-confidence and self-
esteem, better social skills, better mental health, slightly higher intelligence) than unattractive
people (Langlois et al., 2000). This has also been shown in the obesity literature as well such
that obese African American women tend to evidence higher anxiety levels than overweight and
normal weight African American women (Davis, Rovi, & Johnson, 2005) and obesity in women
has been associated with increased likelihood of depression, suicidal ideation, and suicide
attempts (Carpenter et al., 2000). The directionality of the relationship, however, is not clear, but
the tendency for overweight targets to exhibit more negative qualities than average weight
targets may be context specific. Burmeister et al. (2013) suggest that individuals who are obese,
and therefore part of a stigmatized group, might actually exhibit compromised performance in
situations where their social identity is devalued (social identity threat) or where stereotypes are
likely to be relevant (stereotype threat). As previously noted, obesity and attractiveness
stereotypes may be especially relevant in social situations (Eagly et al., 1991; Etcoff et al., 2011;
Fuertes & Brobst, 2002; Snyder et al., 1977). Therefore, target individuals may be more likely to
exhibit compromised performance in the context of counseling, a social situation. Thus it may
be possible that the overweight person is not being judged independently on their weight, but
rather portrays some other quality (i.e., self-efficacy or self-esteem) nonverbally which
influences ratings. On the contrary, some studies have used the same target individual in both
the overweight and average weight conditions by altering the photograph to make the target
24
appear overweight using cosmetics, prostheses, or Photoshop (Dean et al., 2005; McKee &
Smouse, 1983; Melville, & Maddalozzo, 1988; Pingitore et al., 1994). Given that the only
difference between the targets in these studies is their apparent weight, it is highly likely that the
factor influencing competency ratings provided by the rater’s is the target’s perceived weight.
Weight Stereotypes in Counseling
Though the specifics of the relationship are not clear, it is apparent that the personhood
and individual characteristics of the counselor are inextricably intertwined with the outcome of
counseling (Norcross, 2011). The literature reveals that the counselor’s physical characteristics
are correlated with the client’s judgments about the counselor and that the client’s weight is
correlated with the counselor’s impressions about the client (Pascal & Kurpius, 2012). What is
less clear, however, is the relationship between the counselor’s weight and the client’s
impressions of the counselor. Wiggins (1980) examined this question through ratings on the
Counselor Rating Form (CRF) provided by graduate counselors-in-training who presented as
mock clients to eight different counselors who had been pre-selected and ranked according to
their perceived weight (normal weight or overweight). Wiggins (1980) found a significant
correlation between the counselor’s weight and the ratings that they received on the CRF such
that overweight counselors of both genders were rated as less competent in all areas than their
normal weight counterparts. While these results are significant, it is important to note that the
clients in the Wiggins (1980) study knew in advance that they would be rating the counselors and
on what they would be rating them. Effects of implicit biases on ratings are reduced when
individuals have been asked to focus on the task of judgment and the likelihood of inhibition of
application of the stereotype is increased (Bohner & Dickel, 2011; Greenwald & Banaji, 1995).
Thus, it is possible that the real-world effect of weight bias on counseling sessions may be larger
25
than the effect found in this study. Alternatively, the sample size (n = 8) in this study was small
and Wiggins (1980) did not control for other counselor attributes (e.g., attractiveness and style of
clothing) which are known to be related to competency ratings. Furthermore, each client
participated in one session with each counselor and interpersonal differences between the
counselors cannot be ruled out as contributing to the effect (Wiggins, 1980).
McKee and Smouse (1983) also attempted to study the relationship between counselor
weight and ratings of competency provided by clients, but recruited actual clients presenting to a
university counseling center as participants. The clients met with an intake counselor, were
presented with a picture of a second counselor (normal weight or overweight), listened to an
audiotaped explanation of what to expect from counseling which they were told was recorded by
the pictured counselor, and then asked to rate the pictured counselor using the CRF (McKee &
Smouse, 1983). The results of the study were not consistent with those obtained by Wiggins
(1980) and no significant relationship was found between counselor’s weight and the ratings that
the counselor received on the CRF (McKee & Smouse, 1983). The sample (n = 80) in the
McKee and Smouse (1983) study was larger than that in the Wiggins (1980) study and did not
provide an opportunity for the client to interact with the counselor prior to providing ratings.
Although the participants in the McKee and Smouse (1983) study did not have an opportunity to
interact with the counselors, Langlois et al. (2000) and Jackson (1992) provided evidence that
pictures are just as valid as personal interactions in these types of studies. However, the pictures
of counselors that were used were altered such that the head of the normal weight counselor was
photographically imposed onto an overweight body in order to control for attractiveness (McKee
& Smouse, 1983). It is unclear if the photographed face was altered to ensure fit between the
head and body and interpersonal factors during the intake session cannot be ruled out as having

26
affected the results (McKee & Smouse, 1983). Additionally, each photograph was accompanied
by a written description of the counselor (McKee & Smouse, 1983) and the possibility that the
stereotype associated with the counselor’s weight was inhibited due the activation of a stereotype
associated with the written description cannot be ruled out.
Of the extant literature, the study conducted by Wiggins (1980) is most consistent with
recent works examining weight bias in the medical and physical fitness fields. While one study
suggests that the body weight of physical fitness instructors is not significantly related to student
attitudes toward the instructor (Dean et al., 2005), the same study suggests that the body weight
of physical fitness instructors is significantly related to student performance on outcome
measures (e.g., a class exam). Furthermore, other studies suggest that physical fitness is one of
the most important determining factors in selecting a physical fitness instructor or performance
enhancement consultant (Evans et al., 2005; Lubker et al., 2005) and body weight of the
instructor or consultant is significantly and negatively related to ratings of the instructor’s or
consultant’s knowledge, students’ performance on a content examination, students’ intent to
exercise, and students’ ratings of the teacher’s likability, expertise, and appropriateness as a role
model (Lubker et al., 2005; Melville & Maddalozzo, 1988). Similarly, research in the field of
medicine has shown that, beginning in childhood, patients are more likely to rate obese
physicians as more judgmental, less likeable, and less expert (Bleich et al., 2013; Brudvig &
Borna, 2012). Furthermore, patients reported higher levels of confidence in counseling for
treatment of illness and health advice from non-obese than from obsess physicians and reported
increased willingness to comply with the exercise recommendations made by physicians of a
“normal” weight and physicians who were “good exercise role models” (Harsha et al., 1996;
Hash et al., 2003). Importantly, most research in the field tends to the find the strongest negative

27
relationship between weight and competency ratings when the target is categorized as obese, but
the relationship, while it still exists, is often not significant when the target is classified as
overweight (Bleich et al., 2013; Brudvig & Borna, 2012; Dean et al., 2005; Hash et al., 2003).
Weight Stigma Today
No additional studies were found examining the effect of implicit bias related to
perceived counselor body size on ratings of competency provided by clients. Furthermore, both
studies described above were conducted in the 1980s. Since that time, the prevalence of obesity
in the United States has been steadily rising. According to the National Health and Nutrition
Examination Surveys, the percentage of US adults classified as obese rose from 15.1% between
1976 and 1980 to 22.9% between 1988 and 1994 (Flegal et al., 1998) to 35.7% in 2010 (Ogden
et al., 2012). Moreover, there has been an increased national focus on obesity in the United
States. Media coverage of obesity-related topics more than quadrupled between 1999 and 2005
(Cohen et al., 2005). The increased coverage of obesity-related issues is not always positive and,
in fact, research has noted increased stigmatization of obesity. According to Andreyeva et al.
(2008), experience of discrimination based on weight increased by 66% between 1995 and 2006.
This is bolstered by evidence of an increasingly thin beauty ideal, the promotion of thinness as a
measure of beauty, and media stigmatization of obesity as compared with the 1980s (Puhl &
Heuer, 2009; Sypeck et al., 2004). In media, there has been a prominent movement toward the
use of more full-body shots and smaller models dressed in more revealing clothing with no
corresponding decrease in the age of the model (Sypeck et al., 2004). Models presented in media
are intended to entice people to identify with them and purchase the product and are therefore
considered representative of how people perceive beauty (Cohen et al., 2005; Sypeck et al.,
2004). The beauty ideal is based on perception rather than fact (i.e., numerical weight of the
28
model) and, similarly, studies have shown that the perceived weight of an individual or the self
may be more important psychologically than the actual weight (Eaton, Lowry, Brenew, Galuska,
& Crosby, 2005).
Studies show that people perceived as obese, whether or not they a medically categorized
as obese, are stigmatized and discriminated against at work, at school, and in healthcare settings
(Pingitore et al., 1994; Puhl & Brownell, 2001; Puhl & Heuer, 2009). Parents have been shown
to provide less college funding for their overweight children than for their average weight
children (Pingitore et al., 1994; Puhl & Brownell, 2001; Puhl & Heuer, 2009) and obese
individuals report that they feel “judged” when going into the doctor’s office and working out at
the gym (Cohen et al., 2005). The effect is also found in educational settings where the number
of post-interview offers of admission has been shown to be negatively correlated with the BMI
of the applicant (Burmeister et al., 2013). A recent example of this surfaced when one university
professor of psychology posted on a popular social media site, “Dear obese PhD applicants: if
you didn’t have the willpower to stop eating carbs, you won’t have the willpower to do a
dissertation #truth” (Kingkade, 2013).
Psychological organizations, such as the American Psychological Association, medical
organizations, and mental health professionals are not immune to biases about obesity (Hassel,
2002; Pascal & Kurpius, 2012). For example, an article published in the Journal of the American
Medical Association (JAMA; Gaziano, 2010) attributes obesity to “adverse lifestyle habits,”
including inactivity, and increased medical spending has been attributed to increasing rates of
obesity, poor diet, and inactivity (Finkelstein, Trogdon, Cohen, & Dietz, 2009). The terminology
used to discuss obesity in these publications holds inherently negative connotations.
Furthermore, obesity was recently declared a disease by the American Medical Association

29
(AMA; Drummond, 2013). Although obesity may be considered unhealthy and has been shown
to be correlated with increased likelihood for certain diseases and health problems (Centers for
Disease Control and Prevention [CDC], 2012), the bias is likely to extend beyond a desire to
promote health. A significant number of participants, both obese and non-obese, in one study
were willing to make sacrifices up to and including the loss of one year of life and the loss of
health to avoid being obese (Schwartz et al., 2006). Moreover, Kluck (2010) found that
receiving messages from parents to control what they eat to manage weight was not significantly
less damaging to daughters’ body image than critical messages about weight. In her study, the
relationship between parental messages to control what one eats to manage weight and increased
body dissatisfaction were not a function of BMI.
The focus on obesity tends to place the impetus upon on the individual (Cohen et al.,
2005), which increases the belief that obesity is somehow the individual’s fault. Stereotypes
associated with obesity include laziness, lack of self-control, low intelligence, and
noncompliance with health recommendations (Cohen et al., 2005; Harris et al., 1982; Jackson,
1992; Miller & Lundgren, 2010; Puhl & Brownell, 2001; Puhl & Heuer, 2009; Saguy & Gruys,
2010). Even individuals who are themselves classified as obese, including obese mental health
professionals, exhibit an implicit preference for thinner people and an implicit stereotype of fat
people as lazy (Hassel, 2002; Puhl & Brownell, 2001; Schwartz et al., 2006). Categorization of
obesity as the individual’s fault is supported by doctors and the medical and insurance industries.
In the DSM-5, obesity is listed under the heading Nonadherence to Medical Treatment (APA,
2013) and subconscious biases in the health community are well-documented (Cohen et al.,
2005; Puhl & Heuer, 2009). One study even found that twenty-four percent of nurses reported
being “repulsed” by obese patients (Puhl & Brownell, 2001). In contrast, media explanations of

30
anorexia and bulimia, disorders socially associated with thinness, have tended to focus on
numerous factors outside of the individual’s control (Saguy & Gruys, 2010). Obesity is often
attributed to character deficits (Klacyznski, Goold, & Mudry, 2004; Miller & Lundgren, 2010)
and has been increasingly associated with amoral behavior as evidenced by the emergence of the
obesity-morality myth (Cohen et al., 2005; Saguy & Gruys, 2010). In a similar vein, Schvey et
al. (2013) found that the perceived weight of a defendant in a trial may influence juror
perceptions of guilt and potential for recidivism.
Impulsivity and Weight
It is clear that U.S. society often places the impetus for being overweight and obese upon
the individual and stereotypes such individuals as lazy, amoral, and lacking impulse control
(APA, 2013; Cohen et al., 2005; Klaczynski et al., 2004; Puhl & Brownell, 2001). Impulsivity,
or impairment of impulse control, is a complex concept popularly defined as, “A predisposition
toward rapid, unplanned reactions to internal and external stimuli without regard to the negative
consequences of these reactions to the impulsive individual or to others” (Stanford et al., 2009, p.
1784). The literature reveals that a stereotype is more likely to be activated if the target’s
noticeable trait is salient to the situation (Gilbert & Hixon, 1991; Kahneman, 2003; Krieglmeyer
& Sherman, 2012; Macrae & Bodenhausen, 2000) and there is a prominent social link between
obesity and impulsivity (APA, 2013; Cohen et al., 2005; Klaczynski et al., 2004; Puhl &
Brownell, 2001). Therefore, it can be hypothesized that, if a client views themselves as highly
impulsive, incoming information related to impulsivity will be more salient than non-related
information and there is increased likelihood that the client’s preconceived notions about obese
people (who are often stereotyped as impulsive, e.g., Cohen et al., 2005) will be activated
(Kahneman, 2003; Krieglmeyer & Sherman, 2012; Macrae & Bodenhausen, 2000).
31
Thus, it is possible that individuals who perceive themselves as having any trait socially
associated with obesity (Cohen et al., 2005; Harris et al., 1982; Jackson, 1992; Kahneman, 2003;
Krieglmeyer & Sherman, 2012; Macrae & Bodenhausen, 2000; Miller & Lundgren, 2010; Puhl
& Brownell, 2001; Puhl & Heuer, 2009; Saguy & Gruys, 2010), including high impulsivity, may
be more susceptible to implicit stereotype activation of that same stereotype (Kahneman, 2003)
and therefore more likely to negatively evaluate the counselor’s competency and ability to
provide treatment than an individual who perceives themselves as having less of the trait (e.g., as
being less impulsive). Therefore, when examining the relationship between the counselor’s body
size and ratings of competency provided by clients, it is important to consider what effect the
client’s level of impulsivity might have.
Weight Stigma and Gender
One additional factor which may increase the likelihood of stereotype activation is
gender. Prior studies that have examined the relationship between a target’s perceived body
weight and evaluations (e.g., competency) of the target by a rater have not found the gender of
the target to be an important factor (Cash & Kehr, 1978; Harris et al., 1982; Paradise et al., 1980;
Wiggins, 1980). However, more recent studies suggest that women are held more stringently to
physical appearance standards than men (Burmeister et al., 2013; Carpenter et al., 2000; Eagly et
al., 1991; Gortmarker et al., 1993; Harris et al., 1982; Jackson, 1992; Miller & Lundgren, 2010;
Pingitore et al., 1994; Schvey et al., 2013; Stake & Lauer, 1987). Thus, interacting with a female
counselor may increase the salience of size-related stereotypes and thus increase the likelihood
that the stereotype will be activated. Gender match between the pictured counselor and the
participant is unlikely to be important as demographic similarities between counselor and client
have been shown to be of limited importance (Montoya & Horton, 2012) and men and women

32
have been found to be equally likely to endorse overall weight bias (Jackson, 1992; Langlois et
al., 2000; Pingitore et al., 1994).
Summary
In conclusion, interpersonal interactions are highly influenced by the activation and
application of stereotypes, which aid in the development of first impressions that typically
remain stable across time. The specific trait that activates a stereotype is one that is contextually
salient. In the context of relationship development and judgments about competency, which
typically occur early in psychotherapeutic relationships and are important for the continuation of
treatment, attractiveness variables have been shown to be particularly relevant. Once
confounding physical appearance and attractiveness variables (Cabral & Smith, 2011; Carter,
1978; Cash et al., 1975; Evans-Jones et al., 2009; Fuertes & Brobst, 2002; Harris & Busby, 1998;
Hollander-Goldfein et al., 1989; Maramba & Nagayama Hall, 2002; Paradise et al., 1980;
Shapiro et al., 1976; Tall & Ross, 1991) have been controlled for, body size is likely to be a
significant variable in the activation of stereotypes in the context of relationship development
and judgments about competency. Such a finding would be consistent with extant literature in
the fields of medicine and physical fitness, which suggest that non-obese physicians and physical
fitness instructors are viewed more positively than obese physicians and physical fitness
instructors (Bleich et al., 2013; Brudvig & Borna, 2012; Dean et al., 2005; Evans et al., 2005;
Harsha et al., 1996; Hash et al., 2003; Lubker et al., 2005; Melville & Maddalozzo, 1988). The
relationship between counselor body weight and client perceptions of the counselor was
examined in the 1980s, but the results of the two studies were contradictory (McKee & Smouse,
1983; Wiggins, 1980). Although there was some documentation of stigmatization of individuals
perceived to be overweight and obese in 1980 (Harris et al., 1982), there is no clear evidence to
33
suggest that clients at that time evidenced significant bias against overweight and obese
counselors. However, since 1980, there has been an increase in the reported amount of weight-
based discrimination (Andreyeva et al., 2008), a larger portion of the population is now classified
as obese (Ogden et al., 2012), significantly more attention has been paid to the “obesity
epidemic” in the media (Cohen et al., 2005), and there has been an increasingly thin beauty ideal
(Sypeck et al., 2004). Furthermore, Vocks et al. (2007) specifically asked participants diagnosed
with an eating disorder or an anxiety disorder about the importance of the body size of their
counselor and significant preferences for average sized counselors were recorded. Therefore, it
is necessary to reexamine the relationship in today’s cultural milieu and, if an effect is found, to
scrutinize other factors (e.g., impulsivity and gender) that may influence the relationship between
obesity and ratings of competence.
34
CHAPTER III. METHOD
This study was an experimental and descriptive study designed to elucidate the
relationship between the identified central themes of weight bias, impulsivity, counselor
competence, and counselor gender. Specifically, I examined if there was a significant negative
relationship between how competent participants rated a pictured counselor to be and the
perceived body size of the pictured counselor. Additionally, I evaluated the type of effect
participants’ self-reported level of impulsivity and the counselor’s gender had on the relationship
between perceived body size of the pictured counselor and competency. The population of
interest, measures that were used, and study design and procedures are further discussed.
The present study aimed to address the following hypotheses: The perceived body size of
the counselor is significantly and negatively correlated with participants’ subjective ratings of the
counselor’s competency. The participant’s level of impulsivity moderates the relationship such
that the significance of the relationship between perceived counselor body size and perceived
competency is greater at higher levels of participant impulsivity. The counselor’s gender
moderates the relationship such that the significance of the relationship between perceived body
size of the counselor and perceived competency is greater for female counselors than for male
counselors.
35
Methodology
Participants
Participants were solicited through online postings on Amazon Mechanical Turk
(MTurk.com), an internet site that allows researchers to solicit people from a large pool of
anonymous individuals to participate in research studies (e.g., surveys) for compensation.
Inclusion criteria included age, gender identity, profession, and country of residence at the time
of the survey. Individuals were required to be at least 19 years old to participate because 19 is
the age of consent in some states. Additionally, although the literature suggests that men and
women are equally likely to endorse overall weight bias (Jackson, 1992; Langlois et al., 2000;
Pingitore et al., 1994), no recent studies were found to confirm this speculation. Therefore, only
participants who identified as a woman were eligible to participate in order to avoid any potential
effects of participant gender on the outcome. Thirdly, participants were required to reside in the
United States at the time of survey completion because all information upon which the
hypotheses were based (e.g., obesity rates, rates of weight discrimination, and beauty ideals)
were obtained from studies conducted with participants in the United States. The Amazon Turk
posting for this survey was accessible only to participants whose country of residence was
identified as the United States in their Amazon Turk account profile. While cross-cultural
comparisons would be informative and should be conducted in the future, it is likely that beauty
ideals and size-based stereotypes may vary across cultures and that analysis is, therefore, beyond
the scope of this study.
In addition, specific unique characteristics of participants were used to exclude
individuals who might represent unique subpopulations within the overall population of adult
women residing in the U.S. Specifically, participants were required to work, or be a
36
student/trainee, in a field other than counseling (e.g., job titles other than counselor,
psychologist, social worker, or therapist) because participants who were counselors might rate
the pictured counselors differently than participants who did not work as counselors (for
example, they may recognize there is little information available to make an informed rating of
competency). In addition, exclusion criteria also included any self-reported current or historical
eating disorder and any self-identification inconsistent with the stated inclusion criteria. Given
that individuals with eating disorder diagnoses have been shown in the literature to exhibit
significant implicit and explicit weight bias (Vocks et al., 2007), participants were asked to
provide information about their ongoing or historical struggles with disordered eating and data
analyses were conducted both with and without data from participants who endorsed a history of
a diagnosed eating disorder in order to determine if an effect existed.
An a priori power analysis revealed that a sample size of 130 was needed to achieve 80%
power for finding a medium effect size when using an alpha level of .05 (Cohen, 1988). Four
hundred and two participants responded to the advertisement to participate. Of the 402 people
who attempted to take the survey, 3 exited the survey prior to providing consent to participate, 12
completed only one of the two required measures (BIS–Brief and CRF–S), 65 identified as male
and were excluded from participating, and 15 were excluded from participating for identifying
their profession as a counselor (n = 3), psychologist (n = 3), social worker (n = 4), or trainee in
the field of counseling, psychology, therapy or social work (n = 5). A total of 307 participants
responded to all measures and were included in the analysis.
All participants included in the analysis reported that they resided in the United States at
the time of survey completion, identified as a woman, and were not working or training in the
fields of counseling, psychology, therapy, or social work. Participants reported a mean age of
37
35.17 (i.e., ranging from 19 to 72; SD = 12.301) and the majority (77.2%, n = 237) of
participants reported being between the ages of 19 and 45. Regarding racial and ethnic
background, 237 (77.2%) participants identified as White or Caucasian, 38 (12.4%) as Black or
African American, 20 (6.5%) as Asian, 12 (3.9%) as Hispanic or Latino, six (2.0%) as Biracial or
Multiracial, two (0.7%) as Other, two (0.7%) as American Indian or Alaska Native, and one
(0.3%) as Native Hawaiian and Other Pacific Islander. Of the two participants who identified
their racial and ethnic background as Other, one participant described her background as “South
American” and the other as “Moor.” Participants were encouraged to select all race and ethnicity
labels that apply to them and eight participants selected more than one label. Thus, the totals do
not equal the sample size (n = 307). In the current study, the majority of participants identified
as either single (n = 118; 38.4%) or married (n = 105; 34.2%) and reported having either
completed some college courses (n = 89; 29.0%) or received a degree from a four-year university
(n = 93; 30.3%). Demographic characteristics of the sample are further delineated in Table 1.

38
Table 1
Demographic Characteristics of Participants
Demographic Variable n %
Marital Status
Single 118 38.4
Partnered/Long-term Relationship 48 15.6
Married 105 34.2
Separated 2 0.7
Divorced 26 8.5
Widowed 7 2.3
Other (i.e., remarried) 1 0.3
Highest Level of Education Completed
Graduate degree 42 13.7
Some graduate school 19 6.2
Degree from a four-year university 93 30.3
Degree from a two-year college 29 9.4
Vocational School 11 3.6
Some College 89 29.0
High school diploma 19 6.2
General Education Diploma (GED) 4 1.3
Other (i.e., some high school) 1 0.3
39
Information about participants’ psychotherapy history and BMI was also collected. The
participants in this study self-reported their height (in inches) and weight (in pounds), which
were then used to calculate their BMI. Height values for two participants (i.e., 164 inches and
163 inches) were determined to be outliers and were considered unlikely to be valid given that
the values represented heights over 13 feet and resulted in BMI values under 5. Therefore, the
data points were removed from the sample and replaced using the Series Mean method. Missing
height data for one participant and missing weight data for two participants were also replaced
using the Series Mean method. This resulted in a mean BMI of 27.36 (i.e., ranging from 16.64 to
72.18; SD = 8.55), which is considered overweight. The largest percentage of the sample (n =
144; 46.9%), however, reported a BMI in the normal range (i.e., a BMI ranging from 18.5 to
24.9) and the median BMI of the sample was 24.86, which is considered normal. This is not
consistent with the statistics available about the US population, 68.5% of which is considered to
be overweight or obese (Ogden, Carroll, Kit, & Flegal, 2012). Furthermore, it is important to
note that although the BMI values reported above are consistent with specific body types (e.g.,
underweight, normal, overweight, and obese), BMI is based only on height and weight
information and may not accurately represent body shape/size nor the health of the individual.
For example, individuals with significant muscle mass would have higher BMIs than other
individuals who have the same amount of body fat without significant muscle mass. The group
with significant muscle mass may have a high BMI without being considered clinically obese. In
regards to history of involvement with psychotherapy, the majority of the sample (67.4%)
reported involvement in four or fewer session of psychotherapy or counseling in their lifetime
with 48.2% (n = 148) of the sample reporting that they had never engaged in psychotherapy or
counseling. Although, the majority of the sample (n = 282; 91.9%) reported that they were not

40
engaged in psychotherapy or counseling at the time of survey completion, the percentage of
participants engaged in psychotherapy or counseling at the time of the survey (8.1%) was larger
than expected. Specifically, only 3% of the U.S. population engage in therapy each year
(Weissman et al., 2006). Additional information about participants’ BMI and engagement with
psychotherapy can be found in Table 2.
Table 2
Participants’ BMI and History of Psychotherapy
Variable n %
BMI Categorya
Underweight 15 4.9
Normal Weight 144 46.9
Overweight 68 22.1
Obese 80 26.1
Number of prior psychotherapy or counseling sessions
0 148 48.2
1 – 4 59 19.2
5 – 10 27 8.8
More than 10 73 23.8
Engaged in psychotherapy or counseling at time of survey
Yes 25 8.1
No 282 91.9
aBMI weight categories are defined by the Centers for Disease Control and Prevention (CDC)

41
As noted previously, information about the participants’ struggles with disordered eating
was also collected. Data was not available about disordered eating for one survey participant,
but the majority of the sample (n = 289; 94.1%) reported that they had never been diagnosed
with an eating disorder. Of the 18 participants who reported that they had been diagnosed with
an eating disorder, two reported having been diagnosed with three separate conditions (i.e.,
Anorexia Nervosa, Bulimia Nervosa, and Binge-Eating Disorder), one reported being diagnosed
with both no eating disorder and with Bulimia Nervosa, one reported being diagnosed with both
Binge-Eating Disorder and Bulimia Nervosa, two reported being diagnosed with Anorexia
Nervosa, four reported being diagnosed with Bulimia Nervosa, four with Binge-Eating Disorder,
and four with some other eating disorder. Of the four people who reported receiving some other
eating disorder diagnosis, one described her diagnosis as “ED-NOS (restrictive),” another
described her diagnosis as “obesity,” another as “glutton,” and one did not provide additional
details about her diagnosis. Analyses run without participants who reported symptoms of
disordered eating omitted responses from these 18 individuals.
Measures
Demographic questionnaire. A 13 item demographic questionnaire was administered to
all participants (see Appendix A). Both fill-in-the-blank and multiple-choice items were
included to gather information such as age, gender, race and ethnicity, the highest level of
education completed, mental health treatment history, and weight.
Counselor rating form–Short (CRF–S). The range of opinions as to what constitutes
competency makes the task of measuring a counselor’s abilities difficult and competency tends
to be measured most effectively from within a specific theoretical framework (Sharpless &
Barber, 2009; Thompson & Hill, 1993). The Counselor Rating Form–Short (CRF–S), developed

42
by Corrigan and Schmidt (1983), is one cross-theoretical measure that clients can use to evaluate
a counselor’s competency. The measure specifically evaluates various characteristics situated on
three dimensions of counselor behavior (expertness, attractiveness, and trustworthiness), one of
which is the interpersonal domain (Barak & LaCrosse, 1975). The CRF–S was administered to
all participants and was used to assess participants’ ratings of the pictured counselors’
competency. The CRF–S is a shortened version of the Counselor Rating Form (CRF), which has
been used in similar studies across the literature (Cash & Kehr, 1978; Evans-Jones et al., 2009;
Fuertes & Brobst, 2002; McKee & Smouse, 1983). The CRF was developed by Barak and
LaCrosse (1975) to investigate three proposed dimensions of counselor behavior: expertness,
attractiveness, and trustworthiness. Scale authors identified 83 adjectives that, according to
literature available at the time, described counselor behavior. The list was presented to a panel
of expert judges who categorized each adjective into one of the three proposed dimensions of
counselor behavior. Adjectives whose categorization yielded at least 75% inter-rater agreement
were selected to be part of the instrument. An antonym was identified for each selected adjective
and seven-point bipolar scales were created for each item pair. Examples of adjective pairs
include: Expert/Inexpert, Informed/Ignorant, and Reliable/Unreliable. In total, the final scale
contains 36 seven-point bipolar scales on which the participant is asked to rate a counselor.
The CRF–S was developed by Corrigan and Schmidt (1983) to address some potential
limitations of the CRF, including the reading level, and to decrease the length of the measure
while maintaining reliability of the subscales. The final version of the CRF–S contains four
items on each of the three subscales resulting in a 12-item measure with an eighth grade reading
comprehension level (Corrigan & Schmidt, 1983) and has been shown to be at least
psychometrically comparable to the full CRF measure (Epperson & Pecnik, 1985). Corrigan and

43
Schmidt (1983) also noted a negative connotation associated with the antonyms identified for the
CRF bipolar scales and opted instead to remove the antonyms and have participants rate only the
extent to which a counselor demonstrates each positive characteristic, the 12 adjectives originally
identified for use on the CRF, using seven-point Likert scales anchored by (1) not very and (7)
very. The measure also includes the question, “How likely would you be to go to this
counselor?” Participants respond to the question using the same seven-point Likert scale, but the
response is not calculated into the total score of the instrument.
Both the CRF and CRF–S were originally designed to provide subscale scores for
counselors on each of the three dimensions of behavior: expertness, trustworthiness, and
attractiveness (Barak & LaCrosse, 1975; Corrigan & Schmidt, 1983). Although validation
research has confirmed the existence of three distinct factors on both instruments, high interscale
correlations have been consistently recorded, which suggests that the scale may be measuring
one general factor and may be more reflective of the respondent’s general opinions about the
counselor (Heppner et al., 2008; Wilson & Yager, 1990). Several studies have found good
internal consistency (.89 < α < .97) and reliability constants and supported the use of the total
CRF–S score as a global measure of counselor competence (e.g., Atkinson & Wampold, 1982;
Constantine, 2007; Guinee & Tracey, 1997; Harari & Waehler, 1999; Kokotovic & Tracey,
1987; Tracey, Glidden, & Kokotovic, 1988). Thus, only total scores obtained on the CRF–S
were used for the purposes of this study. Counselor’s total scores can range from 12 to 84, with
lower scores representing less perceived competency.
Barratt impulsiveness scale–Brief (BIS–Brief). The BIS–Brief was administered to all
participants and was used to assess participants’ self-reported impulsiveness. The BIS–Brief is a
shortened version of the Barratt Impulsiveness Scale–11 (BIS-11). The original Barratt

44
Impulsiveness Scale (BIS) was developed in 1959 to assess the personality and behavioral
construct of impulsiveness (Barratt, 1959). The BIS–11 marks the eleventh revision of the
instrument (Patton et al., 1995), and is a 30-item self-report measure that is considered to be one
of the most widely used measures of impulsivity in both research and clinical settings (Stanford
et al., 2009). The BIS series has been designed specifically to avoid confounding symptoms of
anxiety and impulsivity (Barratt, 1959). Furthermore, BIS–11 examines each of three proposed
dimensions of impulsivity: motor impulsiveness, non-planning impulsiveness, and attentional
impulsiveness (Patton et al., 1995). Despite the potential usefulness of the first- and second-
order subscales for conceptualizing an individual’s self-reported impulsiveness on each of the
proposed dimensions of impulsivity, the majority of published studies that have used the BIS–11
examine only the overall impulsiveness of the respondent by calculating the total score of the
measure (Stanford et al., 2009). Research has supported the total score of the BIS–11 to be an
internally consistent measure of impulsivity (Patton et al., 1995) and published reliability
coefficients (Cronbach’s) for the BIS–11 total score range from 0.72 to 0.83 (Steinber, Sharp,
Standford, & Tharp, 2013).
Steinberg et al. (2013) re-examined the factor structure of the BIS–11 and did not find
support for the three-factor model. Furthermore, they concluded that many of the items on the
BIS–11 were unrelated to the overarching factor of impulsivity. Thus, they developed and
validated a shorter version of the BIS–11, the BIS–Brief, which included only items from the
BIS–11 that were found to be most consistent with a unidimensional model of impulsivity
(Steinberg et al., 2013). The final BIS–Brief measure includes eight items from the BIS–11 and
has been shown to be at least psychometrically comparable to the full BIS–11 measure
(Steinberg et al., 2013). Scores on the BIS–Brief also differentiate between groups and shows

45
similar patterns of correlations to what is observed with the BIS–11 (Steinberg et al., 2013). The
items are scored on a 4-point scale (1 = rarely/never, 2 = occasionally, 3 = often, 4 = almost
always/always) with items one, four, five, and six being reverse scored. Total scores can range
from 8 to 32, with higher scores representing greater levels of impulsivity. However, there are
no available empirically supported cutoffs to determine at what score respondent’s impulsivity
level may be problematic or clinically significant.
Models
Langlois et al. (2000) and Jackson (1992) provided evidence that pictures are just as valid
as personal interactions for the purpose of research studies such as this one. Therefore, images
of counselors (see Appendix B) in conjunction with written descriptions (see Appendix C) were
used in this study in place of interpersonal interactions with the counselors. Two professionally
and similarly dressed (Naumann et al., 2009; Sebastian & Bristow, 2008; Lightstone et al., 2011)
models, one male and one female, were created using the Model My Diet software. The height
values entered for both models was five feet eight inches and the four body weights entered into
the software to generate models representing various body sizes were 119 pounds, 151 pounds,
183 pounds, and 215 pounds. The same weights were used for both the male and female models.
The specific weight values were selected to maintain an equivalent increase in weight (i.e., 32
pounds) from one model to the next and to ensure that each BMI category, as defined by the
CDC, was represented. Although the height and weight values were selected to match specific
BMI categories (e.g., the height and weight values entered for the smallest models are equivalent
to a BMI of 18.09, which is considered underweight according to the CDC), there is no research
regarding the ability of the Model My Diet software to accurately depict BMI. All eight models
used the same height. The figure of the model was altered using the software so that the same

46
model characteristics were used for each body size (the smallest, the second smallest, the second
largest, and the largest). For all demographic options selected to create the models in the Model
My Diet program refer to Table 3. All models were presented in black and white and the images
were cropped such that nothing below the models knee was visible.
Table 3
Demographic Options Selected to Generate Models
Demographic Feature Female Model Male Model
Height 5’8” 5’8”
Body Shape Apple Regular
Bust (female)/Belly (male) Small-Medium Round
Skin Tone Lightest Available Lightest Available
Age More Mature More Mature
Nose Narrower Narrower
Lips Fuller Fuller
Eye Shape Round Round
Hair Color Blonde (Lightest Available) Blonde (Lightest Available)
Hair Style Stock option (shoulder length) Short with side part
Background Blank Blank
Outfit Formal Pink Shirt
Computer generated models were used in place of pictures or videos of people to control
for individual differences in physical appearance (e.g., attractiveness, hair style, clothing, skin
color/tone, and age) that may occur across people. Although computer generated models
reduced the possibility that the proportions of the counselor would be perceived to look unnatural
47
they may distort the picture in other ways. Use of other methods to change the body size of a
pictured counselor while controlling for attractiveness (e.g., cosmetics, prostheses, or using
Photoshop technology to impose the head of one person onto the body of another) was found to
produce proportions that looked unnatural in prior research (Dean et al., 2005; McKee &
Smouse, 1983; Melville, & Maddalozzo, 1988; Pingitore et al., 1994). The same written
description (see Appendix C) accompanied each picture for all models, both male and female,
and did not include any gender pronouns (see Appendix D). The narratives were created based
on collaboration with three professionals in the field of mental health and were designed to
provide minimal detail about the model. The narrative had a Flesch-Kincaid reading grade level
of 11.1.
Cabral and Smith (2011) completed a meta-analysis of 53 studies and concluded that
racial-match between client and counselor is not a significant determinate in counseling
outcome. Therefore, racial differences between the pictured counselor and the participant were
considered unlikely to be a significant confounding factor. However, no significant data was
found regarding the difference in application of weight stereotypes across racial and ethnic
groups and, to avoid the potential confound, all pictures presented were of the same race. The
2013 demographic profiles of the American Psychological Association and the American
Counseling Association reveal that the majority of the members of both organizations are
Caucasian (American Psychological Association Center for Workforce Studies, 2013; R. A.
Sites, American Counseling Association Member Programs Coordinator, personal
communication, March 4, 2014). Therefore, the pictured counselors used in this study were
Caucasian individuals. In regards to age, studies have shown that age-matching between client
and counselor does not appear to improve outcome and, in fact, most people report a preference
48
for middle-aged (i.e., approximately 35 to 45 years old) counselors (Farney et al., 2006; Tall &
Ross, 1991). The models developed for use in this study were created to appear of
approximately the same age and the “more mature” option was utilized when creating the models
in the Model My Diet software.
Design and Procedures
After gaining approval from the Auburn University Institutional Review Board,
participants were recruited, as described earlier, through online postings (see Appendix E) on
Amazon Mechanical Turk (MTurk.com), an internet site that allows researchers to solicit people
from a large pool of anonymous individuals to participate in research studies (e.g., surveys) for
compensation. The investigator created a posting on MTurk.com that offered participation in a
research study examining how counselors are perceived in their advertisements for $0.25
compensation. The survey remained available on MTurk.com for one month. Upon clicking the
survey link, participants were redirected from MTurk.com to the Qualtrics survey where they
learned basic information about the study, but did not learn that body size was a variable being
examined because such information may have primed the participant to be vigilant of their biases
(Bohner & Dickel, 2011; Greenwald & Banaji, 1995) and may have resulted in the data being
less representative of real-life scenarios. The participant learned about potential risks, that
participation was voluntary and that no negative consequences would be incurred if they
declined to participate, and that no identifying information would be collected (see Appendix F
for information letter). They were then be asked to provide online informed consent.
After providing consent, the participants answered a series of demographic questions
which confirmed their eligibility to participate in the study. The participants were administered a
set of online questionnaires that included the following instruments: the demographic

49
questionnaire developed for this study, the BIS–Brief, and the CRF–S, which was presented with
a randomly selected picture of a counselor that was pre-ranked according to body size and a
written description, “ad,” for the counselor pictured. The online versions of these questionnaires
were created by the investigator using Qualtrics. The order of presentation of the BIS–Brief and
the picture with CRF–S was counterbalanced such that all participants received both measures,
but in different orders. Participants were randomly assigned to the order of measures.
For the CRF–S task, the participant was shown a picture of a counselor with an
accompanying written description of the counselor and all of the CRF–S questions on one page.
The written description was the same for each of the images. The participant was instructed to
examine the ad for the counselor and complete the CRF–S questions. In total, the participant
was presented with one picture of a counselor, either male or female, representing one of the
body sizes, and was asked to complete all CRF–S questions for the picture. Participants were
randomly assigned to a pictured model. For the BIS–Brief task, all of the questions and the
instruction set were presented simultaneously on one page. Finally, participants were asked to
complete the demographic questionnaire.
The total time spent by each participant was expected to be five to ten minutes. Actual
durations recorded by Qualtrics ranged from one minute to hours or days, given that participants
could leave the survey on their browser and work on it intermittently. Following their
completion of all instruments, participants were shown an online debriefing where they learned
further details regarding the nature of the study (see Appendix G). They were thanked for their
participation, provided with contact information for a national crisis hotline, and encouraged to
seek therapeutic services if, upon completion of the survey, they felt distressed. Participants
were provided with a code that they entered on the MTurk.com website in order to receive
50
compensation. All participants who entered valid codes (i.e., the code provided matched a code
generated by Qualtrics) in the MTurk.com website were compensated within 48 hours. After one
month, the posting on MTurk.com expired and the survey was closed.
Once the survey was closed, the investigator downloaded the raw data directly from
Qualtrics into the Statistical Package for the Social Sciences (SPSS). Missing data points
including one CRF–S data point, three height data points, and two weight data points were all
replaced using the Series Mean method. One individual was dropped from analyses due to too
much data missing on the BIS-Brief. BMI and total scores on the CRF–S and the BIS–Brief
were computed for each participant. Furthermore, the participants were categorized based on the
body size (i.e., largest, second largest, second smallest, smallest) of the model that they were
shown and the gender of the model that they were shown. This information was entered into
SPSS prior to data analysis and the number of participants categorized to each group can be
found in Table 4.
Data Analytic Strategy
First, descriptive statistics were conducted on the demographic data collected in
the survey and a Chi Square was used to determine if demographic differences existed across
groups. Next, reliability coefficients (Cronbach’s Alpha) of the CRF–S and BIS–Brief were
examined to determine acceptability for inclusion in analyses. Thirdly, linearity, normality, and
homogeneity of the data were examined to determine acceptability for inclusion in a hierarchical
regression. Next, hierarchical regression analyses were used to test all hypotheses in the
investigation. Finally, a one-way ANOVA was used to explore if participants preferred more
average sized counselors over counselors with more extreme body weights. Bonferroni post hoc
tests were used to determine if participants rated counselor in the two mid-sized ranges (second
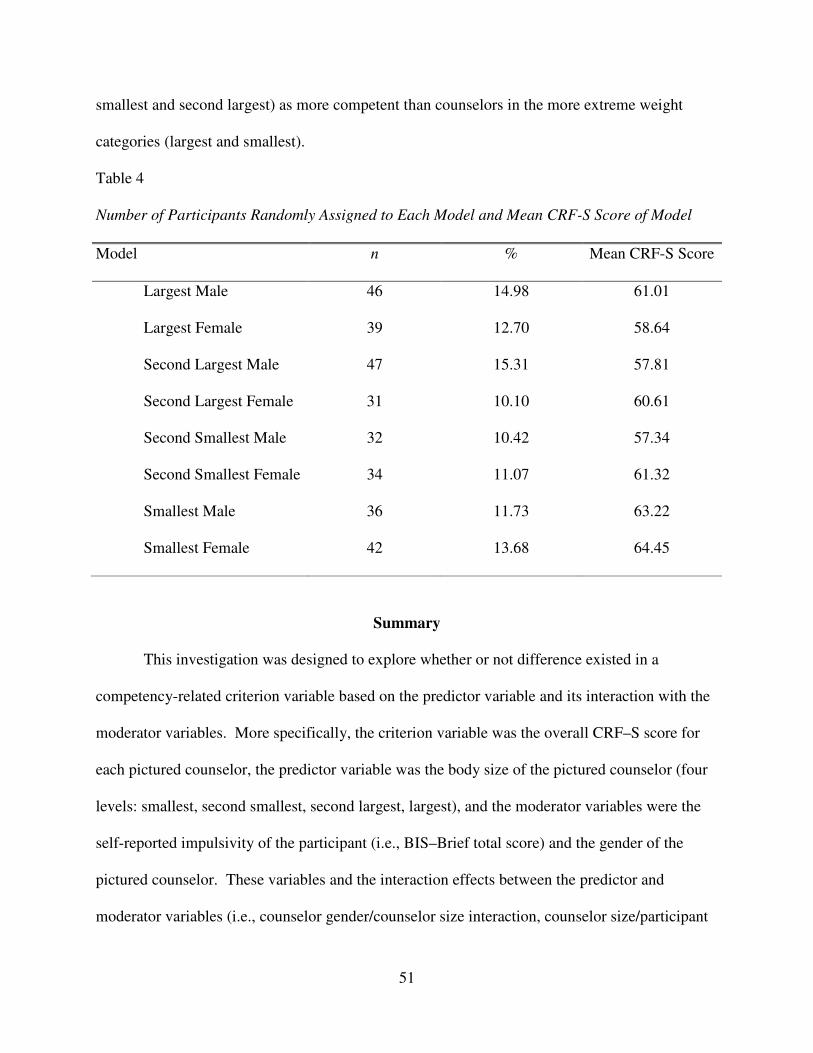
51
smallest and second largest) as more competent than counselors in the more extreme weight
categories (largest and smallest).
Table 4
Number of Participants Randomly Assigned to Each Model and Mean CRF-S Score of Model
Model n % Mean CRF-S Score
Largest Male 46 14.98 61.01
Largest Female 39 12.70 58.64
Second Largest Male 47 15.31 57.81
Second Largest Female 31 10.10 60.61
Second Smallest Male 32 10.42 57.34
Second Smallest Female 34 11.07 61.32
Smallest Male 36 11.73 63.22
Smallest Female 42 13.68 64.45
Summary
This investigation was designed to explore whether or not difference existed in a
competency-related criterion variable based on the predictor variable and its interaction with the
moderator variables. More specifically, the criterion variable was the overall CRF–S score for
each pictured counselor, the predictor variable was the body size of the pictured counselor (four
levels: smallest, second smallest, second largest, largest), and the moderator variables were the
self-reported impulsivity of the participant (i.e., BIS–Brief total score) and the gender of the
pictured counselor. These variables and the interaction effects between the predictor and
moderator variables (i.e., counselor gender/counselor size interaction, counselor size/participant

52
impulsivity interaction, and counselor gender/counselor size/participant impulsivity interaction)
were examined using hierarchical regression analyses.

53
CHAPTER IV. RESULTS
Overview
The results of the analyses run to test each of the three hypotheses presented are reported
in the following chapter. All hypotheses were tested using hierarchical regression analyses.
Although hierarchical regression is a robust analysis to moderate violations of the assumptions of
regression (Ross & Shannon, 2008), each of the underlying assumptions (i.e., independence of
the predictor variables, linearity, normality, and homogeneity of variance) were examined to
determine if any violations occurred. The assumptions of multiple regression were met for all
variables added to the hierarchical regressions in this investigation. Additionally, due to the fact
that interactions between predictor variables were tested in this investigation, each of the
predictor variables, as appropriate, were centered to avoid the increased multicollinearity that
occurs amongst the variables when interaction terms are created.
Descriptive Statistics
Each participant was assigned to one model size group (i.e., largest, second largest,
second smallest, smallest). Chi Square analysis was used to determine if demographic
differences existed across groups. No significant between-group differences were found.
Results of the Chi Square are displayed in Table 5.
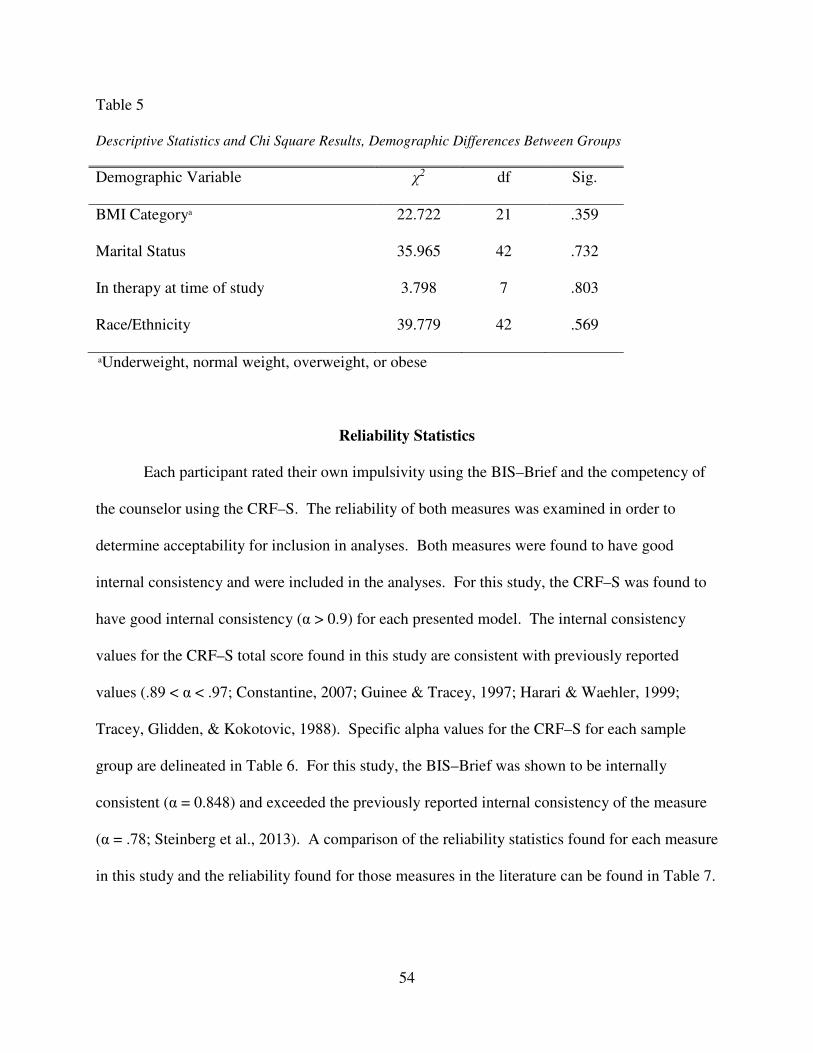
54
Table 5
Descriptive Statistics and Chi Square Results, Demographic Differences Between Groups
Demographic Variable χ2 df Sig.
BMI Categorya 22.722 21 .359
Marital Status 35.965 42 .732
In therapy at time of study 3.798 7 .803
Race/Ethnicity 39.779 42 .569
aUnderweight, normal weight, overweight, or obese
Reliability Statistics
Each participant rated their own impulsivity using the BIS–Brief and the competency of
the counselor using the CRF–S. The reliability of both measures was examined in order to
determine acceptability for inclusion in analyses. Both measures were found to have good
internal consistency and were included in the analyses. For this study, the CRF–S was found to
have good internal consistency (α > 0.9) for each presented model. The internal consistency
values for the CRF–S total score found in this study are consistent with previously reported
values (.89 < α < .97; Constantine, 2007; Guinee & Tracey, 1997; Harari & Waehler, 1999;
Tracey, Glidden, & Kokotovic, 1988). Specific alpha values for the CRF–S for each sample
group are delineated in Table 6. For this study, the BIS–Brief was shown to be internally
consistent (α = 0.848) and exceeded the previously reported internal consistency of the measure
(α = .78; Steinberg et al., 2013). A comparison of the reliability statistics found for each measure
in this study and the reliability found for those measures in the literature can be found in Table 7.

55
Table 6
Reliability Coefficients for the CRF–S by Sample Group
Sample Group α
Largest Male .939
Largest Female .952
Second Largest Male .954
Second Largest Female .915
Second Smallest Male .951
Second Smallest Female .924
Smallest Male .946
Smallest Female .928
Table 7
Comparison of Cronbach’s Alpha
Current Sample-Data Established Reliability
CRF–S .915-.954 .89-.97a
BIS–Brief 0.848 .78b
a Constantine, 2007; Guinee & Tracey, 1997; Harari & Waehler, 1999; Tracey, Glidden, & Kokotovic, 1988
b Steinberg et al., 2013
Simple Correlations between Variables
The predictor variables for the current investigation were model size, participant
impulsivity (BIS–Brief total score), and model gender. The criterion variable for the present

56
study was counselor competency (CRF–S total score) as rated by the participant. Correlations
were computed between each variable involved in this study as well as the demographic variable
participant BMI, which was calculated by the height and weight values provided by the
participant (see Table 8).
Significant negative correlations were found between counselor competency (CRF–S)
and both participant impulsivity (BIS–Brief; r = -.181, p < .01) and model size (r = -.129, p =
.024), such that higher levels of counselor competency were related to lower levels of participant
impulsivity and smaller counselor body sizes. Moreover, a significant positive correlation was
found between participant impulsivity (BIS-Brief) and participant BMI (r = .276, p < .01), such
that higher levels of self-reported impulsivity were related to higher participant BMI. When data
from participants who reported a history of disordered eating was removed from the analyses,
similar results were obtained. Table 8 contains a correlation matrix listing correlations between
each variable for all participants. The correlations were also explored separately for each group
of participants (i.e., which model size the participant was shown). Tables 9 through 12 contain
the correlation matrixes for the separate groups listing correlations between each variable. The
significant positive correlation between participant impulsivity and participant BMI found in the
whole sample was significant only for those participants who viewed the largest models (r =
.283, p < .01) and the smallest models (r = .509, p < .01) when the participants were broken
down according to group. The significant negative correlation between counselor competency
and participant impulsivity found in the whole sample was significant only for those participants
who viewed the smallest models (r = -.323, p < .01) when the participants were broken down
according to group.

57
Table 8
Correlation Matrix for the Intercorrelations between Study Variables for all Participants
M SD 2 3 4 5
1 CRF–S 60.65 11.25 -.181** .071 -.129* -.078
2 BIS–Brief 14.56 4.09 -- -.082 .042 .276**
3 Model Gender .48 .50 -- -.076 -.068
4 Model Size 2.55 1.15 -- -.110
5 Participant BMI 27.36 8.55 --
*p < .05; **p < .01
Table 9
Correlation Matrix for the Intercorrelations between Study Variables for Participants Who Saw the
Largest Models
M SD 2 3 4
1 CRF–S 59.92 10.30 -.052 -.115 -.198
2 BIS–Brief 14.82 4.21 -- .011 .283**
3 Model Gender .46 .50 -- .008
4 Participant BMI 26.13 6.37 --
Note. Model size has been removed as a variable because all models are of the same size for this group. *p < .05; **p < .01
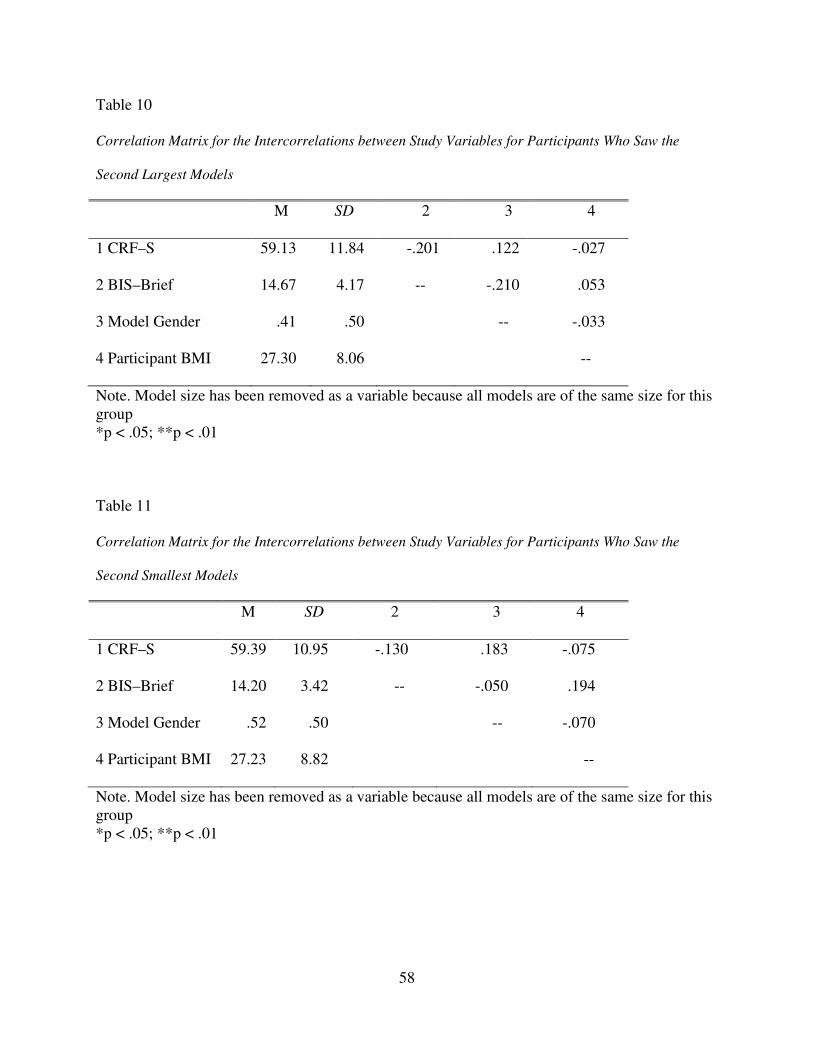
58
Table 10
Correlation Matrix for the Intercorrelations between Study Variables for Participants Who Saw the
Second Largest Models
M SD 2 3 4
1 CRF–S 59.13 11.84 -.201 .122 -.027
2 BIS–Brief 14.67 4.17 -- -.210 .053
3 Model Gender .41 .50 -- -.033
4 Participant BMI 27.30 8.06 --
Note. Model size has been removed as a variable because all models are of the same size for this group *p < .05; **p < .01
Table 11
Correlation Matrix for the Intercorrelations between Study Variables for Participants Who Saw the
Second Smallest Models
M SD 2 3 4
1 CRF–S 59.39 10.95 -.130 .183 -.075
2 BIS–Brief 14.20 3.42 -- -.050 .194
3 Model Gender .52 .50 -- -.070
4 Participant BMI 27.23 8.82 --
Note. Model size has been removed as a variable because all models are of the same size for this group *p < .05; **p < .01

59
Table 12
Correlation Matrix for the Intercorrelations between Study Variables for Participants Who Saw the
Smallest Models
M SD 2 3 4
1 CRF–S 64.04 11.42 -.323** .067 -.111
2 BIS–Brief 14.47 4.42 -- -.070 .509**
3 Model Gender .54 .50 -- -.171
4 Participant BMI 28.87 10.55 --
Note. Model size has been removed as a variable because all models are of the same size for this group *p < .05; **p < .01
As mentioned previously, the CRF-S measure also included the question, “How likely
would you be to go to this counselor?” Participants responded to the question using the same
seven-point Likert scale, but the response was not calculated into the total score of the
instrument. Therefore, a simple correlation was used to determine the relationship between
participants’ responses to this question and the overall competency score assigned to the
counselor. As would be expected, the two factors were found to be significantly positively
correlated (r = .659, p < .01), which indicates that increased competency ratings are related to
increased self-reported likeliness to see the counselor. Because these related indicators of
perceptions of counselors were sufficiently distinct (with less than half of the variance shared
between the two indicators), additional analyses were conducted to evaluate the potential group
differences in likelihood of seeing a counselor. The main analyses included only competency
ratings, which have more known psychometric properties than the single item asking the
likelihood of seeing a counselor.

60
Model Size Predicting Counselor Competency Scores
Model size was hypothesized to significantly predict counselor competency scores with
larger model size hypothesized to relate to lower counselor competency scores. This hypothesis
was tested along with the second hypothesis (see below) using one hierarchical regression. First,
counselor body size (i.e., largest, second largest, second smallest, smallest) was entered into step
one of the regression. Table 13 displays the standardized regression coefficient (β), total R2 (i.e.,
amount of variance in the criterion variable accounted for by the predictor variable or variables),
and the semipartial correlations (sr) for each model and predictor variable in the regression when
Table 13
Hierarchical Regression Analysis for Model Size and Participant Impulsivity (BIS–Brief) in
Predicting Counselor Competency Scores
ΔR2 β sr
Step 1
Model Size
.016*
-.127*
-.127
Step 2
Model Size
BIS–Brief
.029**
-.121*
-.170**
-.121
-.170
Step 3
Model Size x BIS–Brief
.009
.217
.093
Total R2 .054
*p < .05 **p < .01
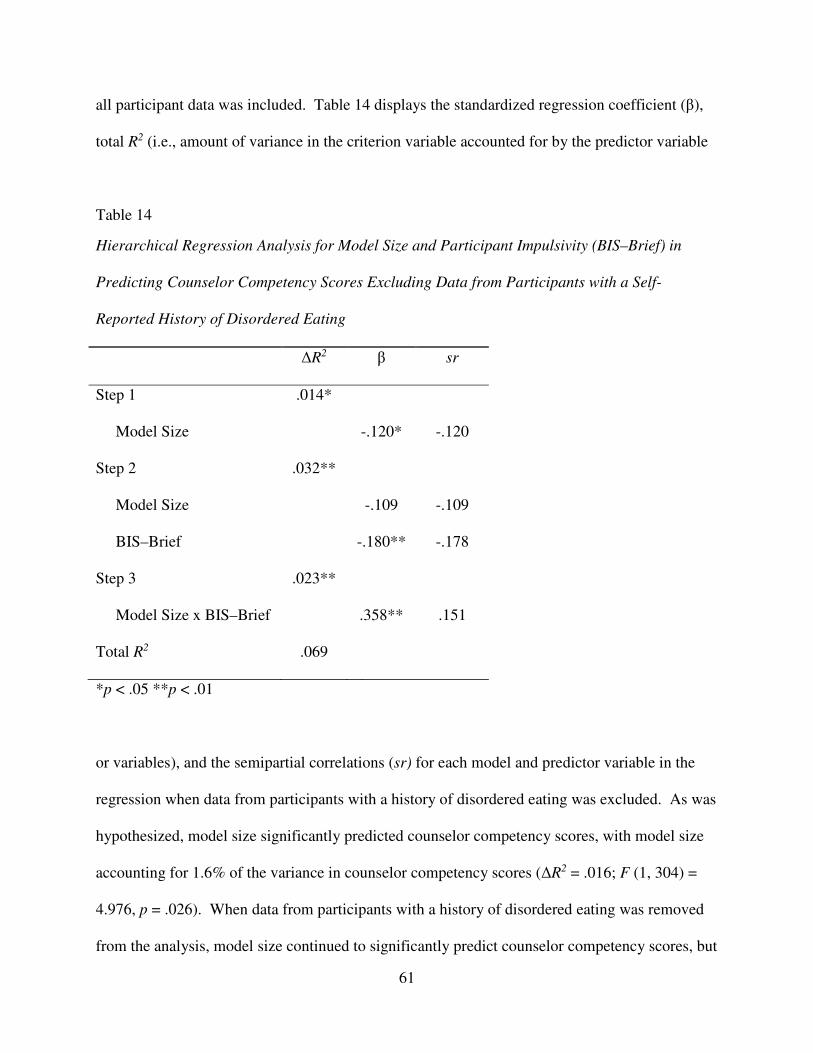
61
all participant data was included. Table 14 displays the standardized regression coefficient (β),
total R2 (i.e., amount of variance in the criterion variable accounted for by the predictor variable
Table 14
Hierarchical Regression Analysis for Model Size and Participant Impulsivity (BIS–Brief) in
Predicting Counselor Competency Scores Excluding Data from Participants with a Self-
Reported History of Disordered Eating
ΔR2 β sr
Step 1
Model Size
.014*
-.120*
-.120
Step 2
Model Size
BIS–Brief
.032**
-.109
-.180**
-.109
-.178
Step 3
Model Size x BIS–Brief
.023**
.358**
.151
Total R2 .069
*p < .05 **p < .01
or variables), and the semipartial correlations (sr) for each model and predictor variable in the
regression when data from participants with a history of disordered eating was excluded. As was
hypothesized, model size significantly predicted counselor competency scores, with model size
accounting for 1.6% of the variance in counselor competency scores (ΔR2 = .016; F (1, 304) =
4.976, p = .026). When data from participants with a history of disordered eating was removed
from the analysis, model size continued to significantly predict counselor competency scores, but

62
accounted for slightly less (1.4%) of the variance in counselor competency scores (ΔR2 = .014; F
(1, 286) = 4.193, p = .042) than when these participants’ data was included in the analysis. A
significant negative relationship was found between model size and counselor competency
scores, such that models with larger body sizes were rated as being less competent (β = -.127, p =
.026). This relationship continued to be significant in the negative direction when data from
participants with a history of disordered eating was removed from the regression analysis (β = -
.120, p = .042).
Participant Impulsivity as a Moderator
In the second hypothesis, participants’ self-reported impulsivity was hypothesized to
moderate the relationship between model size and counselor competency ratings. More
specifically, the significance of the relationship between perceived counselor body size and
perceived competency was hypothesized to be greater at higher levels of participant impulsivity.
This hypothesis, along with the first hypothesis (see above), was tested using one hierarchical
regression. Participant impulsivity was entered into the hierarchical regression equation in step
two, a step that was also used to test whether or not participant impulsivity predicts counselor
competency ratings after controlling for model size. In the third step, the interaction term
between the two variables (i.e., counselor body size and participant impulsivity) was entered into
the regression model. Beta weights were examined for participant impulsivity and the
interaction term for participant impulsivity and counselor body size when added to the prediction
model. Shown in Table 13 are the standardized regression coefficient (β), total R2 (i.e., amount
of variance in the criterion variable accounted for by the predictor variable or variables), and the
semipartial correlations (sr) for each model and predictor variable in the regression when all
participant data was included. Table 14 displays the standardized regression coefficient (β), total

63
R2 (i.e., amount of variance in the criterion variable accounted for by the predictor variable or
variables), and the semipartial correlations (sr) for each model and predictor variable in the
regression when data from participants with a history of disordered eating was excluded.
Participant impulsivity significantly predicted counselor competency ratings after
controlling for model size with participant impulsivity accounting for an additional 2.9% of the
variance in counselor competency ratings (F (2,303) = 7.147, p = .003). The negative Beta
weight for impulsivity in the model containing both impulsivity and model size in predicting
ratings of counselor competency (β = -.170, p = .003) indicates that as participant impulsivity
increased, counselor competency ratings decreased. This relationship did not change when data
from participants who reported a history of disordered eating was excluded from the model.
Furthermore, although the overall model containing both predictor variables (i.e., model size and
participant impulsivity) remained significant (ΔR2 = .032, F (2,285) = 6.878, p = .002) when
participants with a history of disordered eating were removed from the analyses, model size (β =
-.109, p = .060) did not account for a significant amount of unique variance when impulsivity
was added to the prediction model (β = -.178, p = .002).
Prior to examining the interaction effects, each of the predictor variables, as appropriate,
were centered to avoid the increased multicollinearity that occurs amongst the variables when
interaction terms are created. The addition of the interaction between model size and participant
impulsivity did not add significantly to the model (ΔR2 = .009, F (3,302) = 5.710, p >.05) when
data from all participants was included in the model and, since the interaction term was not
significant (β = .215, p = .104), the relationship between model size and counselor competency
scores did not statistically differ as a function of participant impulsivity. However, when data
from participants who reported a history of disordered eating was removed from the analysis, the

64
addition of the interaction between model size and participant impulsivity added significantly to
the model (ΔR2 = .023, F (3,284) = 7.003, p = .009), indicating that when participants with a
history of disordered eating are excluded from analyses the relationship between model size and
counselor competency scores statistically differed as a function of participant impulsivity. See
Figure 1 for a graphical representation of the interaction.
Figure 1. Graph showing the interaction between participant impulsivity (BIS–Brief scores) and
model size in predicting counselor competency (CRF–S) scores.
In order to further explore the interaction effect, a test for difference in simple slopes was
used after participants with any eating disorder status were excluded from analyses. This
analysis indicated a significant difference in the slope at low (one standard deviation below the
mean) levels of participant impulsivity (t = -3.219, p = .001), but no significant difference in the

65
slope at high (one standard deviation above the mean) levels of participant impulsivity (t = .438,
p = .662). Thus, participant impulsivity significantly moderated the relationship between
counselor competency (CRF-S) and counselor body size. Specifically, model size and counselor
competency score (CRF-S) are not significantly related for the more highly impulsive group of
participants. Whereas, for the less impulsive group, there is a significant negative relationship
between counselor competency score (CRF-S) and model size. In other words, there is no
significant difference in the competency scores (CRF-S) obtained between large (one standard
deviation above the mean) and small (one standard deviation below the mean) models when the
models are being rated by individuals who identify themselves as more impulsive (one standard
deviation above the mean). However, when being rated by individuals who identify themselves
as less impulsive (one standard deviation below the mean), smaller models are rated as
significantly more competent than larger models. Although a significant interaction was found,
it was not in the direction hypothesized (it was expected that the effect would occur for
individuals with higher levels of impulsivity in contrast to the finding that the effect exists
among individuals lower in impulsivity).
Model Gender as a Moderator
In the third hypothesis, model gender was hypothesized to moderate the relationship between
model size and counselor competency ratings. More specifically, the significance of the
relationship between perceived counselor body size and perceived competency was hypothesized
to be greater for female models than for male models. This hypothesis was tested using a second
hierarchical regression. In the first step, the two predictor variables (i.e., model size and model
gender) were entered into the regression model and in the second step the interaction between the
two variables (i.e., model size and model gender) was entered to test for moderation. Table 15

66
displays the standardized regression coefficient (β), total R2, and the semipartial correlations (sr
for each step and predictor variable in the regression model for all participant data. Table 16
Table 15
Hierarchical Regression Analysis for Model Size and Model Gender in Predicting Counselor
Competency Scores for All Participants
ΔR2 β sr
Step 1
Model Size
Model Gender
.020*
-.124*
.061
-.123
.061
Step 2
Model Size x Model Gender
.005
-.180
-.070
Total R2 .025
*p < .05 **p < .01
Table 16
Hierarchical Regression Analysis for Model Size and Model Gender in Predicting Counselor
Competency Scores for Participants without a History of Disordered Eating
ΔR2 β sr
Step 1
Model Size
Model Gender
.016
-.112
.052
-.111
.051
Step 2
Model Size x Model Gender
.007
-.210
-.083
Total R2 .023
*p < .05 **p < .01
67
displays the standardized regression coefficient (β), total R2, and the semipartial correlations (sr
for each step and predictor variable in the regression model when data from participants with a
history of disordered eating was excluded from the analyses.
Hypothesis three was not supported. The addition of the interaction between model size
and model gender did not add significantly to the model (ΔR2 = .005, F (3,303) = 2.605, p =
.052). Since the interaction term was not significant (β = -.180, p = .219), the relationship
between model size and counselor competency scores did not statistically differ as a function of
model gender. The model and interaction term were not significant when the data from
participants who reported a history of disordered eating was removed from the analyses. In other
words, gender did not moderate the relationship between model size and rated counselor
competency.
Interaction between Model Gender, Model Size, and Participant Impulsivity
A third hierarchical regression was used in order to test whether or not model size, model
gender, and participant impulsivity would interact to predict counselor competency ratings (i.e.,
three-way interaction effects). In the first step, the three predictor variables (i.e., model size,
participant impulsivity, and model gender) were entered into the regression model. In the second
step, each two-way interaction term (i.e., participant impulsivity by model size, participant
impulsivity by model gender, and model gender by model size) was entered. Next, the three-way
interaction between model size, participant impulsivity, and model gender was added to the
regression. Table 17 displays the standardized regression coefficient (β), total R2, and the
semipartial correlations (sr) for each step and predictor variable in the regression model for all
participants and Table 18 displays the standardized regression coefficient (β), total R2, and the
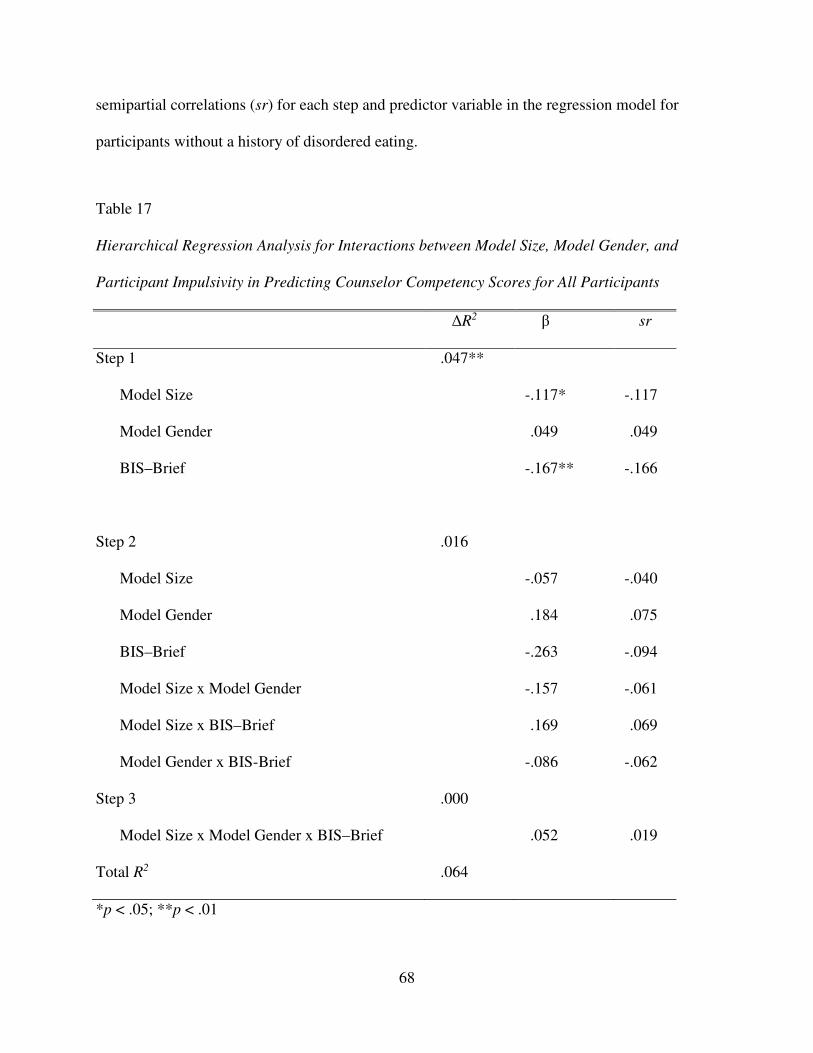
68
semipartial correlations (sr) for each step and predictor variable in the regression model for
participants without a history of disordered eating.
Table 17
Hierarchical Regression Analysis for Interactions between Model Size, Model Gender, and
Participant Impulsivity in Predicting Counselor Competency Scores for All Participants
ΔR2 β sr
Step 1
Model Size
Model Gender
BIS–Brief
.047**
-.117*
.049
-.167**
-.117
.049
-.166
Step 2
Model Size
Model Gender
BIS–Brief
Model Size x Model Gender
Model Size x BIS–Brief
Model Gender x BIS-Brief
.016
-.057
.184
-.263
-.157
.169
-.086
-.040
.075
-.094
-.061
.069
-.062
Step 3
Model Size x Model Gender x BIS–Brief
.000
.052
.019
Total R2 .064
*p < .05; **p < .01
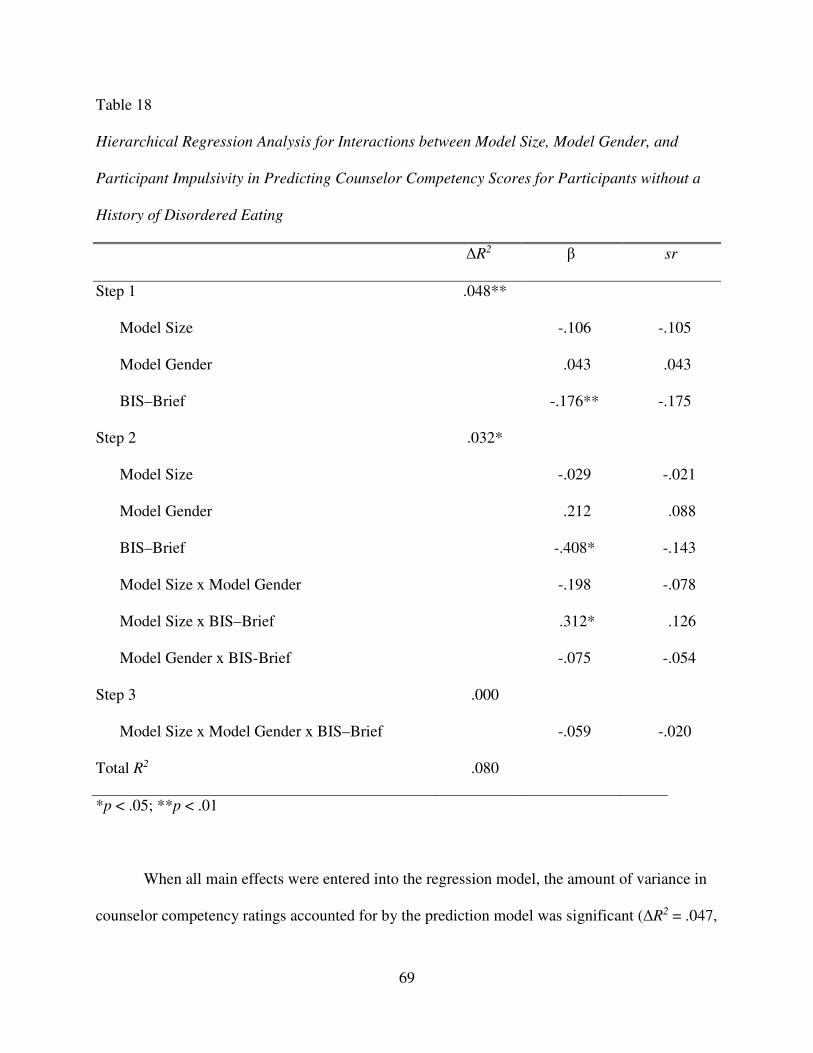
69
Table 18
Hierarchical Regression Analysis for Interactions between Model Size, Model Gender, and
Participant Impulsivity in Predicting Counselor Competency Scores for Participants without a
History of Disordered Eating
ΔR2 β sr
Step 1
Model Size
Model Gender
BIS–Brief
.048**
-.106
.043
-.176**
-.105
.043
-.175
Step 2
Model Size
Model Gender
BIS–Brief
Model Size x Model Gender
Model Size x BIS–Brief
Model Gender x BIS-Brief
.032*
-.029
.212
-.408*
-.198
.312*
-.075
-.021
.088
-.143
-.078
.126
-.054
Step 3
Model Size x Model Gender x BIS–Brief
.000
-.059
-.020
Total R2 .080
*p < .05; **p < .01
When all main effects were entered into the regression model, the amount of variance in
counselor competency ratings accounted for by the prediction model was significant (ΔR2 = .047,

70
F (3,302) = 5.013, p = .002) and remained significant when data from participants who reported
a history of disorder eating was removed (ΔR2 = .048, F (3,284) = 4.764, p = .003). Moreover,
although the amount of variance in counselor competency ratings accounted for by the prediction
model that included all main effects and simple interactions was not significant when data from
all participants was used (ΔR2 = .016, F (6,299) = 3.396, p = .158), the model was significant
when data from participants who reported a history of disorder eating was removed (ΔR2 = .032,
F (6,281) = 4.075, p = .022). Finally, the addition of the three-way interaction between model
size, participant impulsivity, and model gender did not add significantly to the model when it
was run with data from all participants (ΔR2 = .000, F (7,298) = 2.918, p = .739) or when it was
run after excluding the data from participants who reported a history of disordered eating (ΔR2 =
.000, F (7,280) = 3.500, p = .722). Since the interaction term did not add a significant amount of
variance accounted for within the model for either the entire sample or the sample with
participants who reported a history of disordered eating removed, model size, model gender, and
participant impulsivity did not significantly interact to predict counselor competency ratings.
In the model used to examine the three-way interaction effects, there was evidence of
suppression for model gender. Specifically, the model gender semi-partial correlation in step
two (sr = .075) was larger than the size of the direct correlation between model gender and
counselor competency (CRF-S score; r = .071) when data from all participants was used and
when data from participants with a history of disordered eating was excluded (sr = .088, r =
.060). In other words, there was suppression for model gender in step two (main effects and
simple interactions) of the third regression model.
71
Preference for an Average Sized Counselor
According to Vocks, Legenbauer, and Peters (2007), participants reported a significant
preference for average sized counselors. Therefore, in order to determine if this was supported
in this study, a one-way ANOVA was used to examine the difference in counselor competency
(CRF-S score) across counselor body size. When data from participants with a history of
disordered eating was removed from the analysis, CRF-S scores were not significantly different
across counselor body size (F (3,285) = 2.206, p = .088). However, when data from all
participants was included in the analysis, CRF-S scores were significantly different across
counselor body size (F (3,303) = 3.220, p = .023). Bonferroni post hoc analyses showed that the
smallest counselors were rated as significantly (p = .034) more competent (M = 6.8846, SD =
11.41539) than the second largest counselors (M = 58.9231, SD = 11.81873). No other
significant differences were found and the hypothesis that clients may prefer a more average
sized counselor was not supported, which suggests that there may be differences in what clients
explicitly report they prefer (i.e., Vocks, Legenbauer, & Peters, 20007) and their implicit
preferences. Results of the Bonferroni test are presented in Table 19. To further evaluate
preference of averaged sized counselors, an ANOVA on responses to the CRF-S item regarding
willingness to go to the counselor was used to explore differences as a function of model size.
This ANOVA was not significant; there were no significant difference across counselor body
size in how willing a participants reported being to go to the pictured counselor when all
participant data was included (F (3, 303) = 1.114, p = .344) or when participants with a history
of disordered eating where excluded from the analyses (F (3, 285) = .951, p = .417).
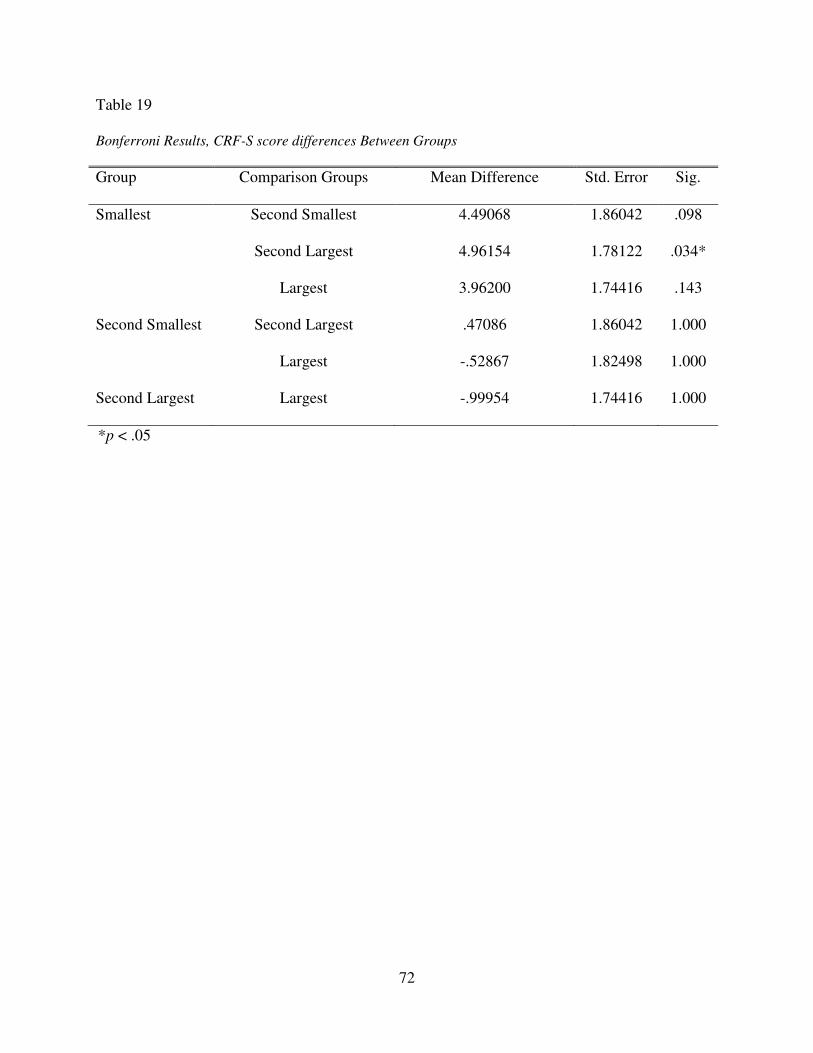
72
Table 19
Bonferroni Results, CRF-S score differences Between Groups
Group Comparison Groups Mean Difference Std. Error Sig.
Smallest Second Smallest
Second Largest
Largest
4.49068
4.96154
3.96200
1.86042
1.78122
1.74416
.098
.034*
.143
Second Smallest Second Largest
Largest
.47086
-.52867
1.86042
1.82498
1.000
1.000
Second Largest Largest -.99954 1.74416 1.000
*p < .05

73
CHAPTER V. DISCUSSION
Meaning and Interpretation of Findings
The purpose of this investigation was to examine the relationship between counselor
body size and how competent the counselor is perceived to be. Furthermore, variables that might
affect the relationship between counselor body size and counselor competency scores, including
counselor gender and client impulsivity, were investigated. The sample for the present study
consisted of mostly Caucasian individuals ranging in age from 19 to 72. Approximately half
(51.8%) of the sample had prior experience with counseling or psychotherapy. As such, when
examining the findings that counselor body size is related to counselor competency scores, it is
important to consider that the participants in this study knew in advance that they would not be
receiving therapeutic services from the pictured counselor. Therefore, participants may have
rated the counselors differently (i.e., looked for different features in the model or ad) than they
might rate a counselor who is providing (or would potentially provide) services to them.
As would be expected based on the literature (e.g., Hash et al., 2003; Wiggins, 1980),
counselor body size predicted the competency ratings assigned to the pictured counselor with
larger counselors receiving lower competency scores. The relationship between counselor body
size and counselor competency did not depend upon counselor gender. In other words, larger
counselors of both genders are likely to receive lower competency ratings than their smaller
counterparts.
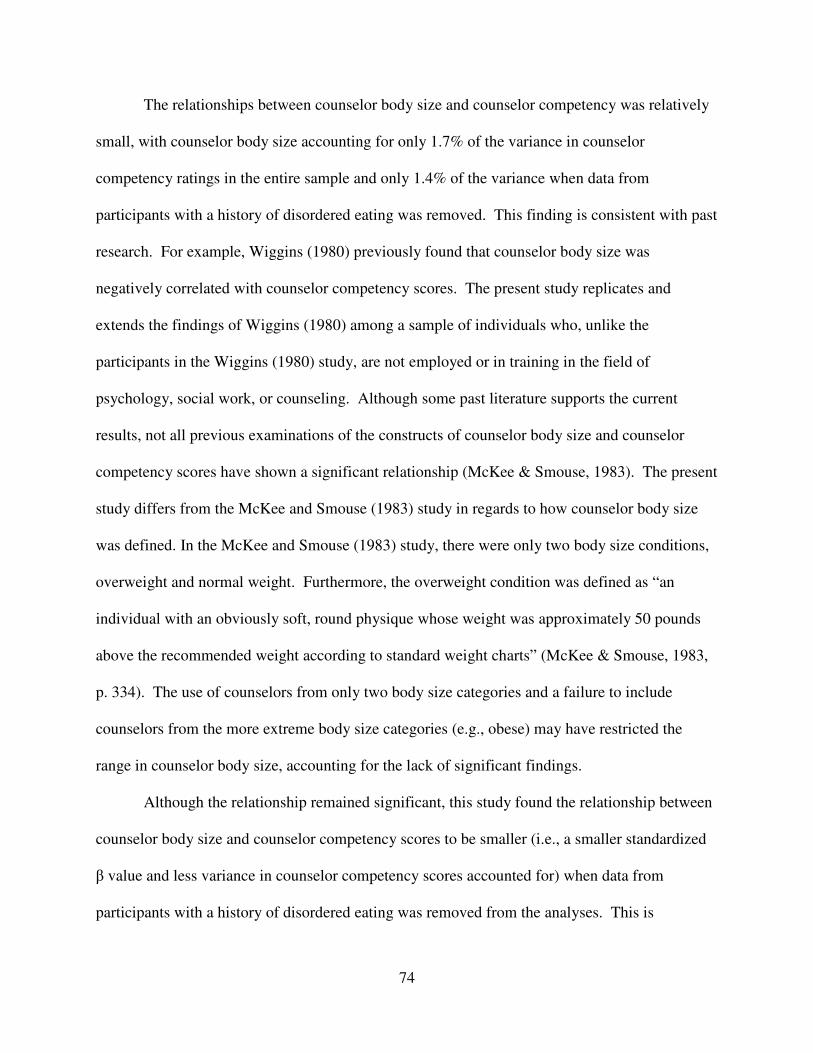
74
The relationships between counselor body size and counselor competency was relatively
small, with counselor body size accounting for only 1.7% of the variance in counselor
competency ratings in the entire sample and only 1.4% of the variance when data from
participants with a history of disordered eating was removed. This finding is consistent with past
research. For example, Wiggins (1980) previously found that counselor body size was
negatively correlated with counselor competency scores. The present study replicates and
extends the findings of Wiggins (1980) among a sample of individuals who, unlike the
participants in the Wiggins (1980) study, are not employed or in training in the field of
psychology, social work, or counseling. Although some past literature supports the current
results, not all previous examinations of the constructs of counselor body size and counselor
competency scores have shown a significant relationship (McKee & Smouse, 1983). The present
study differs from the McKee and Smouse (1983) study in regards to how counselor body size
was defined. In the McKee and Smouse (1983) study, there were only two body size conditions,
overweight and normal weight. Furthermore, the overweight condition was defined as “an
individual with an obviously soft, round physique whose weight was approximately 50 pounds
above the recommended weight according to standard weight charts” (McKee & Smouse, 1983,
p. 334). The use of counselors from only two body size categories and a failure to include
counselors from the more extreme body size categories (e.g., obese) may have restricted the
range in counselor body size, accounting for the lack of significant findings.
Although the relationship remained significant, this study found the relationship between
counselor body size and counselor competency scores to be smaller (i.e., a smaller standardized
β value and less variance in counselor competency scores accounted for) when data from
participants with a history of disordered eating was removed from the analyses. This is

75
consistent with prior research, which has identified counselor body size as a variable of
significant importance to individuals with a history of disordered eating (Vocks et al., 2007).
The results also suggest that, although the relationship may be larger for individuals who report a
history of disordered eating, the relationship between counselor body size and counselor
competency scores continues to be significant for individuals without a history of disordered
eating as well. It is important to note, however, that the percentage of the sample who reported a
history of disordered eating was small (5.9%) and it is not possible to draw accurate conclusions
or make hypotheses about the population of people with current or historical disordered eating
based on this data.
Despite the noted significant relationship between counselor body size and counselor
competency scores for both participants with a history of disordered eating and those without,
counselor gender, a variable presumably related to counselor physical appearance (Burmeister et
al., 2013; Miller & Lundgren, 2010; Schvey, Puhl, Levandoski, & Brownell, 2013), was not
found to be significantly related to counselor competency scores. Furthermore, counselor gender
was not found to significantly predict competency scores received by a counselor and was not
found to significantly impact the relationship between counselor body size and counselor
competency scores. Therefore, hypothesis three was not supported. This is consistent with prior
research, which found that the gender of the target was not an important factor in the relationship
between a target’s perceived body size and evaluations of the target by a rater (Cash & Kehr,
1978; Harris et al., 1982; Paradise, Cohl, & Zweig, 1980; Wiggins, 1980). This study replicates
and extends the findings of the earlier studies in today’s cultural milieu. The present study
differs from research that has found women to be held more stringently to physical appearance
standards in regards to how physical appearance was defined. Earlier studies (Burmeister et al.,

76
2013; Miller & Lundgren, 2010; Schvey, Puhl, Levandoski, & Brownell, 2013) have used a more
inclusive definition of physical appearance such as, for example, attractiveness, which may
include additional variables (e.g., facial symmetry) in addition to body size. In contract, this
study was specifically designed to explore one facet of physical appearance (i.e., body size)
rather than examining physical appearance more generally (e.g., hair color, attractiveness,
clothing style, etc.). The inclusive definition of physical appearance (i.e., including factors other
than body size) used in other studies may have contributed to the findings that women are held
more stringently to physical appearance standards than men. Stated another way, it is possible
that women are held more stringently than men to physical appearance standards other than body
size (e.g., attractiveness) and the inclusion of such variables in the examination of physical
appearance may account for the significant findings in other studies.
It is possible that participant variables, as opposed to other counselor demographic
variables, interact with counselor body size to predict counselor competency scores. Prior
research has found that stereotypes (e.g., about obesity) are more likely to be activated when the
trait (e.g., obese body size) related to the stereotype is salient to the situation (Kahneman, 2003;
Krieglmeyer & Sherman, 2012; Macrae & Bodenhausen, 2000). Given the prominent social link
between obesity and impulsivity (APA, 2013; Cohen et al., 2005; Klaczynski et al., 2004; Puhl &
Brownell, 2001), it was hypothesized that obesity and its related stereotype of impulsivity will be
salient to individuals with higher levels of impulsivity, thus resulting in increased likelihood of
stereotype activation. It was expected that this line of reasoning could be extended to a
therapeutic setting. In that case, individuals who present for counseling and perceive themselves
as highly impulsive would be more likely to experience stereotype activation in the presence of
an overweight or obese counselor than would clients who perceive themselves as less impulsive
77
(hypothetically due to the increased salience of impulsivity, and thus body size, and concomitant
increased likelihood of stereotype activation). Although this study specifically explored
participant impulsivity and high and low levels of impulsivity are referenced, there are no
empirically supported cutoff values representing clinically significant or impairing levels of
impulsivity. No studies specifically examining the effect of the interaction between rater
impulsivity and target body size on overall evaluations of a target were found.
Unexpectedly, the findings of the present study suggest an interaction, but not in the
direction hypothesized. Participant impulsivity was found to be related to counselor competency
scores and was shown to predict counselor competency scores above and beyond counselor body
size. When added to a regression model containing counselor body size, participants’ self-
reported impulsivity added significantly to the model. Thus, in contrast to the hypothesis which
asserts that participant impulsivity will moderate the relationship between counselor body size
and counselor competency scores, participant impulsivity appears to be independently related to
counselor competency scores and is able to predict, independent of counselor body size,
counselor competency scores. Specifically, the relationship between counselor competency
scores and participant impulsivity was negative, meaning that higher levels of participant
impulsivity are associated with lower counselor competency scores. The counselors in this study
were rated, overall, towards the higher end of the competency scale. It may be that participants
who described themselves as being more impulsive tended to respond quicker to measures and to
focus their ratings more toward the center of the rating scale. Alternatively, it may be that
individuals higher in impulsivity, rate multiple things less positively than those low in
impulsivity. Specific explanations for the relationship are beyond the scope of this study.
78
When analyses were run without data from participants without a history of disorder
eating, participant impulsivity was shown to interact with counselor body size to predict
counselor competency scores. Specifically, for participants without a history of disordered
eating, a significant negative relationship between counselor competency and counselor body
size was found for participants with a low self-reported level of impulsivity such that smaller
models were rated as significantly more competent than larger models. No significant
relationship was found between the two variables for participants with a high self-reported level
of impulsivity. This finding is inconsistent with the hypothesis that participant impulsivity
would moderate the relationship between counselor body size and counselor competency score
such that the relationships would be stronger for individuals who reported higher levels of
impulsivity. Specifically, it is inconsistent with the direction of the hypothesized moderation
effect and the reasoning behind the hypothesized effect. It is possible that individuals who
reported high levels of impulsivity were impulsive in their ratings of the pictured counselor and,
therefore, tended to rate the counselor without examining the picture. In other words, in
responding quickly, they may have attended less to the content of the competency rating form,
instead, opting to select a more middle rating to finish the study more quickly. In contrast,
individuals who reported lower levels of impulsivity may have been more likely to examine the
picture prior to completing the measure and to consider the content of the rating, which resulted
in more intentional responding that lead to more variability in ratings, and the resulting
significant relationship. Alternatively, the graphical representation suggests that all models, with
the exception of the smaller models rated by less impulsive individuals, were rated
approximately the same in competency (CRF-S) score. In other words, less impulsive people
credited the smaller models with higher competency whereas all other models were rated
79
approximately the same by both low impulsive and high impulsive participants. Although rated
as more competent, results reveal that participants did not identify themselves as being
significantly more likely to see the smaller counselors than the larger counselors. Specific
explanations for the increase in competency scores assigned to smaller models by less impulsive
individuals are beyond the scope of this study.
As mentioned previously, the interaction between participant impulsivity and counselor
body size was not significant when data from participants with a history of disordered eating was
included in the analysis. It is possible that the participants who reported a history of disordered
eating had, on average, higher levels of impulsivity than those without a self-reported history.
This is supported by the fact that the mean impulsivity level for the group of participants who
reported a history of disordered eating (M = 16.06) was higher than the sample mean (M =
14.56) and the fact that prior research has shown that counselor body size is significantly
important to individuals with a history of disordered eating (Vocks et al., 2007). If this is true, it
is possible that, given that significant moderation of the relationship between counselor body size
and counselor impulsivity was found at higher levels of impulsivity, inclusion of the highly
impulsive individuals (i.e., those with a self-reported history of disordered eating) may have
weakened the relationship enough that no significant relationship was found when data from all
participants was included in the analysis. It may also be that individuals with a psychological
problem that directly relates to body size (e.g., an eating disorder) experience counselors of
larger body sizes differently than individuals with other clinical concerns, thus displaying a
different pattern between self-reported impulsivity and counselor competency ratings.
When looking more in-depth at the variables that were found to predict counselor
competency scores (i.e., counselor body size and participant impulsivity), it is obvious that
80
participant impulsivity accounted for the largest amount of variance. However, the total variance
in counselor competency scores accounted for in this investigation was small and a large amount
remains unexplained. Other variables that have previously been examined in the obesity and
healthcare literatures (e.g., rater education, rater income, target social status; Harsha et al., 1996;
McKee & Smouse, 1983) may directly influence and interact in complex ways to predict
counselor competency scores.
Overall, evidence has been established for the predictive ability of counselor body size
and rater impulsivity for the construct of counselor competency. In addition, the gender of the
counselor being rated was not found to be significantly related to counselor competency scores
and did not interact with model size to predict counselor competency. Thus, this study provided
unexpected evidence that male and female counselors are rated approximately the same and that
men and women are likely both impacted by negative stereotypes related to larger body size.
Findings also suggest that there are other variables beyond those examined in this study that may
account for counselor competency scores and that researchers should explore additional variables
that may predict counselor competency ratings provided by clients.
Additional noteworthy results were found when examining the simple correlations
between variables. Specifically, participant BMI was found to be significantly and positively
related to participant impulsivity. This is consistent with existing social beliefs about overweight
and obese individuals (e.g., people who are obese are more impulsive). Chi Square analyses
revealed no significant differences in BMI or impulsivity between the groups and the exploration
of this relationship is outside the scope of this study.

81
Limitations
Sampling Bias
Although this study has the potential to inform researchers and clinicians about the
relationship between body size and counselor competency scores, a few limitations should be
mentioned. First, the participants were solicited via Amazon Mechanical Turk (MTurk.com).
This resulted in a less than random sample as it consisted exclusively of individuals who choose
to engage in online tasks for money. It is likely that individuals with low reading levels are not
accessing this survey recruitment tool and were not included in the analysis. It should also be
noted that the use of the internet may have prevented individuals without internet access from
participating in the study. It is hard to know how well the study findings relate to individuals
who do not choose to complete tasks online for money or do not have access to a computer
and/or the internet. In addition, the sample was limited to adult women. Thus, it is hard to know
how the findings may or may not extend to men and younger individuals. Finally, the sample
was not representative of the U.S. population, 68.5% of which is classified as obese (Ogden,
Carroll, Kit, & Flegal, 2012), in that only 48.2% of the sample provided BMI information that
falls into either the overweight or obese category. Thus, it is not clear if a typical U.S. adult
would respond in a manner similar to the participants in this study.
Methodological
Two methodological limitations should also be discussed. Due to the use of correlational
methods to evaluate some hypotheses, causality can be inferred with regards to the effect of
participant (and by extension client) impulsivity on the relationship between counselor size and
perceived competency ratings (the use of experimental design for counselor size enables
conclusion that size may have a causal relationship with ratings of competencies for counselors).

82
The results of the investigation are further limited by the use of self-report, which is subjective
and lends itself to biased responding. For example, it is not possible to know if participants who
rated themselves as highly impulsive engage in impulsive behaviors or if they view themselves
as impulsive, but do not engage in impulsive behaviors.
Computer-Generated Models
The models that the participants rated in this study were computer-generated models,
which may have impacted the ratings provided by the participants. One participant added the
following comment about the model in the box where she entered her completion code: “I didn’t
like the image cause it was computer-generated and I thought that was so freaking wrongQ!”
[quoted verbatim from participant]. Participants had no opportunity during the survey to provide
comments about their impressions of the model and, therefore, it is not possible to know if more
than the one participant perceived the models to be computer generated or if the ratings were
affected. It is, therefore, possible that the computer generated images used in this study were
flawed in a manner similar to the models used in other studies (e.g., appeared unusual at more
extreme weights).
The limits within the computer program also may have affected participants’ ratings of
counselors’ competency. The clothing style options selected for the model were chosen because
they most closely resembled professional dress. However, the clothing options were limited by
the software and the results may not extend to counselors who dress in a more professional or a
more casual manner than the models presented. Furthermore, there were floor and ceiling weight
values imposed by the Model My Diet software which may have caused the models to appear
more similar in size (e.g., less likely to activate different stereotypes) than if more extreme
values were used. Although height and weight values representing each BMI category were
83
entered, there is no empirical evidence supporting the ability of the Model My Diet software to
accurately depict specific BMI categories.
In addition to limits of the program used to generate the model pictures, computers used
by participants may have introduced additional error. It is possible that the computers of
individual participants distorted the presentation of the models in ways that cannot be known due
to individual settings on any given computer. Thus, it is not possible to know if the participants
viewed models that accurately represented specific BMI categories.
Moreover, participants had limited data points from which to form impressions about the
counselors that are not reflective of actual experiences in a first counseling session. Participant
was only able to view the model from one angle and was not able to access any additional
information about the model that may typically be present during in-person interactions (e.g.,
tone of voice). Thus, the results of this study may not extend to in-person interactions in which
an individual is able to quickly access more individuating information about the counselor and is
able to view the counselor’s body size and shape from multiple angles. In an attempt to control
for this limitation, the participant was informed that the image was from a counselor’s online
advertisement. However, it is important to note that counselors who post advertisements online
typically provide only a headshot photograph and the client is only able to see the counselor’s
face. Thus, the ad used in this study may have been perceived as unusual and the results may,
therefore, not extend to clients who search for their counselor online prior to seeing them in
person.
Relevance to Clinical Sample
The majority (91.19%) of the participants in this study reported that they were not
engaged in psychotherapy or counseling at the time of the study and 48.2% of the participants

84
reported that they have never engaged in psychotherapy or counseling. Therefore, the results
may not be representative of a clinical population. However, the percentage of the sample who
reported having engaged in psychotherapy at some point in their life is significantly higher than
what is typically reported for the U.S. population. Furthermore, information about the
participants past psychotherapy experience was not collected and it is not possible to determine if
the participants in this study are representative of individual who terminate treatment
prematurely.
Cross-Cultural Relevance
The current study presented photographed models representing only one race and age-
group. Although this methodology prevented the possibility of confounding racial and age
factors, it is not possible to extend the results to counselors of other racial backgrounds and ages.
While it would be beneficial to examine potential differences in the results based on the racial
group or age of the counselor, such research questions are outside the scope of the present study
due to limitations on the length of the survey and limited funding.
Measures
This study is further limited by the psychometrics of the measures used. There is limited
psychometric data available for the Barratt Impulsiveness Scale-Brief measure used in the
present study. However, the measure was designed based on the Barratt Impulsiveness Scale-11
(Patton, Stanford, & Barratt, 1995), which is a widely used and validated measure and one study
described this measure as at least psychometrically comparable to the full Barratt Impulsiveness
Scale-11 measure (Steinberg, Sharp, Stanford, & Tharp, 2013). Moreover, there are no
empirically supported cutoff scores available for the BIS-Brief and it was not possible to
determine which participants, if any, reported clinically significant or impairing levels of

85
impulsivity. Furthermore, research has raised questions about the Counselor Rating Form –
Short version. Investigators have suggested the instrument may measure willingness to self-refer
to the pictured counselor rather than competency, may experience floor effects, and may be
highly influenced by the “good person” or “cooperative subject” response bias (Heppner,
Wampold, & Kivlighan, 2008; Ponterotto & Furlong, 1975). However, the measure has been
used consistently across the literature (Evans-Jones et al., 2009; Fuertes & Brobst, 2002), and
was specifically selected to maintain continuity with prior research related to weight stigma and
counseling (McKee & Smouse, 1983; Wiggins, 1980).
Implications
When working with clients, it is important for counselors and therapists to be aware that
counselor body size may relate to perceptions of counselor competency, with that larger
counselors viewed as less competent. Counselors should be aware of factors that may influence a
client’s treatment trajectory and should address variables which may lead to early termination of
treatment (i.e., variables that contribute to the client’s belief that a counselor will not be helpful).
This research is not suggesting that counselors should work toward changing their bodyweight,
but rather that all counselors, regardless of their body size, may find it beneficial in building
rapport to discuss with the client what it is like to be working with a counselor of their body size,
especially if body size is directly or indirectly relevant to the client’s presenting concern. It is
important to ensure that any discussion of such topics be initiated and conducted appropriately
and should focus on the client’s experience rather than the therapist’s situation, experience, or
personal biases. Until factors that can more comprehensively and accurately predict which
variables will best predict treatment outcome are discovered, the best practice for counselors is to
86
ensure that clients are provided with a safe space to explore their biases, if clients wish, and
discuss treatment influencing factors.
Implications also exist for the lack of significant interaction between counselor gender
and counselor body size in predicting counselor competency. These results suggest that both
men and women may be susceptible to this form of discrimination, but specific conclusions
cannot be drawn from this data.
This study has implications for how counselors may address weight bias outside of the
counseling session as well. The results of this study are not suggesting that larger sized
individuals need to change their appearance or to maintain a normal, as defined by the CDC,
bodyweight, but rather suggests that counselors are not immune to the more pervasive social
problem of individuals with larger body sizes being discriminated against and reminds
counselors that their clients likely also experience discrimination based on body size. It is
possible that exploring such biases with clients on an individual case-by-case basis may be
helpful, but it may also be important for counselors to pursue social justice by working towards
developing protections for larger sized individuals and eradicating the negative social
associations between high bodyweight and ability.
Future Directions
Future research is needed to better understand the relationship between counselor body
size and counselor competency. Although the current study and Wiggins (1980) identified a
significant negative relationship between counselor body size and counselor competency, other
investigations (McKee & Smouse, 1983) produced null results. Future research exploring
specific differences in the sample selected for study (e.g., participants who are also in the
counseling field versus participants who are seeking therapeutic services versus participants from
87
the general population) may be beneficial in clarifying the significance of the relationship.
Furthermore, future research should use standardized methods for presenting the counselor to be
rated (e.g., in-person interaction, picture, computer generated model) while also controlling for
potentially confounding variables (e.g., attractiveness, clothing style) and may benefit from using
a standardize measure of weight/body size (e.g., BMI) rather than subjective determinations
about counselor size. The use of such a standardized measure would also allow for the inclusion
of various body shapes for each weight/size category, which may be a potentially moderating
factor (i.e., people of one body shape may be rated as more competent than people who have the
same weight/BMI but are of a different shape).
The participants in this study were informed that they were viewing an online
advertisement for a counselor. Future research should further explore online advertisements and
may examine which psychologists (e.g., overweight, normal weight, underweight) are most
likely to post a picture with their advertisement. Moreover, researchers might investigate which
potential clients (based on client characteristics), if any, are more likely to select a counselor if
they view a picture of the counselor in the advertisement.
In addition, given the small amount of variance accounted for by body size in counselor
competency ratings, researchers may wish to explore whether subsequent activity (e.g.,
therapeutic interventions, rapport building), and which activity, can offset any negative effects
of body size on competency perceptions. Related to this, researchers should also examine how
body size and competency ratings relate to client outcomes including decisions to continue
therapy with the provider.
Research examining additional variables that may moderator the relationship between
counselor competency and counselor body size is also needed. This study specifically examined

88
the moderating effect of counselor gender and participant impulsivity, but the total variance in
counselor competency scores accounted for in this investigation was small and a large amount
remains unexplained. Thus, it is likely that additional moderator variables (e.g., participant
gender, participant history of disordered eating, counselor race, counselor clothing style) exist
and these variables should be explored. As additional moderator variables are identified, it may
also be important to utilize measures other than self-report instruments. Using more objective
methods of assessing participants for, for example, disordered eating, may be helpful in further
elucidating the impact that the variable has on the relationship between counselor competency
and body size.
In addition to examining potential moderator variables, additional research is needed to
explore the main effects of the moderating variable (i.e., participant impulsivity) examined in
this study. Specifically, the results of this study indicated that participant impulsivity was
significantly related to counselor competency scores, above and beyond counselor body size.
The findings raise the possibility that, in order to better understand how counselor competency is
rated, researchers may need to focus on specific client characteristics, notably impulsivity.
Moreover, future research should examine the suppression found in the current study.
The result was unexpected and it is not possible to determine the cause at this time. However,
now that evidence of the phenomenon has been produced, future studies should attempt to
replicate it and examine it more closely.
Counselor competency is multifaceted concept that may be influenced by a number of
traits. Thus, future research should explore additional therapist characteristics (e.g., clothing
style, race, etc.), that may affect how clients perceive their counselor.
89
Finally, future research should explore the relationship between counselor body size and
counselor competency in diverse populations. Specifically, this study examined the relationship
in a sample of people who were, for the most part, not engaged in psychotherapy at the time of
the survey. In order to ensure that the findings are relevant in a clinical setting, additional
research should examine the relationship in a sample of individuals who are actively engaged in
therapy at the time of the study. Moreover, the current investigation specifically explored the
relationships between counselor competency and counselor body size using participants only
from the United States and the sample obtained was predominately Caucasian. It would be
appropriate to explore the relationship using participants from other cultures and to recruit
participants from a range of demographic backgrounds (e.g., race/ethnicity, socioeconomic
status, age). In addition to examining the relationship between counselor competency and
counselor body in size with participants from more diverse demographic backgrounds, it would
be useful to explore the impact of counselor race/ethnicity on the relationship between counselor
competency and counselor body size. Thus, it might be beneficial for future investigations to
request that participants rate counselors from multiple racial backgrounds.
90
REFERENCES
Ackerman, S. J., & Hilsenroth, M. J. (2003). A review of therapist characteristics and techniques
positively impacting the therapeutic alliance. Clinical Psychology Review, 23, 1–33.
doi:10.1016/S0272-7358(02)00146-0
American Psychiatric Association. (2013). Diagnostic and statistical manual of mental disorders
(5th ed.). Arlington, VA: American Psychiatric Publishing.
American Psychological Association Center for Workforce Studies. (2014). 2013 APA member
profiles. Retrieved from http://www.apa.org/workforce/publications/13-
member/profiles.pdf
Andreyeva, T., Puhl, R., & Brownell, K. D. (2008). Changes in perceived weight discrimination
among Americans: 1995-1996 through 2004-2006. Obesity, 16, 1129-1134.
Atkinson, D. R., & Wampold, B. E. (1982). A comparison of the Counselor Rating Form and the
Counselor Effectiveness Rating Scale. Counselor Education and Supervision, 22, 25-36.
Barak, A., & LaCrosse, M. B. (1975). Multidimensional perception of counselor behavior.
Journal of Counseling Psychology, 22, 471-476.
Barocas, R., & Vance, F. L. (1974). Physical appearance and personal adjustment counseling.
Journal of Counseling Psychology, 21, 96–100. doi:10.1037/h0036263
Barratt, E. S. (1959). Anxiety and impulsiveness related to psychomotor efficiency. Perceptual
and Motor Skills, 9, 191-198.
91
Bell, D. C., Montoya, I. D., & Atkinson, J. S. (1997). Therapeutic connection and client progress
in drug abuse treatment. Journal of Clinical Psychology, 53, 215–224.
Bernieri, F. J., & Petty, K. N. (2011). The influence of handshakes on first impression accuracy.
Social Influence, 6, 78–87. doi:10.1080/15534510.2011.566706
Bleich, S. N., Gudzune, K. A., Bennett, W. L., Jarlenski, M. P., & Cooper, L. A. (2013). How
does physician BMI impact patient trust and perceived stigma? Preventive Medicine, 57,
120-124. doi: 10.1016/j.ypmed.2013.05.005
Bodenhausen, G. V., & Wyer, R. S. (1985). Effects of stereotypes in decision making and
information-processing strategies. Journal of Personality and Social Psychology, 48,
267-282. doi:10.1037/0022-3514.48.2.267
Bohner, G., & Dickel, N. (2011). Attitudes and attitude change. Annual Review of Psychology,
62, 391 – 417. doi: 10.1146/annurev.psych.121208.131609
Brogan, M. M., Prochaska, J. O., & Prochaska, J. M. (1999). Predicting termination and
continuation status in psychotherapy using the transtheoretical model. Psychotherapy:
Theory, Research, Practice, Training, 36, 105.
Brown, R. (2011). Prejudice: Its social psychology. West Sussex, United Kingdom: John Wiley
& Sons.
Brudvig, S. & Borna, S. (2012). The effect of pediatricians’ obesity and gender on children’s
perception. Young Consumers, 13, 147-160. doi: 10.1108/17473611211233495
Burmeister, J. M., Kiefner, A. E., Carels, R. A., & Musher-Eizenman, D. R. (2013). Weight bias
in graduate school admissions. Obesity, 21, 918–920. doi:10.1002/oby.20171

92
Byrne, D., London, O., & Reeves, K. (1968). The effects of physical attractiveness, sex, and
attitude similarity on interpersonal attraction. Journal of Personality, 36, 259-271.
doi:10.1111/1467-6494.ep8935352
Cabral, R. R., & Smith, T. B. (2011). Racial/ethnic matching of clients and therapists in mental
health services: A meta-analytic review of preferences, perceptions, and outcomes.
Journal of Counseling Psychology, 58, 537–554. doi:10.1037/a0025266
Carpenter, K. M., Hasin, D. S., Allison, D. B., & Faith, M. S. (2000). Relationships between
obesity and DSM-IV major depressive disorder, suicide ideation, and suicide attempts:
Results from a general population study. American Journal of Public Health, 90, 251–
257.
Carter, J. A. (1978). Impressions of counselors as a function of counselor physical attractiveness.
Journal of Counseling Psychology, 25, 28–34. doi:10.1037/0022-0167.25.1.28
Cash, T. F., Begley, P. J., McCown, D. A., & Weise, B. C. (1975). When counselors are heard
but not seen: Initial impact of physical attractiveness. Journal of Counseling Psychology,
22, 273–279. doi:10.1037/h0076730
Cash, T. F., & Kehr, J. (1978). Influence of nonprofessional counselors’ physical attractiveness
and sex on perceptions of counselor behavior. Journal of Counseling Psychology, 25,
336-342.
Centers for Disease Control and Prevention. (2012). Overweight and obesity. Retrieved from
http://www.cdc.gov/obesity/adult/defining.html
Chang, D. F., & Berk, A. (2009). Making cross-racial therapy work: A phenomenological study
of clients’ experiences of cross-racial therapy. Journal of Counseling Psychology, 56,
521–536. doi:10.1037/a0016905

93
Cohen, J. (1988). Statistical power analysis for the behavioral sciences (2nd ed.). Hillsdale, NJ:
Erlbaum.
Cohen, L., Perales, D. P., & Steadman, C. (2005). The O word: Why the focus on obesity is
harmful to community health. Californian Journal of Health Promotion, 3, 154–161.
Constantine, M. G. (2007). Racial microaggressions against African American clients in cross-
racial counseling relationships. Journal of Counseling Psychology, 54, 1-16. doi:
10.1037/0022-0167.54.1.1
Cooley, E. J., & Lajoy, R. (1980). Therapeutic relationship and improvement as perceived by
clients and therapists. Journal of Clinical Psychology, 36, 562–570.
Corrigan, J. D., & Schmidt, L. D. (1983). Development and validation of revisions in the
Counselor Rating Form. Journal of Counseling Psychology, 30, 64-75.
Darley, J. M., & Gross, P. H. (1983). A hypothesis-confirming bias in labeling effects. Journal of
Personality and Social Psychology, 44, 20-33. doi:10.1037/0022-3514.44.1.20
Davis, E. M., Rovi, S., & Johnson, M. S. (2005). Mental health, family function and obesity in
African-American women. Journal of the National Medical Association, 97, 478-482.
Dean, M. B., Adams II, T. M., & Comeau, M. J. (2005). The effect of a female physical
educator’s physical appearance on physical fitness knowledge and attitudes of junior high
students. The Physical Educator, 62, 14-25.
DiClemente, C. C., Carroll, K. M., Connors, G. J., & Kadden, R. M. (1994). Process assessment
in treatment matching research. Journal of Studies on Alcohol and Drugs, 55, 156-162.
Dion, K., Berscheid, E., & Walster, E. (1972). What is beautiful is good. Journal of Personality
and Social Psychology, 24, 285–290. doi:10.1037/h0033731

94
Dishman, R. K., & Buckworth, J. (1996). Increasing physical activity: A quantitative synthesis.
Medicine and Science in Sports and Exercise, 28, 706-719.
Drummond, K. (2013). In controversial vote, American Medical Association declares obesity ‘a
disease.’ The Verge. Retrieved from
http://www.theverge.com/2013/6/19/4444782/american-medical-association-obesity-a-
disease
Eagly, A. H., Ashmore, R. D., Makhijani, M. G., & Longo, L. C. (1991). What is beautiful is
good, but…: A meta-analytic review of research on the physical attractiveness stereotype.
Psychological Bulletin, 110, 109–128. doi:10.1037/0033-2909.110.1.109
Eaton, D. K., Lowry, R., Brener, N. D., Galuska, D. A., & Crosby, A. E. (2005). Associations of
body mass index and perceived weight with suicide ideation and suicide attempts among
US high school students. Archives of Pediatric Adolescent Medicine, 159, 513-519.
Ekkekakis, P., Parfitt, G., & Petruzzello, S. J. (2011). The pleasure and displeasure people feel
when they exercise at different intensities: Decennial update and progress towards a
tripartite rationale for exercise intensity prescription. Sports Med, 41, 641 – 671.
Epperson, D. L., & Pecnik, J. A. (1985). Counselor Rating Form – Short Version: Further
validation and comparison to the long form. Journal of Counseling Psychology, 32, 143-
143.
Etcoff, N. L., Stock, S., Haley, L. E., Vickery, S. A., & House, D. M. (2011). Cosmetics as a
feature of the extended human phenotype: Modulation of the perception of biologically
important facial signals. PLoS ONE, 6, 1-9. doi:10.1371/journal.pone.0025656

95
Evans, R. R., Cotter, E. M., & Roy, J. L. P. (2005). Preferred body type of fitness instructors
among university students in exercise classes. Perceptual and Motor Skills, 101, 257-266.
doi: 10.2466/pms.101.1.257-266
Evans-Jones, C., Peters, E., & Barker, C. (2009). The therapeutic relationship in CBT for
psychosis: Client, therapist and therapy factors. Behavioural and Cognitive
Psychotherapy, 37, 527–540. doi:10.1017/S1352465809990269
Farney, L., Aday, R. H., & Breault, K. D. (2006). Age preferences: How old is “too old” for
selected service providers among young, middle-aged, and older adults? Educational
Gerontology, 32, 215 – 225. doi: 10.1080/03601270500476870
Finkelstein, E. A., Trogdon, J. G., Cohen, J. W., & Dietz, W. (2009). Annual medical spending
attributable to obesity: Payer-and service-specific estimates. Health affairs, 28, w822–
w831.
Flegal, K. M., Carroll, M. D., Kuczmarski, R. J., & Johnson, C. L. (1998) Overweight and
obesity in the United States: Prevalence and trends, 1960-1994. International Journal of
Obesity and Related Metabolic Disorders: Journal of the International Association for
the Study of Obesity, 22, 39-47.
Fuertes, J. N., & Brobst, K. (2002). Clients’ ratings of counselor multicultural competency.
Cultural Diversity and Ethnic Minority Psychology, 8, 214–223. doi:10.1037/1099-
9809.8.3.214
Garfield, S. L. (1994). Research on client variables in psychotherapy. In A. E. Bergin & S. L.
Garfield (Eds.), Handbook of psychotherapy and behavior change (4th ed., pp. 190–228).
Oxford, England: John Wiley & Sons.

96
Gaziano J. (2010). Fifth phase of the epidemiologic transition: The age of obesity and inactivity.
Journal of the American Medical Association, 303, 275–276.
doi:10.1001/jama.2009.2025
Gearing, R. E., Townsend, L., Elkins, J., El-Bassel, N., & Osterberg, L. (2014). Strategies to
predict, measure, and improve psychosocial treatment adherence. Harvard Review of
Psychiatry, 22, 31 – 45. doi: 10.1097/HRP.10.1097/HRP.0000000000000005
Gilbert, D. T., & Hixon, J. G. (1991). The trouble of thinking: Activation and application of
stereotypic beliefs. Journal of Personality and Social Psychology, 60, 509-517.
Gortmarker, S. L. Must, A., Perrin, J. M., Sobol, A. M., & Dietz, W. H. (1993). Social and
economic consequences of overweight in adolescence and young adulthood. The New
England Journal of Medicine, 329, 1008-1012.
Greenwald, A. G., & Banaji, M. R. (1995). Implicit social cognition: Attitudes, self-esteem, and
stereotypes. Psychological Review, 102, 4–27. doi:10.1037/0033-295X.102.1.4
Guinee, J. P., & Tracey, T. J. G. (1997). Effects of religiosity and problem type on counselor
description ratings. Journal of Counseling and Development, 76, 65-73.
Harari, M. & Waehler, C. (1999). The effect of first session attention to termination on counselor
social influence rating. Journal of College Student Psychotherapy, 13, 67-79. doi:
10.1300/J035v13n04_06
Harris, S. M., & Busby, D. M. (1998). Therapist physical attractiveness: An unexplored
influence on client disclosure. Journal of Marital and Family Therapy, 24, 251–257.
doi:10.1111/j.1752-0606.1998.tb01081.x
97
Harris, M. B., Harris, R. J., & Bochner, S. (1982). Fat, four-eyed, and female: Stereotypes of
obesity, glasses, and gender. Journal of Applied Social Psychology, 12, 503–516.
doi:10.1111/j.1559-1816.1982.tb00882.x
Harsha, D. M., Saywell, R. M., Thygerson, S., & Panozzo, J. (1996). Physician factors affecting
patient willingness to comply with exercise recommendations. Clinical Journal of Sport
Medicine, 6, 112-118.
Hash, R. B., Munna, R. K., Vogel, R. L., & Bason, J. J. (2003). Does physician weight affect
perception of health advice? Preventive Medicine, 36, 41-44. doi:
10.1006/pmed.2002.1124
Hassel, T. D. (2002). Effects of obesity on the clinical judgments by Christian and non-Christian
mental health professionals. (Doctoral dissertation). Retrieved from
http://spot.lib.auburn.edu/login?url=http://search.proquest.com/docview/305530767?acco
accou=8421
Hebl, M. R., & Dovidio, J. F. (2005). Promoting the “social” in the examination of social
stigmas. Personality and Social Psychology Review, 9, 156 – 182.
Heppner, P., Wampold, B., & Kivlighan Jr., D. (2007). Research design in counseling (3rd ed.).
Belmont, CA: Thomson Brooks/Cole.
Hollander-Goldfein, B., Fosshage, J. L., & Bahr, J. M. (1989). Determinants of patients’ choice
of therapist. Psychotherapy: Theory, Research, Practice, Training, 26, 448–461.
doi:10.1037/h0085463
Horvath, A. O., & Symonds, B. D. (1991). Relation between working alliance and outcome in
psychotherapy: A meta-analysis. Journal of Counseling Psychology, 38, 139-149.

98
Hosoda, M., Stone-Romero, E. F., & Coats, G. (2003). The effects of physical attractiveness on
job-related outcomes: A meta-analysis of experimental studies. Personnel Psychology,
56, 431 – 462.
Jackson, L. A. (1992). Physical appearance and gender: Sociobiological and sociocultural
perspectives. Albany, NY: State University of New York Press.
Jussim, L. (1986). Self-fulfilling prophecies: A theoretical and integrative review. Psychological
Review, 93, 429–445. doi:10.1037/0033-295X.93.4.429
Kahneman, D. (2003). A perspective on judgment and choice: Mapping bounded rationality.
American Psychologist, 58, 697–720. doi:10.1037/0003-066X.58.9.697
Kasarabada, N. D., Hser, Y. I., Boles, S. M., & Huang, Y. C. (2002). Do patients’ perceptions of
their counselors influence outcomes of drug treatment? Journal of Substance Abuse
Treatment, 23, 327–334.
Kingkade, T. (2013). Geoffrey Miller censured by University of New Mexico for lying about fat-
shaming tweet. The Huffington Post. Retrieved from
http://www.huffingtonpost.com/2013/08/07/geoffrey-miller-censured-
unm_n_3716605.html
Klaczynski, P. A., Goold, K. W., & Mudry, J. J. (2004). Culture, obesity stereotypes, self-
esteem, and the “thin ideal”: A social identity perspective. Journal of Youth and
Adolescence, 33, 307-317.
Kluck, A. S. (2010). Family influence on disordered eating: The role of body image
dissatisfaction. Body Image, 7, 8-14.
Kokotovic, A. M., & Tracey, T. J. (1987). Premature termination at a university counseling
center. Journal of Counseling Psychology, 34, 80-82.
99
Krieglmeyer, R., & Sherman, J. W. (2012). Disentangling stereotype activation and stereotype
application in the stereotype misperception task. Journal of Personality and Social
Psychology, 103, 205–224. doi:10.1037/a0028764
Langlois, J. H., Kalakanis, L., Rubenstein, A. J., Larson, A., Hallam, M., & Smoot, M. (2000).
Maxims or myths of beauty? A meta-analytic and theoretical review. Psychological
Bulletin, 126, 390–423. doi:10.1037//0033-2909.126.3.390
Lightstone, K., Francis, R., & Kocum, L. (2011). University faculty style of dress and students’
perception of instructor credibility. International Journal of Business and Social Science,
2, 15–22.
Lubker, J. R., Watson II, J. C., Visek, A. J., & Geer, J. R. (2005). Physical appearance and the
perceived effectiveness of performance enhancement consultants. The Sport
Psychologist, 19, 446-458.
Luborsky, L., Auerbach, A. H., Chandler, M., Cohen, J., & Bachrach, H. M. (1971). Factors
influencing the outcome of psychotherapy: A review of quantitative research.
Psychological Bulletin, 75, 145–185. doi:10.1037/h0030480
Macrae, C. N., & Bodenhausen, G. V. (2000). Social cognition: Thinking categorically about
others. Annual Review of Psychology, 51, 93-120.
Maramba, G. G., & Nagayama Hall, G. C. (2002). Meta-analyses of ethnic match as a predictor
of dropout, utilization, and level of functioning. Cultural Diversity and Ethnic Minority
Psychology, 8, 290–297. doi:10.1037/1099-9809.8.3.290
McKee, K., & Smouse, A. D. (1983). Clients’ perceptions of counselor expertness,
attractiveness, and trustworthiness: Initial impact of counselor status and weight. Journal
of Counseling Psychology, 30, 332-338.
100
Meier, S. T., & Davis, S. R. (2010). The elements of counseling (7th ed.). Belmont, CA:
Brooks/Cole.
Melville, D. S., & Maddalozzo, J. G. F. (1988). The effects of a physical educator’s appearance
of body fatness on communicating exercise concepts to high school students. Journal of
Teaching in Physical Education, 7, 343-352.
Miller, B. J., & Lundgren, J. D. (2010). An experimental study of the role of weight bias in
candidate evaluation. Obesity, 18, 712–718. doi:10.1038/oby.2009.492
Miller, D. T., & Turnbull, W. (1986). Expectancies and interpersonal processes. Annual Review
of Psychology, 37, 233–256.
Montoya, R. M., & Horton, R. S. (2012). A meta-analytic investigation of the processes
underlying the similarity-attraction effect. Journal of Social and Personal Relationships,
30, 64–94. doi:10.1177/0265407512452989
Najavits, L. M., & Weiss, R. D. (1994). Variations in therapist effectiveness in the treatment of
patients with substance use disorders: An empirical review. Addiction, 89, 679–688.
Naumann, L. P., Vazire, S., Rentfrow, P. J., & Gosling, S. D. (2009). Personality judgments
based on physical appearance. Personality and Social Psychology Bulletin, 35, 1661–
1671. doi:10.1177/0146167209346309
Norcross, J. C. (2011). Psychotherapy relationships that work: Evidence-based responsiveness.
New York, NY: Oxford University Press.
Ogden, C. L., Carroll, M. D., Kit, B. K., & Flegal, K. M. (2012). Prevalence of obesity in the
United States, 2009-2010. (NCHS Data Brief No. 82). Retrieved from http://wood-
ridge.schoolwires.net/cms/lib6/NJ01001835/Centricity/Domain/175/Obesity%20Article.p
df
101
Orlinsky, D. E., Grawe, K., & Parks, B. K. (1994). Process and outcome in psychotherapy: Noch
einmal. In A. E. Bergin & S. L. Garfield (Eds.), Handbook of psychotherapy and
behavior change (4th ed.; pp. 270–376). Oxford, England: John Wiley & Sons.
Paradise, L. V., Cohl, B., & Zweig, J. (1980). Effects of profane language and physical
attractiveness on perceptions of counselor behavior. Journal of Counseling Psychology,
27, 620-624.
Pascal, B., & Kurpius, S. E. R. (2012). Perceptions of clients: Influences of client weight and job
status. Professional Psychology: Research and Practice, 43, 349–355.
doi:10.1037/a0028525
Patton, J. H., Stanford, M. S., & Barratt, E. S. (1995). Factor structure of the Barratt
Impulsiveness Scale. Journal of Clinical Psychology, 51, 768-774.
Pingitore, R., Dugoni, B. L., Tindale, R. S., & Spring, B. (1994). Bias against overweight job
applicants in a simulated employment interview. Journal of Applied Psychology, 79,
909–916.
Ponterotto, J. G., & Furlong, M. J. (1985). Evaluating counselor effectiveness: A critical review
of rating scale instruments. Journal of Counseling Psychology, 32, 597-616.
Puhl, R., & Brownell, K. D. (2001). Bias, discrimination, and obesity. Obesity Research, 9, 788–
805. doi:10.1038/oby.2001.108
Puhl, R. M., & Heuer, C. A. (2009). The stigma of obesity: A review and update. Obesity, 17,
941–964. doi:10.1038/oby.2008.636
Ribner, D. S., & Knei-Paz, C. (2002). Client’s view of a successful helping relationship. Social
Work, 47, 379 – 387. doi: 10.1093/sw/47.4.379

102
Ross, M. E., & Shannon, D. M. (2008). Applied quantitative methods in education. Dubuque, IA:
Kendall/Hunt Publishing Company.
Ross, J., Zaldivar, A., Irani, L., & Tomlinson, B. (2010). Who are the Crowdworkers?: Shifting
Demographics in Amazon Mechanical Turk. Proceedings of the Association for
Computing Machinery CHI 2010 Conference on Human Factors in Computing Systems,
USA, 2863-2872.
Saguy, A. C., & Gruys, K. (2010). Morality and health: News media constructions of overweight
and eating disorders. Social Problems, 57, 231–250. doi:10.1525/sp.2010.57.2.231
Salameh, E., Olsen, S., & Howard, D. (2012). Nonattendance with clinic follow-up
appointments: Diabetes as exemplar. The Journal for Nurse Practitioners, 8, 797-803.
Schvey, N. A., Puhl, R. M., Levandoski, K. A., & Brownell, K. D. (2013). The influence of a
defendant’s body weight on perceptions of guilt. International Journal of Obesity, 37,
1275-1281. doi:10.1038/ijo.2012.211
Schwartz, M. B., Vartanian, L. R., Nosek, B. A., & Brownell, K. D. (2006). The influence of
one’s own body weight on implicit and explicit anti-fat bias. Obesity, 14, 440–447.
doi:10.1038/oby.2006.58
Sebastian, R. J., & Bristow, D. (2008). Formal or informal? The impact of style of dress and
forms of address on business students’ perceptions of professors. Journal of Education
for Business, 83, 196–201.
Shapiro, A. K., Struening, E., Shapiro, E., & Barten, H. (1976). Prognostic correlates of
psychotherapy in psychiatric outpatients. The American Journal of Psychiatry, 133, 802–
808.

103
Sharpless, B. A., & Barber, J. P. (2009). A conceptual and empirical review of the meaning,
measurement, development, and teaching of intervention competence in clinical
psychology. Clinical Psychology Review, 29, 45 – 56.
Sinclair, L., & Kunda, Z. (1999). Reaction to a black professional: Motivated inhibition and
activation of conflicting stereotypes. Journal of Personality and Social Psychology, 77,
885–904.
Snyder, M. (1992). Motivational foundations of behavioral confirmation. In M. P. Zanna (Ed.),
Advances in -experimental social psychology, Volume 25 (pp.67-114). San Diego, CA:
Academic Press, Inc.
Snyder, M., Tanke, E. D., & Berscheid, E. (1977). Social perception and interpersonal behavior:
On the self-fulfilling nature of social stereotypes. Journal of Personality and Social
Psychology, 35, 656-666.
Stake, J., & Lauer, M. L. (1987). The consequences of being overweight: A controlled study of
gender differences. Sex Roles, 17, 31-47.
Stanford, M. S., Mathais, C. W., Dougherty, D. M., Lake, S. L., Anderson, N. E., & Patton, J. H.
(2009). Fifty years of the Barratt Impulsiveness Scale: An update and review. Personality
and Individual Differences, 47, 385-395.
Stanovich, K. E., & West, R. F. (2000). Individual differences in reasoning: Implications for the
rationality debate? Behavioral and Brain Sciences, 23, 645–665.
Steinberg, L., Sharp, C., Stanford, M. S., & Tharp, A. T. (2013). New tricks for an old measure:
The development of the Barratt Impulsiveness Scale-Brief (BIS-Brief). Psychological
Assessment, 25, 216-226. doi: 10.1037/a0030550

104
Sue, D. W., & Sue, D. (2012). Counseling the culturally diverse: Theory and practice (6th ed.).
Hoboken, NJ: John Wiley & Sons, Inc.
Sypeck, M. F., Gray, J. J., & Ahrens, A. H. (2004). No longer just a pretty face: Fashion
magazines’ depictions of ideal female beauty from 1959 to 1999. International Journal of
Eating Disorders, 36, 342–347. doi:10.1002/eat.20039
Tall, K. M., & Ross, M. J. (1991). The effects of therapist-client age similarity on pretherapy
expectations. Journal of Contemporary Psychotherapy, 21, 197–209.
doi:10.1007/BF00973118
Thompson, B., & Hill, C. (1993). Client perceptions of therapist competence. Psychotherapy
Research, 3, 124–130. doi:10.1080/10503309312331333729
Thompson, V. L. S., Bazile, A., & Akbar, M. (2004). African Americans’ perceptions of
psychotherapy and psychotherapists. Professional Psychology: Research and Practice,
35, 19–26. doi:10.1037/0735-7028.35.1.19
Todorov, A., Mandisodza, A. N., Goren, A., & Hall, C. C. (2005). Inferences of competence
from faces predict election outcomes. Science, 308, 1623–1626. doi:10.2307/3841621
Tracey, T. J., Glidden, C. E., & Kokotovic, A. M. (1988). Factor structure of the Counselor
Rating Form-Short. Journal of Counseling Psychology, 35, 330-335.
Turkcan, A., Nuti, L., DeLaurentis, P., Tian, Z., Daggy, J., Zhang, L., Lawley, M., & Sands, L.
(2013). No-show modeling for adult ambulatory clinics. In B. Denton (Ed.), Handbook of
Healthcare Operations Management (pp. 251-288). New York, NY: Springer.
Vocks, S., Legenbauer, T., & Peters, I. (2007). Does shape matter? Preferences for a female
therapist’s figure among patients with eating disorders. Psychotherapy Research, 17,
416–422. doi:10.1080/10503300600740703

105
Wampold, B. E. (2001). The great psychotherapy debate: Models, methods, and findings.
Mahwah, NJ: Lawrence Erlbaum Associates, Inc.
Weissman, M. M., Verdeli, H., Gameroff, M. J., Bledsoe, S. E., Betts, K., Mufson, L., Fitterling,
H., & Wickramaratne, P. (2006). National survey of psychotherapy training in psychiatry,
psychology, and social work. Archives of General Psychiatry, 63, 925 – 934.
Wiggins, J. D. (1980). Effectiveness ratings of counselors by coached clients related to
attractiveness-fitness variables. American Mental Health Counselors Association
Journal, 2, 83–87.
Willis, J., & Todorov, A. (2006). First impressions: Making up your mind after a 100-ms
exposure to a face. Psychological Science, 17, 592–598. doi:10.1111/j.1467-
9280.2006.01750.x
Wilson, F. R., & Yager, G. G. (1990). Concurrent and construct validity of three counselor social
influence instruments. Measurement & Evaluation in Counseling & Development, 23, 52-
67.
Young, J. W. (1979). Symptom disclosure to male and female physicians: Effects of sex,
physical attractiveness, and symptom type. Journal of Behavioral Medicine, 2, 159–169.
doi:10.1007/BF00846664

106
Appendix A
Demographic Questionnaire
1. Age: ______________
2. Please type the year in which you were born: _____________
3. Please select the name of the country in which you currently reside:
o United States
o Other
4. Gender:
o Male
o Female
o Other: _____________________
5. Race and ethnicity (may check more than one):
o American Indian or Alaska Native
o Asian
o Black or African American
o Hispanic or Latino/a
o Native Hawaiian and Other Pacific Islander
o White
o Biracial or Multiracial: _________________
o Other: __________________
6. Marital Status:
o Single
o Partnered/Long-term relationship
o Married
o Separated
o Divorced
o Widowed
o Other: _________________

107
7. Highest Level of Education Completed (check one):
o Graduate degree
o Some graduate school
o Degree from a 4-year university
o Degree from a 2-year college
o Vocational School
o Some college
o High school diploma
o General Education Diploma (GED)
o Middle (“junior high”) or primary school
o Other: __________________________
8. Please identify your current career field:
o Counselor
o Psychologist
o Therapist
o Social Worker
o Counselor/Psychologist/Therapist/Social Worker Trainee
o Other
9. Please type your current height (in inches): ________
10. Please type your current weight (in pounds): ________
11. Please mark all of the following that you have been diagnosed with:
o Anorexia Nervosa
o Bulimia Nervosa
o Binge-Eating Disorder
o Other Eating Disorder
o None
12. How many session of psychotherapy or counseling have you previously engaged in:
o Zero
o One to four
o five to ten
o More than ten
13. Are you currently engaged in psychotherapy or counseling:
o Yes
o No

108
Appendix B
Counselor Models
Smallest Female Model
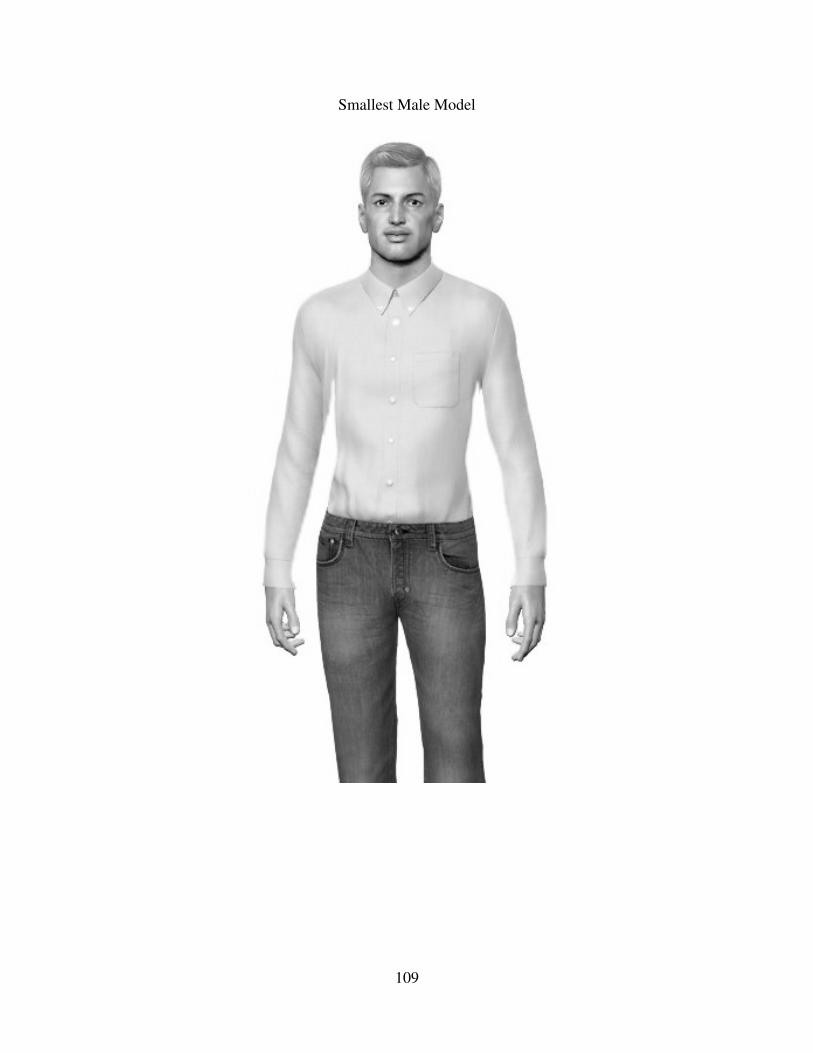
109
Smallest Male Model

110
Second Smallest Female Model

111
Second Smallest Male Model

112
Second Largest Female Model
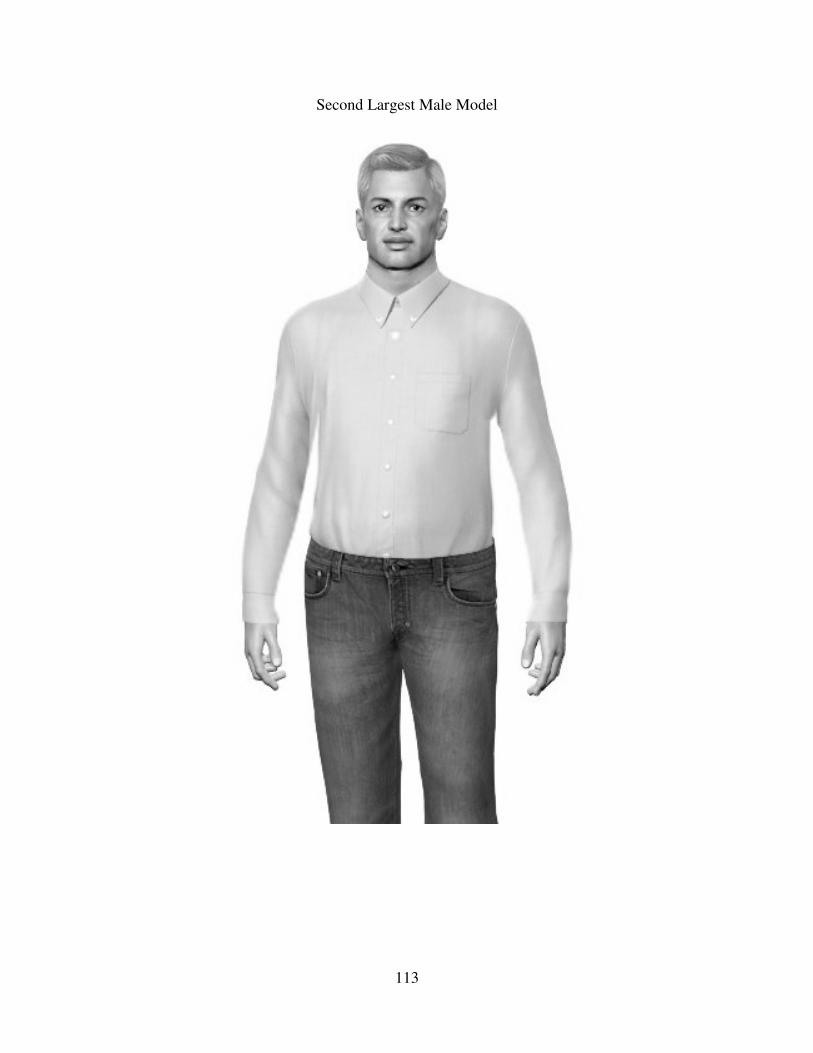
113
Second Largest Male Model

114
Largest Female Model

115
Largest Male Model

116
Appendix C
Written Description to Accompany Models of Counselors
I am Dr. Thomas. I am a licensed psychologist and I specialize in psychotherapy for individuals
and couples. I have a Ph.D. in Counseling Psychology and have been providing psychotherapy
services for approximately ten years. I use a variety of approaches to help clients better
understand themselves and increase their satisfaction in life.

117
Appendix D
Sample Screen Shot of Ad with Model from Survey
118
Appendix E
Description of Task to be Posted on MTurk.com
If you reside in the United States, are at least 19 years old, identify as a woman, and are not
employed as or in training to be a counselor (e.g., job titles including counselor, psychologist,
social worker, or therapist) then you are eligible to participate in a brief research study about
how counselors are perceived in their advertisements. The survey should take no more than 10
minutes and you will be compensated $0.25 for your participation in this study. Please click the
link below for more information and to access the study (You may take the survey only one
time). At the end of the survey, you will receive a unique code to paste into the box below to
receive credit for taking our survey.
Survey link: https://auburn.qualtrics.com/SE/?SID=SV_9ouYFxjXcfm25xz
2084 Haley Center, Auburn, AL 36849-5222; Telephone: 334-844-7676; Fax: 334-844-7677 w w w . a u b u r n . e d u / s e r c
119
Appendix F
Information Letter
DEPARTMENT OF SPECIAL EDUCATION,
REHABILITATION, AND COUNSELING
(NOTE: DO NOT SIGN THIS DOCUMENT UNLESS AN IRB APPROVAL STAMP
WITH CURRENT DATES HAS BEEN APPLIED TO THIS DOCUMENT.)
Information Letter
Auburn University
Department of Special Education, Rehabilitation, and Counseling Psychology
2084 Haley Center
Auburn, AL 36849
You are invited to participate in a research study to investigate how counselors are perceived
in their advertisements. The study is being conducted by Ashley N. Malchow, B.A., under the
direction of Dr. Annette Kluck, in the Auburn University Department of Special Education,
Rehabilitation, and Counseling Psychology. You are a possible participant because you reside in
the United States, are at least 19 years old, identify as a woman, and are not employed as or in
training to be a counselor (e.g., job titles including counselor, psychologist, social worker, or
therapist).
What will be involved if you participate? If you choose to participate, you will be asked to
respond to an online questionnaire that includes demographic information and questions
regarding how you act and think in different situations. You will also be asked to look at an ad
for a counselor and respond to questions about the counselor. This should take about 7 minutes,
possibly up to 10.
Are there any risks or discomforts? The risk to participants in this study is expected to be
minimal. Although unlikely, it is possible that you may experience some psychological
2084 Haley Center, Auburn, AL 36849-5222; Telephone: 334-844-7676; Fax: 334-844-7677 w w w . a u b u r n . e d u / s e r c
120
discomfort while reflecting on yourself and describing how you act and think in different
situations. You may discontinue participation at any time by closing your browser. If you should
experience any psychological discomfort, please contact a mental health provider in your area or
the national crisis hotline at 1-800-273-8255. To find a provider in your area you may use the
following link: http://therapists.psychologytoday.com/ rms/prof_search.php. You are responsible
for all fees incurred for treatment related to your participation in this study.
Will you receive compensation for participating? Each participant who completes the study
will be compensated $0.25. If you choose to participate, you will be provided with a code at the
end of the survey that you can enter into the MTurk.com website to demonstrate completion of
the task and receive payment. All compensation will be made anonymously through the MTurk
website and the investigator will not be able to identify you at any time.
Are there any costs? There are no monetary costs to participants in this study.
If you change your mind about participating, you can withdraw by closing your browser.
However, after you submit the anonymous survey it cannot be withdrawn. You participation is
completely voluntary.
Your privacy will be protected. Information obtained from this study will remain anonymous.
Information obtained through your participation may be published in a professional journal
and/or presented at a professional conference, but such information will not and cannot be
directly connected with you or any other participants.
If you have questions about this study, please contact Ashley N. Malchow at
[email protected] or Dr. Annette Kluck at [email protected].
If you have questions about your rights as a research participant, you may contact the
Auburn University Office of Human Subjects Research Compliance of the Institutional Review
Board by phone (334) 844-5966 or e-mail at [email protected] or [email protected].
SELECT “I WISH TO PARTICIPATE” AND CLICK THE FORWARD BUTTON (>>)
BELOW IF…
• YOU WANT TO PARTICIPATE AND
• RESIDE IN THE UNITED STATES AND
• IDENTIFY AS FEMALE AND
• ARE 19 YEARS OF AGE OR OLDER AND
• ARE NOT EMPLOYED AS OR IN TRAINING TO BE A COUNSELOR.

2084 Haley Center, Auburn, AL 36849-5222; Telephone: 334-844-7676; Fax: 334-844-7677 w w w . a u b u r n . e d u / s e r c
121
IF YOU DO NOT WISH TO PARTICIPATE, JUST CLOSE YOUR BROWSER WINDOW.
YOU MAY PRINT THIS LETTER TO KEEP IF YOU WISH.
The Auburn University Institutional Review Board has approved this document for use from
May 18, 2014 to May 17, 2015. Protocol #14-206 EP 1405

2084 Haley Center, Auburn, AL 36849-5222; Telephone: 334-844-7676; Fax: 334-844-7677 w w w . a u b u r n . e d u / s e r c
122
Appendix G
Debriefing Letter
DEPARTMENT OF SPECIAL EDUCATION,
REHABILITATION, AND COUNSELING
Debriefing
For the Study entitled:
“Client Perception of Counselor Body Size: Effect on Evaluations”
Dear Participant:
During this study, you were asked to respond to an online questionnaire that included
demographic information and questions regarding how you act and think in different situations.
You were also asked to look at pictures of counselors and respond to questions about the pictured
counselors. You were told that the purpose of this study was to investigate how counselors are
perceived in their advertisements. The actual purpose of this study was to examine potential
differences in how competent a counselor is rated to be depending on the counselor’s perceived
body size and how traits in respondents may affect the way people judge counselor’s competence
based on body size. In this case, we asked you to provide information about impulsiveness. We
did not tell you everything about the purpose of the study because having the knowledge may
have influenced the way you responded to questions.
You are reminded that of the consent document at the start of the survey in which you were
informed that you could discontinue at any time and that this is an anonymous study for which
no identifying data is being collected meaning that it will not be possible to track or identify
individual participants. Please contact the primary investigator at [email protected]
if we can answer questions you have about this study.

2084 Haley Center, Auburn, AL 36849-5222; Telephone: 334-844-7676; Fax: 334-844-7677 w w w . a u b u r n . e d u / s e r c
123
If you felt discomfort during your participation or after reading more about the purpose of the
study, you are encouraged to contact a mental health provider in your area or the national crisis
hotline at 1-800-273-8255. To find a provider in your area you may use the following link:
http://therapists.psychologytoday.com/rms/prof_search.php. You are responsible for all fees
incurred related to treatment following your participation in this study.
If you have questions about your participation in the study, please contact Ashley N. Malchow at
[email protected], or her faculty advisor, Dr. Annette Kluck, at
If you have questions about your rights as a research participant, you may contact the Auburn
University Office of Human Subjects Research Compliance of the Institutional Review Board by
phone (334) 844-5966 or e-mail at [email protected] or [email protected].
Please again accept our appreciation for your participation in this study. Please click the next
button below to receive a code that you may enter in the MTurk.com website to receive payment
for your time. All compensation will be made anonymously through the MTurk website and the
investigator will not be able to identify you at any time.
Ashley Malchow Dr. Annette Kluck 05/18/2014
Doctoral Candidate Faculty Advisor
Auburn University
Department of Special Education, Rehabilitation, & Counseling Psychology
2084 Haley Center, Auburn, AL 36849-5222; Telephone: 334-844-7676; Fax: 334-844-7677
w w w . a u b u r n . e d u / s e r c

124