Client Document: Introduction to HilltopSecurities … Document: Introduction to HilltopSecurities...
21
Client Document: Introduction to HilltopSecurities April 2016
Transcript of Client Document: Introduction to HilltopSecurities … Document: Introduction to HilltopSecurities...

Client Document: Introduction to HilltopSecurities April 2016

2
HilltopSecurities
Southwest Securities + FirstSouthwest = HilltopSecurities
HilltopSecurities represents the combination of two established and
successful broker-dealers – Southwest Securities and FirstSouthwest.
These two firms were combined in January 2016 as HilltopSecurities,
launching a new chapter as the principal broker-dealer subsidiary of
Hilltop Holdings Inc.
Primary business lines:
• Capital Markets
• Public Finance
• Retail
• Clearing Services
• Structured Finance
• Securities Lending
HilltopSecurities Office Locations

3
HilltopSecurities: At A Glance
• Wholly owned subsidiary of Hilltop Holdings Inc. (NYSE: HTH)
• Created through the combination of Southwest Securities Inc. and First
Southwest Company
• More than 100 years of combined industry experience
• Approximately 1,000 employees
• More than 50 office locations in 18 states
• Public Finance ranked #1 financial advisor in 2015 by number of new issues1
• Nation’s 3rd largest Clearing Services firm by number of broker-dealer clients2
• $14 billion in Retail assets under management
• $22 billion in Clearing Services client assets
• $25 billion in Municipal Cash Management assets under management1 Source: Ipreo MuniAnalytics
2 Source: Investment News
All information as of Dec. 31, 2015 for FirstSouthwest and Southwest Securities combined
HilltopSecurities serves as a trusted advocate for our clients nationwide,
delivering the forthright advice and tailored solutions necessary for municipal
issuers, institutions, broker-dealers and individuals to thrive.

4
HilltopSecurities – Overview
• Main revenue generating business lines
include:
• Capital Markets: institutional sales and trading
of munis and taxable fixed income; muni
underwritings; portfolio trading
• Public Finance: generates financial advisory
and underwriting fees for debt issuances of
municipalities
• Retail: employed financial advisors in Pacific
and Gulf regions and independent advisors
nationwide as part of HilltopSecurites
Independent Network
• Clearing Services: provides transaction
clearing and ancillary services to
correspondents
• Structured Finance: includes TBA business,
which provides interest rate protection for
housing authorities
• Securities Lending: lends and borrows stock
from third parties
24%
26%
29%
Key Highlights 20142 20153
Income Before Taxes, ex. Integration Costs ($000) 6,863 14,938
Compensation/Net Revenue (%) 59.7 69.6
FDIC Insured Balances at PCB ($M) $281 $846
Other FDIC Insured Balances ($M) $194 $1,380
Total FDIC Insured Balances ($M) $475 $2,226
Net revenue1 for 12 months ended 12/31/15 ($M)
1 Net revenue is total revenues less interest expense.2 2014 data only includes results of FSW.3 2015 results include FSW and SWS and Income Before Taxes excludes $15.2 million
integration charges related to the merger of the broker-dealers.
Retail, 26%
Public Finance, 25%
Capital Markets, 21%
Structured Finance,
13%
Clearing, 9%
Securities Lending, 3% Other, 3%
Notes: Net revenue for twelve months ended 12/31/15 includes both FSW and SWS.
5
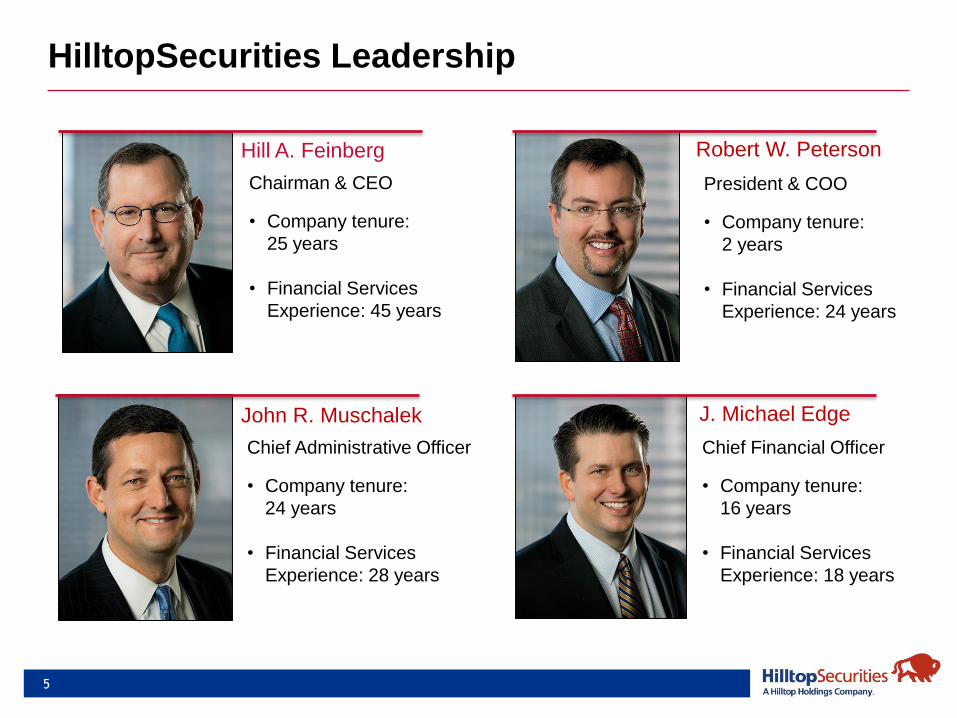
HilltopSecurities Leadership
Hill A. Feinberg Robert W. Peterson
John R. Muschalek J. Michael Edge
Chairman & CEO
• Company tenure:
25 years
• Financial Services
Experience: 45 years
President & COO
• Company tenure:
2 years
• Financial Services
Experience: 24 years
Chief Administrative Officer
• Company tenure:
24 years
• Financial Services
Experience: 28 years
Chief Financial Officer
• Company tenure:
16 years
• Financial Services
Experience: 18 years

6
HilltopSecurities Department Leaders
Dan Leland
Capital Markets
Company tenure:
21 years
Financial Services
Experience:
33 years
Lisa Palmeri
Securities Lending
Company tenure:
24 years
Financial Services
Experience:
30 years
Jack Addams
Public Finance
Company tenure:
16 years
Financial Services
Experience:
44 years
Lana Calton
Clearing Services
Company tenure:
24 years
Financial Services
Experience:
24 years
Mike Marz
Structured Finance
Company tenure:
23 years
Financial Services
Experience:
37 years
Dave Geschke
Wealth Management
Company tenure:
2 years
Financial Services
Experience:
29 years

Hilltop Holdings(NYSE: HTH)
7

Notes: (1) Per SNL Financial
(2) Per Marketrac; based on 2015 data
(3) Based on number of retail financial advisors
8
Hilltop Holdings Overview
• Hilltop Holdings is a Dallas, Texas-based diversified financial holding company with a complementary set of
operating companies
• Hilltop Holdings is listed on the NYSE under the ticker symbol HTH
• Hilltop Holdings provides banking, mortgage origination, financial advisory and insurance through its subsidiaries:
• PlainsCapital Bank is the 6th largest1 Texas-based bank with 67 operating branches located in all major
Texas markets
• PrimeLending is the 6th largest2 mortgage originator in the U.S. by purchase units and has over 280
locations in 41 states
• Hilltop Securities is the largest (3) full-service brokerage firm headquartered in the Southwestern United
States and focuses on retail brokerage services, clearing services, sales, underwriting and trading of taxable
and tax-exempt securities, public finance advisory, structured finance and securities lending
• National Lloyds is a niche insurance company that provides primarily fire and homeowners insurance for
low value dwellings in Texas and other southern states

9
Combination of Franchises
Q4 ’15 HTH Key Statistics ($ mill.)
Total Assets $11,867
Common Equity $1,737
Employees (#) 5,300
Locations (#) 400
• 5 employee parent
company with $530
million in cash and
NYSE public listing
(“HTH”)
• $300 million asset
homeowners insurance
company generating
~$150 million in
premiums with approx.
150 employees
• $5.2 billion asset
commercial bank with
33 branches and
approx. 700 employees
• $970 million asset
mortgage company
originating ~$10 billion
in mortgages with
approx. 2,400
employees and 270
branches
• $640 million asset
broker-dealer with
approx. 400 employees
and annual revenue of
$111 million
• Commercial bank with
approx. 700 employees
and a significant South
Texas presence
through 51 branches
• Assumed $2.6 billion in
assets through FDIC
assisted transaction
• $3.1 billion asset
broker-dealer with
approx. 700 employees
and annual revenue of
$240 million
• $1.3 billion asset bank
with approx. 170
employees and 13
locations in Texas and
New Mexico
Notes: HTH and NL statistics as of Q1 2012 (prior to PCC acquisition). PCC, FNB and SWS statistics each represent approximate numbers as of time period prior to respective
acquisition announcement.
Hilltop Holdings &
National Lloyds
PlainsCapital Bank
& PrimeLending &
FirstSouthwest
First National Bank
of Edinburg
Southwest
Securities, Inc. &
Southwest
Securities, FSB

10
Texas-Based with National Presence
* Locations as of Oct. 9, 2015

Gerald J. Ford
Chairman of the Board and Largest Shareholder
• Company Tenure: 11 years
• Financial Services Experience: 41 years
Jeremy B. Ford
President and CEO, HTH
• Company Tenure: 6 years
• Financial Services Experience: 17 years
Darren E. Parmenter
Principal Financial Officer, HTH
• Company Tenure: 16 years
• Financial Services Experience: 16 years
Corey G. Prestidge
General Counsel, HTH
• Company Tenure: 9 years
• Financial Services Experience: 12 years
11
Strong Leadership
Jerry L. Schaffner
President & CEO
PlainsCapital Bank
• Company Tenure:
28 years
• Financial Services
Experience: 34 years
Todd Salmans
CEO
PrimeLending
• Company Tenure:
10 years
• Financial Services
Experience: 42 years
Hill A. Feinberg
Chairman & CEO
Hilltop Securities
• Company Tenure:
25 years
• Financial Services
Experience: 45 years
Robert Otis
CEO
National Lloyds
• Company Tenure:
2 years
• Financial Services
Experience: 27 years
Alan B. White
Vice Chairman, HTH; Chairman & CEO, PCC
• Company Tenure: 28 years
• Financial Services Experience: 46 years
James R. Huffines
President and COO, PCC
• Company Tenure: 17 years
• Financial Services Experience: 39 years
John A. Martin
CFO, PCC
• Company Tenure: 6 years
• Financial Services Experience: 41 years
• Hilltop Holdings (HTH) • PlainsCapital Corporation (PCC)
• Subsidiary CEOs

Other HTH Company Summaries
12

13
PlainsCapital Bank – Overview
• State chartered, Federal Reserve member institution
with $8.7 billion in assets and $6.5 billion in deposits
• Provides commercial banking, retail banking, trust,
treasury management and wealth management
• Community banking business model provides
superior customer service and responsive decision
making
• 67 branches in 12 MSAs, including Dallas / Fort
Worth (#10), Lubbock (#2), Austin (#10), San Antonio
(#22), Rio Grande Valley (#8 in McAllen) and
Houston
• Current PCB platform comprised of legacy
PlainsCapital Bank franchise, First National Bank
Edinburg and Southwest Securities, FSB
Branch Map (67 Branches)
Rank
Texas Headquartered
Banks & Thrifts Branches
Deposits
($mm)
Market Share
(%)
1 Cullen/Frost Bankers Inc. 136 23,894 3.63
2 Prosperity Bancshares Inc. 254 15,180 2.31
3 Texas Capital Bancshares Inc. 13 14,042 2.13
4 Comerica Inc. 134 10,317 1.57
5 International Bancshares Corp. 162 7,159 1.09
6 PlainsCapital Bank 67 6,333 0.96
Source: SNL Financial
Deposit market share data as of June 30, 2015 and pro forma for acquisitions
Includes banks & thrifts headquartered in Texas
Texas Deposit Market Share
Key Highlights 2014 2015
Income Before Taxes ($000) 139,109 175,411
ROAA (%) 1.20 1.36
NIM (%) 5.00 5.08
Efficiency (%) 61.2 56.5
Tier 1 Leverage (%) 10.31 13.22

14
PrimeLending – Overview
1,866
2,839 2,946 2,713 2,814
3,834 3,639
3,066
-
500
1,000
1,500
2,000
2,500
3,000
3,500
4,000
Q1 '14 Q2 '14 Q3 '14 Q4 '14 Q1 '15 Q2 '15 Q3 '15 Q4 '15
Vo
lum
e (
$M
)
• PrimeLending has grown from a staff of 20 producing $80
million in annual closed loan volume to a staff of
approximately 2,500 producing $13.4 billion in 2015
• Quality franchise with a strong retail platform and focus on
the purchase mortgage business, which represented 74% of
volume in 2015 versus the US industry average of 63%
• Expeditious loan processing, underwriting and closing in-
house
• Generates noninterest income (gain on sale) by selling
substantially all mortgage loans it originates to investors in
the secondary market (majority servicing released)
• Ranked #6 in US in purchase units by Market Trac for 2015
Key Highlights 2014 2015
Income Before Taxes ($000) 12,365 47,483
Volume ($M) 10,364 13,352
Volume (Units) 48,655 59,621
Volume (% Purchase) 80.1% 74.1%
Volume (% Conventional) 62.6% 62.9%
Servicing Asset ($M) 36.2 52.3
Estimated US
Market Share: 0.85%0.98%0.98%0.96%0.76% 0.97% 0.96% 0.81%
Note: Market share based on Mortgage Bankers Association forecast of industry volume

National Lloyds – Overview
15
17,530
11,412
(5,459)
8,186
11,569 9,136
(12,526)
12,006
7,034
40%
46%
87%
54%
44% 48%
102%
42%
53%
0%
20%
40%
60%
80%
100%
120%
(15,000)
(10,000)
(5,000)
0
5,000
10,000
15,000
20,000
Q4'13 Q1'14 Q2'14 Q3'14 Q4'14 Q1'15 Q2'15 Q3'15 Q4'15
Lo
ss a
nd
LA
E R
atio
(%
)
Pre
-Ta
x I
nco
me
($
00
0)
Pre-Tax Income ($000) Loss and LAE Ratio (%)
• National Lloyds is Texas-based niche P&C underwriter
that has specialized in low-value homeowners and
mobile home products for over 40 years
• Mainly in Texas, Oklahoma and Arizona, as well as
other southern states
• Typical to have underwriting losses in Q2 from
seasonal tornado and hail events in Texas
• Distribution via an established network of over 6,500
independent agents
• Supported by conservative catastrophic reinsurance
program and investment portfolio
• A.M. Best “A” (Excellent) Rated
Key Highlights ($000) 2014 2015
Income Before Taxes 25,708 15,652
Direct Premium Written 172,464 167,025
2015 Direct Premiums Written
Homeowners44%
Fire31%
Mobile Home23%
Commercial2%
HTH Consolidated Results - 2015
16
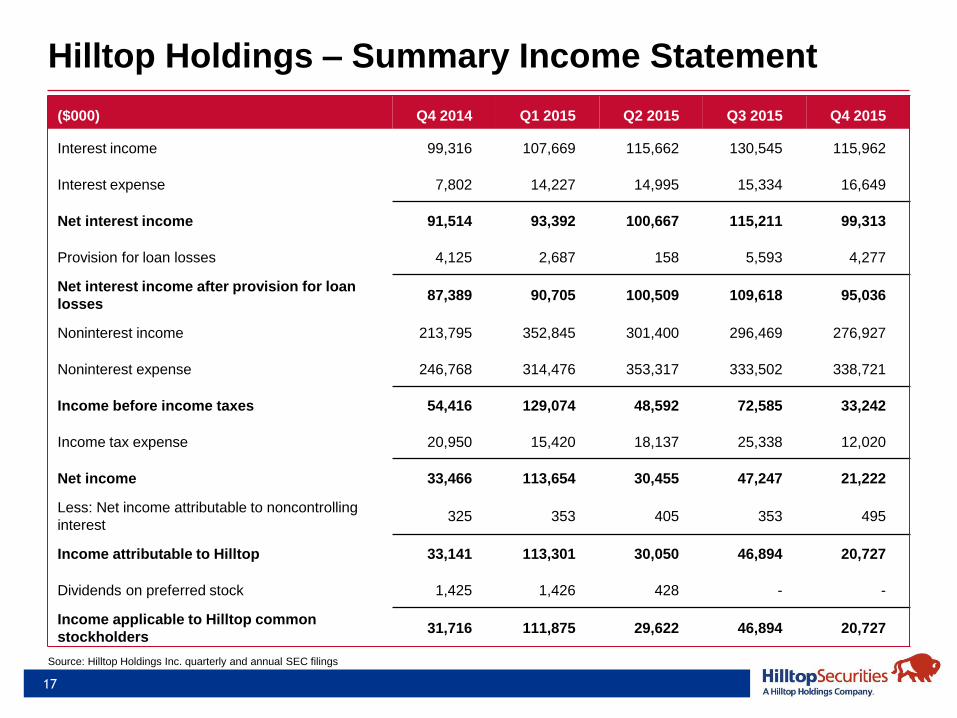
Hilltop Holdings – Summary Income Statement
17
Source: Hilltop Holdings Inc. quarterly and annual SEC filings
($000) Q4 2014 Q1 2015 Q2 2015 Q3 2015 Q4 2015
Interest income 99,316 107,669 115,662 130,545 115,962
Interest expense 7,802 14,227 14,995 15,334 16,649
Net interest income 91,514 93,392 100,667 115,211 99,313
Provision for loan losses 4,125 2,687 158 5,593 4,277
Net interest income after provision for loan
losses87,389 90,705 100,509 109,618 95,036
Noninterest income 213,795 352,845 301,400 296,469 276,927
Noninterest expense 246,768 314,476 353,317 333,502 338,721
Income before income taxes 54,416 129,074 48,592 72,585 33,242
Income tax expense 20,950 15,420 18,137 25,338 12,020
Net income 33,466 113,654 30,455 47,247 21,222
Less: Net income attributable to noncontrolling
interest325 353 405 353 495
Income attributable to Hilltop 33,141 113,301 30,050 46,894 20,727
Dividends on preferred stock 1,425 1,426 428 - -
Income applicable to Hilltop common
stockholders31,716 111,875 29,622 46,894 20,727
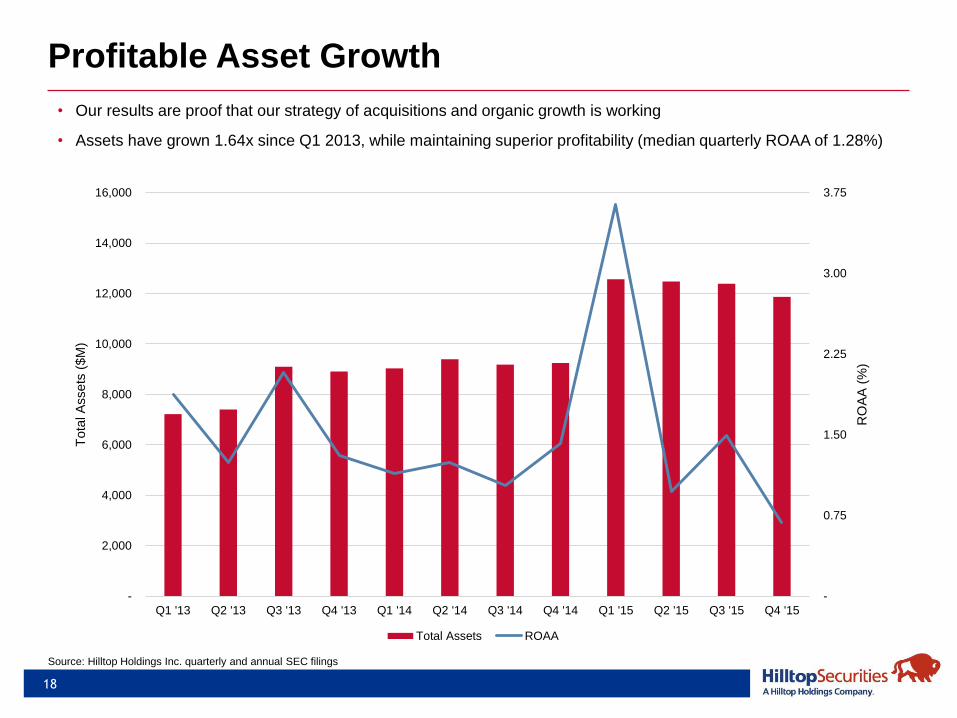
Profitable Asset Growth
18
Source: Hilltop Holdings Inc. quarterly and annual SEC filings
-
0.75
1.50
2.25
3.00
3.75
-
2,000
4,000
6,000
8,000
10,000
12,000
14,000
16,000
Q1 '13 Q2 '13 Q3 '13 Q4 '13 Q1 '14 Q2 '14 Q3 '14 Q4 '14 Q1 '15 Q2 '15 Q3 '15 Q4 '15
RO
AA
(%
)
Tota
l A
ssets
($M
)
Total Assets ROAA
• Our results are proof that our strategy of acquisitions and organic growth is working
• Assets have grown 1.64x since Q1 2013, while maintaining superior profitability (median quarterly ROAA of 1.28%)

Strong History of Earnings
19
Source: Hilltop Holdings Inc. quarterly and annual SEC filings
• Hilltop is financially stable and has significant long-term earnings power
• Since Jan. 1, 2013, Hilltop has generated cumulative net income of $438 million
-
50.0
100.0
150.0
200.0
250.0
300.0
350.0
400.0
450.0
500.0
Q1 '13 Q2 '13 Q3 '13 Q4 '13 Q1 '14 Q2 '14 Q3 '14 Q4 '14 Q1 '15 Q2 '15 Q3 '15 Q4 '15
Cu
mula
tive N
et
Incom
e to C
om
mon G
enera
ted (
$M
)

20
HTH Market Performance
(50.00)
0.00
50.00
100.00
150.00
200.00
3/2/2011 3/2/2012 3/2/2013 3/2/2014 3/2/2015 3/2/2016
Sto
ck P
rice
Ch
an
ge
(%
)
HTH KBW Bank Index S&P 500
+90%
+52%
+23%
Market Update
Ticker HTH
Stock Price $18.06
Shares O/S 98.9mm
Market Cap. $1.8bn
Market Multiples (x)
Price / Tangible Book Value 1.25
Price / 2016 Earnings 11.0
• Over the last 5 years, Hilltop has outperformed the banking sector, as well as the broader market
Note: As of Mar. 2, 2016

Hilltop Securities Inc.
1201 Elm Street, Suite 3500
Dallas, TX 75270
1.800.973.7977
HilltopSecurities.com