Click to edit Master title style Biomass Vision and ... · Click to edit Master title style Biomass...
27
Biomass Vision and Roadmap Update Current status of process 1 • The Vision for Bioenergy and Biobased Products in the United States was created in 2002 • It established far-reaching goals to increase the role of biobased energy and products in our nation’s economy. • It represented the collective vision of the Biomass Research and Development Technical Advisory Committee established by the Biomass R&D Act of 2000. 2 1 What is the Vision Statement?
Transcript of Click to edit Master title style Biomass Vision and ... · Click to edit Master title style Biomass...

Click to edit Master title style
Click to edit Master title style
Biomass Vision and Roadmap Update
Current status of process
1
bull The Vision for Bioenergy and Biobased Products in the United States was created in 2002
bull It established far-reaching goals to increase the role of biobased energy and products in our nationrsquos economy
bull It represented the collective vision of the Biomass Research and Development Technical Advisory Committee established by the Biomass RampD Act of 2000
2
1
What is the Vision Statement
Click to edit Master title style
Click to edit Master title style
Post Vision Workshop Agenda
bull Obtained Technical Advisory Committee input on Vision Executive Summary
bull Follow-up analysis and peer review carried out to ensure targets were valid in relation to available feedstocks conversion technologies etc
bull Developed draft Vision by December 31 2005
bull Final Vision will be issued shortly 3
Post Vision Workshop Agenda cont
bull The updated Vision does not change the original2010 goals but recognizes that in some casesthe US is not on track to meet them
bull The Vision makes minor changes to its 2020 and2030 goals and establishes 2015 goals whichdescribe the types of activities that must occur to reach that goal and move down the path to theaggressive targets for 2020 and 2030
bull Finally the updated Vision sets a long-term target for 2050 and the role that biomass canplay in energy and product markets at that time
4
2
Click to edit Master title style
Click to edit Master title style
Original Vision Goals - 2002
2001 2010 2020 2030 BioPower Biomass share of electricity amp heat demand in utilities and industry
BioFuels Biomass share of demand for transportation fuels
BioProducts Share of target chemicals that are biobased
3 (27 quads)
05 (015 quads)
5
4 (33 quads)
4 (13 quads)
12
5 (40 quads)
10 (40 quads)
18
5 (50 quads)
20 (95 quads)
25
5
Updated Vision Goals ndash 2005
Vision Goals Units 2000 2004 2010 2015 2020 2030
Biopower
Market share () 4 4 4 55 7 7 Consumption (Quadrillion Btu) 22 21 31 32 34 38
Biofuels
Market share () 07 12 4 6 10 20 Consumption (million gasoline-equivalent gallons) 1100 2100 8016 12852 22725 50994
Bioproducts Production (billion lbs) 124 176 237 264 356 553
6
3
Click to edit Master title style
Click to edit Master title style
What is the Roadmap
bull The Biomass RampD Act of 2000 called for the USDA and DOE to jointly carry out a biomass research and development initiative in the areas of biofuels and bioproducts
bull It also established the Biomass RampD Technical Advisory Committee to advise on the technical program
7
Roadmap Update Process
bull Roadmap Update Workshops will be planned by Regional Chairs with BCSDOE support
bull Roadmaps will incorporate regional experts pertaining to the Roadmapcategories Feedstocks Processing andConversion Product Uses and Distribution Public Policy
bull Workshops will be facilitated by BCS
8
4
Click to edit Master title style
Click to edit Master title style
Regional Roadmap Workshops
bull Update Roadmap language bull Incorporate New federalstate activities
ndash Renewable Fuels Standards bull Produce 71 million gallons of ethanol by 2012
ndash Biofuels Initiative bull Decrease cost to $104 per gallon of ethanol by 2010 bull Displace 40 million gasoline equivalent gallons by 2030
bull Revisit path towards achieving Vision Goals bull Invitation only with regional experts
9
Roadmap Timeline
bull Midwest Regional Roadmap ndash Chair Tom Binder ADM ndash Chicago IL April 11-12 2006
bull West Regional Roadmap ndash Ralph Cavalieri Washington State ndash Sacramento CA August 8-9 2006
bull East Regional Roadmap ndash Douglas Hawkins Rohm amp Haas ndash New York Fall 2006
10
5
Click to edit Master title style
Click to edit Master title style
Other Biomass Roadmap Related Activities
bull Oregon Forest Research Institute Biomass Report
bull Pulp amp Paper Industry Roadmap bull CEC Roadmap bull DOE Office of Science Roadmap bull Other state roadmaps
11
Why have a Roadmap
12
6
Click to edit Master title style
Click to edit Master title style
14
13
Light Sweet Crude Prices
7
Click to edit Master title style
15
Click to edit Master title style
16
8
Click to edit Master title style
Click to edit Master title style
17
18
9
Click to edit Master title style
19
Click to edit Master title style
20
10
Click to edit Master title style
Click to edit Master title style
What role can biomass play
21
22
Fuel Production Capacity Million Gallons per Year
2004 data
0
1000
2000
3000
4000
5000
Ethanol Biodiesel
Current Under Construction 0
20000
40000
60000
80000
100000
120000
140000
Gasoline Ethanol Biodiesel 2030 Goal
11
Click to edit Master title style
Click to edit Master title style
24
US Corn Yield
23
US Agricultural Economy and Biomass
bull Ethanol and biodiesel industry creates domestic jobs
bull Ethanol industry has grown to 81 plants in 20 states which support 147000 jobs in the UnitedStates mostly in rural communities
bull On average a 40 million gallon per year ethanol plant supports 41 full-time jobs andnearly 700 jobs throughout the entire economy
bull Cuts the trade deficit by $341 billion through 2012
(Data 82005 From httpwwweereenergygovbiomasseconomic_growthhtmltrade and ldquoHomegrown for the Homeland - Ethanol Industry Outlook for 2005rdquo)
AS OF December 2005
In operation Under construction Proposed
12
Click to edit Master title style
Click to edit Master title style
25
Corn Production and Use 1999-2006
0
2000
4000
6000
8000
10000
12000
1999-2000
2000-2001
2001-2002
2002-2003
2003-2004
2004-2005
2005-2006
2006-2007
Production Use
26
Corn Use ndash 1999-2015
500
2500
4500
6500
8500
10500
12500
14500
2000-2001
2003-2004
2004-2005
2005-2006
2009-2010
2013-2014
2014-2015
Use Ethanol Exports Livestock Ethanol2
13
Click to edit Master title style
Click to edit Master title style
28
27According to the EIA
The AEO2006 reference case includes only those sections of EPACT2005 (the recent Energy Bill) that establish specific tax credits incentives or standardsmdashabout 30 of the roughly 500 sections in the legislation
7317
8713
0
2000
4000
6000
8000
10000
12000
2000 2005 2010 2015 2020 2025 2030
EIA 2006USCorn Ethanol Production
PRX Ethanol Production Forecast
Energy ActRFS
Energy Information Admnistration (EIA) US DOE Annual Energy Outlook (AEO)
2006 Outlook
EIA ethanol production outlook trailing presentand scheduled dry mill expansion rate In
2010 PRX forecast is higher by 1400 mil galor about 500 mil bu corn
US CORN ETHANOL PRODUCTION with PRX ESTIMATE Million gallons
PRX
RFS
PRX_EIAlongtermPRXrev 04-Jan-06
14
Click to edit Master title style
Ethanol Use RequirementsLaw enacted Legislative Proposals (05-06)
29
E-10
TBD E-10
20 2012
57
E-10
E-10
2006
10 200810
2007 10 2010
10 200810
2010 10 2007
10 2010
5 2006
10 TBD
25 RF 2015
10 TBD
Comparative Results of Ethanol Energy Balance Studies 1995-2005
Shapouri et al
LorenzMorris Wang et al
Agri-Food Canada
Shapouri et al
KimDale
Graboski
Wang et al
Shapouri et al
Pimentel
PimentelPatzek
Pimentel
30000
20000
139
126
113
0
-113
-126Net E
nerg
y Valu
e (Bt
uga
llon)
Net E
nerg
y Valu
e Rat
io
10000
0
-10000
-20000
-139-30000
1995 1996 1997 1998 1999 2000 2001 2002 2003 2004 2005
Avg NEV minus Pimentel (3) Average NEV with Pimentel
24336 Btu (132 NEV ratio) 11739 Btu (115 NEV ratio)
Calculations assume low heat value energy content of ethanol is 76330 BTUgallon Sources Office of Energy Efficiency and Renewable Energy (US Department of Energy) Dale Bruce Michigan State University presentation at World Congress on Industrial Biotechnology amp Bioprocessing Orlando Florida April 22 2005
For more information call the National Corn Growers Association at (636) 733-9004 or go to wwwncgacom
15
Click to edit Master title style
Click to edit Master title style
32
Biodiesel USA
Production
GalYear
2000 1989400
2001 6437200
2002 8814600
2003 18400000
2004 18900000
2005 100000000 Source CCC Data Estimate
31
16
0
200
400
600
800
2004 2005 2006 2007 2008
MGYEAR
BBI International
Click to edit Master title style
Click to edit Master title style
33
Soy Oil Price History
Source httpwwwpalmoilcomindexphpq=D1VTW1NASgIEAhEbVg9RAAsI Data from Chicago Board of Trade
34
Palm Oil Prices
17
Click to edit Master title style
Click to edit Master title style
US Soy Oil Consumption
bull Crop Year 2004 Approx Production 187 B lbs
bull 75 billion pounds of biodiesel derived from soy oil would represent approximately 40 of current total soy oil demand This would be 1 billion gallons or 2 of diesel demand
35
Cellulosic Ethanol from Energy Crops
bull Dedicated perennial energy crop production potential
bull On Conservation Reserve Program (CRP) Acreage
bull Using switchgrass hybrid poplar willow etc
36
18
Click to edit Master title style
37
Click to edit Master title style
38
Switchgrass Production Areas with data available
Walsh M et al Environmental and Resource Economics 24 313ndash333 2003
19
Click to edit Master title style
Click to edit Master title style
39Walsh M et al Environmental and Resource Economics 24 313ndash333 2003
Hybrid Poplar Production Areas with data available
40Walsh M et al Environmental and Resource Economics 24 313ndash333 2003
Willow Production Areas with data available
20
Click to edit Master title style
Click to edit Master title style
42
41
0 200 400 600 800 1000 1200 1400
Million dry tons per year
Forest resources
Agricultural resources
Total resource potential
Annual biomass resource potential
Data from ldquoBiomass as Feedstock for a Bioenergy and Bioproducts Industry The Technical Feasibility of a Billion-Ton Annual Supplyrdquo DOE and USDA April 2005
368
998
1366
21
Click to edit Master title style
Click to edit Master title style
43
Agricultural Biomass for Energy
377
446
87
87
0 200 400 600
Million dry tons per year
Grain-to-ethanol Process residues Crop residues Perennial crops
Data from ldquoBiomass as Feedstock for a Bioenergy and Bioproducts Industry The Technical Feasibility of a Billion-Ton Annual Supplyrdquo DOE and USDA April 2005
44
22
Click to edit Master title style
Click to edit Master title style
45
What conversion technologies are available
46
23
Click to edit Master title style
Click to edit Master title style
Biomass
Bio-Chemical Thermo-Chemical Platform Platform
Mixed Sugars Lignin amp Residues Conditioned Gas Oils Residues
Fuels Chemicals Materials Heat amp Power
ldquoThe Integrated Biorefineryrdquo Technology Validation and Systems
Don Richardson Office of the Biomass Program September 29 2004 Integration
47
Cellulosic Biorefinery Vision
An integratedbiorefinery makesuse of ndash Thermochemical
conversion technology
ndash Biochemical Don Richardson Office of the Biomass Program September 29 2004 conversion
technology 48
ndash Existing technology
24
Click to edit Master title style
Click to edit Master title style
49
50
25
Click to edit Master title style
51
Click to edit Master title style
52
26
Click to edit Master title style
53
Roadmap to this Future
27

Click to edit Master title style
Click to edit Master title style
14
13
Light Sweet Crude Prices
7
Click to edit Master title style
15
Click to edit Master title style
16
8
Click to edit Master title style
Click to edit Master title style
17
18
9
Click to edit Master title style
19
Click to edit Master title style
20
10
Click to edit Master title style
Click to edit Master title style
What role can biomass play
21
22
Fuel Production Capacity Million Gallons per Year
2004 data
0
1000
2000
3000
4000
5000
Ethanol Biodiesel
Current Under Construction 0
20000
40000
60000
80000
100000
120000
140000
Gasoline Ethanol Biodiesel 2030 Goal
11
Click to edit Master title style
Click to edit Master title style
24
US Corn Yield
23
US Agricultural Economy and Biomass
bull Ethanol and biodiesel industry creates domestic jobs
bull Ethanol industry has grown to 81 plants in 20 states which support 147000 jobs in the UnitedStates mostly in rural communities
bull On average a 40 million gallon per year ethanol plant supports 41 full-time jobs andnearly 700 jobs throughout the entire economy
bull Cuts the trade deficit by $341 billion through 2012
(Data 82005 From httpwwweereenergygovbiomasseconomic_growthhtmltrade and ldquoHomegrown for the Homeland - Ethanol Industry Outlook for 2005rdquo)
AS OF December 2005
In operation Under construction Proposed
12
Click to edit Master title style
Click to edit Master title style
25
Corn Production and Use 1999-2006
0
2000
4000
6000
8000
10000
12000
1999-2000
2000-2001
2001-2002
2002-2003
2003-2004
2004-2005
2005-2006
2006-2007
Production Use
26
Corn Use ndash 1999-2015
500
2500
4500
6500
8500
10500
12500
14500
2000-2001
2003-2004
2004-2005
2005-2006
2009-2010
2013-2014
2014-2015
Use Ethanol Exports Livestock Ethanol2
13
Click to edit Master title style
Click to edit Master title style
28
27According to the EIA
The AEO2006 reference case includes only those sections of EPACT2005 (the recent Energy Bill) that establish specific tax credits incentives or standardsmdashabout 30 of the roughly 500 sections in the legislation
7317
8713
0
2000
4000
6000
8000
10000
12000
2000 2005 2010 2015 2020 2025 2030
EIA 2006USCorn Ethanol Production
PRX Ethanol Production Forecast
Energy ActRFS
Energy Information Admnistration (EIA) US DOE Annual Energy Outlook (AEO)
2006 Outlook
EIA ethanol production outlook trailing presentand scheduled dry mill expansion rate In
2010 PRX forecast is higher by 1400 mil galor about 500 mil bu corn
US CORN ETHANOL PRODUCTION with PRX ESTIMATE Million gallons
PRX
RFS
PRX_EIAlongtermPRXrev 04-Jan-06
14
Click to edit Master title style
Ethanol Use RequirementsLaw enacted Legislative Proposals (05-06)
29
E-10
TBD E-10
20 2012
57
E-10
E-10
2006
10 200810
2007 10 2010
10 200810
2010 10 2007
10 2010
5 2006
10 TBD
25 RF 2015
10 TBD
Comparative Results of Ethanol Energy Balance Studies 1995-2005
Shapouri et al
LorenzMorris Wang et al
Agri-Food Canada
Shapouri et al
KimDale
Graboski
Wang et al
Shapouri et al
Pimentel
PimentelPatzek
Pimentel
30000
20000
139
126
113
0
-113
-126Net E
nerg
y Valu
e (Bt
uga
llon)
Net E
nerg
y Valu
e Rat
io
10000
0
-10000
-20000
-139-30000
1995 1996 1997 1998 1999 2000 2001 2002 2003 2004 2005
Avg NEV minus Pimentel (3) Average NEV with Pimentel
24336 Btu (132 NEV ratio) 11739 Btu (115 NEV ratio)
Calculations assume low heat value energy content of ethanol is 76330 BTUgallon Sources Office of Energy Efficiency and Renewable Energy (US Department of Energy) Dale Bruce Michigan State University presentation at World Congress on Industrial Biotechnology amp Bioprocessing Orlando Florida April 22 2005
For more information call the National Corn Growers Association at (636) 733-9004 or go to wwwncgacom
15
Click to edit Master title style
Click to edit Master title style
32
Biodiesel USA
Production
GalYear
2000 1989400
2001 6437200
2002 8814600
2003 18400000
2004 18900000
2005 100000000 Source CCC Data Estimate
31
16
0
200
400
600
800
2004 2005 2006 2007 2008
MGYEAR
BBI International
Click to edit Master title style
Click to edit Master title style
33
Soy Oil Price History
Source httpwwwpalmoilcomindexphpq=D1VTW1NASgIEAhEbVg9RAAsI Data from Chicago Board of Trade
34
Palm Oil Prices
17
Click to edit Master title style
Click to edit Master title style
US Soy Oil Consumption
bull Crop Year 2004 Approx Production 187 B lbs
bull 75 billion pounds of biodiesel derived from soy oil would represent approximately 40 of current total soy oil demand This would be 1 billion gallons or 2 of diesel demand
35
Cellulosic Ethanol from Energy Crops
bull Dedicated perennial energy crop production potential
bull On Conservation Reserve Program (CRP) Acreage
bull Using switchgrass hybrid poplar willow etc
36
18
Click to edit Master title style
37
Click to edit Master title style
38
Switchgrass Production Areas with data available
Walsh M et al Environmental and Resource Economics 24 313ndash333 2003
19
Click to edit Master title style
Click to edit Master title style
39Walsh M et al Environmental and Resource Economics 24 313ndash333 2003
Hybrid Poplar Production Areas with data available
40Walsh M et al Environmental and Resource Economics 24 313ndash333 2003
Willow Production Areas with data available
20
Click to edit Master title style
Click to edit Master title style
42
41
0 200 400 600 800 1000 1200 1400
Million dry tons per year
Forest resources
Agricultural resources
Total resource potential
Annual biomass resource potential
Data from ldquoBiomass as Feedstock for a Bioenergy and Bioproducts Industry The Technical Feasibility of a Billion-Ton Annual Supplyrdquo DOE and USDA April 2005
368
998
1366
21
Click to edit Master title style
Click to edit Master title style
43
Agricultural Biomass for Energy
377
446
87
87
0 200 400 600
Million dry tons per year
Grain-to-ethanol Process residues Crop residues Perennial crops
Data from ldquoBiomass as Feedstock for a Bioenergy and Bioproducts Industry The Technical Feasibility of a Billion-Ton Annual Supplyrdquo DOE and USDA April 2005
44
22
Click to edit Master title style
Click to edit Master title style
45
What conversion technologies are available
46
23
Click to edit Master title style
Click to edit Master title style
Biomass
Bio-Chemical Thermo-Chemical Platform Platform
Mixed Sugars Lignin amp Residues Conditioned Gas Oils Residues
Fuels Chemicals Materials Heat amp Power
ldquoThe Integrated Biorefineryrdquo Technology Validation and Systems
Don Richardson Office of the Biomass Program September 29 2004 Integration
47
Cellulosic Biorefinery Vision
An integratedbiorefinery makesuse of ndash Thermochemical
conversion technology
ndash Biochemical Don Richardson Office of the Biomass Program September 29 2004 conversion
technology 48
ndash Existing technology
24
Click to edit Master title style
Click to edit Master title style
49
50
25
Click to edit Master title style
51
Click to edit Master title style
52
26
Click to edit Master title style
53
Roadmap to this Future
27

Click to edit Master title style
15
Click to edit Master title style
16
8
Click to edit Master title style
Click to edit Master title style
17
18
9
Click to edit Master title style
19
Click to edit Master title style
20
10
Click to edit Master title style
Click to edit Master title style
What role can biomass play
21
22
Fuel Production Capacity Million Gallons per Year
2004 data
0
1000
2000
3000
4000
5000
Ethanol Biodiesel
Current Under Construction 0
20000
40000
60000
80000
100000
120000
140000
Gasoline Ethanol Biodiesel 2030 Goal
11
Click to edit Master title style
Click to edit Master title style
24
US Corn Yield
23
US Agricultural Economy and Biomass
bull Ethanol and biodiesel industry creates domestic jobs
bull Ethanol industry has grown to 81 plants in 20 states which support 147000 jobs in the UnitedStates mostly in rural communities
bull On average a 40 million gallon per year ethanol plant supports 41 full-time jobs andnearly 700 jobs throughout the entire economy
bull Cuts the trade deficit by $341 billion through 2012
(Data 82005 From httpwwweereenergygovbiomasseconomic_growthhtmltrade and ldquoHomegrown for the Homeland - Ethanol Industry Outlook for 2005rdquo)
AS OF December 2005
In operation Under construction Proposed
12
Click to edit Master title style
Click to edit Master title style
25
Corn Production and Use 1999-2006
0
2000
4000
6000
8000
10000
12000
1999-2000
2000-2001
2001-2002
2002-2003
2003-2004
2004-2005
2005-2006
2006-2007
Production Use
26
Corn Use ndash 1999-2015
500
2500
4500
6500
8500
10500
12500
14500
2000-2001
2003-2004
2004-2005
2005-2006
2009-2010
2013-2014
2014-2015
Use Ethanol Exports Livestock Ethanol2
13
Click to edit Master title style
Click to edit Master title style
28
27According to the EIA
The AEO2006 reference case includes only those sections of EPACT2005 (the recent Energy Bill) that establish specific tax credits incentives or standardsmdashabout 30 of the roughly 500 sections in the legislation
7317
8713
0
2000
4000
6000
8000
10000
12000
2000 2005 2010 2015 2020 2025 2030
EIA 2006USCorn Ethanol Production
PRX Ethanol Production Forecast
Energy ActRFS
Energy Information Admnistration (EIA) US DOE Annual Energy Outlook (AEO)
2006 Outlook
EIA ethanol production outlook trailing presentand scheduled dry mill expansion rate In
2010 PRX forecast is higher by 1400 mil galor about 500 mil bu corn
US CORN ETHANOL PRODUCTION with PRX ESTIMATE Million gallons
PRX
RFS
PRX_EIAlongtermPRXrev 04-Jan-06
14
Click to edit Master title style
Ethanol Use RequirementsLaw enacted Legislative Proposals (05-06)
29
E-10
TBD E-10
20 2012
57
E-10
E-10
2006
10 200810
2007 10 2010
10 200810
2010 10 2007
10 2010
5 2006
10 TBD
25 RF 2015
10 TBD
Comparative Results of Ethanol Energy Balance Studies 1995-2005
Shapouri et al
LorenzMorris Wang et al
Agri-Food Canada
Shapouri et al
KimDale
Graboski
Wang et al
Shapouri et al
Pimentel
PimentelPatzek
Pimentel
30000
20000
139
126
113
0
-113
-126Net E
nerg
y Valu
e (Bt
uga
llon)
Net E
nerg
y Valu
e Rat
io
10000
0
-10000
-20000
-139-30000
1995 1996 1997 1998 1999 2000 2001 2002 2003 2004 2005
Avg NEV minus Pimentel (3) Average NEV with Pimentel
24336 Btu (132 NEV ratio) 11739 Btu (115 NEV ratio)
Calculations assume low heat value energy content of ethanol is 76330 BTUgallon Sources Office of Energy Efficiency and Renewable Energy (US Department of Energy) Dale Bruce Michigan State University presentation at World Congress on Industrial Biotechnology amp Bioprocessing Orlando Florida April 22 2005
For more information call the National Corn Growers Association at (636) 733-9004 or go to wwwncgacom
15
Click to edit Master title style
Click to edit Master title style
32
Biodiesel USA
Production
GalYear
2000 1989400
2001 6437200
2002 8814600
2003 18400000
2004 18900000
2005 100000000 Source CCC Data Estimate
31
16
0
200
400
600
800
2004 2005 2006 2007 2008
MGYEAR
BBI International
Click to edit Master title style
Click to edit Master title style
33
Soy Oil Price History
Source httpwwwpalmoilcomindexphpq=D1VTW1NASgIEAhEbVg9RAAsI Data from Chicago Board of Trade
34
Palm Oil Prices
17
Click to edit Master title style
Click to edit Master title style
US Soy Oil Consumption
bull Crop Year 2004 Approx Production 187 B lbs
bull 75 billion pounds of biodiesel derived from soy oil would represent approximately 40 of current total soy oil demand This would be 1 billion gallons or 2 of diesel demand
35
Cellulosic Ethanol from Energy Crops
bull Dedicated perennial energy crop production potential
bull On Conservation Reserve Program (CRP) Acreage
bull Using switchgrass hybrid poplar willow etc
36
18
Click to edit Master title style
37
Click to edit Master title style
38
Switchgrass Production Areas with data available
Walsh M et al Environmental and Resource Economics 24 313ndash333 2003
19
Click to edit Master title style
Click to edit Master title style
39Walsh M et al Environmental and Resource Economics 24 313ndash333 2003
Hybrid Poplar Production Areas with data available
40Walsh M et al Environmental and Resource Economics 24 313ndash333 2003
Willow Production Areas with data available
20
Click to edit Master title style
Click to edit Master title style
42
41
0 200 400 600 800 1000 1200 1400
Million dry tons per year
Forest resources
Agricultural resources
Total resource potential
Annual biomass resource potential
Data from ldquoBiomass as Feedstock for a Bioenergy and Bioproducts Industry The Technical Feasibility of a Billion-Ton Annual Supplyrdquo DOE and USDA April 2005
368
998
1366
21
Click to edit Master title style
Click to edit Master title style
43
Agricultural Biomass for Energy
377
446
87
87
0 200 400 600
Million dry tons per year
Grain-to-ethanol Process residues Crop residues Perennial crops
Data from ldquoBiomass as Feedstock for a Bioenergy and Bioproducts Industry The Technical Feasibility of a Billion-Ton Annual Supplyrdquo DOE and USDA April 2005
44
22
Click to edit Master title style
Click to edit Master title style
45
What conversion technologies are available
46
23
Click to edit Master title style
Click to edit Master title style
Biomass
Bio-Chemical Thermo-Chemical Platform Platform
Mixed Sugars Lignin amp Residues Conditioned Gas Oils Residues
Fuels Chemicals Materials Heat amp Power
ldquoThe Integrated Biorefineryrdquo Technology Validation and Systems
Don Richardson Office of the Biomass Program September 29 2004 Integration
47
Cellulosic Biorefinery Vision
An integratedbiorefinery makesuse of ndash Thermochemical
conversion technology
ndash Biochemical Don Richardson Office of the Biomass Program September 29 2004 conversion
technology 48
ndash Existing technology
24
Click to edit Master title style
Click to edit Master title style
49
50
25
Click to edit Master title style
51
Click to edit Master title style
52
26
Click to edit Master title style
53
Roadmap to this Future
27
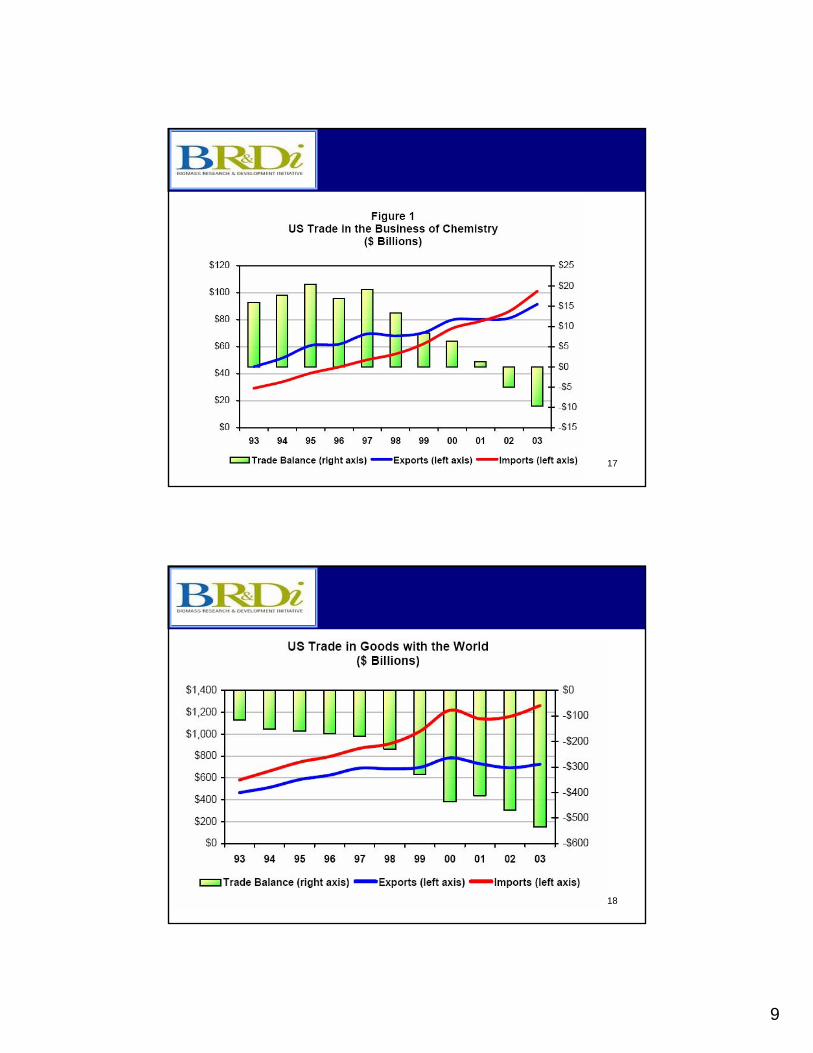
Click to edit Master title style
Click to edit Master title style
17
18
9
Click to edit Master title style
19
Click to edit Master title style
20
10
Click to edit Master title style
Click to edit Master title style
What role can biomass play
21
22
Fuel Production Capacity Million Gallons per Year
2004 data
0
1000
2000
3000
4000
5000
Ethanol Biodiesel
Current Under Construction 0
20000
40000
60000
80000
100000
120000
140000
Gasoline Ethanol Biodiesel 2030 Goal
11
Click to edit Master title style
Click to edit Master title style
24
US Corn Yield
23
US Agricultural Economy and Biomass
bull Ethanol and biodiesel industry creates domestic jobs
bull Ethanol industry has grown to 81 plants in 20 states which support 147000 jobs in the UnitedStates mostly in rural communities
bull On average a 40 million gallon per year ethanol plant supports 41 full-time jobs andnearly 700 jobs throughout the entire economy
bull Cuts the trade deficit by $341 billion through 2012
(Data 82005 From httpwwweereenergygovbiomasseconomic_growthhtmltrade and ldquoHomegrown for the Homeland - Ethanol Industry Outlook for 2005rdquo)
AS OF December 2005
In operation Under construction Proposed
12
Click to edit Master title style
Click to edit Master title style
25
Corn Production and Use 1999-2006
0
2000
4000
6000
8000
10000
12000
1999-2000
2000-2001
2001-2002
2002-2003
2003-2004
2004-2005
2005-2006
2006-2007
Production Use
26
Corn Use ndash 1999-2015
500
2500
4500
6500
8500
10500
12500
14500
2000-2001
2003-2004
2004-2005
2005-2006
2009-2010
2013-2014
2014-2015
Use Ethanol Exports Livestock Ethanol2
13
Click to edit Master title style
Click to edit Master title style
28
27According to the EIA
The AEO2006 reference case includes only those sections of EPACT2005 (the recent Energy Bill) that establish specific tax credits incentives or standardsmdashabout 30 of the roughly 500 sections in the legislation
7317
8713
0
2000
4000
6000
8000
10000
12000
2000 2005 2010 2015 2020 2025 2030
EIA 2006USCorn Ethanol Production
PRX Ethanol Production Forecast
Energy ActRFS
Energy Information Admnistration (EIA) US DOE Annual Energy Outlook (AEO)
2006 Outlook
EIA ethanol production outlook trailing presentand scheduled dry mill expansion rate In
2010 PRX forecast is higher by 1400 mil galor about 500 mil bu corn
US CORN ETHANOL PRODUCTION with PRX ESTIMATE Million gallons
PRX
RFS
PRX_EIAlongtermPRXrev 04-Jan-06
14
Click to edit Master title style
Ethanol Use RequirementsLaw enacted Legislative Proposals (05-06)
29
E-10
TBD E-10
20 2012
57
E-10
E-10
2006
10 200810
2007 10 2010
10 200810
2010 10 2007
10 2010
5 2006
10 TBD
25 RF 2015
10 TBD
Comparative Results of Ethanol Energy Balance Studies 1995-2005
Shapouri et al
LorenzMorris Wang et al
Agri-Food Canada
Shapouri et al
KimDale
Graboski
Wang et al
Shapouri et al
Pimentel
PimentelPatzek
Pimentel
30000
20000
139
126
113
0
-113
-126Net E
nerg
y Valu
e (Bt
uga
llon)
Net E
nerg
y Valu
e Rat
io
10000
0
-10000
-20000
-139-30000
1995 1996 1997 1998 1999 2000 2001 2002 2003 2004 2005
Avg NEV minus Pimentel (3) Average NEV with Pimentel
24336 Btu (132 NEV ratio) 11739 Btu (115 NEV ratio)
Calculations assume low heat value energy content of ethanol is 76330 BTUgallon Sources Office of Energy Efficiency and Renewable Energy (US Department of Energy) Dale Bruce Michigan State University presentation at World Congress on Industrial Biotechnology amp Bioprocessing Orlando Florida April 22 2005
For more information call the National Corn Growers Association at (636) 733-9004 or go to wwwncgacom
15
Click to edit Master title style
Click to edit Master title style
32
Biodiesel USA
Production
GalYear
2000 1989400
2001 6437200
2002 8814600
2003 18400000
2004 18900000
2005 100000000 Source CCC Data Estimate
31
16
0
200
400
600
800
2004 2005 2006 2007 2008
MGYEAR
BBI International
Click to edit Master title style
Click to edit Master title style
33
Soy Oil Price History
Source httpwwwpalmoilcomindexphpq=D1VTW1NASgIEAhEbVg9RAAsI Data from Chicago Board of Trade
34
Palm Oil Prices
17
Click to edit Master title style
Click to edit Master title style
US Soy Oil Consumption
bull Crop Year 2004 Approx Production 187 B lbs
bull 75 billion pounds of biodiesel derived from soy oil would represent approximately 40 of current total soy oil demand This would be 1 billion gallons or 2 of diesel demand
35
Cellulosic Ethanol from Energy Crops
bull Dedicated perennial energy crop production potential
bull On Conservation Reserve Program (CRP) Acreage
bull Using switchgrass hybrid poplar willow etc
36
18
Click to edit Master title style
37
Click to edit Master title style
38
Switchgrass Production Areas with data available
Walsh M et al Environmental and Resource Economics 24 313ndash333 2003
19
Click to edit Master title style
Click to edit Master title style
39Walsh M et al Environmental and Resource Economics 24 313ndash333 2003
Hybrid Poplar Production Areas with data available
40Walsh M et al Environmental and Resource Economics 24 313ndash333 2003
Willow Production Areas with data available
20
Click to edit Master title style
Click to edit Master title style
42
41
0 200 400 600 800 1000 1200 1400
Million dry tons per year
Forest resources
Agricultural resources
Total resource potential
Annual biomass resource potential
Data from ldquoBiomass as Feedstock for a Bioenergy and Bioproducts Industry The Technical Feasibility of a Billion-Ton Annual Supplyrdquo DOE and USDA April 2005
368
998
1366
21
Click to edit Master title style
Click to edit Master title style
43
Agricultural Biomass for Energy
377
446
87
87
0 200 400 600
Million dry tons per year
Grain-to-ethanol Process residues Crop residues Perennial crops
Data from ldquoBiomass as Feedstock for a Bioenergy and Bioproducts Industry The Technical Feasibility of a Billion-Ton Annual Supplyrdquo DOE and USDA April 2005
44
22
Click to edit Master title style
Click to edit Master title style
45
What conversion technologies are available
46
23
Click to edit Master title style
Click to edit Master title style
Biomass
Bio-Chemical Thermo-Chemical Platform Platform
Mixed Sugars Lignin amp Residues Conditioned Gas Oils Residues
Fuels Chemicals Materials Heat amp Power
ldquoThe Integrated Biorefineryrdquo Technology Validation and Systems
Don Richardson Office of the Biomass Program September 29 2004 Integration
47
Cellulosic Biorefinery Vision
An integratedbiorefinery makesuse of ndash Thermochemical
conversion technology
ndash Biochemical Don Richardson Office of the Biomass Program September 29 2004 conversion
technology 48
ndash Existing technology
24
Click to edit Master title style
Click to edit Master title style
49
50
25
Click to edit Master title style
51
Click to edit Master title style
52
26
Click to edit Master title style
53
Roadmap to this Future
27

Click to edit Master title style
19
Click to edit Master title style
20
10
Click to edit Master title style
Click to edit Master title style
What role can biomass play
21
22
Fuel Production Capacity Million Gallons per Year
2004 data
0
1000
2000
3000
4000
5000
Ethanol Biodiesel
Current Under Construction 0
20000
40000
60000
80000
100000
120000
140000
Gasoline Ethanol Biodiesel 2030 Goal
11
Click to edit Master title style
Click to edit Master title style
24
US Corn Yield
23
US Agricultural Economy and Biomass
bull Ethanol and biodiesel industry creates domestic jobs
bull Ethanol industry has grown to 81 plants in 20 states which support 147000 jobs in the UnitedStates mostly in rural communities
bull On average a 40 million gallon per year ethanol plant supports 41 full-time jobs andnearly 700 jobs throughout the entire economy
bull Cuts the trade deficit by $341 billion through 2012
(Data 82005 From httpwwweereenergygovbiomasseconomic_growthhtmltrade and ldquoHomegrown for the Homeland - Ethanol Industry Outlook for 2005rdquo)
AS OF December 2005
In operation Under construction Proposed
12
Click to edit Master title style
Click to edit Master title style
25
Corn Production and Use 1999-2006
0
2000
4000
6000
8000
10000
12000
1999-2000
2000-2001
2001-2002
2002-2003
2003-2004
2004-2005
2005-2006
2006-2007
Production Use
26
Corn Use ndash 1999-2015
500
2500
4500
6500
8500
10500
12500
14500
2000-2001
2003-2004
2004-2005
2005-2006
2009-2010
2013-2014
2014-2015
Use Ethanol Exports Livestock Ethanol2
13
Click to edit Master title style
Click to edit Master title style
28
27According to the EIA
The AEO2006 reference case includes only those sections of EPACT2005 (the recent Energy Bill) that establish specific tax credits incentives or standardsmdashabout 30 of the roughly 500 sections in the legislation
7317
8713
0
2000
4000
6000
8000
10000
12000
2000 2005 2010 2015 2020 2025 2030
EIA 2006USCorn Ethanol Production
PRX Ethanol Production Forecast
Energy ActRFS
Energy Information Admnistration (EIA) US DOE Annual Energy Outlook (AEO)
2006 Outlook
EIA ethanol production outlook trailing presentand scheduled dry mill expansion rate In
2010 PRX forecast is higher by 1400 mil galor about 500 mil bu corn
US CORN ETHANOL PRODUCTION with PRX ESTIMATE Million gallons
PRX
RFS
PRX_EIAlongtermPRXrev 04-Jan-06
14
Click to edit Master title style
Ethanol Use RequirementsLaw enacted Legislative Proposals (05-06)
29
E-10
TBD E-10
20 2012
57
E-10
E-10
2006
10 200810
2007 10 2010
10 200810
2010 10 2007
10 2010
5 2006
10 TBD
25 RF 2015
10 TBD
Comparative Results of Ethanol Energy Balance Studies 1995-2005
Shapouri et al
LorenzMorris Wang et al
Agri-Food Canada
Shapouri et al
KimDale
Graboski
Wang et al
Shapouri et al
Pimentel
PimentelPatzek
Pimentel
30000
20000
139
126
113
0
-113
-126Net E
nerg
y Valu
e (Bt
uga
llon)
Net E
nerg
y Valu
e Rat
io
10000
0
-10000
-20000
-139-30000
1995 1996 1997 1998 1999 2000 2001 2002 2003 2004 2005
Avg NEV minus Pimentel (3) Average NEV with Pimentel
24336 Btu (132 NEV ratio) 11739 Btu (115 NEV ratio)
Calculations assume low heat value energy content of ethanol is 76330 BTUgallon Sources Office of Energy Efficiency and Renewable Energy (US Department of Energy) Dale Bruce Michigan State University presentation at World Congress on Industrial Biotechnology amp Bioprocessing Orlando Florida April 22 2005
For more information call the National Corn Growers Association at (636) 733-9004 or go to wwwncgacom
15
Click to edit Master title style
Click to edit Master title style
32
Biodiesel USA
Production
GalYear
2000 1989400
2001 6437200
2002 8814600
2003 18400000
2004 18900000
2005 100000000 Source CCC Data Estimate
31
16
0
200
400
600
800
2004 2005 2006 2007 2008
MGYEAR
BBI International
Click to edit Master title style
Click to edit Master title style
33
Soy Oil Price History
Source httpwwwpalmoilcomindexphpq=D1VTW1NASgIEAhEbVg9RAAsI Data from Chicago Board of Trade
34
Palm Oil Prices
17
Click to edit Master title style
Click to edit Master title style
US Soy Oil Consumption
bull Crop Year 2004 Approx Production 187 B lbs
bull 75 billion pounds of biodiesel derived from soy oil would represent approximately 40 of current total soy oil demand This would be 1 billion gallons or 2 of diesel demand
35
Cellulosic Ethanol from Energy Crops
bull Dedicated perennial energy crop production potential
bull On Conservation Reserve Program (CRP) Acreage
bull Using switchgrass hybrid poplar willow etc
36
18
Click to edit Master title style
37
Click to edit Master title style
38
Switchgrass Production Areas with data available
Walsh M et al Environmental and Resource Economics 24 313ndash333 2003
19
Click to edit Master title style
Click to edit Master title style
39Walsh M et al Environmental and Resource Economics 24 313ndash333 2003
Hybrid Poplar Production Areas with data available
40Walsh M et al Environmental and Resource Economics 24 313ndash333 2003
Willow Production Areas with data available
20
Click to edit Master title style
Click to edit Master title style
42
41
0 200 400 600 800 1000 1200 1400
Million dry tons per year
Forest resources
Agricultural resources
Total resource potential
Annual biomass resource potential
Data from ldquoBiomass as Feedstock for a Bioenergy and Bioproducts Industry The Technical Feasibility of a Billion-Ton Annual Supplyrdquo DOE and USDA April 2005
368
998
1366
21
Click to edit Master title style
Click to edit Master title style
43
Agricultural Biomass for Energy
377
446
87
87
0 200 400 600
Million dry tons per year
Grain-to-ethanol Process residues Crop residues Perennial crops
Data from ldquoBiomass as Feedstock for a Bioenergy and Bioproducts Industry The Technical Feasibility of a Billion-Ton Annual Supplyrdquo DOE and USDA April 2005
44
22
Click to edit Master title style
Click to edit Master title style
45
What conversion technologies are available
46
23
Click to edit Master title style
Click to edit Master title style
Biomass
Bio-Chemical Thermo-Chemical Platform Platform
Mixed Sugars Lignin amp Residues Conditioned Gas Oils Residues
Fuels Chemicals Materials Heat amp Power
ldquoThe Integrated Biorefineryrdquo Technology Validation and Systems
Don Richardson Office of the Biomass Program September 29 2004 Integration
47
Cellulosic Biorefinery Vision
An integratedbiorefinery makesuse of ndash Thermochemical
conversion technology
ndash Biochemical Don Richardson Office of the Biomass Program September 29 2004 conversion
technology 48
ndash Existing technology
24
Click to edit Master title style
Click to edit Master title style
49
50
25
Click to edit Master title style
51
Click to edit Master title style
52
26
Click to edit Master title style
53
Roadmap to this Future
27

Click to edit Master title style
Click to edit Master title style
24
US Corn Yield
23
US Agricultural Economy and Biomass
bull Ethanol and biodiesel industry creates domestic jobs
bull Ethanol industry has grown to 81 plants in 20 states which support 147000 jobs in the UnitedStates mostly in rural communities
bull On average a 40 million gallon per year ethanol plant supports 41 full-time jobs andnearly 700 jobs throughout the entire economy
bull Cuts the trade deficit by $341 billion through 2012
(Data 82005 From httpwwweereenergygovbiomasseconomic_growthhtmltrade and ldquoHomegrown for the Homeland - Ethanol Industry Outlook for 2005rdquo)
AS OF December 2005
In operation Under construction Proposed
12
Click to edit Master title style
Click to edit Master title style
25
Corn Production and Use 1999-2006
0
2000
4000
6000
8000
10000
12000
1999-2000
2000-2001
2001-2002
2002-2003
2003-2004
2004-2005
2005-2006
2006-2007
Production Use
26
Corn Use ndash 1999-2015
500
2500
4500
6500
8500
10500
12500
14500
2000-2001
2003-2004
2004-2005
2005-2006
2009-2010
2013-2014
2014-2015
Use Ethanol Exports Livestock Ethanol2
13
Click to edit Master title style
Click to edit Master title style
28
27According to the EIA
The AEO2006 reference case includes only those sections of EPACT2005 (the recent Energy Bill) that establish specific tax credits incentives or standardsmdashabout 30 of the roughly 500 sections in the legislation
7317
8713
0
2000
4000
6000
8000
10000
12000
2000 2005 2010 2015 2020 2025 2030
EIA 2006USCorn Ethanol Production
PRX Ethanol Production Forecast
Energy ActRFS
Energy Information Admnistration (EIA) US DOE Annual Energy Outlook (AEO)
2006 Outlook
EIA ethanol production outlook trailing presentand scheduled dry mill expansion rate In
2010 PRX forecast is higher by 1400 mil galor about 500 mil bu corn
US CORN ETHANOL PRODUCTION with PRX ESTIMATE Million gallons
PRX
RFS
PRX_EIAlongtermPRXrev 04-Jan-06
14
Click to edit Master title style
Ethanol Use RequirementsLaw enacted Legislative Proposals (05-06)
29
E-10
TBD E-10
20 2012
57
E-10
E-10
2006
10 200810
2007 10 2010
10 200810
2010 10 2007
10 2010
5 2006
10 TBD
25 RF 2015
10 TBD
Comparative Results of Ethanol Energy Balance Studies 1995-2005
Shapouri et al
LorenzMorris Wang et al
Agri-Food Canada
Shapouri et al
KimDale
Graboski
Wang et al
Shapouri et al
Pimentel
PimentelPatzek
Pimentel
30000
20000
139
126
113
0
-113
-126Net E
nerg
y Valu
e (Bt
uga
llon)
Net E
nerg
y Valu
e Rat
io
10000
0
-10000
-20000
-139-30000
1995 1996 1997 1998 1999 2000 2001 2002 2003 2004 2005
Avg NEV minus Pimentel (3) Average NEV with Pimentel
24336 Btu (132 NEV ratio) 11739 Btu (115 NEV ratio)
Calculations assume low heat value energy content of ethanol is 76330 BTUgallon Sources Office of Energy Efficiency and Renewable Energy (US Department of Energy) Dale Bruce Michigan State University presentation at World Congress on Industrial Biotechnology amp Bioprocessing Orlando Florida April 22 2005
For more information call the National Corn Growers Association at (636) 733-9004 or go to wwwncgacom
15
Click to edit Master title style
Click to edit Master title style
32
Biodiesel USA
Production
GalYear
2000 1989400
2001 6437200
2002 8814600
2003 18400000
2004 18900000
2005 100000000 Source CCC Data Estimate
31
16
0
200
400
600
800
2004 2005 2006 2007 2008
MGYEAR
BBI International
Click to edit Master title style
Click to edit Master title style
33
Soy Oil Price History
Source httpwwwpalmoilcomindexphpq=D1VTW1NASgIEAhEbVg9RAAsI Data from Chicago Board of Trade
34
Palm Oil Prices
17
Click to edit Master title style
Click to edit Master title style
US Soy Oil Consumption
bull Crop Year 2004 Approx Production 187 B lbs
bull 75 billion pounds of biodiesel derived from soy oil would represent approximately 40 of current total soy oil demand This would be 1 billion gallons or 2 of diesel demand
35
Cellulosic Ethanol from Energy Crops
bull Dedicated perennial energy crop production potential
bull On Conservation Reserve Program (CRP) Acreage
bull Using switchgrass hybrid poplar willow etc
36
18
Click to edit Master title style
37
Click to edit Master title style
38
Switchgrass Production Areas with data available
Walsh M et al Environmental and Resource Economics 24 313ndash333 2003
19
Click to edit Master title style
Click to edit Master title style
39Walsh M et al Environmental and Resource Economics 24 313ndash333 2003
Hybrid Poplar Production Areas with data available
40Walsh M et al Environmental and Resource Economics 24 313ndash333 2003
Willow Production Areas with data available
20
Click to edit Master title style
Click to edit Master title style
42
41
0 200 400 600 800 1000 1200 1400
Million dry tons per year
Forest resources
Agricultural resources
Total resource potential
Annual biomass resource potential
Data from ldquoBiomass as Feedstock for a Bioenergy and Bioproducts Industry The Technical Feasibility of a Billion-Ton Annual Supplyrdquo DOE and USDA April 2005
368
998
1366
21
Click to edit Master title style
Click to edit Master title style
43
Agricultural Biomass for Energy
377
446
87
87
0 200 400 600
Million dry tons per year
Grain-to-ethanol Process residues Crop residues Perennial crops
Data from ldquoBiomass as Feedstock for a Bioenergy and Bioproducts Industry The Technical Feasibility of a Billion-Ton Annual Supplyrdquo DOE and USDA April 2005
44
22
Click to edit Master title style
Click to edit Master title style
45
What conversion technologies are available
46
23
Click to edit Master title style
Click to edit Master title style
Biomass
Bio-Chemical Thermo-Chemical Platform Platform
Mixed Sugars Lignin amp Residues Conditioned Gas Oils Residues
Fuels Chemicals Materials Heat amp Power
ldquoThe Integrated Biorefineryrdquo Technology Validation and Systems
Don Richardson Office of the Biomass Program September 29 2004 Integration
47
Cellulosic Biorefinery Vision
An integratedbiorefinery makesuse of ndash Thermochemical
conversion technology
ndash Biochemical Don Richardson Office of the Biomass Program September 29 2004 conversion
technology 48
ndash Existing technology
24
Click to edit Master title style
Click to edit Master title style
49
50
25
Click to edit Master title style
51
Click to edit Master title style
52
26
Click to edit Master title style
53
Roadmap to this Future
27
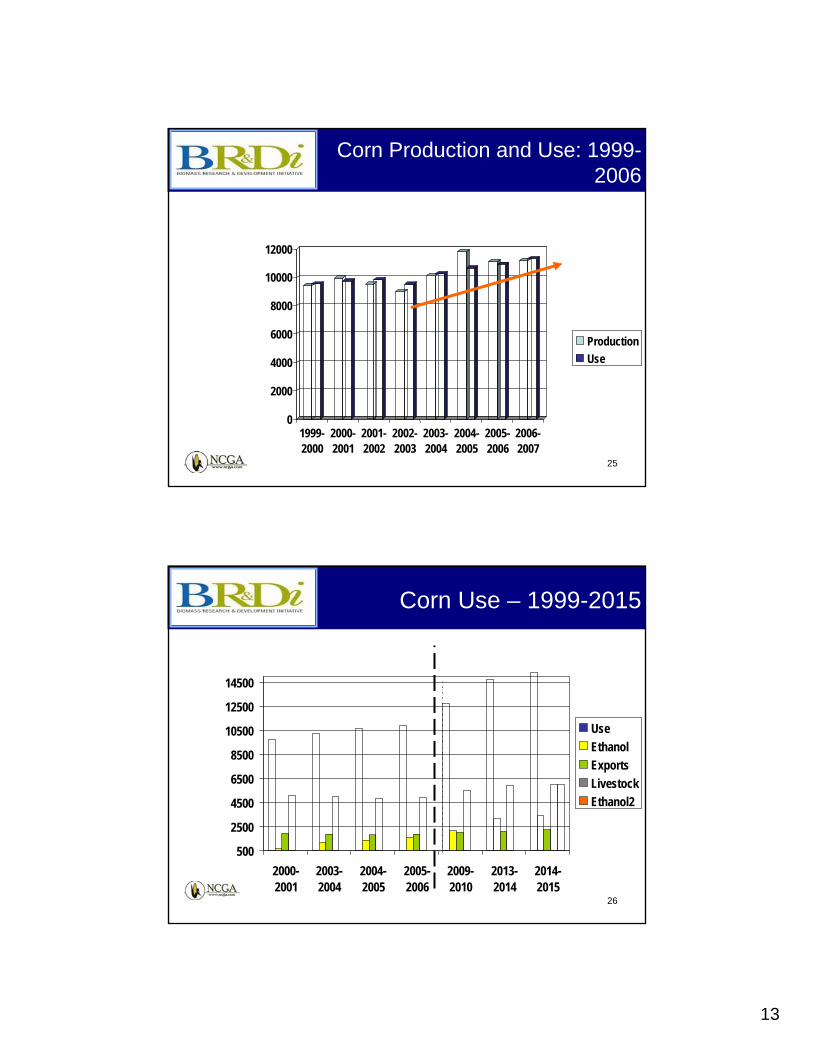
Click to edit Master title style
Click to edit Master title style
25
Corn Production and Use 1999-2006
0
2000
4000
6000
8000
10000
12000
1999-2000
2000-2001
2001-2002
2002-2003
2003-2004
2004-2005
2005-2006
2006-2007
Production Use
26
Corn Use ndash 1999-2015
500
2500
4500
6500
8500
10500
12500
14500
2000-2001
2003-2004
2004-2005
2005-2006
2009-2010
2013-2014
2014-2015
Use Ethanol Exports Livestock Ethanol2
13
Click to edit Master title style
Click to edit Master title style
28
27According to the EIA
The AEO2006 reference case includes only those sections of EPACT2005 (the recent Energy Bill) that establish specific tax credits incentives or standardsmdashabout 30 of the roughly 500 sections in the legislation
7317
8713
0
2000
4000
6000
8000
10000
12000
2000 2005 2010 2015 2020 2025 2030
EIA 2006USCorn Ethanol Production
PRX Ethanol Production Forecast
Energy ActRFS
Energy Information Admnistration (EIA) US DOE Annual Energy Outlook (AEO)
2006 Outlook
EIA ethanol production outlook trailing presentand scheduled dry mill expansion rate In
2010 PRX forecast is higher by 1400 mil galor about 500 mil bu corn
US CORN ETHANOL PRODUCTION with PRX ESTIMATE Million gallons
PRX
RFS
PRX_EIAlongtermPRXrev 04-Jan-06
14
Click to edit Master title style
Ethanol Use RequirementsLaw enacted Legislative Proposals (05-06)
29
E-10
TBD E-10
20 2012
57
E-10
E-10
2006
10 200810
2007 10 2010
10 200810
2010 10 2007
10 2010
5 2006
10 TBD
25 RF 2015
10 TBD
Comparative Results of Ethanol Energy Balance Studies 1995-2005
Shapouri et al
LorenzMorris Wang et al
Agri-Food Canada
Shapouri et al
KimDale
Graboski
Wang et al
Shapouri et al
Pimentel
PimentelPatzek
Pimentel
30000
20000
139
126
113
0
-113
-126Net E
nerg
y Valu
e (Bt
uga
llon)
Net E
nerg
y Valu
e Rat
io
10000
0
-10000
-20000
-139-30000
1995 1996 1997 1998 1999 2000 2001 2002 2003 2004 2005
Avg NEV minus Pimentel (3) Average NEV with Pimentel
24336 Btu (132 NEV ratio) 11739 Btu (115 NEV ratio)
Calculations assume low heat value energy content of ethanol is 76330 BTUgallon Sources Office of Energy Efficiency and Renewable Energy (US Department of Energy) Dale Bruce Michigan State University presentation at World Congress on Industrial Biotechnology amp Bioprocessing Orlando Florida April 22 2005
For more information call the National Corn Growers Association at (636) 733-9004 or go to wwwncgacom
15
Click to edit Master title style
Click to edit Master title style
32
Biodiesel USA
Production
GalYear
2000 1989400
2001 6437200
2002 8814600
2003 18400000
2004 18900000
2005 100000000 Source CCC Data Estimate
31
16
0
200
400
600
800
2004 2005 2006 2007 2008
MGYEAR
BBI International
Click to edit Master title style
Click to edit Master title style
33
Soy Oil Price History
Source httpwwwpalmoilcomindexphpq=D1VTW1NASgIEAhEbVg9RAAsI Data from Chicago Board of Trade
34
Palm Oil Prices
17
Click to edit Master title style
Click to edit Master title style
US Soy Oil Consumption
bull Crop Year 2004 Approx Production 187 B lbs
bull 75 billion pounds of biodiesel derived from soy oil would represent approximately 40 of current total soy oil demand This would be 1 billion gallons or 2 of diesel demand
35
Cellulosic Ethanol from Energy Crops
bull Dedicated perennial energy crop production potential
bull On Conservation Reserve Program (CRP) Acreage
bull Using switchgrass hybrid poplar willow etc
36
18
Click to edit Master title style
37
Click to edit Master title style
38
Switchgrass Production Areas with data available
Walsh M et al Environmental and Resource Economics 24 313ndash333 2003
19
Click to edit Master title style
Click to edit Master title style
39Walsh M et al Environmental and Resource Economics 24 313ndash333 2003
Hybrid Poplar Production Areas with data available
40Walsh M et al Environmental and Resource Economics 24 313ndash333 2003
Willow Production Areas with data available
20
Click to edit Master title style
Click to edit Master title style
42
41
0 200 400 600 800 1000 1200 1400
Million dry tons per year
Forest resources
Agricultural resources
Total resource potential
Annual biomass resource potential
Data from ldquoBiomass as Feedstock for a Bioenergy and Bioproducts Industry The Technical Feasibility of a Billion-Ton Annual Supplyrdquo DOE and USDA April 2005
368
998
1366
21
Click to edit Master title style
Click to edit Master title style
43
Agricultural Biomass for Energy
377
446
87
87
0 200 400 600
Million dry tons per year
Grain-to-ethanol Process residues Crop residues Perennial crops
Data from ldquoBiomass as Feedstock for a Bioenergy and Bioproducts Industry The Technical Feasibility of a Billion-Ton Annual Supplyrdquo DOE and USDA April 2005
44
22
Click to edit Master title style
Click to edit Master title style
45
What conversion technologies are available
46
23
Click to edit Master title style
Click to edit Master title style
Biomass
Bio-Chemical Thermo-Chemical Platform Platform
Mixed Sugars Lignin amp Residues Conditioned Gas Oils Residues
Fuels Chemicals Materials Heat amp Power
ldquoThe Integrated Biorefineryrdquo Technology Validation and Systems
Don Richardson Office of the Biomass Program September 29 2004 Integration
47
Cellulosic Biorefinery Vision
An integratedbiorefinery makesuse of ndash Thermochemical
conversion technology
ndash Biochemical Don Richardson Office of the Biomass Program September 29 2004 conversion
technology 48
ndash Existing technology
24
Click to edit Master title style
Click to edit Master title style
49
50
25
Click to edit Master title style
51
Click to edit Master title style
52
26
Click to edit Master title style
53
Roadmap to this Future
27

Click to edit Master title style
Click to edit Master title style
28
27According to the EIA
The AEO2006 reference case includes only those sections of EPACT2005 (the recent Energy Bill) that establish specific tax credits incentives or standardsmdashabout 30 of the roughly 500 sections in the legislation
7317
8713
0
2000
4000
6000
8000
10000
12000
2000 2005 2010 2015 2020 2025 2030
EIA 2006USCorn Ethanol Production
PRX Ethanol Production Forecast
Energy ActRFS
Energy Information Admnistration (EIA) US DOE Annual Energy Outlook (AEO)
2006 Outlook
EIA ethanol production outlook trailing presentand scheduled dry mill expansion rate In
2010 PRX forecast is higher by 1400 mil galor about 500 mil bu corn
US CORN ETHANOL PRODUCTION with PRX ESTIMATE Million gallons
PRX
RFS
PRX_EIAlongtermPRXrev 04-Jan-06
14
Click to edit Master title style
Ethanol Use RequirementsLaw enacted Legislative Proposals (05-06)
29
E-10
TBD E-10
20 2012
57
E-10
E-10
2006
10 200810
2007 10 2010
10 200810
2010 10 2007
10 2010
5 2006
10 TBD
25 RF 2015
10 TBD
Comparative Results of Ethanol Energy Balance Studies 1995-2005
Shapouri et al
LorenzMorris Wang et al
Agri-Food Canada
Shapouri et al
KimDale
Graboski
Wang et al
Shapouri et al
Pimentel
PimentelPatzek
Pimentel
30000
20000
139
126
113
0
-113
-126Net E
nerg
y Valu
e (Bt
uga
llon)
Net E
nerg
y Valu
e Rat
io
10000
0
-10000
-20000
-139-30000
1995 1996 1997 1998 1999 2000 2001 2002 2003 2004 2005
Avg NEV minus Pimentel (3) Average NEV with Pimentel
24336 Btu (132 NEV ratio) 11739 Btu (115 NEV ratio)
Calculations assume low heat value energy content of ethanol is 76330 BTUgallon Sources Office of Energy Efficiency and Renewable Energy (US Department of Energy) Dale Bruce Michigan State University presentation at World Congress on Industrial Biotechnology amp Bioprocessing Orlando Florida April 22 2005
For more information call the National Corn Growers Association at (636) 733-9004 or go to wwwncgacom
15
Click to edit Master title style
Click to edit Master title style
32
Biodiesel USA
Production
GalYear
2000 1989400
2001 6437200
2002 8814600
2003 18400000
2004 18900000
2005 100000000 Source CCC Data Estimate
31
16
0
200
400
600
800
2004 2005 2006 2007 2008
MGYEAR
BBI International
Click to edit Master title style
Click to edit Master title style
33
Soy Oil Price History
Source httpwwwpalmoilcomindexphpq=D1VTW1NASgIEAhEbVg9RAAsI Data from Chicago Board of Trade
34
Palm Oil Prices
17
Click to edit Master title style
Click to edit Master title style
US Soy Oil Consumption
bull Crop Year 2004 Approx Production 187 B lbs
bull 75 billion pounds of biodiesel derived from soy oil would represent approximately 40 of current total soy oil demand This would be 1 billion gallons or 2 of diesel demand
35
Cellulosic Ethanol from Energy Crops
bull Dedicated perennial energy crop production potential
bull On Conservation Reserve Program (CRP) Acreage
bull Using switchgrass hybrid poplar willow etc
36
18
Click to edit Master title style
37
Click to edit Master title style
38
Switchgrass Production Areas with data available
Walsh M et al Environmental and Resource Economics 24 313ndash333 2003
19
Click to edit Master title style
Click to edit Master title style
39Walsh M et al Environmental and Resource Economics 24 313ndash333 2003
Hybrid Poplar Production Areas with data available
40Walsh M et al Environmental and Resource Economics 24 313ndash333 2003
Willow Production Areas with data available
20
Click to edit Master title style
Click to edit Master title style
42
41
0 200 400 600 800 1000 1200 1400
Million dry tons per year
Forest resources
Agricultural resources
Total resource potential
Annual biomass resource potential
Data from ldquoBiomass as Feedstock for a Bioenergy and Bioproducts Industry The Technical Feasibility of a Billion-Ton Annual Supplyrdquo DOE and USDA April 2005
368
998
1366
21
Click to edit Master title style
Click to edit Master title style
43
Agricultural Biomass for Energy
377
446
87
87
0 200 400 600
Million dry tons per year
Grain-to-ethanol Process residues Crop residues Perennial crops
Data from ldquoBiomass as Feedstock for a Bioenergy and Bioproducts Industry The Technical Feasibility of a Billion-Ton Annual Supplyrdquo DOE and USDA April 2005
44
22
Click to edit Master title style
Click to edit Master title style
45
What conversion technologies are available
46
23
Click to edit Master title style
Click to edit Master title style
Biomass
Bio-Chemical Thermo-Chemical Platform Platform
Mixed Sugars Lignin amp Residues Conditioned Gas Oils Residues
Fuels Chemicals Materials Heat amp Power
ldquoThe Integrated Biorefineryrdquo Technology Validation and Systems
Don Richardson Office of the Biomass Program September 29 2004 Integration
47
Cellulosic Biorefinery Vision
An integratedbiorefinery makesuse of ndash Thermochemical
conversion technology
ndash Biochemical Don Richardson Office of the Biomass Program September 29 2004 conversion
technology 48
ndash Existing technology
24
Click to edit Master title style
Click to edit Master title style
49
50
25
Click to edit Master title style
51
Click to edit Master title style
52
26
Click to edit Master title style
53
Roadmap to this Future
27
Click to edit Master title style
Ethanol Use RequirementsLaw enacted Legislative Proposals (05-06)
29
E-10
TBD E-10
20 2012
57
E-10
E-10
2006
10 200810
2007 10 2010
10 200810
2010 10 2007
10 2010
5 2006
10 TBD
25 RF 2015
10 TBD
Comparative Results of Ethanol Energy Balance Studies 1995-2005
Shapouri et al
LorenzMorris Wang et al
Agri-Food Canada
Shapouri et al
KimDale
Graboski
Wang et al
Shapouri et al
Pimentel
PimentelPatzek
Pimentel
30000
20000
139
126
113
0
-113
-126Net E
nerg
y Valu
e (Bt
uga
llon)
Net E
nerg
y Valu
e Rat
io
10000
0
-10000
-20000
-139-30000
1995 1996 1997 1998 1999 2000 2001 2002 2003 2004 2005
Avg NEV minus Pimentel (3) Average NEV with Pimentel
24336 Btu (132 NEV ratio) 11739 Btu (115 NEV ratio)
Calculations assume low heat value energy content of ethanol is 76330 BTUgallon Sources Office of Energy Efficiency and Renewable Energy (US Department of Energy) Dale Bruce Michigan State University presentation at World Congress on Industrial Biotechnology amp Bioprocessing Orlando Florida April 22 2005
For more information call the National Corn Growers Association at (636) 733-9004 or go to wwwncgacom
15
Click to edit Master title style
Click to edit Master title style
32
Biodiesel USA
Production
GalYear
2000 1989400
2001 6437200
2002 8814600
2003 18400000
2004 18900000
2005 100000000 Source CCC Data Estimate
31
16
0
200
400
600
800
2004 2005 2006 2007 2008
MGYEAR
BBI International
Click to edit Master title style
Click to edit Master title style
33
Soy Oil Price History
Source httpwwwpalmoilcomindexphpq=D1VTW1NASgIEAhEbVg9RAAsI Data from Chicago Board of Trade
34
Palm Oil Prices
17
Click to edit Master title style
Click to edit Master title style
US Soy Oil Consumption
bull Crop Year 2004 Approx Production 187 B lbs
bull 75 billion pounds of biodiesel derived from soy oil would represent approximately 40 of current total soy oil demand This would be 1 billion gallons or 2 of diesel demand
35
Cellulosic Ethanol from Energy Crops
bull Dedicated perennial energy crop production potential
bull On Conservation Reserve Program (CRP) Acreage
bull Using switchgrass hybrid poplar willow etc
36
18
Click to edit Master title style
37
Click to edit Master title style
38
Switchgrass Production Areas with data available
Walsh M et al Environmental and Resource Economics 24 313ndash333 2003
19
Click to edit Master title style
Click to edit Master title style
39Walsh M et al Environmental and Resource Economics 24 313ndash333 2003
Hybrid Poplar Production Areas with data available
40Walsh M et al Environmental and Resource Economics 24 313ndash333 2003
Willow Production Areas with data available
20
Click to edit Master title style
Click to edit Master title style
42
41
0 200 400 600 800 1000 1200 1400
Million dry tons per year
Forest resources
Agricultural resources
Total resource potential
Annual biomass resource potential
Data from ldquoBiomass as Feedstock for a Bioenergy and Bioproducts Industry The Technical Feasibility of a Billion-Ton Annual Supplyrdquo DOE and USDA April 2005
368
998
1366
21
Click to edit Master title style
Click to edit Master title style
43
Agricultural Biomass for Energy
377
446
87
87
0 200 400 600
Million dry tons per year
Grain-to-ethanol Process residues Crop residues Perennial crops
Data from ldquoBiomass as Feedstock for a Bioenergy and Bioproducts Industry The Technical Feasibility of a Billion-Ton Annual Supplyrdquo DOE and USDA April 2005
44
22
Click to edit Master title style
Click to edit Master title style
45
What conversion technologies are available
46
23
Click to edit Master title style
Click to edit Master title style
Biomass
Bio-Chemical Thermo-Chemical Platform Platform
Mixed Sugars Lignin amp Residues Conditioned Gas Oils Residues
Fuels Chemicals Materials Heat amp Power
ldquoThe Integrated Biorefineryrdquo Technology Validation and Systems
Don Richardson Office of the Biomass Program September 29 2004 Integration
47
Cellulosic Biorefinery Vision
An integratedbiorefinery makesuse of ndash Thermochemical
conversion technology
ndash Biochemical Don Richardson Office of the Biomass Program September 29 2004 conversion
technology 48
ndash Existing technology
24
Click to edit Master title style
Click to edit Master title style
49
50
25
Click to edit Master title style
51
Click to edit Master title style
52
26
Click to edit Master title style
53
Roadmap to this Future
27

Click to edit Master title style
Click to edit Master title style
US Soy Oil Consumption
bull Crop Year 2004 Approx Production 187 B lbs
bull 75 billion pounds of biodiesel derived from soy oil would represent approximately 40 of current total soy oil demand This would be 1 billion gallons or 2 of diesel demand
35
Cellulosic Ethanol from Energy Crops
bull Dedicated perennial energy crop production potential
bull On Conservation Reserve Program (CRP) Acreage
bull Using switchgrass hybrid poplar willow etc
36
18
Click to edit Master title style
37
Click to edit Master title style
38
Switchgrass Production Areas with data available
Walsh M et al Environmental and Resource Economics 24 313ndash333 2003
19
Click to edit Master title style
Click to edit Master title style
39Walsh M et al Environmental and Resource Economics 24 313ndash333 2003
Hybrid Poplar Production Areas with data available
40Walsh M et al Environmental and Resource Economics 24 313ndash333 2003
Willow Production Areas with data available
20
Click to edit Master title style
Click to edit Master title style
42
41
0 200 400 600 800 1000 1200 1400
Million dry tons per year
Forest resources
Agricultural resources
Total resource potential
Annual biomass resource potential
Data from ldquoBiomass as Feedstock for a Bioenergy and Bioproducts Industry The Technical Feasibility of a Billion-Ton Annual Supplyrdquo DOE and USDA April 2005
368
998
1366
21
Click to edit Master title style
Click to edit Master title style
43
Agricultural Biomass for Energy
377
446
87
87
0 200 400 600
Million dry tons per year
Grain-to-ethanol Process residues Crop residues Perennial crops
Data from ldquoBiomass as Feedstock for a Bioenergy and Bioproducts Industry The Technical Feasibility of a Billion-Ton Annual Supplyrdquo DOE and USDA April 2005
44
22
Click to edit Master title style
Click to edit Master title style
45
What conversion technologies are available
46
23
Click to edit Master title style
Click to edit Master title style
Biomass
Bio-Chemical Thermo-Chemical Platform Platform
Mixed Sugars Lignin amp Residues Conditioned Gas Oils Residues
Fuels Chemicals Materials Heat amp Power
ldquoThe Integrated Biorefineryrdquo Technology Validation and Systems
Don Richardson Office of the Biomass Program September 29 2004 Integration
47
Cellulosic Biorefinery Vision
An integratedbiorefinery makesuse of ndash Thermochemical
conversion technology
ndash Biochemical Don Richardson Office of the Biomass Program September 29 2004 conversion
technology 48
ndash Existing technology
24
Click to edit Master title style
Click to edit Master title style
49
50
25
Click to edit Master title style
51
Click to edit Master title style
52
26
Click to edit Master title style
53
Roadmap to this Future
27

Click to edit Master title style
Click to edit Master title style
49
50
25
Click to edit Master title style
51
Click to edit Master title style
52
26
Click to edit Master title style
53
Roadmap to this Future
27

Click to edit Master title style
51
Click to edit Master title style
52
26
Click to edit Master title style
53
Roadmap to this Future
27

Click to edit Master title style
53
Roadmap to this Future
27