Click to edit Master title stylebreport.myiris.com/PRALILLA/UTIBANK_20150102.pdf · ·...
104
India Financials Gradual recovery to unfold – Prefer stock specific approach Nitin Kumar [email protected] +91-22-66322236 Pritesh Bumb [email protected] +91-22-66322232 Click to edit Master title style Lilladher Prabhudas January 2015 Prabhudas Lilladher Pvt. Ltd. and/or its associates (the 'Firm') does and/or seeks to do business with companies covered in its research reports. As a result investors should be aware that the Firm may have a conflict of interest that could affect the objectivity of the report. Investors should consider this report as only a single factor in making their investment decision. Please refer to important disclosures and disclaimers at the end of the report.
Transcript of Click to edit Master title stylebreport.myiris.com/PRALILLA/UTIBANK_20150102.pdf · ·...

India Financials
Gradual recovery to unfold – Prefer stock specific approach
Nitin Kumar [email protected]
+91-22-66322236
Pritesh Bumb
[email protected] +91-22-66322232
Click to edit Master title style LilladherPrabhudas January 2015
Prabhudas Lilladher Pvt. Ltd. and/or its associates (the 'Firm') does and/or seeks to do business with companies covered in its research reports. As a result investors should be aware that the Firm may have a conflict of interest that could affect the objectivity of the report. Investors should consider this report as only a single factor in making their investment decision.
Please refer to important disclosures and disclaimers at the end of the report.

LilladherPrabhudas Contents
1/2/2015 2
Page No.
Companies
Axis Bank 47
HDFC Bank 50
ICICI Bank 53
IndusInd Bank 56
Kotak Mahindra Bank 59
YES Bank 62
Bank of Baroda 65
Bank of India 68
Punjab National Bank 71
State Bank of India 74
Union Bank of India 77
Federal Bank 80
Jammu & Kashmir Bank 83
South Indian Bank 86
HDFC 89
IDFC 92
LIC Housing Finance 95
M&M Financial Services 98
Shriram Transport Finance Company 101
Page No.
Gradual recovery to unfold – Prefer stock specific approach 3
Investment Summary 4
Top-Down Strategy 5
Our key stock ideas 6
Key changes in our earnings estimates 7
PL v/s Consensus estimates 8-9
Macros – Some improvement at the margin 11-13
Rating agency actions – Upgrades trend is firming up 14
Sectoral Deployment of Credit has been overall weak 15-16
GDP multiplier has come-off – revival in industrial growth a must 17-18
Treasury gains – Could now move in bank’s favour 19-20
Net Interest Margins - Fixed rate books to be better placed 21-22
Fees – Slowdown everywhere, we expect a gradual recovery 23
Regulations:- RBI maintains its accommodative stance 24
Capital - Basel III concerns only on some PSU banks ! 25-26
Pension Standardization – Near-term & Long-term impact 27-28
Asset Quality Cycle – Conservative on improvement v/s Last Cycle 29-33
Credit cycle Analysis - Corporate leverage & Interest coverage 34-37
Restructuring Monitor 38-42
Sensitivity Analysis - Loan Growth & Credit Cost effect to target price 43-44
Appendix
Fund & Non-fund based bank exposures 45
(Prices as on January 01, 2015)

LilladherPrabhudas Gradual recovery to unfold – prefer stock specific approach
• Bank nifty has outperformed the market by ~10% over past six months. While we remain constructive on the sector, we believe that further stock movement would depend more on on-ground recovery rather than pure optimism.
• We expect economic recovery to be fairly gradual unlike the previous up-cycle (2005-2008) when the domestic recovery coincided with a period of strong global growth. We expect GDP growth to average ~6.25% over next two years unlike 8.9% average growth between 2005-2008.
• We thus estimate credit cost to improve by ~25bp each over next two years for SOE banks and estimate earnings CAGR of ~24% for the sector aided by improved performance of PSU banks, against a low base. We note that despite this strong earnings traction the RoAs of most PSU banks (except SBI & PNB) would remain around 0.7% and would be significantly lower than previous up-cycles.
• With significant decline in G-sec and corporate bond yields the prospects of treasury gains has improved. However the total quantum of such treasury gains will be small in comparison to the gains made in previous rate easing cycles (please refer slide 20 for details).
• We believe that revival in industrial growth is the key for any sustained improvement in credit growth. Our analysis shows that credit growth to nominal GDP multiplier is most levered to industrial growth. We estimate credit growth to improve to 15% in FY16E as which corresponds to credit growth to nominal GDP multiplier of 1.5x (1.3x average over past four years).
• Our sensitivity analysis indicates that any sharper than expected turnaround in economy would result in ~15% rise in our PTs. We note that this is not a blue sky scenario but a possible outcome if the macro scenario were to improve at a rate, slightly better than expected.
• Stock ideas: We prefer ICICIBC/HDFCB among large private banks; SHTF/LICHF/HDFC amongst NBFCs, SBI/BOB amongst PSUs and Federal bank among small caps. MMFS/PNB are key avoids.
1/2/2015 3

LilladherPrabhudas Investment Summary
• Macros improving at the margin but we expect only a gradual recovery in GDP growth: PPOP growth has been slowing for all banks including private names and we do not expect trend to reverse sharply over next 1-2 qtrs.
• Rate Cycle: We expect a calibrated easing in rate cycle from 4Q FY15 onwards however extent of bond gains will be much lower than the previous cycles. BOI, CBK, PNB are better placed amongst large banks to benefit from decline in bond yields.
• Credit cycle – Industrial growth is the key; modest uptick expected for FY16: We expect modest uptick in credit growth in FY16E as the credit growth to nominal GDP multiple is most levered to industrial growth, which is likely to improve only gradually. Also, some acts of de-leveraging and credit substitution will likely affect overall growth.
• Our revised PTs are based on Sep-16 book and some higher multiple factoring in potential improvement in economic growth/investment cycle. We prefer ICICIBC/HDFCB among large private banks; SHTF/LICHF/HDFC amongst NBFCs, SBI/BOB amongst SOE banks and Federal bank among midcap banks. MMFS/PNB are key avoids.
1/2/2015 4
India Financials – Sector Valuations - ICICI/HDFCB top private picks; SBI/BOB top PSU banks and Federal in Midcap banks
Source: Bloomberg, Company Data, PL Research estimates

LilladherPrabhudas Top-Down Strategy
• Credit growth to improve gradually; industrial growth revival is the key: Credit growth trends continue to remain sluggish despite robust agriculture (20% YoY) and retail loan growth. Muted trends in capex activity, reduced cost of hedged overseas borrowings and moderation in working capital requirements (steep fall in commodity prices) has affected the industrial credit growth. We estimate ~15% credit growth for FY16E factoring in some improvement in industrial/Infra off take.
• PPOP growth to revive; margins are close to peaking out for large private banks: With gradual revival in loan/fee growth we expect PPOP growth to improve for the sector. NII growth will likely follow loan growth as margins have likely peaked out (NIMs for HDFC Bank and Axis Bank are at multiyear peak) while IIB and YES may report margin expansion going forward. PSU banks PPOP growth to also recover aided by bond gains but we do not expect core PPOP/assets to recover meaningfully.
• Credit cycle - No easy fix this time; relapse risk from restructured portfolio remains a worry: We are finally seeing some acts of de-leveraging which is necessary to continue but we expect upgrade/recovery to take longer in this cycle than last one (domestic issues in this cycle v/s commodity related risks in the last one). Nearly ~50% of total restructuring via CDR route has happened in past two years which poses threat to asset quality going forward as these assets comes out of moratorium. On two-year lag basis the CDR failure rate has already increased to 44% on the basis of number of cases and 25% on amount-wise basis.
• Regulator continues with its supportive stance – positive for PSUs: RBI has been more accommodative off-late in banking regulations with recent relaxations in re-financing of Infra loans, pushing out dynamic provisioning, shift in BASEL III transition and payment reschedulement of existing infrastructure loans. Most of these relaxations have brought a large relief for PSU banks.
1/2/2015 5

LilladherPrabhudas Our key stock ideas
• Axis Bank (BUY): (+) Analysis indicates that risk in power/large corporate book is lower than perceived (+) CASA especially CA mobilization is best in class and to some extent under-appreciated (+) Valuations reasonable at 2.2x Sep-16 book. (-) PPOP growth has moderated significantly.
• ICICI Bank (BUY): (+) Like Axis, risk in power/large corporate book low especially in asset class with high loss given default (+) Retail SME portfolio stable despite significant stress. (+) Subsidiaries are gaining scale and their contribution to overall profitability is improving. (+) Relaxation in FDI limit in insurance is a positive trigger. (-) On a relative basis, asset quality risks appear high due to lumpy exposure (-) PPOP moderation to continue in spite of better fee growth expected as there is limited room for further margin expansion.
• HDFCB (BUY): (+) Best placed to overcome current slowdown – Both opex and credit cost flexibility high. (+) Fixed rate book to aid margins in 2H15 while benign earning base will help bank generate ~25% earnings CAGR over FY15-17E (+) Asset quality holding up (-) Slowing PAT growth and retail cycle may not remain as benign.
• Federal bank (BUY): (+) Stability in large corporate portfolio as well after steady performance on SME/Retail (+) Slower branch expansion to aid in cost optimization (+) Loan growth to improve after an year of consolidation while management’s focus on broad-basing fee income yields results (-) Growth still below par and hence leveraging up will take longer.
• PSU banks - Macro turning conducive – Prefer SBI & BOB on cleaner Balance sheet and BOI on valuations: (-) PPOP growth much worse than private banks (lower NIMs/ loan growth / pension costs worries). (+) Prospects of healthy treasury gains and gradual turnaround in asset quality. (-) Large corporate book riskier v/s private peers. (-) Under-provisioned B/S + limited P&L support in this credit cycle (low recoveries/upgrades) (-) Capital constraints. (+) Liability franchise + valuations (+) SBI better placed on pensions, project book and lower restructuring – Will outperform as slippages levels improve.
• Shriram/LICHF still preferred; Sell MMFS: (+) SHTF: Profitability has bottomed out – Initial signs of a pick up in loan growth while credit cost likely to inch lower in 2H15 (+) Margins likely to expand as funding cost has declined (+) Regulatory overhang on NPL recognition is now done away with – Recent up-move limits risk-reward though (2) LICHF: Will be beneficiary of lower rates in 2H15 + Reasonable valuations (3) MMFS: Growth and asset quality disappointment likely to continue – Valuations expensive while AUM growth is likely to remain muted in the near term.
1/2/2015 6

LilladherPrabhudas Key changes in our earnings estimates
1/2/2015 7
Change in earnings estimates
We estimate earnings CAGR of ~24% for private banks vs ~25% growth for PSU Banks. This will be led by gradual revival in loan growth and moderation in provisioning expenses (pls. see slide 32 for details) as we estimate margins to remain stable. NBFCs on other hand are estimated to deliver earnings CAGR of ~24% over FY15-17E.
FY15E FY16E FY15E FY16E FY15E FY16E FY15E FY16E FY15E FY16E FY15E FY16E
Private banks
Axis Bank 136,138 157,739 147,017 174,529 8% 11% 70,688 85,002 73,109 88,262 3% 4%
Federal Bank 23,712 27,178 23,712 27,178 0% 0% 9,564 11,495 9,564 11,495 0% 0%
HDFC Bank 223,407 265,252 221,146 275,981 -1% 4% 102,565 126,063 104,569 133,840 2% 6%
ICICI Bank 189,537 217,494 198,759 234,476 5% 8% 112,031 130,131 113,652 135,279 1% 4%
Indus Ind Bank 34,560 42,755 35,190 44,771 2% 5% 17,957 22,463 17,883 23,265 0% 4%
Yes Bank 33,471 41,714 35,527 45,289 6% 9% 19,275 24,089 19,683 24,089 2% 0%
KMB 53,276 62,980 53,276 62,980 0% 0% 26,663 31,982 26,663 31,982 0% 0%
ING Vysya 19,951 23,319 19,951 23,319 0% 0% 7,165 9,729 7,165 9,729 0% 0%
Federal Bank 23,712 27,178 23,712 27,178 0% 0% 9,564 11,495 9,564 11,495 0% 0%
SIB 16,335 18,935 16,335 18,935 0% 0% 5,549 6,603 5,549 6,603 0% 0%
SOE banks
Bank of Baroda 145,063 167,075 134,161 153,627 -8% -8% 52,209 64,908 51,883 60,628 -1% -7%
Bank of India 130,615 155,237 118,435 142,696 -9% -8% 28,922 40,299 30,909 41,466 7% 3%
Punjab Nat. Bank 172,196 200,240 174,993 205,226 2% 2% 40,723 56,044 41,314 54,009 1% -4%
State Bk of India 552,459 621,239 554,092 640,985 0% 3% 135,546 172,278 136,042 167,462 0% -3%
Union Bank 90,519 103,258 88,485 104,001 -2% 1% 19,375 26,384 23,280 28,831 20% 9%
NBFCs
HDFC 82,373 95,118 81,697 92,139 -1% -3% 63,920 74,046 59,314 66,899 -7% -10%
IDFC 26,434 27,949 26,434 27,949 0% 0% 17,259 19,884 17,259 19,884 0% 0%
LICHF 23,150 28,368 23,666 29,072 2% 2% 14,895 18,526 14,629 18,770 -2% 1%
MMFS 31,019 37,123 31,019 37,123 0% 0% 8,995 11,061 8,995 11,061 0% 0%
STFC 35,765 44,001 35,765 44,001 0% 0% 13,103 16,541 13,103 15,293 0% -8%
YoY Chng.PAT earlier PAT revised(Rs m)
NII earlier NII revised YoY Chng.
Source: Company Data, Bloomberg, PL Research estimates

LilladherPrabhudas PL v/s Consensus estimates
Source: Company data, Bloomberg, PL Research estimates
PL versus consensus EPS estimates
• Our earnings estimates for private banks are marginally higher than consensus, except for Kotak Bank where in we are 5% lower.
• We are significantly higher than consensus (>10%) in our earnings estimate for BOI and Union bank where in our implied FY15-FY17E earnings CAGR stand at 33% and 27% respectively.
• We note that despite this the FY17E RoA for BOI and UNBK would still remain modest at 0.68% and 0.67% respectively.
• Amongst NBFCs we are higher than consensus on LICHF where in we expect spreads to improve from low-base while lower provisioning requirement (aided by reversals) would keep a check on credit cost.
• We are also slightly lower than consensus on MMFS and SHTF where in we expect CV cycle to recover only gradually and the credit cost could swing sharply based on the decision management takes on compliance with the revised NBFC guidelines, recently published by the RBI.
1/2/2015 8
Consensus EPS PL EPS
Private banks
Axis Bank 36.7 37.7 2.9%
Federa l Bank 13.8 13.4 -2.9%
HDFC Bank 52.9 51.7 -2.3%
ICICI Bank 23.0 23.4 1.8%
Indus Ind Bank 43.0 44.5 3.5%
ING Vysya Bank 51.1 51.6 1.1%
J&K Bank 25.5 25.9 1.7%
Kotak Bank 29.3 27.8 -5.1%
South Indian Bank 4.6 4.9 5.4%
Yes Bank 58.1 58.5 0.6%
SOE banks
Bank of Baroda 148.6 138.7 -6.6%
Bank of India 61.3 67.6 10.2%
Punjab National Bank 155.3 149.1 -4.0%
SBI 23.5 22.3 -5.0%
Union Bank 39.8 48.7 22.5%
NBFCs
HDFC 46.4 44.4 -4.2%
IDFC 12.3 12.3 -0.2%
LICHF 35.2 37.1 5.3%
M&M Financia l Services 20.6 19.6 -4.9%
Shriram Transport Finance 76.3 73.5 -3.6%
% differenceFY16E
LilladherPrabhudas Trends in earnings change by consensus
Source: Bloomberg, PL Research estimates
Consensus change in earnings over past 1m, 3m and 6m
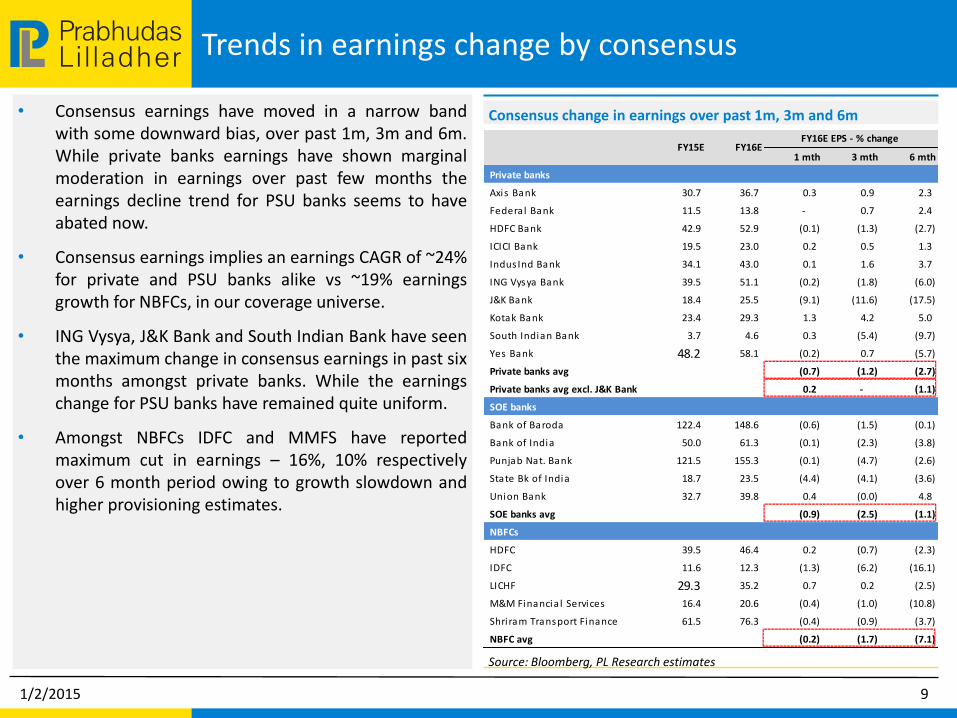
• Consensus earnings have moved in a narrow band with some downward bias, over past 1m, 3m and 6m. While private banks earnings have shown marginal moderation in earnings over past few months the earnings decline trend for PSU banks seems to have abated now.
• Consensus earnings implies an earnings CAGR of ~24% for private and PSU banks alike vs ~19% earnings growth for NBFCs, in our coverage universe.
• ING Vysya, J&K Bank and South Indian Bank have seen the maximum change in consensus earnings in past six months amongst private banks. While the earnings change for PSU banks have remained quite uniform.
• Amongst NBFCs IDFC and MMFS have reported maximum cut in earnings – 16%, 10% respectively over 6 month period owing to growth slowdown and higher provisioning estimates.
1/2/2015 9
1 mth 3 mth 6 mth
Private banks
Axis Bank 30.7 36.7 0.3 0.9 2.3
Federa l Bank 11.5 13.8 - 0.7 2.4
HDFC Bank 42.9 52.9 (0.1) (1.3) (2.7)
ICICI Bank 19.5 23.0 0.2 0.5 1.3
Indus Ind Bank 34.1 43.0 0.1 1.6 3.7
ING Vysya Bank 39.5 51.1 (0.2) (1.8) (6.0)
J&K Bank 18.4 25.5 (9.1) (11.6) (17.5)
Kotak Bank 23.4 29.3 1.3 4.2 5.0
South Indian Bank 3.7 4.6 0.3 (5.4) (9.7)
Yes Bank 48.2 58.1 (0.2) 0.7 (5.7)
Private banks avg (0.7) (1.2) (2.7)
Private banks avg excl. J&K Bank 0.2 - (1.1)
SOE banks
Bank of Baroda 122.4 148.6 (0.6) (1.5) (0.1)
Bank of India 50.0 61.3 (0.1) (2.3) (3.8)
Punjab Nat. Bank 121.5 155.3 (0.1) (4.7) (2.6)
State Bk of India 18.7 23.5 (4.4) (4.1) (3.6)
Union Bank 32.7 39.8 0.4 (0.0) 4.8
SOE banks avg (0.9) (2.5) (1.1)
NBFCs
HDFC 39.5 46.4 0.2 (0.7) (2.3)
IDFC 11.6 12.3 (1.3) (6.2) (16.1)
LICHF 29.3 35.2 0.7 0.2 (2.5)
M&M Financia l Services 16.4 20.6 (0.4) (1.0) (10.8)
Shri ram Transport Finance 61.5 76.3 (0.4) (0.9) (3.7)
NBFC avg (0.2) (1.7) (7.1)
FY15E FY16EFY16E EPS - % change

LilladherPrabhudas Stock performance of PL coverage universe
1/2/2015 10
Source: Bloomberg, PL Research
1M 3M 6M 12M 1M 3M 6M 12M
NIFTY 8,284 2.4% 4.1% 14.6% 36.0%
Private Banks
ICICI Bank 352 0.2% 23.3% 22.5% 60.5% -2.2% 19.1% 7.9% 24.5%
HDFC Bank 952 0.2% 9.7% 15.6% 43.1% -2.2% 5.5% 1.1% 7.1%
Axis Bank 503 2.8% 32.4% 31.0% 94.6% 0.4% 28.3% 16.4% 58.7%
Kotak Bank 1,259 4.7% 24.4% 42.3% 74.2% 2.3% 20.3% 27.7% 38.2%
Yes Bank 773 8.1% 38.6% 38.9% 106.3% 5.7% 34.4% 24.3% 70.3%
IIB 812 5.1% 34.9% 41.1% 91.8% 2.7% 30.8% 26.5% 55.8%
ING Vysya 870 5.1% 46.2% 30.6% 43.0% 2.7% 42.1% 16.0% 7.0%
J&K Bank 150 7.5% 7.8% -5.2% 4.7% 5.1% 3.6% -19.8% -31.3%
Federal 150 1.6% 21.3% 14.3% 73.9% -0.8% 17.2% -0.3% 37.9%
South Indian 29 6.6% 13.7% -8.7% 40.1% 4.2% 9.6% -23.2% 4.1%
SOE Banks
SBI 314 -1.8% 29.6% 17.2% 77.9% -4.1% 25.4% 2.6% 41.9%
PNB 220 1.7% 24.9% 10.2% 73.0% -0.7% 20.8% -4.4% 37.0%
BOB 1,083 0.0% 20.5% 23.3% 64.8% -2.4% 16.4% 8.7% 28.8%
BOI 304 6.5% 30.8% 0.0% 25.2% 4.1% 26.7% -14.6% -10.8%
Union 241 10.9% 26.5% 2.8% 83.9% 8.5% 22.3% -11.8% 48.0%
NBFCs
HDFC 1,124 -1.2% 7.0% 14.2% 41.7% -3.6% 2.9% -0.4% 5.7%
LICHF 438 3.8% 36.8% 35.5% 97.9% 1.4% 32.7% 21.0% 62.0%
STFC 1,102 -1.3% 21.1% 21.9% 64.0% -3.7% 16.9% 7.3% 28.0%
MMFS 330 8.0% 19.8% 15.5% 3.0% 5.6% 15.6% 1.0% -33.0%
IDFC 158 0.1% 15.8% 16.8% 43.8% -2.3% 11.7% 2.2% 7.8%
CoverageStock Performance (%) Relative Performance (%)CMP
(Rs)
LilladherPrabhudas Macros – Some improvement at the margin
Source: RBI, Company Data, PL Research
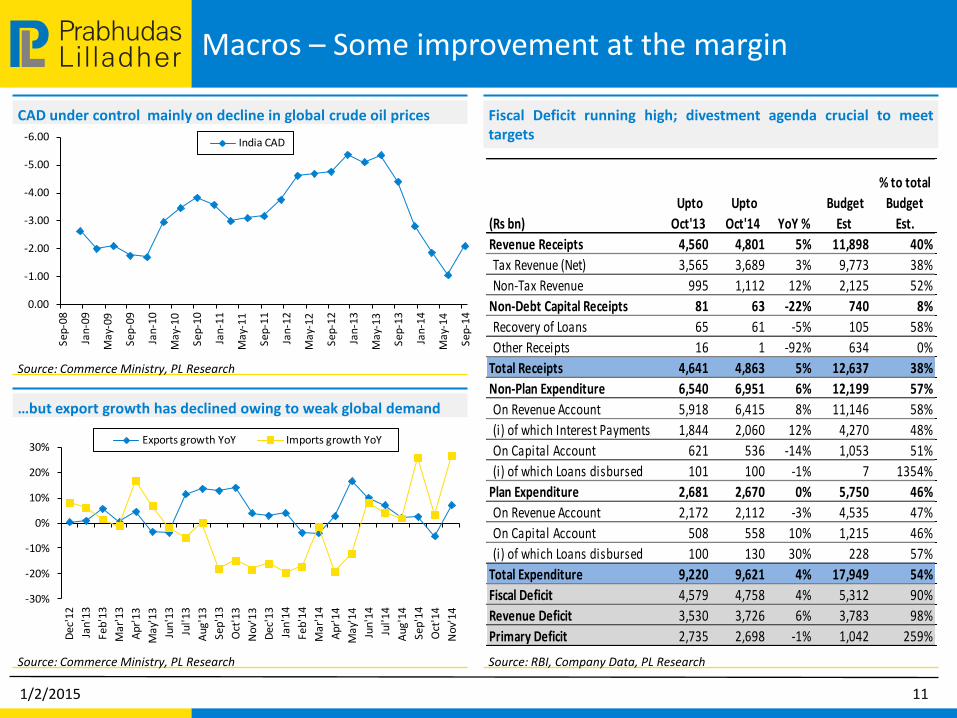
Fiscal Deficit running high; divestment agenda crucial to meet targets
Source: Commerce Ministry, PL Research
…but export growth has declined owing to weak global demand
Source: Commerce Ministry, PL Research
CAD under control mainly on decline in global crude oil prices
1/2/2015 11
(Rs bn)
Upto
Oct'13
Upto
Oct'14 YoY %
Budget
Est
% to total
Budget
Est.
Revenue Receipts 4,560 4,801 5% 11,898 40%
Tax Revenue (Net) 3,565 3,689 3% 9,773 38%
Non-Tax Revenue 995 1,112 12% 2,125 52%
Non-Debt Capital Receipts 81 63 -22% 740 8%
Recovery of Loans 65 61 -5% 105 58%
Other Receipts 16 1 -92% 634 0%
Total Receipts 4,641 4,863 5% 12,637 38%
Non-Plan Expenditure 6,540 6,951 6% 12,199 57%
On Revenue Account 5,918 6,415 8% 11,146 58%
(i) of which Interest Payments 1,844 2,060 12% 4,270 48%
On Capital Account 621 536 -14% 1,053 51%
(i) of which Loans disbursed 101 100 -1% 7 1354%
Plan Expenditure 2,681 2,670 0% 5,750 46%
On Revenue Account 2,172 2,112 -3% 4,535 47%
On Capital Account 508 558 10% 1,215 46%
(i) of which Loans disbursed 100 130 30% 228 57%
Total Expenditure 9,220 9,621 4% 17,949 54%
Fiscal Deficit 4,579 4,758 4% 5,312 90%
Revenue Deficit 3,530 3,726 6% 3,783 98%
Primary Deficit 2,735 2,698 -1% 1,042 259%
-30%
-20%
-10%
0%
10%
20%
30%
Dec
'12
Jan'
13
Feb'
13
Mar
'13
Apr
'13
May
'13
Jun'
13
Jul'
13
Aug
'13
Sep'
13
Oct
'13
Nov
'13
Dec
'13
Jan'
14
Feb'
14
Mar
'14
Apr
'14
May
'14
Jun'
14
Jul'
14
Aug
'14
Sep'
14
Oct
'14
Nov
'14
Exports growth YoY Imports growth YoY
-6.00
-5.00
-4.00
-3.00
-2.00
-1.00
0.00
Sep
-08
Jan
-09
May
-09
Sep
-09
Jan
-10
May
-10
Sep
-10
Jan
-11
May
-11
Se
p-1
1
Jan
-12
Ma
y-1
2
Se
p-1
2
Jan
-13
Ma
y-1
3
Se
p-1
3
Jan
-14
May
-14
Sep
-14
India CAD

LilladherPrabhudas Macros – hopes pinned on FY16 now
Source: Finance ministry, Bloomberg, PL Research
Source: CSO, PL Research
Fiscal deficit has already reached ~90% of the budgeted levels
IIP has been weak after showing initial signs of pick up
Source: Bloomberg, PL Research
GDP growth bounces; RBI keeps growth estimate unchanged
Source: Finance Ministry, RBI, PL Research
Tax collection trails estimates on sluggish economic recovery
1/2/2015 12
0%
5%
10%
15%
20%
25%
Tax Direct tax Indirect tax Receipts
Budgeted Actual
8.28.7
9.6
7.67
6.55.8
4.5 4.6 4.4 4.4 4.75.2
4.6 4.65.7 5.3
0.0
2.0
4.0
6.0
8.0
10.0
12.0
Sep
-10
Dec
-10
Ma
r-1
1
Jun-
11
Sep
-11
Dec
-11
Mar
-12
Jun-
12
Sep
-12
Dec
-12
Mar
-13
Jun-
13
Sep
-13
De
c-1
3
Mar
-14
Jun-
14
Sep
-14
(%)
India GDP
-10.0
-8.0
-6.0
-4.0
-2.0
0.0
2.0
4.0
6.0
Mar
-13
Apr
-13
May
-13
Jun
-13
Jul-
13
Aug
-13
Se
p-1
3
Oct
-13
No
v-1
3
De
c-1
3
Jan
-14
Feb
-14
Mar
-14
Apr
-14
May
-14
Jun
-14
Jul-
14
Aug
-14
Sep
-14
Oct
-14
Overall IIP Mfg. IIP
FY15 4 yr Avg. FY14 FY13 FY12 FY11
Apr 21.4 15.3 18.4 13.7 14.5 14.5
May 45.3 29.2 35.6 28.9 25.3 27
Jun 56.1 33.2 51.7 38.9 31.5 10.8
Jul 61.2 47.4 67 54 44.3 24.3
Aug 74.9 60.5 79.6 68.9 53 40.5
Sep 82.6 60.0 81.1 68.8 54.4 35.7
Oct 89.6 67.1 90.1 75.1 59.5 43.5
Nov 75.7 100.3 84.3 68.4 49.9
Dec 76.8 101.6 86 73.8 45.8
Jan 85.8 104.9 94.7 84.2 59.5
Feb 98.2 117.9 105.7 95.6 73.6
Mar 100 100 100 100 100

LilladherPrabhudas Macros – Expect some monetary easing in 2H15
Source: RBI, PL Research
Source: Bloomberg, PL Research
CPI has moved down on base effect; on track with RBI projections
Corporate yields has dropped sharply on better liquidity conditions
Source: RBI, Bloomberg, PL Research
Liquidity conditions eased; excess liquidity being drained by OMOs
Source: RBI, PL Research
Limited hikes in MSP to help keep food inflation under control
1/2/2015 13
0
5
10
15
20
25
30
2002 2003 2004 2005 2006 2007 2008 2009 2010 2011 2012 2013 2014 2015
MSP (WPI weighted, % YoY)
(2,000)
(1,500)
(1,000)
(500)
-
500
Nov
-12
Dec
-12
Jan
-13
Feb
-13
Mar
-13
Ap
r-1
3M
ay-1
3Ju
n-1
3Ju
l-13
Aug
-13
Sep
-13
Oct
-13
Nov
-13
Dec
-13
Jan
-14
Feb
-14
Mar
-14
Ap
r-1
4M
ay-
14
Jun-
14
Jul-
14A
ug-1
4Se
p-1
4O
ct-1
4N
ov-
14
Dec
-14
(Rs
bn)
LAF MSF ECR/Sp Repo Term Repo
10.810.910.4
9.4 9.39.9 9.6 9.5
9.810.2
11.2
9.9
8.8
8.0 8.3 8.68.3
7.58.0 7.7
6.5
5.5
4.3
4.0
5.0
6.0
7.0
8.0
9.0
10.0
11.0
12.0
Jan
-13
Fe
b-1
3
Mar
-13
Ap
r-1
3
May
-13
Jun-
13
Jul-
13
Aug
-13
Se
p-1
3
Oct
-13
Nov
-13
Dec
-13
Jan
-14
Fe
b-1
4
Mar
-14
Apr
-14
May
-14
Jun-
14
Jul-
14
Aug
-14
Se
p-1
4
Oct
-14
Nov
-14
Base effect playing its
way in CPI inflation
7.5
8.0
8.5
9.0
9.5
10.0
10.5
Jun
-11
Aug
-11
Oct
-11
Dec
-11
Fe
b-1
2
Apr
-12
Jun
-12
Aug
-12
Oct
-12
Dec
-12
Feb
-13
Apr
-13
Jun
-13
Aug
-13
Oct
-13
Dec
-13
Fe
b-1
4
Ap
r-1
4
Jun
-14
Aug
-14
Oct
-14
Dec
-14
FIMMDA 3 YR AAA FIMMDA 5 YR AAA

LilladherPrabhudas Rating agency actions – Upgrades trend is firming up
• Rating-action-ratio (ratio of rating upgrades plus affirmations to downgrades) has surpassed one for the first time in past four years.
• More importantly the rating downgrade rate has declined significantly during 2HFY14.
• Average corporate rating which has been drifting lower over past several years has stabilized, though still remains below investment grade as large number of smaller companies are getting rated at the bottom of the pyramid.
Source: CRISIL, PL Research
Source: CRISIL, PL Research
Rating transition stabilizes after successive deterioration over past yrs
…upgrade rate exceeded downgrades for the first time in past 3 years
Source: CRISIL, PL Research
Rating Action Ratio has crossed one as…
1/2/2015 14
0.00
0.05
0.10
0.15
0.20
0.25
0.30
0.35
0.40
AAA AA A BBB BB B C D
Mar-10 Mar-12 Mar-14 Sep-14
-
0.20
0.40
0.60
0.80
1.00
1.20
1.40
1.60
1.80
0%
2%
4%
6%
8%
10%
12%
14%
FY95
FY96
FY
97
FY98
FY99
FY
00
FY01
FY02
FY03
FY04
FY
05
FY06
FY07
FY
08
FY09
FY10
FY11
FY12
FY
13
FY14
1H15
IIP GDP RAR (RHS)
0.0%
2.0%
4.0%
6.0%
8.0%
10.0%
12.0%
14.0%
1H 0
9
2H
09
1H 1
0
2H 1
0
1H 1
1
2H
11
1H
12
2H 1
2
1H 1
3
2H 1
3
1H
14
2H 1
4
1H 1
5
Downgrade rate Upgrade rate
LilladherPrabhudas Sectoral Deployment of Credit has been overall weak
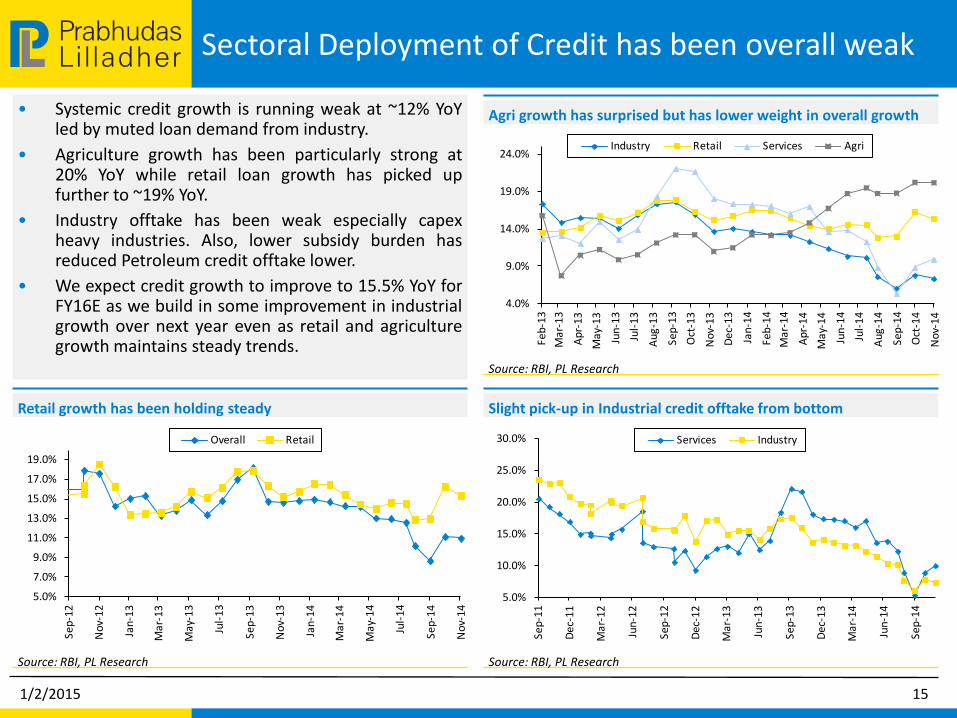
• Systemic credit growth is running weak at ~12% YoY led by muted loan demand from industry.
• Agriculture growth has been particularly strong at 20% YoY while retail loan growth has picked up further to ~19% YoY.
• Industry offtake has been weak especially capex heavy industries. Also, lower subsidy burden has reduced Petroleum credit offtake lower.
• We expect credit growth to improve to 15.5% YoY for FY16E as we build in some improvement in industrial growth over next year even as retail and agriculture growth maintains steady trends.
Source: RBI, PL Research
Source: RBI, PL Research
Agri growth has surprised but has lower weight in overall growth
Slight pick-up in Industrial credit offtake from bottom
Source: RBI, PL Research
Retail growth has been holding steady
1/2/2015 15
4.0%
9.0%
14.0%
19.0%
24.0%
Feb
-13
Mar
-13
Apr
-13
May
-13
Jun
-13
Jul-
13
Aug
-13
Sep
-13
Oct
-13
Nov
-13
Dec
-13
Jan
-14
Feb
-14
Mar
-14
Apr
-14
May
-14
Jun
-14
Jul-
14
Aug
-14
Sep
-14
Oct
-14
Nov
-14
Industry Retail Services Agri
5.0%
7.0%
9.0%
11.0%
13.0%
15.0%
17.0%
19.0%
Sep
-12
Nov
-12
Jan
-13
Mar
-13
May
-13
Jul-
13
Sep
-13
Nov
-13
Jan
-14
Ma
r-1
4
May
-14
Jul-
14
Se
p-1
4
Nov
-14
Overall Retail
5.0%
10.0%
15.0%
20.0%
25.0%
30.0%
Sep
-11
Dec
-11
Mar
-12
Jun-
12
Sep
-12
Dec
-12
Mar
-13
Jun-
13
Sep
-13
Dec
-13
Ma
r-1
4
Jun-
14
Sep
-14
Services Industry

LilladherPrabhudas Sectoral Credit offtake – Industry offtake has been
extremely weak especially Capex heavy
Source: : RBI, PL Research
Source: RBI, PL Research
Industry growth has declined led by cement and metals segments
Vehicle loans pick up has slowed down after improving in Oct’14
Source: RBI , PL Research
Banks restraint in lending to power is witnessed in credit offtake
Source: : RBI, PL Research
Both Industry and non-infra industry growth has been subdued
1/2/2015 16
0.0%
4.0%
8.0%
12.0%
16.0%
20.0%
Sep
-12
Oct
-12
Nov
-12
Dec
-12
Jan
-13
Feb
-13
Mar
-13
Apr
-13
May
-13
Jun
-13
Jul-
13
Aug
-13
Sep
-13
Oct
-13
Nov
-13
Dec
-13
Jan
-14
Feb
-14
Mar
-14
Apr
-14
May
-14
Jun
-14
Jul-
14
Aug
-14
Sep
-14
Oct
-14
Nov
-14
Industry Industry (Ex-Infra)
5%
10%
15%
20%
25%
30%
Feb
-13
Ma
r-1
3
Apr
-13
May
-13
Jun
-13
Jul-
13
Aug
-13
Sep
-13
Oct
-13
Nov
-13
Dec
-13
Jan
-14
Fe
b-1
4
Mar
-14
Apr
-14
May
-14
Jun
-14
Jul-
14
Aug
-14
Sep
-14
Oct
-14
Nov
-14
Cement Metals Textiles Capex heavy
10.0%
15.0%
20.0%
25.0%
30.0%
Feb
-13
Mar
-13
Apr
-13
May
-13
Jun
-13
Jul-
13
Aug
-13
Sep
-13
Oct
-13
Nov
-13
Dec
-13
Jan
-14
Feb
-14
Mar
-14
Apr
-14
May
-14
Jun
-14
Jul-
14
Aug
-14
Sep
-14
Oct
-14
Nov
-14
Vehicle Loans Housing
5%
10%
15%
20%
25%
30%
35%
Feb
-13
Ma
r-1
3
Apr
-13
May
-13
Jun
-13
Jul-
13
Aug
-13
Sep
-13
Oct
-13
Nov
-13
Dec
-13
Jan
-14
Fe
b-1
4
Mar
-14
Apr
-14
May
-14
Jun
-14
Jul-
14
Aug
-14
Sep
-14
Oct
-14
Nov
-14
Infra ex telecom Roads Power

LilladherPrabhudas Sector Outlook– Credit growth pick-up to remain
modest
Source: RBI, PL Research
15.5% credit growth in FY16: Factoring in some revival in economy
Source: Bloomberg, RBI, PL Research
Credit growth to GDP multiplier to increase as industrial growth picks-up
Source: Bloomberg, RBI, PL Research
Credit growth including CPs is a tad higher at ~11% – Gap with deposit growth though has narrowed
1/2/2015 17
9.0%
11.0%
13.0%
15.0%
17.0%
19.0%
Se
p-1
2O
ct-1
2N
ov-
12
Dec
-12
Jan
-13
Fe
b-1
3M
ar-1
3A
pr-1
3M
ay-…
Jun
-13
Jul-
13A
ug-1
3Se
p-1
3O
ct-1
3N
ov-1
3D
ec-
13
Jan
-14
Feb
-14
Ma
r-1
4
Apr
-14
Ma
y-…
Jun
-14
Jul-
14A
ug
-14
Sep
-14
Oct
-14
No
v-1
4D
ec-1
4
Adj Credit for CPs Credit growth

LilladherPrabhudas GDP multiplier has come-off – revival in industrial
growth a must for sustained recovery in credit growth
Source: Bloomberg, RBI, PL Research Estimates
GDP multiplier across GDP/credit growth segments • GDP multiplier is most levered to industrial growth followed by agriculture growth and services growth respectively.
• The gradual decline in credit growth to nominal GDP multiplier can be attributed to the falling share of agriculture segment in the total GDP mix and modest trend in industrial growth besides other extraneous factors (credit substitution, overseas borrowings, etc).
• We estimate credit growth to recover to 15.5% in FY16E as economic recovery takes hold while retail and agriculture segment continue to report steady trends.
• This corresponds to a credit growth to nominal GDP multiplier of 1.5x vs average of 1.3x over past four years.
1/2/2015 18
Agri GDP growth (%) Agri credit growth (%) Multiplier
2009 0% 24% 263.91
2010 1% 23% 28.24
2011 8% 16% 2.04
2012 4% 13% 3.64
2013 2% 8% 4.03
2014 5% 13% 2.81
3.1
Industry GDP growth (%) Industry credit growth (%) Multiplier
2009 4% 21% 4.71
2010 9% 24% 2.66
2011 9% 23% 2.51
2012 3% 20% 5.82
2013 2% 15% 7.17
2014 2% 13% 8.20
5.9
Services GDP growth (%)Retail + Services credit growth (%) Multiplier
2009 10% 15% 1.49
2010 11% 9% 0.82
2011 10% 21% 2.17
2012 8% 14% 1.67
2013 7% 13% 1.87
2014 7% 16% 2.26
2.0
Average of last four years
Average of last four years
Average of last four years

LilladherPrabhudas Treasury gains – Could now move in bank’s favour
• With significant decline in G-sec and corporate bond yields the prospects of treasury gains has improved for the banking sector.
• The RBI has also reduced the SLR limit to 22% owing to poor credit demand yet the bank’s SLR portfolio remains high at ~28% of total NDTL. This will enable banks to make higher treasury gains going forward as they move securities from HTM to AFS, particularly as RBI begins to ease rate cycle from Feb-2015, in our view.
• However the total quantum of such gains will be small in comparison to the gains made in previous rate easing cycles when investment book used to be ~45% of total assets.
Source: Company Data, PL Research
Source: Bloomberg, RBI, PL Research
Corporate Investment Book (As % of FY14 B/s)
Bank’s SLR portfolio remains well above the limit mandated by RBI
Source: Bloomberg, PL Research
G-Sec & Corp bond yields have softened by >55 bps each from last Quarter
1/2/2015 19
0.0%
1.0%
2.0%
3.0%
4.0%
5.0%
6.0%
7.0%
8.0%
9.0%
10.0%
Yes Axis Kotak ICICI Indusind HDFCB
10.0
15.0
20.0
25.0
30.0
35.0
40.0
45.0
Jan
-91
Apr
-92
Jul-
93
Oct
-94
Jan
-96
Apr
-97
Jul-
98
Oct
-99
Jan
-01
Apr
-02
Jul-
03
Oct
-04
Jan
-06
Apr
-07
Jul-
08
Oct
-09
Jan
-11
Apr
-12
Jul-
13
Oct
-14
SLR limit Banks' SLR portfolio
Current 1month 3month 6month
Corporate Bond (%)
1Year 8.60 -0.04 -0.48 -0.38
3Year 8.62 -0.04 -0.61 -0.61
5Year 8.61 -0.07 -0.69 -0.69
10Year 8.55 -0.17 -0.76 -0.77
Govt. Securities
1Year 8.21 -0.11 -0.38 -0.32
5Year 7.99 -0.18 -0.53 -0.68
10Year 7.92 -0.25 -0.55 -0.86
Variation

LilladherPrabhudas Treasury gains – Could now move in bank’s favour
• We estimate that 50bp decline in bond-yields would enable banks to incur treasury gains varying between 5% to 21% of their FY15E PBT.
• Canara Bank, Oriental Bank of Commerce, Allahabad Bank, Corporation Bank are better placed to benefit from the decline in bond yields owing to higher AFS composition and the higher duration of their portfolio.
• Amongst private banks, Yes Bank is likely to benefit the most owing to much higher proportion of bonds/debentures in its investment portfolio.
1/2/2015 20
Source: Company Data, PL Research
Potential treasury gains arising from 50bp decline in bond yields
Source: Company Data, PL Research
But treasury gain potential is only ~10-15% of what PSUs had in the last cycle
Bank, (Rs m) SLR % AFS %M Duration
- AFS
Change in
portfolio yield
(%) - bp
Potential
bond gains
FY15E
PBT
As % of
FY15E PBT
Canara 84.7% 29.9% 3.8 50 8,372 40,438 20.7%
BOB 82.8% 23.9% 3.1 50 4,652 70,553 6.6%
BOI 86.3% 24.3% 3.8 50 5,409 39,083 13.8%
UNBK 76.1% 24.1% 3.5 50 3,839 26,910 14.3%
SBI 90.3% 22.3% 2.2 50 9,900 202,308 4.9%
PNB 82.0% 31.2% 3.5 50 7,786 57,145 13.6%
OBC 76.2% 23.7% 4.7 50 3,235 18,191 17.8%
Allahabad 79.0% 29.2% 3.4 50 2,888 16,735 17.3%
Corporation 77.6% 17.4% 3.9 50 2,171 12,076 18.0%
UCO Bank 80.6% 30.0% 3.0 50 2,960 21,365 13.9%
2002-05 Currently
Investments as % of assets 45% 28%
AFS (% of investments) 30-40% 25%
AFS duration 4-5 yrs 3-4 yrs
G-sec fall potential 3-4% 1-1.5%
Treasury gain potential (% of assets) 2.48% 0.30%

LilladherPrabhudas Net Interest Margins - Fixed rate books to be better
placed, but overall margins will remain stable • Corporate bond yields have eased significantly in past 3-4
months in anticipation of RBI easing expected from Q4FY15 onwards.
• Lower inflation, decline in funding cost and steady liquidity will enable banks to pass-on the benefits of lower rates to the borrowers unlike previous instances of policy easing effected by the RBI. We expect RBI to cut repo rate by 100bp over next one year, beginning Q4FY15.
• We expect NIMs to remain stable over FY16 (positive on YES, IIB) as banks focus on lowering their deposit cost before cutting base rates.
• Fixed rate asset books will benefit – Among banks HDFCB/KMB/IIB has high share of fixed rate book. SHTF/MMFS better placed among NBFCs,
Source: Bloomberg, PL Research
Source: Company Data, PL Research
CPI inflation moderating but above trend levels
Margins trends will remain mixed for Banks as loan mix changes
Source: Company Data, PL Research
Retail book - % of loans – Fixed rates books to benefit
1/2/2015 21
10.810.910.4
9.4 9.39.9 9.6 9.5
9.810.2
11.2
9.9
8.8
8.0 8.3 8.68.3
7.58.0 7.7
6.5
5.5
4.3
4.0
5.0
6.0
7.0
8.0
9.0
10.0
11.0
12.0
Jan
-13
Fe
b-1
3
Mar
-13
Ap
r-1
3
May
-13
Jun-
13
Jul-
13
Aug
-13
Se
p-1
3
Oct
-13
Nov
-13
Dec
-13
Jan
-14
Fe
b-1
4
Mar
-14
Apr
-14
May
-14
Jun-
14
Jul-
14
Aug
-14
Se
p-1
4
Oct
-14
Nov
-14
15% 16%
22%
8% 6%4% 5%
30%33%
4% 4%
21%
0%
10%
20%
30%
40%
50%
Axi
s
ICIC
I
HD
FCB
SB
I
PNB
BO
I
Uni
on
Ko
tak
IIB ING
SIB
Fede
ral
Retail Loans Share (ex-mortagage) NIM FY15E FY16E NIM FY15E FY16E
ICICI 3.27% 3.25% SBI 2.92% 2.90%
HDFCB 4.39% 4.47% PNB 3.06% 3.09%
Axis 3.62% 3.54% BOB 1.95% 1.94%
Kotak 4.65% 4.63% BOI 2.02% 2.06%
Yes 3.14% 3.35% Union 2.43% 2.54%
IIB 3.80% 3.86% HDFC 3.27% 3.18%
Federal 3.06% 3.01% LIC HF 2.10% 2.23%
ING 3.18% 3.18% STFC 6.75% 7.47%
J&K 3.49% 3.49% MMFSL 9.23% 9.52%
SIB 2.82% 2.80% IDFC 3.78% 3.68%

LilladherPrabhudas Margin trends – Large private banks expand margins
Source: Company Data, PL Research
Margin trend for banks
Source: Bloomberg, PL Research
While base rate has remained stable for most banks except AXSB
Source: Bloomberg, PL Research
Most banks have cut deposit rates, mostly at the shorter end…
1/2/2015 22
Cut in peak deposit rate 0-3M 3-9M 9-15M 15-36M >36M
HDFC Bank -0.50% -0.50% -0.25% 0.00% 0.00%
Axis Bank 0.00% 0.00% -0.10% 0.25% 0.25%
ICICI bank 0.00% 0.00% -0.25% -0.25% 0.00%
IndusInd bank 0.50% 1.00% -0.25% -0.25% 0.25%
Yes Bank 0.00% 0.00% 0.00% 0.00% 0.00%
SBI -0.50% 0.00% -0.25% -0.25% -0.25%
Bank of Baroda 0.00% -1.30% -0.35% -0.20% 0.00%
Bank of India -0.25% -0.25% -0.35% -0.15% -0.15%
Punjab National Bank 0.00% 0.00% 0.00% 0.00% -0.25%
Canara Bank -0.50% 0.25% 0.00% 0.00% -0.05%
Union Bank 0.25% 0.00% -0.05% -0.05% -0.45%
Banks 6 month change in base rate
HDFC Bank No change
Axis Bank -0.10%
ICICI bank No change
IndusInd bank No change
Yes Bank No change
SBI No change
Bank of Baroda No change
Bank of India No change
Punjab National Bank No change
Canara Bank No change
Union Bank No change
Margin trend (%) 2Q13 4Q13 2Q14 4Q14 2Q15 YoY chng. (bps)
Private Banks
AXSB IN 3.5% 3.7% 3.8% 3.9% 4.0% 0.5%
HDFCB IN 4.2% 4.5% 4.3% 4.4% 4.5% 0.3%
ICICIBC IN 3.0% 3.3% 3.3% 3.4% 3.4% 0.4%
IIB IN 3.3% 3.7% 3.7% 3.8% 3.6% 0.4%
YES IN 2.9% 3.0% 2.9% 3.0% 3.2% 0.3%
KMB IN 4.7% 4.7% 4.9% 4.9% 5.0% 0.3%
FB IN 3.6% 3.1% 3.3% 3.3% 3.4% -0.2%
JKBK IN 3.5% 3.7% 3.5% 3.7% 3.5% 0.1%
SIB IN 3.1% 3.2% 3.1% 3.0% 2.8% -0.3%
VYSB IN 3.5% 3.7% 3.5% 3.7% 3.5% 0.1%
SOE Banks
BOB IN 2.7% 2.5% 2.3% 2.3% 2.4% -0.3%
BOI IN 2.4% 2.5% 2.4% 2.3% 2.4% -0.1%
CBK IN 2.4% 2.4% 2.2% 2.3% 2.2% -0.1%
PNB IN 3.5% 3.5% 3.5% 3.2% 3.2% -0.3%
SBIN IN 3.3% 3.3% 3.2% 3.2% 3.1% -0.2%
UNBK IN 3.0% 2.9% 2.5% 2.6% 2.5% -0.5%

LilladherPrabhudas Fees – Slowdown everywhere, we expect a gradual
recovery
• Fee income remains tepid: Private banks have reported substantial moderation in fee income as corporate loan growth remains tepid. PSU banks on other hand have been lower impacted due to their lower dependence on off-balance sheet and corporate loan growth linked fee income.
• FX/ business banking/ Retail fees holding up: Large corporate/ non-fund based fee income remains weak while 3rd party distribution and capital market fee has shown improvement.
• We expect fee income trends to improve gradually over FY16-17E and estimate 12%-15% growth over next year.
Source: Company Data, PL Research
Source: Company Data, PL Research
Fee growth remains subdued for Pvt banks but picks up for PSBs
Core fee income growth display mixed trends among banks
Source: Company Data, PL Research
PSUs – typical fee income distribution
1/2/2015 23
-5.0%
0.0%
5.0%
10.0%
15.0%
20.0%
25.0%
30.0%
35.0%
3Q
11
4Q
11
1Q
12
2Q
12
3Q
12
4Q
12
1Q
13
2Q
13
3Q
13
4Q
13
1Q
14
2Q
14
3Q
14
4Q
14
1Q
15
2Q
15
Pvt Banks PSU Banks
Core fee gr (%) 1Q14 2Q14 3Q14 4Q14 1Q15 2Q15
Axis 14.2% 6.6% 3.6% 10.0% 4.6% 30.0%
HDFCB 9.6% 28.4% 15.0% 12.0% 2.0% -5.3%
ICICIBC 8.9% 16.7% 12.8% 11.2% 8.0% 5.5%
IIB 30.7% 31.5% 29.6% 28.1% 38.4% 30.8%
Kotak 39.6% 11.6% 6.1% 19.0% 37.6% 51.4%
Yes 68.7% 41.8% 1.5% 19.4% 12.3% 37.0%
SBI -3.9% -0.2% 20.5% 17.6% 11.2% 29.4%
BOB 21.2% 26.8% 22.5% 10.5% 6.4% -29.1%
PNB -3.4% 13.8% 10.4% 17.9% 1.5% 5.0%

LilladherPrabhudas Regulations: RBI maintains its accommodative stance
• BASEL III Implementation : No impact for private banks but some PSU banks stretched – Recent 1 yr extension given to comply with capital conservation buffer will aid to lower capital raising need in FY15-16 for some PSU banks by 40-45% - This is a welcome relief considering current PSU bank valuations.
• Pension standardization norms: Near-term pain likely to continue for PSU banks but increase in provisioning in the last 2-3 years provides comfort on long-term shortfalls – Most banks except for BOI have moved on to new mortality table. Given that regulator seems more accommodative, PSU banks may be given time to comply with pension standardization norms. As per our analysis, SBI/PNB/Union is better provided on Pension. BOB is catching up but BOI’s pension provisioning remains the weakest.
• Dynamic provisions: Certain to be implemented but RBI to wait till the tide turns; Private banks to be little impacted.
• Re-financing of Infra loans: Apart from allowing a 2 yr COD push + one time restructuring, RBI has allowed re-financing of Infra loans with a longer moratorium even for the existing loans which are standard in the books at the time of reschedulement. While this is likely to reduce slippages in the near term we believe, forbearances given to Infra loans now is very high.
• 180 to 90 day NPA recognition for NBFCs: RBI stepped up the standard provisioning and reduced the NPA recognition timeline for NBFCs to 90 days from 180 days period currently. However ample time given to comply with the fresh norms will ensure that no disruption occurs.
• NBFC NCD regulations + Removal of Gold lending restrictions: Cap on retail NCD issuance will impact gold NBFCs to some extent but removal of LTV restrictions indicate regulator’s comfort on the asset class.
• Relaxation on Liquidity Coverage Ratio: RBI allowed banks to include a higher share (7% of NDTL, up from 2% earlier) of their SLR portfolio as part of HQLA which would help most banks to comfortably meet their near-term LCR requirement of 60%.
1/2/2015 24

LilladherPrabhudas Capital: Basel III concerns only on some PSU banks !
1/2/2015 25
Source: Company Data, PL Research
PSU banks – Better and Worst placed
Source: Company Data, PL Research
RBI’s BASEL – III requirements

LilladherPrabhudas Capital: Extension of timelines but time will start
running out if growth demand picks up
1/2/2015 26

LilladherPrabhudas Pension Standardization – Near-term impact
1/2/2015 27

LilladherPrabhudas Pensions standardization - Long-term impact
1/2/2015 28

LilladherPrabhudas Credit cycle : Macros disappointing v/s last cycle; pace
of recovery also looks modest
1/2/2015 29
Real GDP IIP WPI CPI
Global
GDP
Repo/
Rev. Repo SBI PLR
PSU Gross
NPAs
PSU Net
NPAs
PSU
Restrcuture
d book
Total
stresses
Assets
PSU Gross
Slippages
PSU Net
Slippages
1997 8.0% 6.1% 2.1% 7.3% 4.1% 15.0% 17.8% 9.2% 17.8%
1998 4.3% 6.6% 2.9% 13.2% 2.6% 14.0% 16.0% 8.2% 16.0%
1999 6.7% 4.1% 4.4% 4.8% 3.6% 13.0% 15.9% 8.1% 15.9%
2000 7.6% 6.6% 2.7% 4.0% 4.8% 9.1% 12.5% 14.0% 7.4% 14.0% 3.76%
2001 4.3% 4.9% 3.3% 3.8% 2.4% 9.0% 11.5% 12.4% 6.7% 12.4% 3.74%
2002 5.5% 2.8% 1.8% 4.3% 2.9% 8.0% 11.5% 11.1% 5.8% 11.1% 3.29% 1.27%
2003 4.0% 5.8% 2.6% 3.8% 3.7% 7.0% 10.8% 9.4% 4.5% 9.4% 2.95% 1.24%
2004 8.1% 7.0% 5.7% 3.8% 4.9% 6.0% 10.3% 7.8% 3.0% 7.8% 2.93% 1.34%
2005 7.0% 11.7% 6.3% 4.3% 4.6% 6.0% 10.3% 5.5% 2.0% 5.5% 2.08% 0.61%
2006 9.5% 8.6% 2.4% 5.8% 5.3% 6.5% 10.8% 3.6% 1.3% 3.6% 1.66% 0.37%
2007 9.6% 12.9% 5.7% 6.4% 5.4% 7.5% 12.3% 2.7% 1.1% 2.7% 1.51% 0.60%
2008 9.3% 15.5% 4.8% 8.3% 2.8% 7.8% 12.3% 2.2% 1.0% 1.3% 3.6% 1.47% 0.76%
2009 6.7% 2.5% 6.2% 10.8% -0.6% 5.0% 12.3% 2.0% 0.9% 3.0% 5.0% 1.53% 0.74%
2010 8.4% 5.3% 2.2% 12.1% 5.1% 5.0% 11.8% 2.2% 1.1% 4.8% 7.0% 1.79% 1.09%
2011 8.4% 8.2% 5.7% 8.9% 4.0% 6.8% 13.0% 2.2% 1.1% 4.4% 6.6% 1.91% 1.17%
2012 6.5% 6.4% 9.2% 9.3% 3.0% 8.5% 14.8% 2.9% 1.5% 6.2% 9.1% 2.52% 1.68%
2013 5.1% 1.1% 7.4% 10.9% 2.2% 7.5% 14.3% 3.6% 2.3% 7.7% 11.3% 3.00% 1.90%
2014 4.7% 0.0% 5.6% 7.5% 2.4% 8.0% 14.8% 4.4% 2.8% 7.7% 12.1% 3.20% 2.03%
2015E 5.7% 1.5% 1.5% 4.5% 2.8% 7.0% 13.8% 4.9% 2.9% 8.0% 12.9%
Source: Bloomberg, RBI, Company Data, PL Research
LilladherPrabhudas Credit cycle – P&L support factors limited v/s last cycle
Source: RBI, PL Research
Source: Company Data , PL Research
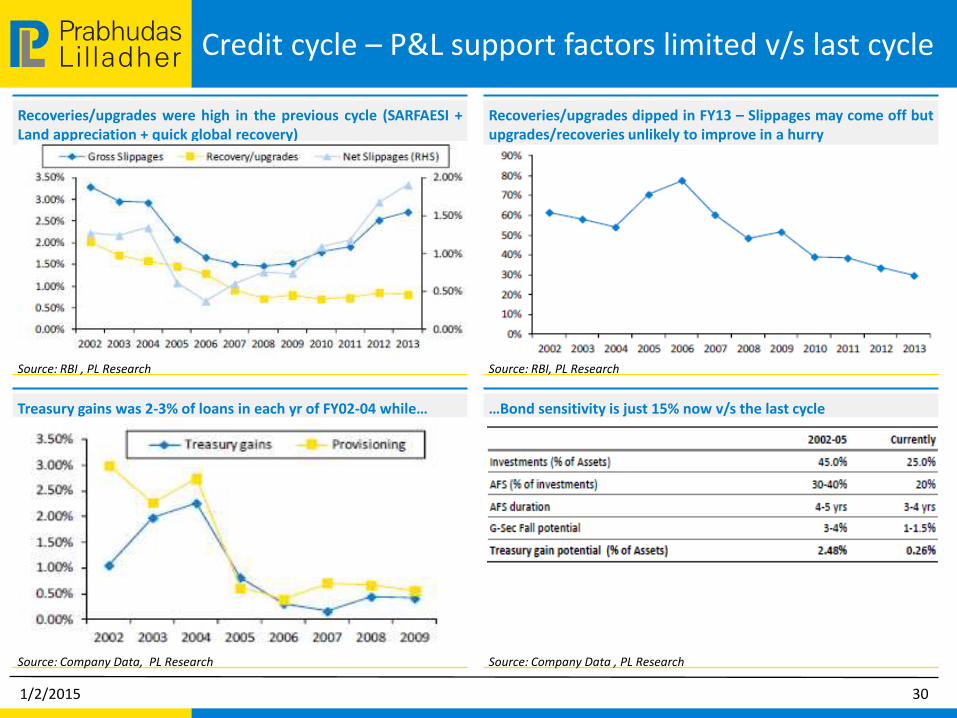
Recoveries/upgrades dipped in FY13 – Slippages may come off but upgrades/recoveries unlikely to improve in a hurry
…Bond sensitivity is just 15% now v/s the last cycle
Source: Company Data, PL Research
Treasury gains was 2-3% of loans in each yr of FY02-04 while…
Source: RBI , PL Research
Recoveries/upgrades were high in the previous cycle (SARFAESI + Land appreciation + quick global recovery)
1/2/2015 30
LilladherPrabhudas Asset quality – how has the slippage / credit cost trend
varied in previous recovery?
Source: Company Data, PL Research
Fresh slippage trend across economic cycles
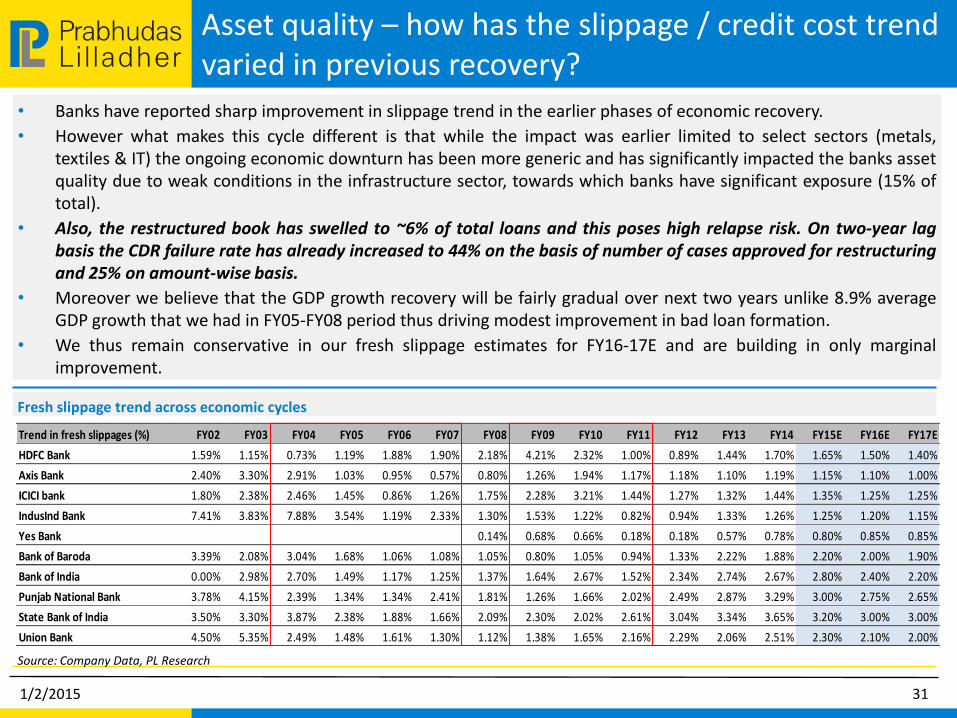
• Banks have reported sharp improvement in slippage trend in the earlier phases of economic recovery.
• However what makes this cycle different is that while the impact was earlier limited to select sectors (metals, textiles & IT) the ongoing economic downturn has been more generic and has significantly impacted the banks asset quality due to weak conditions in the infrastructure sector, towards which banks have significant exposure (15% of total).
• Also, the restructured book has swelled to ~6% of total loans and this poses high relapse risk. On two-year lag basis the CDR failure rate has already increased to 44% on the basis of number of cases approved for restructuring and 25% on amount-wise basis.
• Moreover we believe that the GDP growth recovery will be fairly gradual over next two years unlike 8.9% average GDP growth that we had in FY05-FY08 period thus driving modest improvement in bad loan formation.
• We thus remain conservative in our fresh slippage estimates for FY16-17E and are building in only marginal improvement.
1/2/2015 31
Trend in fresh slippages (%) FY02 FY03 FY04 FY05 FY06 FY07 FY08 FY09 FY10 FY11 FY12 FY13 FY14 FY15E FY16E FY17E
HDFC Bank 1.59% 1.15% 0.73% 1.19% 1.88% 1.90% 2.18% 4.21% 2.32% 1.00% 0.89% 1.44% 1.70% 1.65% 1.50% 1.40%
Axis Bank 2.40% 3.30% 2.91% 1.03% 0.95% 0.57% 0.80% 1.26% 1.94% 1.17% 1.18% 1.10% 1.19% 1.15% 1.10% 1.00%
ICICI bank 1.80% 2.38% 2.46% 1.45% 0.86% 1.26% 1.75% 2.28% 3.21% 1.44% 1.27% 1.32% 1.44% 1.35% 1.25% 1.25%
IndusInd Bank 7.41% 3.83% 7.88% 3.54% 1.19% 2.33% 1.30% 1.53% 1.22% 0.82% 0.94% 1.33% 1.26% 1.25% 1.20% 1.15%
Yes Bank 0.14% 0.68% 0.66% 0.18% 0.18% 0.57% 0.78% 0.80% 0.85% 0.85%
Bank of Baroda 3.39% 2.08% 3.04% 1.68% 1.06% 1.08% 1.05% 0.80% 1.05% 0.94% 1.33% 2.22% 1.88% 2.20% 2.00% 1.90%
Bank of India 0.00% 2.98% 2.70% 1.49% 1.17% 1.25% 1.37% 1.64% 2.67% 1.52% 2.34% 2.74% 2.67% 2.80% 2.40% 2.20%
Punjab National Bank 3.78% 4.15% 2.39% 1.34% 1.34% 2.41% 1.81% 1.26% 1.66% 2.02% 2.49% 2.87% 3.29% 3.00% 2.75% 2.65%
State Bank of India 3.50% 3.30% 3.87% 2.38% 1.88% 1.66% 2.09% 2.30% 2.02% 2.61% 3.04% 3.34% 3.65% 3.20% 3.00% 3.00%
Union Bank 4.50% 5.35% 2.49% 1.48% 1.61% 1.30% 1.12% 1.38% 1.65% 2.16% 2.29% 2.06% 2.51% 2.30% 2.10% 2.00%

LilladherPrabhudas Asset quality – how has the slippage /credit cost trend
varied in previous recovery ?
Source: Company Data, PL Research
Stressed assets and restructuring pipeline
Source: Company Data, PL Research
Credit cost estimates and trend – we estimate modest improvement in credit cost for FY16/FY17E
1/2/2015 32
Banks Gross NPLs Net NPLs Std. restr. loans, Rs mn As % of o/s loans Net NPLs (%) Net stressed assets (%) Asset quality guidances
Private banks
AXSB 36,131 11,798 66,750 2.76 0.44 3.20 Guidance maintained at Rs65bn of fresh s tressed assets accretion
HDFCB 33,617 9,173 4,582 0.14 0.28 0.42 NA
ICICIBC 115,467 39,423 110,200 3.05 1.09 4.14 Stressed asset formation to be lower than FY15 excl . s l ippages from RA
KMB IN 11,654 6,809 1,615 0.26 0.84 1.10 Smal l restructuring in H2 FY15; asset qual i ty to remain s table
FB IN 10,311 3,185 29,000 5.98 0.66 6.64 Some fa l lout from restructuring can be there but keeping close monitor
SIB IN 5,532 3,184 17,480 4.94 0.90 5.84 NA
JKBK IN 21,869 11,085 12,693 2.73 2.46 5.19 1 NPA a/c could be upgraded; Flood restructuring package being implemented
SOE Banks
BOB IN 130,576 67,045 224,170 5.81 1.74 7.55 Sl ippages not to witness spikes above normal levels
BOI IN 141,260 90,047 117,380 3.03 2.29 5.32 Targeting GNPA of 3.15% & NNPAs of 2.0% from 3.6% & 2.3% currently
PNB IN 207,519 116,178 367,930 10.30 3.26 13.56 Rs10-12 bn of restructuring pipel ine in H2FY15
SBIN IN 607,124 329,972 439,620 3.44 2.73 6.17 Agri NPAs to trickle down gradual ly, Mid-corporate s tress has reduced
UNBK IN 109,825 62,717 126,030 5.06 2.71 7.77 Rs12-15 bn of restructuring pipel ine in H2FY15
Credit cost trend (%) FY01 FY02 FY03 FY04 FY05 FY06 FY07 FY08 FY09 FY10 FY11 FY12 FY13 FY14 FY15E FY16E FY17E
HDFC Bank 1.32% 1.50% 0.95% 1.21% 0.81% 1.58% 1.69% 1.86% 1.98% 1.73% 0.53% 0.61% 0.57% 0.60% 0.60% 0.60% 0.60%
Axis Bank 0.47% 3.75% 1.44% 2.94% 0.13% 0.67% 0.25% 0.71% 1.13% 1.46% 0.77% 0.55% 0.64% 0.61% 0.70% 0.70% 0.65%
ICICI bank 1.19% 1.01% 2.63% 0.67% 0.19% 0.67% 0.84% 1.21% 1.70% 2.18% 0.99% 0.42% 0.51% 0.90% 0.90% 0.85% 0.85%
IndusInd Bank 2.78% 3.29% 4.21% 2.54% 0.81% 0.99% 0.55% 0.51% 0.88% 0.72% 0.69% 0.47% 0.55% 0.63% 0.65% 0.65% 0.65%
Yes Bank 0.03% 0.38% 0.51% 0.13% 0.03% 0.34% 0.26% 0.65% 0.65% 0.60%
Bank of Baroda 2.94% 2.50% 2.74% 2.97% 1.62% 0.59% 0.59% 0.82% 0.34% 0.60% 0.52% 0.61% 1.00% 0.81% 0.75% 0.70% 0.70%
Bank of India 0.00% 0.00% 0.00% 0.00% 0.00% 0.00% 0.00% 0.00% 0.00% 1.13% 0.55% 0.88% 1.38% 1.20% 1.00% 0.90% 0.90%
Punjab National Bank 1.29% 2.07% 2.23% 2.73% 0.31% 0.45% 0.70% 0.35% 0.60% 0.59% 0.93% 0.90% 1.11% 1.37% 1.30% 1.20% 1.15%
State Bank of India 1.35% 1.84% 2.01% 2.50% 0.67% 0.06% 0.48% 0.53% 0.52% 0.79% 1.27% 1.42% 1.11% 1.28% 1.18% 1.10% 1.05%
Union Bank 3.27% 2.36% 0.63% 0.33% 0.57% 0.69% 0.64% 0.65% 0.84% 0.92% 0.81% 0.96% 0.85% 0.80% 0.78%

LilladherPrabhudas PSBs in FY14 resorted to higher NPA sale to ARCs
• PSBs in FY14 resorted to heavy sale of NPAs to Asset Reconstruction Companies (ARCs) especially in the H2FY14 period.
• BOI/SBI/Canara/CBI have been the highest sellers of NPAs.
• BOI/SBI have received 50-60% consideration on assets sold, implying haircut of 40% on book value
• In H1FY15, PSBs had lower sale of NPAs v/s FY14 despite selling off two large accounts and was due to RBI’s change in norms for ARCs on participation and capital infusion to buyout assets. BOI continued to sell NPAs, while ICICI bank saw high NPA sale in H1.
1/2/2015 33
Source: Banks, Media Reports, PL Research
NPA sale of Banks to ARCs
% of
GNPAs
% of
Loans
Consideration
as per FY14 AR
2Q14 3Q14 4Q14 FY14 FY14 FY14 FY14 1Q15 2Q15 1H15
Yes Bank 1,300 600 120 2,020 115% 0.4% 1,953 - - -
I IB 250 240 350 840 14% 0.2% 1,002 500 - 500
ICICI - - - - 0% 0.0% 1,776 - 2,910 2,910
Federa l 1,860 1,580 3,440 32% 0.8% 3,081 1,400 - 1,400
BOI 3,130 17,440 23,430 44,000 37% 1.2% 26,286 17,640 1,060 18,700
Al lahabad bank 7,300 3,890 - 11,190 14% 0.8% 5,650 - - -
Indian Bank 10,610 - 10,610 23% 0.9% 9,409 - - -
SBI - - 32,500 32,500 5% 0.3% 16,049 5,566 - 5,566
UCO 9,250 9,250 14% 0.6% 10,463 - - -
IOB 9,830 9,830 11% 0.6% 10,151 - - -
UBI 3,250 3,250 5% 0.5% - - - -
BOM - 0% 0.0% 2,576 - - -
Syndicate - 0% 0.0% - - - -
OBC - - 5,300 5,300 9% 0.4% 3,952 1,600 - 1,600
Canara 14,000 14,000 18% 0.5% 11,664 - - -
Union - - 3,250 3,250 3% 0.1% 2,155 4,500 - 4,500
BOB - - 6,500 6,500 5% 0.2% 5,222 - - -
PNB - - - - 0% 0.0% - - 740 740
Dhanalaxmi Bank 1,000 1,000 NA NA
Centra l Bank of India 12,280 12,280 11% 0.7% 15,328
Total Estimated Sold 11,980 34,640 122,640 169,260 9% 0.4% 126,718 31,206 4,710 35,916
(Rs m) As Reported As Reported

LilladherPrabhudas Credit cycle : Corporate leverage at higher levels
Source: ACE Equity, PL Research
Source: ACE Equity, PL Research
Operating margins also at similar levels
This cycle – Issues more spread out among sectors
Source: ACE Equity, PL Research
Last cycle – Stress was commodity linked
Source: ACE Equity, PL Research
Interest coverage dipping to levels seen in 99-03 cycle
1/2/2015 34
0.0
1.0
2.0
3.0
4.0
5.0
6.0
7.0
8.0
19
96
19
97
19
98
19
99
20
00
20
01
20
02
20
03
20
04
20
05
20
06
20
07
20
08
20
09
20
10
20
11
20
12
20
13
Standalone Consolidated
14.0%
16.0%
18.0%
20.0%
22.0%
24.0%
26.0%
19
97
19
98
19
99
20
00
20
01
20
02
20
03
20
04
20
05
20
06
20
07
20
08
20
09
20
10
20
11
20
12
20
13
OPM Standalone OPM Consolidated
Iron & Steel
26%
Textiles3%
Cement +
Materials
5%Engin.+ Constr.
4%
Autos- CVs2%
Breweries1%
Constr.-RE
0%
Others
59%
Iron & Steel
6% Textiles2%
Shipping1%
Power11%
Engin.+Constr.
16%
Constr. - Real Estate
4%Airlines1%
Hotels 1%
Others
58%
LilladherPrabhudas Credit cycle: Large deleveraging was witnessed in FY14
1/2/2015 35

LilladherPrabhudas Credit cycle: Early signs of stabilization visible
Source: : ACE Equity, PL Research
Source: Ace Equity, PL Research
..so has been the case in mid and small cap ICs
EBITDA margins have also remained stable on lower pricing power
Source: Ace Equity, PL Research
Interest expense to sales for companies has been moving up
Source: : ACE Equity, PL Research
Large cap Interest Coverage (ICs) has been stable for some period now
1/2/2015 36
2.0
3.0
4.0
5.0
6.0
7.0
8.0
Mar
-05
Sep
-05
Mar
-06
Se
p-0
6
Ma
r-0
7
Sep
-07
Mar
-08
Sep
-08
Mar
-09
Sep
-09
Mar
-10
Sep
-10
Mar
-11
Se
p-1
1
Ma
r-1
2
Se
p-1
2
Mar
-13
Sep
-13
Mar
-14
Sep
-14
0.00
1.00
2.00
3.00
4.00
5.00
6.00
Mar
-05
Se
p-0
5
Mar
-06
Sep
-06
Mar
-07
Sep
-07
Mar
-08
Sep
-08
Mar
-09
Se
p-0
9
Mar
-10
Sep
-10
Mar
-11
Sep
-11
Mar
-12
Sep
-12
Mar
-13
Se
p-1
3
Mar
-14
Sep
-14
Mid Caps Small Caps
1.00%
1.50%
2.00%
2.50%
3.00%
3.50%
4.00%
4Q
06
2Q
07
4Q
07
2Q
08
4Q
08
2Q
09
4Q
09
2Q
10
4Q
10
2Q
11
4Q
11
2Q
12
4Q
12
2Q
13
4Q
13
2Q
14
4Q
14
2Q
15
Interest to Sales
10.00%
12.00%
14.00%
16.00%
18.00%
20.00%
4Q
06
2Q
07
4Q
07
2Q
08
4Q
08
2Q
09
4Q
09
2Q
10
4Q
10
2Q
11
4Q
11
2Q
12
4Q
12
2Q
13
4Q
13
2Q
14
4Q
14
2Q
15
EBITDA margins

LilladherPrabhudas Sector-wise Interest Coverage trends –
Airlines/Hotels/Shipbuilding/Construction stressed
1/2/2015 37
Avg. 05-
14
Avg. 07-
14
08-09
lows FY13 FY14 1H14 1H15
M -0.32 -0.96 -1.27 -1.35 -1.65 -0.58 -3.72
M 4.96 4.00 3.36 2.60 2.76 2.34 2.91
S 2.96 2.49 1.56 2.22 1.28 1.64 1.00
L 14.59 13.15 15.01 11.98 5.90 9.25 2.22
M 5.12 5.16 8.01 2.49 1.72 1.24 2.58
S 3.23 2.94 3.89 3.51 0.83 0.60 1.61
L 4.14 3.45 2.34 2.20 1.99 1.98 2.02
M 8.84 6.86 4.28 2.22 1.90 1.81 2.10
S 3.86 3.31 2.87 1.56 0.95 1.12 0.92
L 79.29 83.32 179.64 27.14 11.97 14.54 5.81
M 4.52 3.39 3.93 1.41 0.79 0.92 1.70
S 2.16 1.91 0.83 0.57 -0.32 1.03 0.38
L 5.12 4.86 4.17 3.95 3.10 3.26 2.63
M 5.38 5.34 6.90 1.63 3.03 2.22 2.79
S 4.24 4.11 5.12 0.02 0.73 1.13 0.54
M 4.50 8.78 16.87 -1.05 0.18 -0.16 1.50
S 1.99 1.58 2.83 1.07 0.21 0.85 1.21
M 4.34 3.41 4.37 1.45 0.69 1.03 0.18
S 2.16 1.78 2.89 -0.20 -0.46 -0.51 -2.57
Shipping
Shipbuilding
Mining & Mineral
Airlines
Auto Ancillary
Cement
Real Estate
Power
Avg. 05-
14
Avg. 07-
14
08-09
lows FY13 FY14 1H14 1H15
M 17.20 9.38 11.48 1.79 2.88 1.80 1.16
S 2.42 1.61 1.77 0.83 -0.30 -0.05 -1.07
L 3.73 3.73 3.92 2.08 1.07 1.24 1.71
M 4.21 4.04 3.81 2.17 1.60 1.40 0.98
S 1.91 1.67 1.90 0.69 0.12 0.15 -0.15
M 4.77 1.76 2.24 1.27 -0.37 -0.37 0.06
S 1.09 0.67 1.14 0.80 0.29 -0.23 -0.17
M 4.63 3.87 2.43 3.32 6.53 6.31 4.03
S 1.15 0.96 0.13 1.19 1.33 1.57 0.42
M 3.68 3.21 2.75 1.85 2.02 1.66 1.57
S 2.68 2.47 2.64 1.12 0.74 0.79 0.43
L 4.45 3.64 3.98 3.25 3.61 1.37 0.88
M 5.69 4.97 10.28 0.39 0.53 0.34 0.07
S 3.77 3.10 3.30 1.51 1.30 0.60 0.57
L 5.81 5.03 6.34 2.94 3.86 2.34 2.95
M 2.67 2.24 2.89 1.16 1.04 1.24 0.55
S 2.20 2.10 2.73 1.14 0.47 0.77 0.13
L 8.79 8.06 12.26 5.33 4.62 4.48 4.27
M 3.02 2.72 4.80 1.55 1.41 1.38 1.31
S 1.75 1.67 2.58 1.07 0.69 0.80 0.51
Industrial Equipment
Iron & Steel
Sugar
Textile - Spinning
Transmission towers
Hotels
Total
Construction/Infra conglomerates

LilladherPrabhudas CDR referrals have declined but approval rate going up
• CDR referrals have declined in past few quarters from peak of Rs453bn in Jun-Sep 2013 to Rs133bn in the Jun-Sep 2014 quarter.
• However approval rate has been trending higher and has increased to 82% on amount-wise basis and 79% on basis of number of cases approved.
• The average amount per successful referral remains lumpy indicating the continued stress faced by the mid-corporate and SME segment though number of such referrals have declined over past one year.
Source: CDR cell, PL research
Source: CDR cell, PL research
CDR referrals have declined in past two quarters – amount wise
…and by amount approved
Source: CDR cell, PL research
However approval rate has trended higher – both by no. of cases
1/2/2015 38
Rs bn Cases referred Amount Cases approved Amount Avg. amount per case
Jul -Sep 2012 33 189 18 189 11
Oct-Dec 2012 25 210 35 246 7
Jan-Mar 2013 30 311 39 170 4
Apri l -Jun 2013 27 394 14 213 15
Jun-Sep 2013 31 249 16 220 14
Sep-Dec 2013 25 453 12 170 14
Dec-Mar 2014 17 223 33 411 12
Mar-Jun 2014 2 29 10 181 18
Jun-Sep 2014 14 133 19 191 10
64%
66%
68%
70%
72%
74%
76%
78%
80%
82%
Ma
r‐1
1
Jun‐
11
Sep‐
11
Dec
‐11
Ma
r‐1
2
Jun‐
12
Sep
-12
Dec
‐12
Ma
r-1
3
Jun
-13
Sep
-13
Dec
-13
Ma
r-1
4
Jun
-14
Sep
-14
By number of cases (%)
60%
65%
70%
75%
80%
85%
Ma
r‐1
1
Jun‐
11
Sep‐
11
Dec
‐11
Ma
r‐1
2
Jun‐
12
Sep
-12
Dec
‐12
Ma
r-1
3
Jun
-13
Sep
-13
Dec
-13
Ma
r-1
4
Jun
-14
Sep
-14
By amount approved (%)

LilladherPrabhudas Is CDR success rate deteriorating?
Source: CDR Cell, PL Research
Source: CDR Cell, PL research
• The efficacy of CDR led restructuring has declined as the failure rate continues to increase. The CDR failure rate has increased to 29% on the basis of number of cases and 13% on amount-wise basis. This makes CDR restructuring only slightly better than the bilateral restructuring carried by banks where the failure rate has been typically ~20%.
• Nearly ~50% of total restructuring via CDR route has happened in past two years. We believe that as more number of cases comes out of moratorium over next six months the failure rate would trend higher.
• On two-year lag basis the CDR failure rate has increased to 44% on the basis of number of cases and 25% on amount-wise basis.
• Infrastructure, Iron & Steel and textiles account for ~60% of total restructuring
• The growth rate in CDR led restructuring has been the highest for sectors like textiles, pharmaceuticals and engineering besides infrastructure while sectors like petrochemicals, sugar and cement have shown reduction in the total outstanding restructured amount.
CDR failure rate –increasing by both amt approved and no. of cases
Composition of CDR restructuring: Infra & Metals a/c for >50%
1/2/2015 39
0%
2%
4%
6%
8%
10%
12%
14%
21%
22%
23%
24%
25%
26%
27%
28%
29%
Sep-13 Dec-13 Mar-14 Jun-14 Sep-14
By number of cases (%) By amount approved (%) (RHS)
Infrastructure
36%
Iron & Steel
16%
Textiles
9%
Construction6%
Ship Building / Ship-Breaking
4%
Engineering
4%
Pharmaceuticals
4%
Others20%

LilladherPrabhudas Restructuring Monitor – most restructured accounts continue
to remain under stress based on interest coverage ratio
1/2/2015 40
Source: Media Reports, ACE Equity, PL Research

LilladherPrabhudas Restructuring Monitor – most restructured accounts continue
to remain under stress based on interest coverage ratio
1/2/2015 41
Source: Media Reports, ACE Equity, PL Research

LilladherPrabhudas Restructuring Monitor – most restructured accounts continue to
remain under stress based on interest coverage ratio
1/2/2015 42
Source: Media Reports, ACE Equity, PL Research

LilladherPrabhudas Sensitivity - Earnings and Price Target sensitivity to
change in loan growth, credit cost and risk-free rate
• We have analyzed the earnings and PT sensitivity for major banks to changes in loan growth, credit cost, fresh slippages and reduction in risk-free rate.
• We note that this is not a blue sky scenario but a possible outcome if the macro scenario were to improve at a rate, slightly better than expected.
• We have built in three cases for earnings and PT sensitivity –
– Case I: 2% higher loan growth and 10bp lower credit cost
– Case II: Case I + 25bp decline in fresh slippages
– Case III: Case II + 50bp decline in risk-free rate Source: PL Research
Case 1: Our EPS and PT increases by ~4%/3% respectively in case-I
Source: PL Research
Base case estimates and PT
1/2/2015 43
Name of bank
Case I: 2% higher loan growth, 10bp lower credit cost
EPS change (%) ABV PT change (%)
FY16E FY17E FY16E FY17E Sep-FY16E
Axis 3% 3% 210.1 249.2 2.3%
HDFC 3% 4% 273.8 324.2 2.8%
ICICI 3% 3% 125.6 143.5 1.8%
IndusInd 3% 5% 227.5 279.1 3.0%
Yes 3% 4% 323.4 383.8 3.4%
Bank of baroda 5% 5% 843.8 983.5 3.1%
Bank of india 7% 6% 361.0 437.0 0.3%
Punjab National Bank 5% 6% 68.8 204.6 3.0%
State bank of india 6% 6% 132.0 153.0 2.8%
Union bank 6% 7% 238.5 291.5 1.9%
Name of bank EPS ABV PT - original P/ABV multiple - original P/E multiple - original
FY16E FY17E FY16E FY17E Sep-FY16E Sep-FY16E Sep-FY16E
Axis 37.7 45.9 210.2 248.6 545.0 2.4 13.0
HDFC 51.7 63.9 273.5 322.1 1,090.0 3.7 18.9
ICICI 23.4 27.9 125.7 143.4 390.0 2.4 12.8
IndusInd 44.5 58.8 227.5 277.3 855.0 3.4 16.6
Yes 58.5 71.4 323.1 379.1 815.0 2.3 12.6
Bank of Baroda 138.7 174.6 847.2 989.1 1,175.0 1.3 7.5
Bank of India 67.6 89.1 363.0 441.0 350.0 0.8 4.3
Punjab National Bank 29.8 35.3 169.2 205.1 208.0 1.1 6.4
State bank of India 22.3 27.7 132.0 154.0 350.0 1.9 10.7
Union bank 48.7 60.6 239.5 292.9 255.0 0.9 4.5

LilladherPrabhudas Sensitivity - Earnings and Price Target sensitivity to
change in slippages and risk free rate
Source: PL Research
Source: PL Research
• Under Case I our earnings estimate increases by ~4% on average while the increase in our PT remains at ~3%.
• If we are to build additional 25bp decline in fresh slippages over and above Case I (in previous recovery phases the pace of decline fresh slippages has been particularly sharp) than our EPS estimate increases by ~5% on average while our PT increase by 6% over our base case estimate.
• If we are to further build an additional 50bp decline in risk free rate, as we expect 10yr bond yield to decline to 7.5% over next three quarters, than our PT increase to ~14% over our base case estimate.
Case 2: Case I + 25bp decline in fresh slippages
Case 3: Case 2 + 50bp decline in risk-free rate
1/2/2015 44
Name of bank
Case 2: Case I + 25bp decline in fresh slippages
EPS change (%) ABV change (%) PT change (%)
FY16E FY17E FY16E FY17E Sep-FY16E
Axis 3% 3% 1% 2% 4.3%
HDFC 3% 4% 2% 2% 3.7%
ICICI 3% 3% 1% 3% 3.5%
IndusInd 3% 5% 2% 2% 4.9%
Yes 3% 4% 1% 1% 4.0%
Bank of baroda 5% 5% 3% 4% 7.9%
Bank of india 7% 6% 4% 5% 7.0%
Punjab National Bank 5% 6% 3% 5% 8.5%
State bank of india 6% 6% 4% 5% 7.0%
Union bank 6% 7% 4% 6% 7.8%
Name of bank
Case 3: Case 2 + 50bp decline in risk-free rate
PT P/ABV multiple P/E
multiple PT - original
Cumulative PT change
(%) Sep-FY16E Sep-FY16E Sep-FY16E Sep-FY16E
Axis 613.1 2.5 13.3 545.0 12.5% HDFC 1,225.3 4.0 19.7 1,090.0 12.4% ICICI 429.0 2.6 13.1 390.0 10.0% IndusInd 971.3 3.5 16.1 855.0 13.6% Yes 910.6 2.5 13.0 815.0 11.7% BOB 1,363.0 1.4 7.9 1,175.0 16.0% BOI 403.0 0.9 4.5 350.0 15.1% PNB 243.5 1.2 6.9 208.0 17.1% SBI 404.2 1.9 10.6 350.0 15.5% Union bank 294.7 1.0 4.8 255.0 15.6%

LilladherPrabhudas Appendix: Fund & Non fund based exposures – Private Banks
remain risk averse but have high Commercial RE exposures
Company Data, PL Research
Non fund based exposures – Private banks equally heavy weight
Company Data, PL Research
Fund Based exposures – Capex heavy industries dominate
1/2/2015 45

LilladherPrabhudas
COMPANIES
1/2/2015 46

LilladherPrabhudas Axis Bank
CMP: Rs503 TP: Rs545 Rating: BUY MCap: Rs1,181.8bn
We estimate AXSB to deliver an earnings CAGR of 21% YoY over FY15-17E led by healthy traction in NII and other income. This will be aided by reduction in fresh delinquency estimates to 1.1% for FY16E (~1.3% currently) on the back of gradual improvement in economic cycle and robust retail franchise which AXSB has build over past two years. Small restructured asset portfolio at 2.5% of total loans, and contained gross NPL ratio of 1.3% (78% coverage ratio) gives us comfort. We increase our PT on AXSB to Rs545 as we increase our FY15E/FY16E earnings by 3%/4% respectively and retain our BUY rating.
Retail franchise improving steadily: AXSB’s retail portfolio has steadily increased to ~40% of total loans and is dominated by secured loans. This has helped the bank in maintaining firm margins ably supported by steady growth in CASA mix at ~44% (~40% on daily average basis). We expect margins to move in a narrow band while management continues to remain conservative in its full year margin guidance at 3.5% (3.93% in H1FY15).
Asset composition remains stable; well placed to benefit from revival in investment cycle: The composition of corporate assets remain healthy as nearly 91% of corporate exposure remains above investment grade. The composition of SMEs with rating between SME1-SME3 also remains stable at 80%. The bank has a healthy Tier-I capital base of 12.6% and is thus well placed to benefit from any revival in investment cycle.
Asset quality has deteriorated but well under control: AXSB has reported 32%/41% rise in GNPL/Net NPLs over past one year however coverage ratio has remained stable at ~67%. AXSB conservatively maintains its Rs65bn of stressed asset guidance in FY15 despite only Rs26bn of stress loan formation in H1FY15. O/s RA portfolio remain stable at 2.5% of total loans. AXSB also maintained its credit cost guidance of 75‐80bps for FY15.
Valuation: We revise our PT to Rs545 based on 2.4x Sep-2016E ABV and reiterate our BUY rating on the stock.
1/2/2015 47
Key Financials (Rs m)
Y/e March FY13 FY14 FY15E FY16E FY17E
Net interest income 96,663 119,516 147,017 174,480 210,996
Growth (%) 20.6 23.6 23.0 18.7 20.9
Operating profit 93,031 114,561 140,135 168,060 205,648
PAT 51,794 62,177 73,109 88,633 107,872
EPS (Rs) 26.5 31.1 37.7 45.9 56.4
Growth (%) 12.8 17.3 21.2 21.7 22.8
Net DPS (Rs) 4.2 4.0 4.4 5.0 5.5
Source: Company Data, PL Research
Profitability & valuation
Y/e March FY13 FY14 FY15E FY16E FY17E
NIM (%) 3.2 3.4 3.6 3.5 3.4
RoAE (%) 18.5 17.4 17.7 18.4 19.1
RoAA (%) 1.7 1.7 1.7 1.7 1.7
P / BV (x) 3.1 2.7 2.3 1.9 1.6
P / ABV (x) 3.2 2.8 2.4 2.0 1.7
PE (x) 19.0 16.2 13.3 11.0 8.9
Net dividend yield (%) 0.8 0.8 0.9 1.0 1.1
Source: Company Data, PL Research
Stock Performance
(%) 1M 6M 12M
Absolute 2.8 31.0 94.6
Relative to Sensex 6.5 23.2 64.5

LilladherPrabhudas Operating Metrics
Source: Company Data, PL Research
Source: Company Data, PL Research
Improved loan mix towards Retail have taken NIMs all time high
Axis RORWAs have been better than ICICIB and catching up with HDFCB
Source: Company Data, PL Research
Non-fund based exposure has moved down and is half of ICICI’s exposure
Source: Company Data, PL Research
Retail & SME have been driving higher share in loan growth
1/2/2015 48
2.00% 2.01% 1.98%2.11%
2.29%2.36% 2.35%
2.28%
1.20%
1.40%
1.60%
1.80%
2.00%
2.20%
2.40%
2.60%
FY10 FY11 FY12 FY13 FY14 FY15E FY16E FY17E
Axis RORWAs ICICI RORWAs HDFCB RORWAs
3.81%
3.44%
3.28%
3.78%
3.75% 3.55%
3.37%
3.46%3.57%
3.70%
3.86%3.79%
3.71%
3.89%
3.88%
3.97%
3.00%
3.20%
3.40%
3.60%
3.80%
4.00%
3Q
11
4Q
11
1Q
12
2Q
12
3Q
12
4Q
12
1Q
13
2Q
13
3Q
13
4Q
13
1Q
14
2Q
14
3Q
14
4Q
14
1Q
15
2Q
15
Reported NIMs
45%
74%88%
35%
55%
26%12%
65%
FY12 FY13 FY14 1H15
Corp Advances share to loan growth Non-Corp Advances share to loan growth
18.5
%
24
.4%
29.9
%
33.3
%
31.8
%
25.5
%
24
.3%
30.4
%
55.1
%
58.0
%
62.1
%
63
.8%
52.2
%
48.0
%
10%
20%
30%
40%
50%
60%
70%
FY08 FY09 FY10 FY11 FY12 FY13 FY14
Axis Non-fund exposure to B/s ICICI Non-fund exposure to B/s
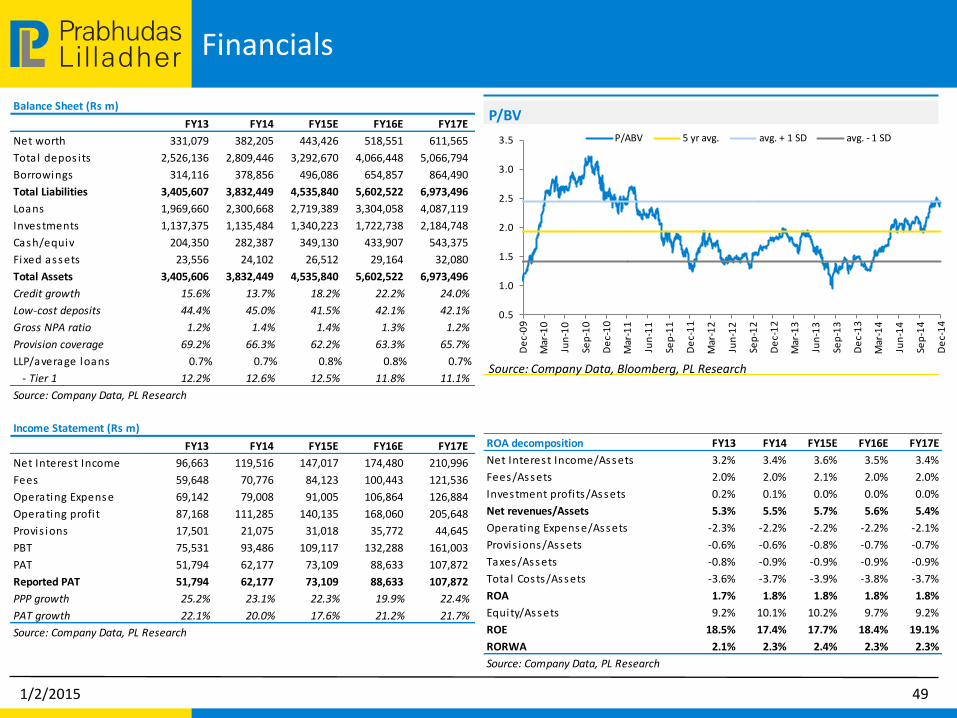
LilladherPrabhudas Financials
Source: Company Data, Bloomberg, PL Research
P/BV
1/2/2015 49
Balance Sheet (Rs m)
FY13 FY14 FY15E FY16E FY17E
Net worth 331,079 382,205 443,426 518,551 611,565
Total depos its 2,526,136 2,809,446 3,292,670 4,066,448 5,066,794
Borrowings 314,116 378,856 496,086 654,857 864,490
Total Liabilities 3,405,607 3,832,449 4,535,840 5,602,522 6,973,496
Loans 1,969,660 2,300,668 2,719,389 3,304,058 4,087,119
Investments 1,137,375 1,135,484 1,340,223 1,722,738 2,184,748
Cash/equiv 204,350 282,387 349,130 433,907 543,375
Fixed assets 23,556 24,102 26,512 29,164 32,080
Total Assets 3,405,606 3,832,449 4,535,840 5,602,522 6,973,496
Credit growth 15.6% 13.7% 18.2% 22.2% 24.0%
Low-cost deposits 44.4% 45.0% 41.5% 42.1% 42.1%
Gross NPA ratio 1.2% 1.4% 1.4% 1.3% 1.2%
Provision coverage 69.2% 66.3% 62.2% 63.3% 65.7%
LLP/average loans 0.7% 0.7% 0.8% 0.8% 0.7%
- Tier 1 12.2% 12.6% 12.5% 11.8% 11.1%
Source: Company Data, PL Research
Income Statement (Rs m)
FY13 FY14 FY15E FY16E FY17E
Net Interest Income 96,663 119,516 147,017 174,480 210,996
Fees 59,648 70,776 84,123 100,443 121,536
Operating Expense 69,142 79,008 91,005 106,864 126,884
Operating profi t 87,168 111,285 140,135 168,060 205,648
Provis ions 17,501 21,075 31,018 35,772 44,645
PBT 75,531 93,486 109,117 132,288 161,003
PAT 51,794 62,177 73,109 88,633 107,872
Reported PAT 51,794 62,177 73,109 88,633 107,872
PPP growth 25.2% 23.1% 22.3% 19.9% 22.4%
PAT growth 22.1% 20.0% 17.6% 21.2% 21.7%
Source: Company Data, PL Research
ROA decomposition FY13 FY14 FY15E FY16E FY17E
Net Interest Income/Assets 3.2% 3.4% 3.6% 3.5% 3.4%
Fees/Assets 2.0% 2.0% 2.1% 2.0% 2.0%
Investment profi ts/Assets 0.2% 0.1% 0.0% 0.0% 0.0%
Net revenues/Assets 5.3% 5.5% 5.7% 5.6% 5.4%
Operating Expense/Assets -2.3% -2.2% -2.2% -2.2% -2.1%
Provis ions/Assets -0.6% -0.6% -0.8% -0.7% -0.7%
Taxes/Assets -0.8% -0.9% -0.9% -0.9% -0.9%
Total Costs/Assets -3.6% -3.7% -3.9% -3.8% -3.7%
ROA 1.7% 1.8% 1.8% 1.8% 1.8%
Equity/Assets 9.2% 10.1% 10.2% 9.7% 9.2%
ROE 18.5% 17.4% 17.7% 18.4% 19.1%
RORWA 2.1% 2.3% 2.4% 2.3% 2.3%
Source: Company Data, PL Research
0.5
1.0
1.5
2.0
2.5
3.0
3.5
De
c-0
9
Mar
-10
Jun
-10
Sep
-10
De
c-1
0
Mar
-11
Jun
-11
Sep
-11
De
c-1
1
Mar
-12
Jun
-12
Sep
-12
De
c-1
2
Mar
-13
Jun
-13
Sep
-13
De
c-1
3
Mar
-14
Jun
-14
Sep
-14
De
c-1
4
P/ABV 5 yr avg. avg. + 1 SD avg. - 1 SD

LilladherPrabhudas HDFC Bank
CMP: Rs952 TP: Rs1,090 Rating: BUY MCap: Rs2,396.0bn
We expect HDFCB's earnings growth to revive to 25% CAGR over FY15-17E as loan growth pick-up while investment made in enhancing the rural / semi-urban network begins to yield results. During Q2FY15 HDFCB added 112 branches (higher ratio in metro & semi‐urban areas) and 4,939 employees to its employee count. HDFCB is well provided (73% coverage ratio), has floating provisions of ~Rs18.5bn and healthy capitalization levels. We find valuations attractive and maintain our BUY rating with a revised PT of Rs1,090, which corresponds to 3.7x Sep-2016E ABV.
Robust NII growth, better fees but higher opex as well: HDFCB continues to deliver at the NII line despite sluggish loan growth led by robust margin trends. NIMs have improved to 4.5% against management guidance of 3.9%-4.3% and we expect it to remain stable as bank benefits from higher share of fixed rate loans in a falling rate environment. The healthy growth in retail loans led by auto and high yielding unsecured loans has also contributed to margin expansion.
Operating expenses picks-up: Opex has picked up as the bank continues to expand its network and added 4,939 employees which was long overdue after such rapid expansion over past two years. Management expects opex growth to moderate even as business prospects improve from new branches. We estimate C/I ratio to moderate to 44% by FY17E.
Loan growth prospects improve: Wholesale book has been growing faster than retail book but the later has now started catching up especially from Auto loans (CV/CE) and unsecured segment. The Bank’s unsecured book growth was healthy on increased spends in cards & personal loans offsetting slowing growth in housing loans. HDFCB indicated healthy loan growth prospects to continue on underlying improvement in product segments sales and as bank has been increasing its footprint.
Valuation: We maintain our BUY rating on HDFC Bank with a PT of Rs1,090, which corresponds to 3.7x Sep-2016E ABV.
1/2/2015 50
Key Financials (Rs m)
Y/e March FY13 FY14 FY15E FY16E FY17E
Net interest income 158,111 184,826 222,371 272,159 331,712
Growth (%) 22.7 16.9 20.3 22.4 21.9
Operating profit 114,276 143,601 165,397 205,650 254,882
PAT 67,263 84,784 95,988 119,505 147,898
EPS (Rs) 28.5 35.5 39.1 47.5 58.8
Growth (%) 28.7 24.7 10.1 21.6 23.8
Net DPS (Rs) 5.5 6.8 7.3 9.0 10.5
Source: Company Data, PL Research
Profitability & valuation
Y/e March FY13 FY14 FY15E FY16E FY17E
NIM (%) 4.6 4.4 4.4 4.5 4.4
RoAE (%) 20.3 21.3 18.4 18.2 19.4
RoAA (%) 1.8 1.9 1.8 1.8 1.9
P / BV (x) 5.3 3.9 3.4 2.9 2.5
P / ABV (x) 5.6 4.1 3.6 3.1 2.6
PE (x) 33.4 26.8 24.4 20.0 16.2
Net dividend yield (%) 0.6 0.7 0.8 0.9 1.1
Source: Company Data, PL Research
Stock Performance
(%) 1M 6M 12M
Absolute 0.2 15.6 43.1
Relative to Sensex 3.9 7.8 13.0

LilladherPrabhudas Operating Metrics
Source: Company Data, PL Research
Source: Company Data, PL Research *Rolling chart 1 year forward on weekly basis
Margins to remain stable
HDFCB trades at 15% discount to KMB after ING merger announcement
Source: Company Data, PL Research
Significant cost reduction has improved ROAs to 2%
Source: Company Data, PL Research
HDFC Bank has clearly stood out in gaining CASA market share
1/2/2015 51
4.99%
5.53% 5.59%
4.84%
4.61%
4.70% 4.60%
4.26% 4.24% 4.22%4.07%
1.45%
1.64%
1.75% 1.69%1.63%
1.77%
1.95%2.02%
1.89%1.96% 1.97%
1.00%
1.20%
1.40%
1.60%
1.80%
2.00%
2.20%
3.00%
3.50%
4.00%
4.50%
5.00%
5.50%
6.00%
FY0
7
FY0
8
FY0
9
FY
10
FY1
1
FY1
2
FY1
3
FY
14
FY
15
E
FY1
6E
FY1
7E
Total Cost/Assets ROAs (RHS)
4.21%
4.66% 4.69%
4.13%
4.22% 4.19%
4.28%
4.14% 4.13%4.20%
4.16%
3.80%
4.00%
4.20%
4.40%
4.60%
4.80%
FY0
7
FY
08
FY0
9
FY1
0
FY
11
FY1
2
FY1
3
FY1
4
FY1
5E
FY
16
E
FY1
7E
NIMs
10.37%11.07%
12.62% 12.28%
13.37%14.07% 13.95%
14.48%15.55%
5.0%
7.0%
9.0%
11.0%
13.0%
15.0%
17.0%
FY06 FY07 FY08 FY09 FY10 FY11 FY12 FY13 FY14
HDFCB CASA Mkt Share ICICIB CASA Mkt Share Axis CASA Mkt Share
-45.00%
-35.00%
-25.00%
-15.00%
-5.00%
5.00%
15.00%
Jun-
08
Sep
-08
Dec
-08
Mar
-09
Jun-
09
Se
p-0
9D
ec-0
9M
ar-1
0Ju
n-1
0Se
p-1
0D
ec-1
0M
ar-1
1Ju
n-1
1Se
p-1
1D
ec-
11
Mar
-12
Jun-
12
Sep
-12
Dec
-12
Mar
-13
Jun-
13
Se
p-1
3D
ec-1
3M
ar-1
4Ju
n-1
4Se
p-1
4D
ec-1
4
KMB v/s HDFCB
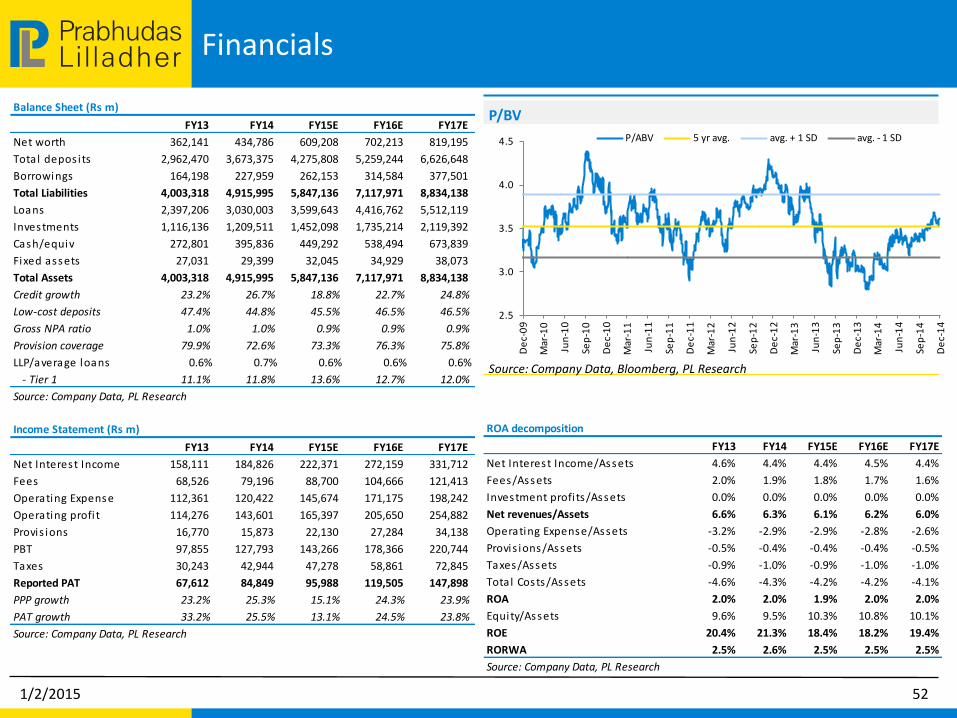
LilladherPrabhudas Financials
Source: Company Data, Bloomberg, PL Research
P/BV
1/2/2015 52
Balance Sheet (Rs m)
FY13 FY14 FY15E FY16E FY17E
Net worth 362,141 434,786 609,208 702,213 819,195
Total depos its 2,962,470 3,673,375 4,275,808 5,259,244 6,626,648
Borrowings 164,198 227,959 262,153 314,584 377,501
Total Liabilities 4,003,318 4,915,995 5,847,136 7,117,971 8,834,138
Loans 2,397,206 3,030,003 3,599,643 4,416,762 5,512,119
Investments 1,116,136 1,209,511 1,452,098 1,735,214 2,119,392
Cash/equiv 272,801 395,836 449,292 538,494 673,839
Fixed assets 27,031 29,399 32,045 34,929 38,073
Total Assets 4,003,318 4,915,995 5,847,136 7,117,971 8,834,138
Credit growth 23.2% 26.7% 18.8% 22.7% 24.8%
Low-cost deposits 47.4% 44.8% 45.5% 46.5% 46.5%
Gross NPA ratio 1.0% 1.0% 0.9% 0.9% 0.9%
Provision coverage 79.9% 72.6% 73.3% 76.3% 75.8%
LLP/average loans 0.6% 0.7% 0.6% 0.6% 0.6%
- Tier 1 11.1% 11.8% 13.6% 12.7% 12.0%
Source: Company Data, PL Research
Income Statement (Rs m)
FY13 FY14 FY15E FY16E FY17E
Net Interest Income 158,111 184,826 222,371 272,159 331,712
Fees 68,526 79,196 88,700 104,666 121,413
Operating Expense 112,361 120,422 145,674 171,175 198,242
Operating profi t 114,276 143,601 165,397 205,650 254,882
Provis ions 16,770 15,873 22,130 27,284 34,138
PBT 97,855 127,793 143,266 178,366 220,744
Taxes 30,243 42,944 47,278 58,861 72,845
Reported PAT 67,612 84,849 95,988 119,505 147,898
PPP growth 23.2% 25.3% 15.1% 24.3% 23.9%
PAT growth 33.2% 25.5% 13.1% 24.5% 23.8%
Source: Company Data, PL Research
ROA decomposition
FY13 FY14 FY15E FY16E FY17E
Net Interest Income/Assets 4.6% 4.4% 4.4% 4.5% 4.4%
Fees/Assets 2.0% 1.9% 1.8% 1.7% 1.6%
Investment profi ts/Assets 0.0% 0.0% 0.0% 0.0% 0.0%
Net revenues/Assets 6.6% 6.3% 6.1% 6.2% 6.0%
Operating Expense/Assets -3.2% -2.9% -2.9% -2.8% -2.6%
Provis ions/Assets -0.5% -0.4% -0.4% -0.4% -0.5%
Taxes/Assets -0.9% -1.0% -0.9% -1.0% -1.0%
Total Costs/Assets -4.6% -4.3% -4.2% -4.2% -4.1%
ROA 2.0% 2.0% 1.9% 2.0% 2.0%
Equity/Assets 9.6% 9.5% 10.3% 10.8% 10.1%
ROE 20.4% 21.3% 18.4% 18.2% 19.4%
RORWA 2.5% 2.6% 2.5% 2.5% 2.5%
Source: Company Data, PL Research
2.5
3.0
3.5
4.0
4.5
De
c-0
9
Mar
-10
Jun
-10
Sep
-10
De
c-1
0
Mar
-11
Jun
-11
Sep
-11
De
c-1
1
Mar
-12
Jun
-12
Sep
-12
De
c-1
2
Mar
-13
Jun
-13
Sep
-13
De
c-1
3
Mar
-14
Jun
-14
Sep
-14
De
c-1
4
P/ABV 5 yr avg. avg. + 1 SD avg. - 1 SD
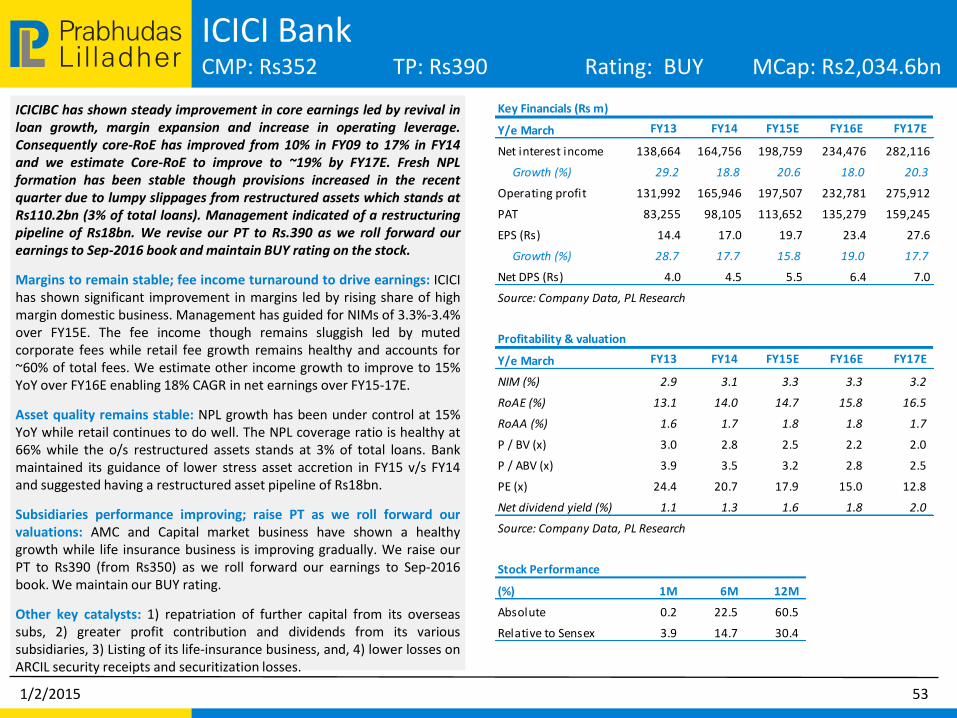
LilladherPrabhudas ICICI Bank
CMP: Rs352 TP: Rs390 Rating: BUY MCap: Rs2,034.6bn
ICICIBC has shown steady improvement in core earnings led by revival in loan growth, margin expansion and increase in operating leverage. Consequently core-RoE has improved from 10% in FY09 to 17% in FY14 and we estimate Core-RoE to improve to ~19% by FY17E. Fresh NPL formation has been stable though provisions increased in the recent quarter due to lumpy slippages from restructured assets which stands at Rs110.2bn (3% of total loans). Management indicated of a restructuring pipeline of Rs18bn. We revise our PT to Rs.390 as we roll forward our earnings to Sep‐2016 book and maintain BUY rating on the stock.
Margins to remain stable; fee income turnaround to drive earnings: ICICI has shown significant improvement in margins led by rising share of high margin domestic business. Management has guided for NIMs of 3.3%-3.4% over FY15E. The fee income though remains sluggish led by muted corporate fees while retail fee growth remains healthy and accounts for ~60% of total fees. We estimate other income growth to improve to 15% YoY over FY16E enabling 18% CAGR in net earnings over FY15-17E.
Asset quality remains stable: NPL growth has been under control at 15% YoY while retail continues to do well. The NPL coverage ratio is healthy at 66% while the o/s restructured assets stands at 3% of total loans. Bank maintained its guidance of lower stress asset accretion in FY15 v/s FY14 and suggested having a restructured asset pipeline of Rs18bn.
Subsidiaries performance improving; raise PT as we roll forward our valuations: AMC and Capital market business have shown a healthy growth while life insurance business is improving gradually. We raise our PT to Rs390 (from Rs350) as we roll forward our earnings to Sep‐2016 book. We maintain our BUY rating.
Other key catalysts: 1) repatriation of further capital from its overseas subs, 2) greater profit contribution and dividends from its various subsidiaries, 3) Listing of its life-insurance business, and, 4) lower losses on ARCIL security receipts and securitization losses.
1/2/2015 53
Key Financials (Rs m)
Y/e March FY13 FY14 FY15E FY16E FY17E
Net interest income 138,664 164,756 198,759 234,476 282,116
Growth (%) 29.2 18.8 20.6 18.0 20.3
Operating profit 131,992 165,946 197,507 232,781 275,912
PAT 83,255 98,105 113,652 135,279 159,245
EPS (Rs) 14.4 17.0 19.7 23.4 27.6
Growth (%) 28.7 17.7 15.8 19.0 17.7
Net DPS (Rs) 4.0 4.5 5.5 6.4 7.0
Source: Company Data, PL Research
Profitability & valuation
Y/e March FY13 FY14 FY15E FY16E FY17E
NIM (%) 2.9 3.1 3.3 3.3 3.2
RoAE (%) 13.1 14.0 14.7 15.8 16.5
RoAA (%) 1.6 1.7 1.8 1.8 1.7
P / BV (x) 3.0 2.8 2.5 2.2 2.0
P / ABV (x) 3.9 3.5 3.2 2.8 2.5
PE (x) 24.4 20.7 17.9 15.0 12.8
Net dividend yield (%) 1.1 1.3 1.6 1.8 2.0
Source: Company Data, PL Research
Stock Performance
(%) 1M 6M 12M
Absolute 0.2 22.5 60.5
Relative to Sensex 3.9 14.7 30.4

LilladherPrabhudas Operating Metrics
Source: Company Data, PL Research
Source: Company Data, PL Research
ROEs set to improve further as income composition become better
FY16: Subsidiary valuation
Source: Company Data, PL Research
Incremental stressed accretion be lower from hereon
Source: Company Data, PL Research
ICICIB has started gaining on market share again
1/2/2015 54
29.1% 29.0%
15.5%
0.0%
25.5%
12.2%
0.6% 5.6%
17.1%
7.92%8.23%
7.53%
6.91%7.10%
6.78% 6.77%6.45%
7.14%
5.0%
5.5%
6.0%
6.5%
7.0%
7.5%
8.0%
8.5%
0%
5%
10%
15%
20%
25%
30%
35%
FY06 FY07 FY08 FY09 FY10 FY11 FY12 FY13 FY14
Mar
ket S
hare
CA G
row
th
ICICI CA gr. ICICIB CA Mkt Share
0.53
%
1.0
2%
0.49
%
0.96
% 1.10
%
1.35
%
2.46
%
2.55
%
1.61
%
0.88
%
1.31
%
1.7
7%
1.19
%
1.07
%
1.46
%
1.3
8%
1.48
%
1.47
%
1.3
8%
1.85
%
0.50%
1.00%
1.50%
2.00%
2.50%
3.00%
3.50%
4.00%
4.50%
1Q13 2Q13 3Q13 4Q13 1Q14 2Q14 3Q14 4Q14 1Q15 2Q15
Fresh Slippages to loans Fresh Restructuring to loans
13.4%
11.7%
7.8% 8.0%
9.7%
11.2%
13.1%14.0%
14.7%15.8%
16.5%
15.4%14.3%
10.1%10.6%
12.8%
14.5%
16.5%17.1% 17.7%
18.7%19.3%
5.0%
7.0%
9.0%
11.0%
13.0%
15.0%
17.0%
19.0%
21.0%
FY07
FY08
FY09
FY
10
FY11
FY12
FY13
FY
14
FY15
E
FY16
E
FY17
E
Cons ROEs S'lone ROEs
Value per share (Rs) Holding (%) Multiple Basis FY17E
ICICI Standalone 100 2.2xAvg of EVA &
two-stage GGM326
Subsidiaries / Others
ICICI Bank UK 100 1x BV 4
ICICI Bank Canada 100 1x BV 6
Li fe insurance 74 14x NBAP + EV 33
Genera l insurance 74 12x PAT 4
Asset management 51 5.0% AUM 5
PD/Inv. Banking/Others 11
Total subsidiaries' value 63
% contribution of Subs. / Others 16.2
Total fair value per share 389

LilladherPrabhudas Financials
Source: Company Data, Bloomberg, PL Research
P/BV
1/2/2015 55
Balance Sheet (Rs m) FY13 FY14 FY15E FY16E FY17E
Net worth 667,015 732,068 811,133 906,166 1,021,392
Total depos its 2,926,135 3,319,137 3,886,709 4,648,504 5,675,823
Borrowings 1,056,792 1,145,742 1,458,254 1,827,112 2,289,611
Total Liabilities 5,367,946 5,946,416 6,998,486 8,332,486 10,064,390
Loans 2,902,494 3,387,026 3,935,725 4,671,705 5,727,511
Investments 1,713,936 1,770,218 2,068,436 2,496,295 2,959,043
Cash/equiv 414,175 415,296 570,914 684,829 834,301
Fixed assets 46,471 46,781 50,524 54,566 58,931
Total Assets 5,367,946 5,946,416 6,998,486 8,332,486 10,064,390
Credit growth 12.6% 14.0% 16.2% 18.8% 22.5%
Low-cost deposits 41.9% 42.9% 43.5% 43.5% 43.5%
Gross NPA ratio 3.31% 3.10% 2.96% 2.75% 2.57%
Provision coverage 76.8% 68.6% 65.8% 65.8% 65.4%
LLP/average loans 0.51% 0.72% 0.90% 0.85% 0.85%
- Tier 1 12.8% 12.8% 12.8% 12.5% 11.8%
Source: Company Data, PL Research
Income Statement (Rs m) FY13 FY14 FY15E FY16E FY17E
Net Interest Income 138,664 164,756 198,759 234,476 282,116
Fees 79,093 96,625 117,418 136,440 157,042
Operating Expense 90,129 103,089 118,670 138,135 163,245
Operating profi t 127,628 158,292 197,507 232,781 275,912
Provis ions 18,025 26,264 35,147 39,525 48,420
PBT 113,967 139,682 162,360 193,255 227,492
PAT 83,255 98,105 113,652 135,279 159,245
Reported PAT 83,255 98,105 113,652 135,279 159,245
PPP growth 27.1% 25.7% 19.0% 17.9% 18.5%
PAT growth 28.8% 17.8% 15.8% 19.0% 17.7%
Source: Company Data, PL Research
ROA decomposition FY13 FY14 FY15E FY16E FY17E
Net Interest Income/Assets 2.9% 3.1% 3.3% 3.3% 3.2%
Fees/Assets 1.7% 1.8% 1.9% 1.9% 1.8%
Investment profi ts/Assets 0.1% 0.1% 0.0% 0.0% 0.0%
Net revenues/Assets 4.7% 5.1% 5.2% 5.1% 5.1%
Operating Expense/Assets -1.9% -1.9% -2.0% -1.9% -1.9%
Provis ions/Assets -0.4% -0.5% -0.6% -0.5% -0.6%
Taxes/Assets -0.6% -0.8% -0.8% -0.8% -0.8%
Total Costs/Assets -2.9% -3.2% -3.3% -3.3% -3.2%
ROA 1.7% 1.9% 1.9% 1.9% 1.8%
Equity/Assets 13.3% 13.2% 12.7% 11.9% 11.1%
ROE 13.1% 14.0% 14.7% 15.8% 16.5%
RORWA 2.0% 2.1% 2.1% 2.1% 2.0%
Source: Company Data, PL Research
1.0
1.5
2.0
2.5
3.0
3.5
4.0
Jun
-10
Sep
-10
De
c-1
0
Mar
-11
Jun
-11
Sep
-11
De
c-1
1
Mar
-12
Jun
-12
Sep
-12
De
c-1
2
Mar
-13
Jun
-13
Sep
-13
De
c-1
3
Mar
-14
Jun
-14
Sep
-14
De
c-1
4
P/ABV 5 yr avg. avg. + 1 SD avg. - 1 SD

LilladherPrabhudas IndusInd Bank
CMP: Rs812 TP: Rs855 Rating: BUY MCap: Rs426.8bn
We estimate IIB to deliver an earnings CAGR of 31% over FY15-17E led by robust NII growth and continued traction in fee income. NIMs are likely to expand as IIB benefits from declining cost on the funding side while lending yield remains high. Optimistic outlook on CV loan growth will help B/s growth and margin accretion. Asset quality remains steady and IIB continues to benefit from benign credit cost. We upgrade our rating to BUY with a PT of Rs855, which corresponds to 3.4x Sep-2016E ABV.
Core performance remains robust: IIB's core PPOP (excl treasury) growth has been running strong at ~23% YoY over past two years. Though there has been some moderation due to aggressive branch expansion and technology related spending but we expect growth trends to recover as fee income/margins improves. The investment in technology and branches has enabled IIB to gain market share in both liabilities and assets.
CASA mix to improve further; fee income remains robust: We expect fee income to remain robust on steady growth in third party distribution fees (13% QoQ growth in Q2FY15) and pick-up in debt syndication business particularly as bond yield eases further. CASA mix has improved 213bp YoY to 33.9% and we expect it to reach ~36% by FY17E.
CV cycle recovery to boost growth/margins: Much anticipated recovery in CV cycle will boost growth and margins for IndusInd Bank. Management’s focus has been high on non‐auto retail portfolio but the outlook on CV loan book remains positive.
Asset quality holding steadily; credit cost to remain under control: IIB has reported healthy trends in asset quality with annualized slippage run-rate of ~1% and coverage ratio of ~70%. As a result of no large slippages, credit cost was on ~49bps (annualized) in Q2FY15. IIB’s restructured portfolio remains insignificant as proportion of total loans.
Valuation: We increase our FY16E earnings by 4% and revise our PT to Rs855 (from Rs690 earlier). We upgrade our rating to BUY.
1/2/2015 56
Key Financials (Rs m)
Y/e March FY13 FY14 FY15E FY16E FY17E
Net interest income 22,329 28,907 35,388 44,772 58,604
Growth (%) 31.0 29.5 22.4 26.5 30.9
Operating profit 18,395 25,960 32,286 41,255 54,109
PAT 10,612 14,080 18,015 23,366 30,913
EPS (Rs) 26.9 34.3 44.5 58.8 76.3
Growth (%) 25.4 27.6 29.7 32.3 29.7
Net DPS (Rs) 3.0 3.5 4.0 5.5 6.5
Source: Company Data, PL Research
Profitability & valuation
Y/e March FY13 FY14 FY15E FY16E FY17E
NIM (%) 3.5 3.7 3.8 3.9 4.0
RoAE (%) 17.2 16.9 18.4 20.2 22.2
RoAA (%) 1.6 1.8 1.9 1.9 2.0
P / BV (x) 4.9 4.2 3.5 2.9 2.3
P / ABV (x) 5.0 4.3 3.6 2.9 2.4
PE (x) 30.2 23.7 18.3 13.8 10.6
Net dividend yield (%) 0.4 0.4 0.5 0.7 0.8
Source: Company Data, PL Research
Stock Performance
(%) 1M 6M 12M
Absolute 5.1 41.1 91.8
Relative to Sensex 8.7 33.3 61.7

LilladherPrabhudas Operating Metrics
Source: Company Data, PL Research
Source: Company Data, PL Research
CV book growth is now stabilizing; but focus will remain on retail
IIB commands premium compared to ICICI/Axis/Yes on high RORWAs
Source: Company Data, PL Research
NIMs & Fee income driving improvement in ROAs
Source: Company Data, PL Research
IIB will continue to grow higher than system
1/2/2015 57
23.0
%
23.6
%
23.7
%
24.2
%
23.0
%
22.5
%
21.4
%
21.0
%
19.0
%
17.4
%
16.4
%
16.2
%
10.5% 10.7%
7.0%8.0%
2.1% 2.2% 1.9% 1.2%
-3.0%-3.6%
0.2% 0.5%
10.0%
12.0%
14.0%
16.0%
18.0%
20.0%
22.0%
24.0%
26.0%
3Q
12
4Q
12
1Q
13
2Q
13
3Q
13
4Q
13
1Q
14
2Q
14
3Q
14
4Q
14
1Q
15
2Q
15
CV loan to overall loans CV Loan growth QoQ (RHS)
19
%
15%
23
%
30
%
27
%
34
%
26%
24
%
22
% 24
%
28
%
28
%
22
%
18%
17
%
21
%
17
%
14%
14%
12
% 16
%
17%
10%
15%
20%
25%
30%
35%
40%
FY07
FY08
FY09
FY10
FY11
FY12
FY13
FY14
FY15
E
FY16
E
FY17
E
System Loan Growth IIB Loan Growth
2.35
%
2.1
1%
2.48
%
2.44
%
2.5
1%
2.39
%
2.28
%
2.0
4%
2.48
%
2.51
%
2.5
0%
2.42
%
1.8%
1.9%
2.0%
2.1%
2.2%
2.3%
2.4%
2.5%
2.6%
Axis ICICIBC HDFCB IIB KMB S'lone Yes
RORWAs - FY16E RORWAs - FY17E
0.4%
0.4%
0.6%
1.2%
1.5%
1.6%
1.7%
1.8%
1.9%
2.0%
2.1%
1.7%1.4%
1.6% 1.5%1.7%
1.9% 2.1%2.4%
2.6%2.7% 2.8%
1.4% 1.4%
1.8%
2.8%
3.5% 3.3% 3.4%3.6% 3.6% 3.7% 3.8%
0.0%
0.5%
1.0%
1.5%
2.0%
2.5%
0.5%
1.0%
1.5%
2.0%
2.5%
3.0%
3.5%
4.0%
FY07
FY08
FY09
FY10
FY11
FY12
FY13
FY14
FY15
E
FY16
E
FY17
E
ROAs (RHS) NIMs Fees/Assets

LilladherPrabhudas Financials
Source: Company Data, Bloomberg, PL Research
P/BV
1/2/2015 58
Balance Sheet (Rs m) FY13 FY14 FY15E FY16E FY17E
Net worth 76,195 90,319 105,875 125,859 152,775
Total depos its 541,167 605,023 750,228 955,791 1,229,147
Borrowings 83,406 136,930 170,379 212,080 264,092
Total Liabilities 733,065 870,259 1,070,612 1,345,551 1,707,295
Loans 443,206 551,018 672,793 835,609 1,069,580
Investments 196,542 215,630 258,835 336,839 420,608
Cash/equiv 68,487 67,694 95,924 121,392 154,905
Fixed assets 7,561 10,164 11,384 12,750 14,280
Total Assets 733,065 870,259 1,070,612 1,345,551 1,707,295
Credit growth 27.7% 25.3% 22.0% 24.3% 27.9%
Low-cost deposits 29.3% 32.5% 34.2% 34.9% 35.7%
Gross NPA ratio 1.0% 1.1% 1.1% 1.1% 1.1%
Provision coverage 70.1% 70.4% 74.8% 74.4% 73.3%
LLP/average loans 0.6% 0.8% 0.7% 0.7% 0.8%
- Tier 1 13.8% 12.7% 12.0% 11.3% 10.6%
Source: Company Data, PL Research
Income Statement (Rs m) FY13 FY14 FY15E FY16E FY17E
Net Interest Income 22,329 28,907 35,388 44,772 58,604
Fees 12,985 18,387 23,827 31,495 40,523
Operating Expense 17,564 21,853 27,679 35,762 45,769
Operating profi t 17,750 25,441 31,536 40,505 53,359
Provis ions 2,631 4,676 5,317 6,276 7,831
PBT 15,764 21,283 26,969 34,979 46,277
PAT 10,612 14,080 18,015 23,366 30,913
Reported PAT 10,612 14,080 18,015 23,366 30,913
PPP growth 34.0% 41.1% 24.4% 27.8% 31.2%
PAT growth 32.2% 32.7% 27.9% 29.7% 32.3%
Source: Company Data, PL Research
ROA decomposition
FY13 FY14 FY15E FY16E FY17E
Net Interest Income/Assets 3.5% 3.7% 3.8% 3.9% 4.0%
Fees/Assets 2.1% 2.4% 2.6% 2.7% 2.8%
Investment profi ts/Assets 0.1% 0.1% 0.1% 0.1% 0.1%
Net revenues/Assets 5.7% 6.2% 6.4% 6.6% 6.8%
Operating Expense/Assets -2.8% -2.8% -3.0% -3.1% -3.1%
Provis ions/Assets -0.4% -0.6% -0.6% -0.5% -0.5%
Taxes/Assets -0.8% -0.9% -1.0% -1.0% -1.0%
Total Costs/Assets -4.0% -4.4% -4.5% -4.6% -4.7%
ROA 1.7% 1.8% 1.9% 2.0% 2.1%
Equity/Assets 9.8% 10.8% 10.5% 10.0% 9.5%
ROE 17.8% 17.6% 19.1% 20.9% 22.8%
RORWA 2.3% 2.3% 2.4% 2.4% 2.5%
Source: Company Data, PL Research
1.5
2.0
2.5
3.0
3.5
4.0
De
c-0
9
Mar
-10
Jun
-10
Sep
-10
De
c-1
0
Mar
-11
Jun
-11
Sep
-11
De
c-1
1
Mar
-12
Jun
-12
Sep
-12
De
c-1
2
Mar
-13
Jun
-13
Sep
-13
De
c-1
3
Mar
-14
Jun
-14
Sep
-14
De
c-1
4
P/ABV 5 yr avg. avg. + 1 SD avg. - 1 SD

LilladherPrabhudas Kotak Mahindra Bank
CMP: Rs1,259 TP: Rs1,250 Rating: Accumulate MCap: Rs991.0bn
Significant synergies in merger: Recent announcement of merger with ING Vysya will provide significant synergies - (1) Product penetration will increase as KMB leverages on ING’s customer profile & benefits from minimal geographical overlap. KMB’s products like tractors & ING’s strength for SME will help retain high business growth. (2) Significant opex reduction in next two years will be seen as VYSB’s acquisition has doubled KMB’s branch presence, which will restrict opex growth. (3) Leveraging subsidiary business (insurance and capital market) through ING branches will boost other income for KMB. Also the acquisition will give KMB access to the South Indian geography where in it’s presence was very limited.
Margins at all time highs, to start moving downwards: Margins have moved to ~5% in H1FY15 which are at all time high due to high growth in its retail book. Margins should start moving downwards to ~4.3-4.5% in medium term which looks more sustainable. Also, post VYSBs’ merger margins should move down as VYSB presence is in a very competitive market and its NIMs are lower than KMB. We do not see any large dips in margins in the near term as KMB’s has been adding decent SA portfolios & VYSB’s merger will add similar CASA levels.
Asset quality issues to be limited post VYSB’s merger: Though some corporate exposures of VYSB are riskier than that of KMB corporate exposure, we do not see very high write-offs post merger. Also, KMB’s management style has been risk averse and known to turnaround bad assets, which will help clean up the risky book acquired book from VYSB.
Fee income to remain robust; valuations: Fee income growth of 35% was robust in H1FY15 on better TPD products and improving FX especially retail (50% of fees). We believe, fee income will remain robust as KMB has ramped up its offerings to retail customers and leveraging technology for FX & DCM business improvement. Although valuations have moved up to 4x Sep-16 book we retain ACCUMULATE with TP of Rs1250.
1/2/2015 59
Key Financials (Rs m)
Y/e March FY13 FY14 FY15E FY16E FY17E
Net interest income 41,689 48,382 53,276 62,980 76,629
Growth (%) 21.4 16.1 10.1 18.2 21.7
Operating profit 31,565 37,669 42,472 50,590 61,720
PAT 19,909 22,859 26,663 31,982 39,241
EPS (Rs) 26.7 29.0 33.9 40.6 49.8
Growth (%) 14.8 8.9 16.6 19.9 22.7
Net DPS (Rs) 0.7 0.8 0.9 1.1 1.4
Source: Company Data, PL Research
Profitability & valuation
Y/e March FY13 FY14 FY15E FY16E FY17E
NIM (%) 4.6 4.6 4.7 4.6 4.5
RoAE (%) 14.4 13.7 13.6 14.4 15.4
RoAA (%) 2.1 2.1 2.2 2.3 2.2
P / BV (x) 6.3 5.3 4.8 4.2 3.6
P / ABV (x) 6.4 5.4 4.9 4.3 3.7
PE (x) 47.2 43.4 37.2 31.0 25.3
Net dividend yield (%) 0.1 0.1 0.1 0.1 0.1
Source: Company Data, PL Research
Stock Performance
(%) 1M 6M 12M
Absolute 4.7 42.3 74.2
Relative to Sensex 8.4 34.5 44.1

LilladherPrabhudas Operating Metrics
Source: Company Data, PL Research
Source: Company Data, PL Research
Market share will be higher than of IIB/Yes post VYSB’s merger
Capital market biz could double by FY17E, but will be only ~14% of PAT
Source: Company Data, PL Research; *KMB –post merger Tier-I on simple combined capital
KMB’s Tier-I capital more than adequate post merger of VYSB
Source: Company Data, PL Research
Lending business has picked up
1/2/2015 60
1.44%1.16% 1.16%
1.61%
2.60%0.53%
0.35% 0.49%
0.52%
0.88%
0.50%
1.00%
1.50%
2.00%
2.50%
3.00%
3.50%
KMB Vysya Yes IIB KMB-VYSB
CA Market Share SA Market Share
17.4%
16.1%
13.6%12.8% 12.5%
12.0%
9.0%
10.0%
11.0%
12.0%
13.0%
14.0%
15.0%
16.0%
17.0%
18.0%
KMB - Pre-
merger
KMB - Post
Merger
HDFCB ICICIB Axis IIB
Tier 1 - FY15E
2,601
1,819 1,819
1,145 1,602
2,243 2,587
2,984
1,000
1,500
2,000
2,500
3,000
3,500
4,000
4,500
5,000
FY10 FY11 FY12 FY13 FY14 FY15E FY16E FY17E
Rs
Mill
ion
Capital Market AMC Investments Overseas Others
-10.0%
0.0%
10.0%
20.0%
30.0%
40.0%
50.0%
60.0%
2Q
11
3Q
11
4Q
11
1Q
12
2Q
12
3Q
12
4Q
12
1Q
13
2Q
13
3Q
13
4Q
13
1Q
14
2Q
14
3Q
14
4Q
14
1Q
15
2Q
15
Lending Business PAT % YoY Consolidated PAT % YoY

LilladherPrabhudas Financials
Source: Company Data, Bloomberg, PL Research
P/BV
1/2/2015 61
Balance Sheet (Rs m)
FY13 FY14 FY15E FY16E FY17E
Net worth 148,465 186,177 206,382 236,781 274,033
Total depos its 510,288 590,723 705,021 901,040 1,138,911
Borrowings 340,697 266,973 280,770 337,770 423,313
Total Liabilities 1,041,495 1,108,849 1,261,675 1,557,782 1,933,784
Loans 672,989 741,079 831,976 1,021,824 1,267,651
Investments 284,884 250,995 292,676 365,773 456,446
Cash/equiv 52,382 81,826 92,280 115,156 143,814
Fixed assets 5,847 12,301 18,837 25,391 31,958
Total Assets 1,041,495 1,108,849 1,261,675 1,557,782 1,933,784
Credit growth 28.7% 10.1% 12.8% 23.0% 24.1%
Low-cost deposits 29.2% 31.9% 32.7% 33.0% 33.2%
Gross NPA ratio 1.2% 1.6% 1.6% 1.6% 1.6%
Provision coverage 52.2% 45.4% 50.0% 50.0% 50.0%
Source: Company Data, PL Research
Income Statement (Rs m)
FY13 FY14 FY15E FY16E FY17E
Net Interest Income 41,689 48,382 53,276 62,980 76,629
Fees 19,462 22,417 27,028 31,979 37,356
Operating Expense 31,238 35,190 39,632 46,169 54,065
Operating profi t 29,913 35,609 40,672 48,790 59,920
Provis ions 2,093 3,282 2,779 2,982 3,301
PBT 29,472 34,387 39,693 47,608 58,418
Taxes 9,562 11,529 13,029 15,626 19,177
PAT 19,909 22,859 26,663 31,982 39,241
PPP growth 19.8% 19.3% 12.7% 19.1% 22.0%
PAT growth 15.7% 14.8% 16.6% 19.9% 22.7%
Source: Company Data, PL Research
ROA decomposition FY13 FY14 FY15E FY16E FY17E
Net Interest Income/Assets 4.6% 4.6% 4.7% 4.6% 4.5%
Fees/Assets 2.1% 2.2% 2.4% 2.4% 2.2%
Investment profi ts/Assets 0.2% 0.2% 0.2% 0.1% 0.1%
Net revenues/Assets 6.9% 7.0% 7.2% 7.1% 6.9%
Operating Expense/Assets -3.4% -3.4% -3.5% -3.4% -3.2%
Provis ions/Assets -0.2% -0.3% -0.2% -0.2% -0.2%
Taxes/Assets -1.1% -1.1% -1.1% -1.1% -1.1%
Total Costs/Assets -4.7% -4.8% -4.8% -4.8% -4.5%
ROA 2.2% 2.2% 2.3% 2.4% 2.3%
Equity/Assets 15.2% 16.1% 17.1% 16.3% 15.2%
ROE 14.4% 13.7% 13.6% 14.4% 15.4%
Source: Company Data, PL Research
1.5
2.0
2.5
3.0
3.5
4.0
4.5
De
c-0
9
Mar
-10
Jun
-10
Sep
-10
De
c-1
0
Mar
-11
Jun
-11
Sep
-11
De
c-1
1
Mar
-12
Jun
-12
Sep
-12
De
c-1
2
Mar
-13
Jun
-13
Sep
-13
De
c-1
3
Mar
-14
Jun
-14
Sep
-14
De
c-1
4
P/ABV 5 yr avg. avg. + 1 SD avg. - 1 SD

LilladherPrabhudas YES Bank
CMP: Rs773 TP: Rs815 Rating: BUY MCap: Rs320.7bn
Yes bank has reported healthy earnings CAGR of 30% over past three years led by healthy revenue growth and controlled opex/provisioning expenses. Margins in Q2FY15 improved by 20bp YoY on the back of robust loan growth (30% YoY) and we expect margins to expand further. Asset quality saw some deterioration from the corporate book but is manageable. We estimate RoA to improve to 1.72% by FY17E from 1.55% in FY14 due to improving liability franchise, margin expansion and pick-up in other income as rate environment moderates further. We revise our PT to Rs815 (from Rs700), which corresponds to 2.3x Sep-2016E ABV.
Operating metrics remain strong: Yes Bank’s NII growth remains steady at 27% YoY led by improving NIMs and resumption in loan growth. Going ahead, margins may inch‐up further as bank plans to introduce more products under retail consumption side and focus on growing its balance sheet after a long period of consolidation.
Fee income to pick-up further: Core fee growth remained strong at 50% YoY mainly from advisory, refinancing & syndications, while transactional banking fee showed slight moderation during Q2FY15. We expect other income to pick-up as YES is most levered to decline in corporate bond yield amongst private banks.
Asset quality remains steady; slippages to increase against a low base: Fresh slippages are likely to increase from a low base but seems to be manageable. We are building in credit cost of 65bp over FY15-17E which seems adequate given that YES has already built in CCP buffer of 50bp of loans which provides us comfort on asset quality.
Return ratios to inch higher: Yes Bank’s asset and liability franchise is getting granular and sticky which is leading to margin expansions & stable asset quality (which was perceived as risky) and is getting reflected in its ROA. Also, capital efficiency will help RORWAs to remain ~2.3% which is similar to peers, plus adequate capital position will help build loan growth momentum. We retain BUY with revised PT of Rs815 (2.3x Sep‐16 book).
1/2/2015 62
Key Financials (Rs m)
Y/e March FY13 FY14 FY15E FY16E FY17E
Net interest income 22,188 27,163 34,913 44,274 54,587
Growth (%) 37.3 22.4 28.5 26.8 23.3
Operating profit 21,417 26,880 33,478 41,028 49,745
PAT 13,007 16,178 19,906 24,273 29,636
EPS (Rs) 36.6 45.0 51.3 58.5 71.4
Growth (%) 31.0 23.1 14.1 13.9 22.1
Net DPS (Rs) 6.0 8.0 9.3 12.0 14.5
Source: Company Data, PL Research
Profitability & valuation
Y/e March FY13 FY14 FY15E FY16E FY17E
NIM (%) 2.7 2.8 3.1 3.3 3.4
RoAE (%) 24.8 25.0 21.2 19.3 20.3
RoAA (%) 1.5 1.6 1.7 1.7 1.7
P / BV (x) 4.8 3.9 2.8 2.4 2.0
P / ABV (x) 4.8 3.9 2.8 2.4 2.0
PE (x) 21.1 17.2 15.1 13.2 10.8
Net dividend yield (%) 0.8 1.0 1.2 1.6 1.9
Source: Company Data, PL Research
Stock Performance
(%) 1M 6M 12M
Absolute 8.1 38.9 106.3
Relative to Sensex 11.8 31.1 76.2

LilladherPrabhudas Operating Metrics
Source: Company Data, PL Research; *TPD - Third Party Distribution
Source: Company Data, PL Research
Fees to start getting granular with higher proportion of retail fees
Yes Bank has been delivering superior return ratios
Source: Company Data, PL Research
Benefit to arise from falling yields on higher corporate investment book
Source: Company Data, PL Research
Loan book has become granular as Credit substitutes moved out
1/2/2015 63
43
%
52
%
44
%
32
%
28
%
42
%
40
%
46%
36
%
33%
30
%
40
%
36
% 37
%
28
% 32
%
40
%
48
%
45%
45
% 48
% 52%
3Q
13
4Q
13
1Q
14
2Q
14
3Q
14
4Q
14
1Q
15
2Q
15
FY15
E
FY16
E
FY17
E
Fin Advisory Fees TPD & Banking Fees
20.7% 20.3%21.1%
23.1%
24.8% 25.0%
21.2%
19.3%20.3%
15%
17%
19%
21%
23%
25%
27%
1.00%
1.20%
1.40%
1.60%
1.80%
2.00%
2.20%
2.40%
2.60%
FY09
FY
10
FY
11
FY12
FY13
FY14
FY
15
E
FY
16
E
FY17
E
ROAs RORWAs ROEs (RHS)
0.0%
5.0%
10.0%
15.0%
20.0%
25.0%
30.0%
35.0%
3Q
12
4Q
12
1Q
13
2Q
13
3Q
13
4Q
13
1Q
14
2Q
14
3Q
14
4Q
14
1Q
15
2Q
15
Loan growth Customer Asset growth
0.0%
1.0%
2.0%
3.0%
4.0%
5.0%
6.0%
7.0%
8.0%
9.0%
10.0%
Yes Axis Kotak ICICI Indusind HDFCB

LilladherPrabhudas Financials
Source: Company Data, Bloomberg, PL Research
P/BV
1/2/2015 64
Balance Sheet (Rs m)
FY13 FY14 FY15E FY16E FY17E
Net worth 58,077 71,217 116,606 135,050 157,643
Total depos its 669,556 741,920 865,079 1,064,047 1,320,482
Borrowings 141,483 145,429 149,382 177,358 215,255
Total Liabilities 991,041 1,090,158 1,280,379 1,549,568 1,893,881
Loans 469,996 556,330 663,145 832,247 1,051,128
Investments 429,760 409,504 472,303 539,720 622,461
Cash/equiv 40,658 58,917 63,201 75,475 92,679
Fixed assets 2,295 2,935 3,639 4,512 5,595
Total Assets 991,041 1,090,158 1,280,379 1,549,568 1,893,881
Credit growth 26.1% 15.0% 18.6% 23.8% 24.8%
Low-cost deposits 18.9% 22.0% 26.1% 26.8% 27.5%
Gross NPA ratio 0.2% 0.3% 0.3% 0.4% 0.4%
Provision coverage 92.6% 85.1% 79.1% 81.0% 82.1%
LLP/average loans 0.5% 0.5% 0.7% 0.8% 0.7%
- Tier 1 0.1% 0.1% 0.1% 0.1% 0.1%
Source: Company Data, PL Research
Income Statement (Rs m)
FY13 FY14 FY15E FY16E FY17E
Net Interest Income 22,188 27,163 34,913 44,274 54,587
Fees 11,018 15,554 21,175 25,410 31,001
Operating Expense 13,345 17,499 22,610 28,657 35,843
Operating profi t 19,860 25,218 33,478 41,028 49,745
Provis ions 2,160 3,617 4,629 5,850 6,794
PBT 19,257 23,263 28,849 35,178 42,951
PAT 13,007 16,178 19,906 24,273 29,636
Reported PAT 13,007 16,178 19,906 24,273 29,636
PPP growth 39.1% 25.5% 24.5% 22.6% 21.2%
PAT growth 33.1% 24.4% 23.0% 21.9% 22.1%
Source: Company Data, PL Research
ROA decomposition FY13 FY14 FY15E FY16E FY17E
Net Interest Income/Assets 2.7% 2.8% 3.1% 3.3% 3.4%
Fees/Assets 1.3% 1.6% 1.9% 1.9% 1.9%
Investment profi ts/Assets 0.2% 0.2% 0.0% 0.0% 0.0%
Net revenues/Assets 4.3% 4.5% 5.0% 5.3% 5.3%
Operating Expense/Assets -1.6% -1.8% -2.0% -2.2% -2.2%
Provis ions/Assets -0.3% -0.4% -0.4% -0.4% -0.4%
Taxes/Assets -0.8% -0.7% -0.8% -0.8% -0.8%
Total Costs/Assets -2.7% -2.9% -3.3% -3.4% -3.5%
ROA 1.6% 1.6% 1.8% 1.8% 1.8%
Equity/Assets 6.4% 6.6% 8.4% 9.5% 9.1%
ROE 24.8% 25.0% 21.2% 19.3% 20.3%
RORWA 2.2% 2.2% 2.4% 2.4% 2.4%
Source: Company Data, PL Research
0.5
1.0
1.5
2.0
2.5
3.0
3.5
De
c-0
9
Mar
-10
Jun
-10
Sep
-10
De
c-1
0
Mar
-11
Jun
-11
Sep
-11
De
c-1
1
Mar
-12
Jun
-12
Sep
-12
De
c-1
2
Mar
-13
Jun
-13
Sep
-13
De
c-1
3
Mar
-14
Jun
-14
Sep
-14
De
c-1
4
P/ABV 5 yr avg. avg. + 1 SD avg. - 1 SD

LilladherPrabhudas Bank of Baroda
CMP: Rs1,086 TP: Rs1,175 Rating: BUY MCap: Rs467.6bn
Bank of Baroda remains our preferred pick amongst PSU banks owing to its better asset quality performance, healthy wage/pension provisioning cushion and higher capitalization levels. The fresh slippage rate for BOB remains ~2% annualized, much better than peers and management has guided for improving trends in asset quality going forward. The stock is trading at attractive levels of 1.1x Sep-FY16E ABV, which we find attractive as BOB maintains its earnings superiority over peers with an estimated RoE of ~16% for FY17E. We maintain BUY with PT of Rs1,175 which corresponds to 1.3x Sep-FY16E ABV.
Business growth remains modest: The advances and deposit portfolio of the bank has reported a modest decline during 1HFY15 as bank chose the consolidation approach instead of risky lending. However NII growth still remains healthy and was supported by healthy domestic NIMs. BOB has further shed preferential rate deposits and CDs (bulk deposits are less than 8%) which helped it manage its funding cost while steady growth in retail has helped improve lending yields.
Well provided on wage provisions: BOB is making adequate provision potential wage revision at Rs750mn per quarter which will be sufficient to cover potential wage hike up to 15‐16% (quite adequate in our view).
Asset quality remains better than peers; higher coverage ratio/CAR comforts us: Fresh slippage rate for BOB remains at <2%, much better than peers while the o/s std. restructured assets stands at 5.9% of total loans. Management guided for improving trends in asset quality over medium term. Higher coverage ratio ~65%, healthy Tier‐I at ~9.3% and better RoE profile still gives us comfort.
Valuation: We revise our PT to Rs1,175 based on 1.3x Sep-FY16E ABV. We continue to maintain our BUY rating on the stock.
Risks: Significant deterioration in slippage trend after new chairman takes over and subdued business growth are key downside risks.
1/2/2015 65
Key Financials (Rs m)
Y/e March FY13 FY14 FY15E FY16E FY17E
Net interest income 113,153 119,653 132,732 150,425 178,391
Growth (%) 9.7 5.7 10.9 13.3 18.6
Operating profit 89,992 92,910 103,093 120,277 146,542
PAT 44,807 45,411 50,097 59,728 75,197
EPS (Rs) 107.3 106.4 116.3 138.7 174.6
Growth (%) -13.7 -0.8 9.3 19.2 25.9
Net DPS (Rs) 25.1 25.2 23.0 25.0 27.5
Source: Company Data, PL Research
Profitability & valuation
Y/e March FY13 FY14 FY15E FY16E FY17E
NIM (%) 2.3 2.0 1.9 1.9 2.0
RoAE (%) 15.1 13.4 13.2 14.2 15.8
RoAA (%) 0.9 0.8 0.7 0.8 0.8
P / BV (x) 1.5 1.3 1.2 1.1 0.9
P / ABV (x) 1.7 1.6 1.5 1.3 1.1
PE (x) 10.1 10.2 9.3 7.8 6.2
Net dividend yield (%) 2.3 2.3 2.1 2.3 2.5
Source: Company Data, PL Research
Stock Performance
(%) 1M 6M 12M
Absolute 0.0 23.3 64.8
Relative to Sensex 3.7 15.5 34.6

LilladherPrabhudas Operating Metrics
Source: Company Data, PL Research
Source: Company Data, PL Research
BOB has been able to gain incremental CA market share v/s peers
BOB’s Tier-I remains best after SBI and with 98% being CET-1
Source: Company Data, PL Research
BOB’s has high exposure only in textiles compared to peers
Source: Company Data, PL Research
BOB’s loan growth has been higher than system growth through cycles
1/2/2015 66
14.1
%
2.8
%
6.2%
6.2%
3.2%
11.9
%
4.8% 5.
8%
4.1
%
3.6%
18.6
%
3.7%
2.1
%
2.8% 3.2%
1.0%
6.0%
11.0%
16.0%
21.0%
SBI PNB BOB BOI Union
2003-08 2009-14 2012-14
5%
10%
15%
20%
25%
30%
35%
40%
FY06
FY07
FY08
FY
09
FY10
FY11
FY12
FY
13
FY14
FY15
E
FY16
E
FY17
E
System Loan Growth BOB Loan Growth
10.1%
9.5%
8.7%
8.0%
7.3%
6.00%
7.00%
8.00%
9.00%
10.00%
11.00%
SBI BOB PNB BOI Union
2Q15 - B3 Tier-ISBI PNB BOB BOI Union
Infra 13.7% 17.1% 14.1% 16.7% 14.1%
- Power 7.2% 9.4% 6.7% 11.0% 8.5%
- Roads 2.5% 3.0% 3.9% 3.5% 1.8%
Metals 6.5% 7.2% 6.3% 5.4% 6.2%
Engg 4.3% 2.6% 4.1% 1.3% 1.8%
Textiles 2.9% 2.1% 4.9% 3.7% 2.7%

LilladherPrabhudas Financials
Source: Company Data, Bloomberg, PL Research
P/BV
1/2/2015 67
Balance Sheet (Rs m)
FY13 FY14 FY15E FY16E FY17E
Net worth 319,694 359,857 398,464 445,702 507,161
Total depos its 4,738,833 5,688,944 6,291,972 7,248,352 8,466,075
Borrowings 171,776 254,113 345,064 468,654 636,627
Total Liabilities 5,471,354 6,595,045 7,373,255 8,553,210 10,061,662
Loans 3,281,858 3,970,058 4,398,824 5,111,434 6,062,161
Investments 1,213,936 1,161,127 1,201,270 1,342,874 1,529,933
Cash/equiv 853,989 1,308,779 1,588,848 1,884,245 2,219,213
Fixed assets 24,531 27,341 29,747 31,651 33,677
Total Assets 5,471,353 6,595,045 7,373,255 8,553,210 10,061,662
Credit growth 14.1% 21.1% 10.7% 16.2% 18.6%
Low-cost deposits 25.3% 25.7% 25.4% 26.1% 27.0%
Gross NPA ratio 2.4% 3.0% 3.0% 2.9% 2.5%
Provision coverage 47.4% 49.2% 50.6% 51.8% 54.3%
LLP/average loans 1.1% 1.0% 0.8% 0.8% 0.7%
- Tier 1 10.1% 9.3% 9.4% 9.1% 8.8%
Source: Company Data, PL Research
Income Statement (Rs m)
FY13 FY14 FY15E FY16E FY17E
Net Interest Income 113,153 119,653 132,732 150,425 178,391
Fees 30,133 37,189 46,829 54,916 61,991
Operating Expense 59,467 71,371 79,890 89,444 99,446
Operating profi t 83,819 85,472 99,672 115,897 140,936
Provis ions 41,679 37,937 32,534 36,153 40,630
PBT 48,312 54,973 70,560 84,124 105,912
PAT 44,807 45,411 50,097 59,728 75,197
Reported PAT 44,807 45,411 50,097 59,728 75,197
PPP growth 4.9% 3.2% 11.0% 16.7% 21.8%
PAT growth -10.5% 1.3% 10.3% 19.2% 25.9%
Source: Company Data, PL Research
ROA decomposition FY13 FY14 FY15E FY16E FY17E
Net Interest Income/Assets 2.3% 2.0% 1.9% 1.9% 2.0%
Fees/Assets 0.6% 0.6% 0.7% 0.7% 0.7%
Investment profi ts/Assets 0.1% 0.1% 0.1% 0.1% 0.1%
Net revenues/Assets 3.1% 2.8% 2.7% 2.7% 2.7%
Operating Expense/Assets -1.2% -1.2% -1.2% -1.2% -1.1%
Provis ions/Assets -0.9% -0.6% -0.5% -0.5% -0.4%
Taxes/Assets -0.1% -0.2% -0.3% -0.3% -0.3%
Total Costs/Assets -2.2% -2.0% -2.0% -1.9% -1.9%
ROA 0.9% 0.8% 0.7% 0.8% 0.8%
Equity/Assets 6.1% 5.8% 5.6% 5.4% 5.2%
ROE 15.7% 13.8% 13.6% 14.5% 16.1%
RORWA 1.6% 1.4% 1.3% 1.4% 1.5%
Source: Company Data, PL Research
0.5
0.7
0.9
1.1
1.3
1.5
1.7
1.9
2.1
De
c-0
9
Mar
-10
Jun
-10
Sep
-10
De
c-1
0
Mar
-11
Jun
-11
Sep
-11
De
c-1
1
Mar
-12
Jun
-12
Sep
-12
De
c-1
2
Mar
-13
Jun
-13
Sep
-13
De
c-1
3
Mar
-14
Jun
-14
Sep
-14
De
c-1
4
P/ABV 5 yr avg. avg. + 1 SD avg. - 1 SD

LilladherPrabhudas Bank of India
CMP: Rs305 TP: Rs350 Rating: BUY MCap: Rs196.0bn
Bank of India has reported muted performance over past few quarters as fresh slippages remained high while coverage ratio declined to 56%, including technical write-offs. BOI also has a weak capital base with core-Tier I of ~6.9%. However this reflects in banks valuations at 0.7x FY16E ABV which is almost ~40% discount to peers. The high government ownership of ~66%, healthy prospects of treasury gain and steady improvement in asset quality as risk of relapse from restructured book remains low will help bank improve upon its earnings profile. Hence, we upgrade our rating to BUY from Accumulate with PT of Rs350 which corresponds to 0.9x Sep-2016E ABV.
NII growth has bounced sharply: BOI’s NII growth has been running strong led by healthy recovery and upgrade trend, uptick in CD ratio and margin expansion of 15bp QoQ. Other income however remained muted at 8.5% YoY decline (18.5% YoY decline excluding treasury profits) and dragged revenue growth to 11% YoY. Management reiterated its focus on fee income and has guided for 20% YoY growth in core fees.
Concerns remain on wage revision/mortality provisions: BOI has been making wage provisions based on an average wage hike of ~11% v/s peers at ~13‐15%. Besides, BOI has also decided to continue with old LIC mortality tables based on the advice it has received from the actuaries. We note that the shift to new mortality table, if required, will impact earnings by Rs6bn – 10.7% of FY16E PBT.
Asset quality trends improving; Tier‐I has improved to ~8%: Fresh slippages moderated to 3.1% of loans (4% in Q1FY15) while BOI did a fresh restructuring of Rs13.58bn. Management guided for an o/s restr. pipeline of Rs16bn while std. restructured assets stand at 3% (2% exc.SEB). BOI issued Rs25 bn worth of Tier‐I bonds which helped improve Tier‐I by 72bp to 8%.
Valuation: We revise our PT to Rs350 (from Rs320) based on 0.9x Sep-2016E ABV and change our rating from ‘Accumulate’ to ‘BUY’.
1/2/2015 68
Key Financials (Rs m)
Y/e March FY13 FY14 FY15E FY16E FY17E
Net interest income 90,240 108,305 120,471 146,514 181,169
Growth (%) 8.5 20.0 11.2 21.6 23.7
Operating profit 74,585 84,229 88,477 108,066 136,584
PAT 27,493 27,293 32,365 43,487 57,271
EPS (Rs) 47.0 44.0 50.3 67.6 89.1
Growth (%) -1.7 -6.2 14.3 34.4 31.7
Net DPS (Rs) 11.7 5.8 6.0 7.0 7.0
Source: Company Data, PL Research
Profitability & valuation
Y/e March FY13 FY14 FY15E FY16E FY17E
NIM (%) 2.2 2.2 2.0 2.1 2.1
RoAE (%) 12.3 10.1 10.3 12.6 14.6
RoAA (%) 0.7 0.5 0.5 0.6 0.6
P / BV (x) 0.8 0.7 0.7 0.6 0.5
P / ABV (x) 1.1 1.0 1.0 0.8 0.7
PE (x) 6.5 6.9 6.1 4.5 3.4
Net dividend yield (%) 3.8 1.9 2.0 2.3 2.3
Source: Company Data, PL Research
Stock Performance
(%) 1M 6M 12M
Absolute 6.5 (0.0) 25.2
Relative to Sensex 10.2 (7.9) (4.9)

LilladherPrabhudas Operating Metrics
Source: Company Data, PL Research
Source: Company Data, PL Research
BOI has resorted to higher NPA sale
We expect earnings CAGR of 33% over FY15E-FY17E
Source: Company Data, PL Research
Decrease in restructured book has been faster than peers
Source: Company Data, PL Research
Capital levels have turned critical as Bank resorted to high Loan growth
1/2/2015 69
6.8%
5.7% 5.4% 5.4%4.7%
3.7%2.8% 3.0%2.0%
4.0%
6.0%
8.0%
10.0%
12.0%
3Q13 4Q13 1Q14 2Q14 3Q14 4Q14 1Q15 2Q15
BOI SBI Union BOB PNB
7.6% 8.
2%
8.0
%
7.7% 8.
1%
7.2%
7.3%
8.0
%
7.07
%
6.86
%
6.8
1%
10.0%
15.0%
20.0%
25.0%
30.0%
35.0%
5.0%
5.5%
6.0%
6.5%
7.0%
7.5%
8.0%
8.5%
3Q
13
4Q
13
1Q
14
2Q
14
3Q
14
4Q
14
1Q
15
2Q
15
FY15
E
FY16
E
FY
17
E
Tier-1 Loan Growth YoY (RHS)
31.1%
23.3%
18.5%
13.9%
5.4% 5.4%
BOI Ind Bank Can Bank Albad Bank SBI BOB
Book value of NPA sold to GNPAs - FY14
-50.0%
-30.0%
-10.0%
10.0%
30.0%
50.0%
10,000
20,000
30,000
40,000
50,000
60,000
FY10 FY11 FY12 FY13 FY14 FY15E FY16E FY17E
PAT (Rs m) YoY gr. (RHS)

LilladherPrabhudas Financials
Source: Company Data, Bloomberg, PL Research
P/BV
1/2/2015 70
Balance Sheet (Rs m)
FY13 FY14 FY15E FY16E FY17E
Net worth 239,182 299,231 327,120 365,386 417,436
Total depos its 3,818,396 4,769,741 5,599,675 6,708,411 8,036,676
Borrowings 258,893 372,682 509,496 663,241 865,879
Total Liabilities 4,526,027 5,731,902 6,759,052 8,095,812 9,718,771
Loans 2,893,675 3,707,335 4,315,338 5,169,775 6,193,391
Investments 946,134 1,141,524 1,462,962 1,775,797 2,173,101
Cash/equiv 548,359 613,823 685,109 824,807 994,031
Fixed assets 28,701 57,861 63,994 71,545 79,987
Total Assets 4,526,027 5,731,902 6,759,052 8,095,812 9,718,771
Credit growth 16.1% 28.6% 16.7% 19.8% 19.9%
Low-cost deposits 25.6% 22.9% 24.3% 25.7% 26.9%
Gross NPA ratio 3.0% 3.2% 3.4% 3.1% 2.8%
Provision coverage 31.7% 36.9% 36.2% 40.2% 44.0%
LLP/average loans 1.5% 1.3% 1.1% 1.0% 1.0%
- Tier 1 8.2% 7.2% 7.1% 6.9% 6.8%
Source: Company Data, PL Research
Income Statement (Rs m)
FY13 FY14 FY15E FY16E FY17E
Net Interest Income 90,240 108,305 120,471 146,514 181,169
Fees 33,190 34,962 40,863 47,457 55,128
Operating Expense 53,315 66,995 76,543 89,590 103,399
Operating profi t 70,114 76,273 84,791 104,380 132,898
Provis ions 44,508 48,779 43,212 47,245 56,484
PBT 30,077 35,451 45,265 60,821 80,100
PAT 27,493 27,293 32,365 43,487 57,271
Reported PAT 27,493 27,293 32,365 43,487 57,271
PPP growth 11.4% 12.9% 5.0% 22.1% 26.4%
PAT growth 2.7% -0.7% 18.6% 34.4% 31.7%
Source: Company Data, PL Research
ROA decomposition FY13 FY14 FY15E FY16E FY17E
Net Interest Income/Assets 2.2% 2.2% 2.0% 2.1% 2.1%
Fees/Assets 0.8% 0.7% 0.7% 0.7% 0.6%
Investment profi ts/Assets 0.1% 0.2% 0.1% 0.1% 0.0%
Net revenues/Assets 3.2% 3.1% 2.8% 2.8% 2.8%
Operating Expense/Assets -1.3% -1.4% -1.3% -1.3% -1.2%
Provis ions/Assets -1.1% -1.0% -0.7% -0.7% -0.7%
Taxes/Assets -0.1% -0.2% -0.2% -0.2% -0.3%
Total Costs/Assets -2.5% -2.5% -2.2% -2.2% -2.1%
ROA 0.7% 0.6% 0.5% 0.6% 0.7%
Equity/Assets 5.5% 5.5% 5.3% 4.9% 4.6%
ROE 12.9% 11.2% 11.7% 14.1% 16.2%
RORWA 1.1% 0.9% 0.9% 1.0% 1.1%
Source: Company Data, PL Research
0.0
0.5
1.0
1.5
2.0
2.5
De
c-0
9
Mar
-10
Jun
-10
Sep
-10
De
c-1
0
Mar
-11
Jun
-11
Sep
-11
De
c-1
1
Mar
-12
Jun
-12
Sep
-12
De
c-1
2
Mar
-13
Jun
-13
Sep
-13
De
c-1
3
Mar
-14
Jun
-14
Sep
-14
De
c-1
4
P/ABV 5 yr avg. avg. + 1 SD avg. - 1 SD

LilladherPrabhudas Punjab National Bank
CMP: Rs221 TP: Rs208 Rating: Reduce MCap: Rs400.4bn
PNB is aiming to grow its loan book inline with the system after alternating between rapid loan growth (25% average during FY11-FY12) and period of consolidation (9% average loan growth during FY13-FY14). The bank has reported steady accretion in GNPL (~26% YoY growth) while the restructured assets portfolio remains highest amongst peers at 10%. We believe this pose high risk going forward as notwithstanding regulatory forbearance the slippages from restructured assets are on a rise. We believe that risk reward is unfavourable at current price levels and hence downgrade our rating to REDUCE with a revised PT of Rs208.
Margins to remain better than peers: PNB’s margins remains better than peers at ~3.4% aided by its strong liability franchise and healthy lending yields. The bank incrementally has been focusing on large corporate and looking for quality growth which will likely put pressure on margins. However we expect NIMs to still maintain its leadership over peers.
Asset quality remains worrisome; relapse risk from restructured portfolio remains high: PNB's asset quality continues to worsen at an accelerated pace while fresh restructuring also remains elevated. Also, the bank reported NPL formation of Rs12.8bn in its restructured portfolio which concerns us, given the large restructured portfolio the bank has. We remained concerned on the fallout from restructured book as at least 35‐40% of book will be moving out of moratorium in next 12‐15 months.
Prudent NPA provisions – Good intent but late: PNB provided Rs6.8bn of additional provisions for specific loan a/c. Management has adopted policy to use write‐back of investment depreciation and recovery from written off a/c for making loan a/c specific provisions, which is prudent but is quite late in realizing the need of prudent provisions.
Valuation: We revise our PT to Rs208 based on 1.4x Sep-2016E ABV, adjusted for potential slippages from restructured assets. We downgrade our rating to REDUCE.
1/2/2015 71
Key Financials (Rs m)
Y/e March FY13 FY14 FY15E FY16E FY17E
Net interest income 148,565 161,460 176,389 205,214 238,490
Growth (%) 10.8 8.7 9.2 16.3 16.2
Operating profit 109,074 113,845 120,914 140,871 163,128
PAT 47,477 33,426 41,051 54,001 63,991
EPS (Rs) 27.4 18.7 22.7 29.8 35.3
Growth (%) -7.9 -31.8 21.4 31.5 18.5
Net DPS (Rs) 5.4 2.0 2.5 3.0 3.5
Source: Company Data, PL Research
Profitability & valuation
Y/e March FY13 FY14 FY15E FY16E FY17E
NIM (%) 3.3 3.2 3.1 3.1 3.0
RoAE (%) 15.7 9.7 10.9 12.9 13.6
RoAA (%) 1.0 0.6 0.7 0.8 0.8
P / BV (x) 1.2 1.1 0.9 0.8 0.7
P / ABV (x) 1.6 1.5 1.3 1.1 0.9
PE (x) 8.1 11.8 9.8 7.4 6.3
Net dividend yield (%) 2.4 0.9 1.1 1.4 1.6
Source: Company Data, PL Research
Stock Performance
(%) 1M 6M 12M
Absolute 1.7 10.2 73.0
Relative to Sensex 5.4 2.4 42.9
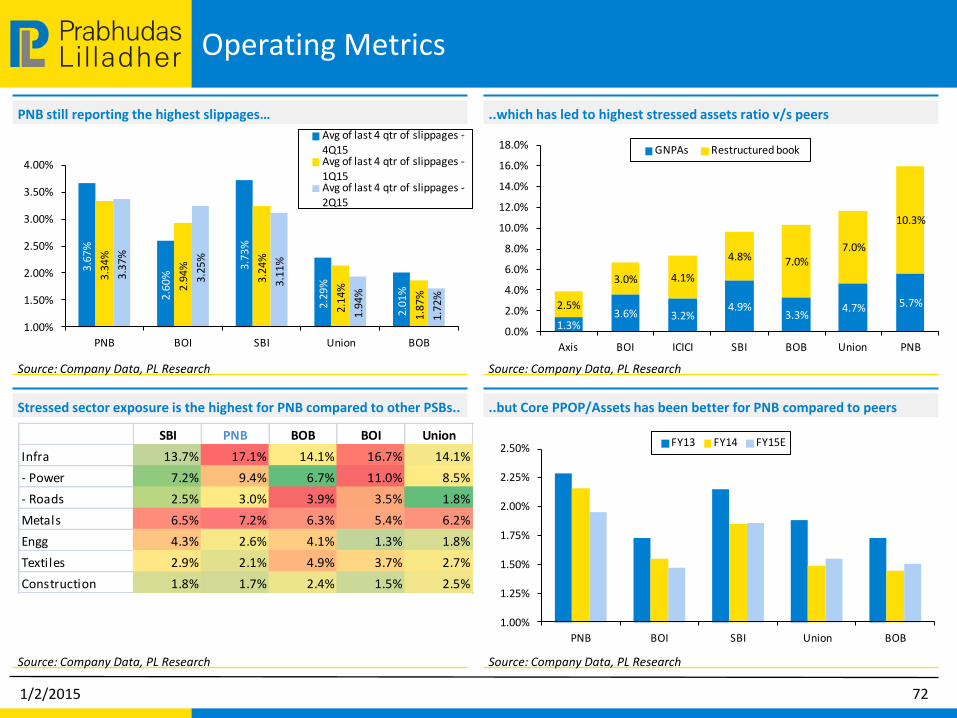
LilladherPrabhudas Operating Metrics
Source: Company Data, PL Research
Source: Company Data, PL Research
..which has led to highest stressed assets ratio v/s peers
..but Core PPOP/Assets has been better for PNB compared to peers
Source: Company Data, PL Research
Stressed sector exposure is the highest for PNB compared to other PSBs..
Source: Company Data, PL Research
PNB still reporting the highest slippages…
1/2/2015 72
3.67
%
2.60
%
3.73
%
2.29
%
2.0
1%
3.34
%
2.94
%
3.24
%
2.1
4%
1.87
%
3.3
7%
3.25
%
3.11
%
1.94
%
1.72
%
1.00%
1.50%
2.00%
2.50%
3.00%
3.50%
4.00%
PNB BOI SBI Union BOB
Avg of last 4 qtr of slippages -4Q15Avg of last 4 qtr of slippages -1Q15Avg of last 4 qtr of slippages -
2Q15
1.00%
1.25%
1.50%
1.75%
2.00%
2.25%
2.50%
PNB BOI SBI Union BOB
FY13 FY14 FY15E
1.3%3.6% 3.2%
4.9%3.3%
4.7% 5.7%2.5%
3.0% 4.1%
4.8% 7.0%7.0%
10.3%
0.0%
2.0%
4.0%
6.0%
8.0%
10.0%
12.0%
14.0%
16.0%
18.0%
Axis BOI ICICI SBI BOB Union PNB
GNPAs Restructured book
SBI PNB BOB BOI Union
Infra 13.7% 17.1% 14.1% 16.7% 14.1%
- Power 7.2% 9.4% 6.7% 11.0% 8.5%
- Roads 2.5% 3.0% 3.9% 3.5% 1.8%
Metals 6.5% 7.2% 6.3% 5.4% 6.2%
Engg 4.3% 2.6% 4.1% 1.3% 1.8%
Textiles 2.9% 2.1% 4.9% 3.7% 2.7%
Construction 1.8% 1.7% 2.4% 1.5% 2.5%

LilladherPrabhudas Financials
Source: Company Data, Bloomberg, PL Research
P/BV
1/2/2015 73
Balance Sheet (Rs m)
FY13 FY14 FY15E FY16E FY17E
Net worth 326,769 358,951 394,680 442,294 498,834
Total depos its 3,915,601 4,513,968 5,082,730 5,875,636 6,939,126
Borrowings 287,256 480,344 603,778 759,118 954,661
Total Liabilities 4,788,770 5,504,197 6,267,781 7,303,662 8,664,360
Loans 3,087,252 3,492,691 3,967,697 4,610,464 5,560,220
Investments 1,298,962 1,437,855 1,787,503 2,100,144 2,407,712
Cash/equiv 271,354 452,185 375,970 439,214 522,970
Fixed assets 33,577 34,197 36,249 38,424 40,730
Total Assets 4,788,770 5,504,199 6,267,781 7,303,662 8,664,360
Credit growth 5.7% 15.3% 14.1% 16.3% 20.3%
Low-cost deposits 39.2% 38.3% 39.7% 39.5% 40.0%
Gross NPA ratio 4.4% 5.4% 5.7% 5.2% 4.5%
Provision coverage 46.3% 47.5% 47.1% 49.5% 54.2%
LLP/average loans 1.2% 1.5% 1.4% 1.4% 1.3%
- Tier 1 9.8% 8.9% 8.6% 8.4% 7.9%
Source: Company Data, PL Research
Income Statement (Rs m)
FY13 FY14 FY15E FY16E FY17E
Net Interest Income 148,565 161,460 176,389 205,214 238,490
Fees 37,293 40,274 44,942 50,260 58,071
Operating Expense 81,651 93,382 103,988 120,133 138,963
Operating profi t 104,208 108,351 117,343 135,341 157,598
Provis ions 43,856 66,939 59,643 60,272 67,619
PBT 65,218 46,905 61,271 80,599 95,509
PAT 47,477 33,426 41,051 54,001 63,991
Reported PAT 47,477 33,426 41,051 54,001 63,991
PPP growth 2.8% 4.4% 6.2% 16.5% 15.8%
PAT growth -2.8% -29.6% 22.8% 31.5% 18.5%
Source: Company Data, PL Research
ROA decomposition FY13 FY14 FY15E FY16E FY17E
Net Interest Income/Assets 3.3% 3.2% 3.1% 3.1% 3.0%
Fees/Assets 0.8% 0.8% 0.8% 0.8% 0.7%
Investment profi ts/Assets 0.1% 0.1% 0.1% 0.1% 0.1%
Net revenues/Assets 4.2% 4.1% 3.9% 3.9% 3.9%
Operating Expense/Assets -1.8% -1.9% -1.8% -1.8% -1.8%
Provis ions/Assets -1.0% -1.3% -1.0% -0.9% -0.9%
Taxes/Assets -0.4% -0.3% -0.4% -0.4% -0.4%
Total Costs/Assets -3.1% -3.5% -3.2% -3.1% -3.0%
ROA 1.0% 0.7% 0.7% 0.8% 0.8%
Equity/Assets 6.6% 6.8% 6.5% 6.3% 6.0%
ROE 16.5% 10.2% 11.3% 13.4% 14.0%
RORWA 1.5% 1.0% 1.0% 1.2% 1.2%
Source: Company Data, PL Research
0.5
0.7
0.9
1.1
1.3
1.5
1.7
1.9
2.1
2.3
2.5
De
c-0
9
Mar
-10
Jun
-10
Sep
-10
De
c-1
0
Mar
-11
Jun
-11
Sep
-11
De
c-1
1
Mar
-12
Jun
-12
Sep
-12
De
c-1
2
Mar
-13
Jun
-13
Sep
-13
De
c-1
3
Mar
-14
Jun
-14
Sep
-14
De
c-1
4
P/ABV 5 yr avg. avg. + 1 SD avg. - 1 SD

LilladherPrabhudas State Bank of India
CMP: Rs314 TP: Rs350 Rating: BUY MCap: Rs2,342.4bn
SBI appears to have crossed the worst of the asset quality cycle as fresh slippage rate has declined to 2.9% in 1HFY15 vs ~4% in 1HFY14 and management guiding for positive trends ahead. SBIN undoubtedly has one of the best liability franchise which will enable the bank to compete aggressively as rate environment eases and corporate loan demand starts to pick-up. Fresh restructuring also declined on sequential basis and the total RA portfolio remains relatively small at 3.6% of total loans. The bank is well provided on both pension/wage provisions and focus on large corporates/secured credit will help lower credit cost going forward. We retain BUY with revised PT of Rs350 as we roll‐forward our valuations to Sep‐16 book.
Opex efficiency continues; other income remains strong: SBI’s core PPoP continues to grow at a healthy rate aided by continued opex efficiency and momentum in other income growth. NII growth has been modest due to flattish trend in advances and decline in domestic margins.
Asset quality showing positive signs; restructuring pipeline stands at modest ~Rs30 bn: Asset quality held stable with fresh slippages moderating to 2.6% (3.3% in Q1FY15) while fresh restructuring also declined to Rs34.48bn. GNPLs thus remain flat on QoQ basis and appears better when compared with most other SOE banks. O/s std. restructured asset stands at 3.6% of total loans. SBIN guided for restructuring pipeline of Rs30 bn going ahead.
Return ratios to improve; reiterate BUY with revised PT of Rs350: We estimate SBIN’s RoA to improve gradually over next two years as – (i) provisioning expenses moderates in line with improving asset quality; bank is already going slow on mid-corporate and SME segments for few quarters now, (ii) CD ratio picks up and low yielding investments (30% of total assets currently) moves gradually into loans, (iii) international NIM continues to improve further. We retain our BUY rating with revised PT of Rs350, as we roll forward our valuations to Sep‐2016.
1/2/2015 74
Key Financials (Rs m)
Y/e March FY13 FY14 FY15E FY16E FY17E
Net interest income 443,313 492,822 542,852 622,746 716,510
Growth (%) 2.4 11.2 10.2 14.7 15.1
Operating profit 310,817 321,092 363,438 427,311 507,374
PAT 141,050 108,912 134,992 166,832 206,877
EPS (Rs) 20.8 15.2 18.1 22.3 27.7
Growth (%) 16.1 -26.9 18.8 23.6 24.0
Net DPS (Rs) 4.1 1.5 3.3 3.5 3.8
Source: Company Data, PL Research
Profitability & valuation
Y/e March FY13 FY14 FY15E FY16E FY17E
NIM (%) 3.2 3.0 2.9 2.9 2.8
RoAE (%) 15.4 10.0 10.9 12.3 13.7
RoAA (%) 1.0 0.6 0.7 0.8 0.8
P / BV (x) 2.0 1.8 1.6 1.5 1.3
P / ABV (x) 3.0 2.7 2.4 2.0 1.7
PE (x) 15.1 20.6 17.4 14.0 11.3
Net dividend yield (%) 1.3 0.5 1.0 1.1 1.2
Source: Company Data, PL Research
Stock Performance
(%) 1M 6M 12M
Absolute (1.8) 17.2 77.9
Relative to Sensex 1.9 9.4 47.8

LilladherPrabhudas Operating Metrics
Source: Company Data, PL Research
Source: Company Data, PL Research *Rolling chart 1 year forward on weekly basis
Loan growth in mid-corp & SME has come down as NPAs rise
SBI’s premium over PSBs is 40%
Source: Company Data, PL Research
SBI’s has been better off v/s peers in terms of restructuring
Source: Company Data, PL Research
ROAs to improve as Opex cost to move down
1/2/2015 75
2.5%3.0%
4.1%4.8%
7.0% 7.0%
10.3%
2.0%
3.0%
4.0%
5.0%
6.0%
7.0%
8.0%
9.0%
10.0%
11.0%
Axis BOI ICICI SBI BOB Union PNB
O/s Restructured book % of 2Q15 Loan book
0.40%
0.50%
0.60%
0.70%
0.80%
0.90%
1.00%
1.10%
1.20%
0.50%
0.60%
0.70%
0.80%
0.90%
1.00%
1.10%
FY11 FY12 FY13 FY14 FY15E FY16E FY17E
ROAs Opex / Assets (RHS)
-5.0%
0.0%
5.0%
10.0%
15.0%
20.0%
25.0%
30.0%
35.0%
6.0%
7.0%
8.0%
9.0%
10.0%
11.0%
12.0%
13.0%
3Q13 4Q13 1Q14 2Q14 3Q14 4Q14 1Q15 2Q15
Mid-corp NPA SME NPA Mid-corp loan growth SME loan growth
-40%
-10%
20%
50%
80%
110%
140%
170%
Nov
-08
Mar
-09
Jul-
09
Nov
-09
Mar
-10
Jul-
10
Nov
-10
Mar
-11
Jul-
11
Nov
-11
Mar
-12
Jul-
12
Nov
-12
Mar
-13
Jul-
13
Nov
-13
Mar
-14
Jul-
14
Nov
-14
SBI v/s BOB/PNB ICICI/Axis v/s SBI

LilladherPrabhudas Financials
Source: Company Data, Bloomberg, PL Research
P/BV
1/2/2015 76
Balance Sheet (Rs m)
FY13 FY14 FY15E FY16E FY17E
Net worth 988,837 1,182,822 1,287,085 1,420,823 1,592,242
Total depos its 12,027,396 13,944,085 15,924,145 18,806,415 22,304,409
Borrowings 1,289,535 1,405,498 1,628,874 2,018,448 2,501,631
Total Liabilities 15,662,609 17,922,346 20,307,892 23,815,232 28,076,127
Loans 10,456,165 12,098,287 13,683,163 15,981,934 18,890,646
Investments 3,509,273 3,983,082 4,641,409 5,543,017 6,506,627
Cash/equiv 1,148,202 1,325,496 1,421,908 1,660,673 1,972,764
Fixed assets 70,050 80,022 88,504 99,478 111,814
Total Assets 15,662,609 17,922,346 20,307,892 23,815,232 28,076,127
Credit growth 22.0% 15.0% 13.2% 16.9% 18.2%
Low-cost deposits 44.8% 42.9% 42.7% 43.6% 43.9%
Gross NPA ratio 4.8% 5.0% 4.6% 4.2% 3.7%
Provision coverage 55.8% 48.1% 48.1% 49.0% 50.8%
LLP/average loans 1.2% 1.4% 1.2% 1.2% 1.1%
- Tier 1 9.5% 9.7% 9.4% 9.1% 8.8%
Source: Company Data, PL Research
Income Statement (Rs m)
FY13 FY14 FY15E FY16E FY17E
Net Interest Income 443,313 492,822 542,852 622,746 716,510
Fees 149,367 164,762 188,922 208,397 228,742
Operating Expense 292,844 357,259 383,496 428,088 476,688
Operating profi t 299,836 300,325 348,278 403,055 468,564
Provis ions 111,308 159,354 161,957 178,308 198,602
PBT 199,509 161,739 201,481 249,003 308,772
PAT 141,050 108,912 134,992 166,832 206,877
Reported PAT 141,050 108,912 134,992 166,832 206,877
PPP growth -1.6% 3.3% 13.2% 17.6% 18.7%
PAT growth 20.5% -22.8% 23.9% 23.6% 24.0%
Source: Company Data, PL Research
ROA decomposition
FY13 FY14 FY15E FY16E FY17E
Net Interest Income/Assets 3.2% 3.0% 2.9% 2.9% 2.8%
Fees/Assets 1.1% 1.0% 1.0% 1.0% 0.9%
Investment profi ts/Assets 0.1% 0.1% 0.1% 0.1% 0.2%
Net revenues/Assets 4.3% 4.2% 4.0% 4.0% 3.9%
Operating Expense/Assets -2.1% -2.2% -2.1% -2.0% -1.9%
Provis ions/Assets -0.8% -1.0% -0.9% -0.8% -0.8%
Taxes/Assets -0.4% -0.3% -0.4% -0.4% -0.4%
Total Costs/Assets -3.3% -3.5% -3.3% -3.2% -3.1%
ROA 1.0% 0.7% 0.7% 0.8% 0.8%
Equity/Assets 6.6% 6.7% 6.6% 6.3% 6.0%
ROE 15.4% 10.0% 10.9% 12.3% 13.7%
RORWA 1.5% 1.0% 1.1% 1.2% 1.3%
Source: Company Data, PL Research
1.0
1.5
2.0
2.5
3.0
3.5
4.0
De
c-0
9
Mar
-10
Jun
-10
Sep
-10
De
c-1
0
Mar
-11
Jun
-11
Sep
-11
De
c-1
1
Mar
-12
Jun
-12
Sep
-12
De
c-1
2
Mar
-13
Jun
-13
Sep
-13
De
c-1
3
Mar
-14
Jun
-14
Sep
-14
De
c-1
4
P/ABV 5 yr avg. avg. + 1 SD avg. - 1 SD

LilladherPrabhudas Union Bank of India
CMP: Rs243 TP: Rs255 Rating: BUY MCap: Rs152.8bn
Union Bank has adopted a cautious approach on loan growth as fresh slippages remain high while capital position remain scarce. During Q2FY15, NIMs contracted by 7bp QoQ due to interest reversals (Rs730 mn) on new slippages and ~14% QoQ decline in current account deposits. Asset quality disappointment continued as fresh slippages stood at Rs19.68bn (3.4% annualized) and was led by lumpy slippages in textile and cement sectors. However management maintained its guidance to bring down GNPL ratio to ~4% by end of FY15 vs 4.7% currently and improve NIM to 2.8‐2.9%. We upgrade our rating to BUY from Accumulate with PT of Rs255 which corresponds to 0.9x Sep‐16E ABV.
Fee/Fx income drives revenue growth: UNBK reported steady revenue growth led by healthy uptick in core fee income and robust exchange profits. NII growth was muted at 6.6% YoY affected by interest reversals on slipped accounts, declining current account deposits and modest loan growth.
Asset quality disappoints – management keeps the guidance unchanged: Asset quality remains worrisome as stressed asset formation remained high led by rise in both fresh slippages and restructuring. O/s restructured asset portfolio increased marginally to 5.3% of total loans (2.8% excluding SEB restructuring) though still stands better than peers. Management maintained its guidance to bring down GNPL ratio to ~4% and improve NIM to 2.8‐2.9% by FY15 end which we believe is difficult to achieve.
Capital position remains weak; muted growth to help in short term: Tier I capital at 7.3% (without profits) in Q2FY15 remains low but is not expected to be alarming as management reiterated of slowing loan growth to 10‐12% for FY15, helping maintain capital levels and pre‐empt the need for immediate capital infusion. We upgrade our rating to BUY from Accumulate with PT of Rs255/share which corresponds to 0.9x Sep‐16E ABV.
1/2/2015 77
Key Financials (Rs m)
Y/e March FY13 FY14 FY15E FY16E FY17E
Net interest income 75,428 78,793 88,809 105,604 123,847
Growth (%) 9.2 4.5 12.7 18.9 17.3
Operating profit 55,827 52,181 55,959 69,428 83,074
PAT 21,579 16,962 23,679 30,665 38,167
EPS (Rs) 37.6 27.6 37.6 48.7 60.6
Growth (%) 13.1 -26.5 35.9 29.5 24.5
Net DPS (Rs) 8.2 4.2 5.0 5.5 5.5
Source: Company Data, PL Research
Profitability & valuation
Y/e March FY13 FY14 FY15E FY16E FY17E
NIM (%) 2.7 2.4 2.4 2.5 2.6
RoAE (%) 13.5 9.5 12.2 14.1 15.4
RoAA (%) 0.8 0.5 0.6 0.7 0.8
P / BV (x) 0.9 0.8 0.7 0.6 0.5
P / ABV (x) 1.3 1.2 1.0 0.8 0.7
PE (x) 6.4 8.8 6.5 5.0 4.0
Net dividend yield (%) 3.4 1.7 2.1 2.3 2.3
Source: Company Data, PL Research
Stock Performance
(%) 1M 6M 12M
Absolute 10.9 2.8 83.9
Relative to Sensex 14.6 (5.0) 53.8

LilladherPrabhudas Operating Metrics
Source: Company Data, PL Research
Source: Company Data, PL Research
..as a result Union Bank has slowed down on loan growth
..on improvement in NIMs and reduction in Credit Cost
Source: Company Data, PL Research
Return ratios should start improving….
Source: Company Data, PL Research
Union Bank’s Tier-I is equally critical as BOI
1/2/2015 78
10.1%
9.5%
8.7%
8.0%
7.3%
6.0%
6.5%
7.0%
7.5%
8.0%
8.5%
9.0%
9.5%
10.0%
10.5%
SBI BOB PNB BOI Union
2Q15 - B3 Tier-I
0.0%
5.0%
10.0%
15.0%
20.0%
25.0%
30.0%
35.0%
1Q
11
2Q
11
3Q
11
4Q
11
1Q
12
2Q
12
3Q
12
4Q
12
1Q
13
2Q
13
3Q
13
4Q
13
1Q
14
2Q
14
3Q
14
4Q
14
1Q
15
2Q
15
Loan Growth %
1.37%1.26%
1.20%
0.99%
0.74% 0.77%
0.52%0.65%
0.74%0.79%
28.8%27.2%
26.2%
20.9%
14.9% 15.0%
10.4%
13.2%15.2%
16.4%
0.30%
0.50%
0.70%
0.90%
1.10%
1.30%
1.50%
8.0%
13.0%
18.0%
23.0%
28.0%
33.0%
FY
08
FY09
FY10
FY11
FY12
FY13
FY14
FY
15
E
FY
16
E
FY17
E
ROE ROAs (RHS)
0.85%0.90% 0.87%
0.95%
1.06%
0.92%
1.10%
0.90% 0.88% 0.87%
2.63%2.79%
2.43%
2.97%2.85%
2.69%
2.42%
2.43%2.54% 2.57%
0.60%
0.70%
0.80%
0.90%
1.00%
1.10%
1.20%
1.50%
1.70%
1.90%
2.10%
2.30%
2.50%
2.70%
2.90%
3.10%
FY
08
FY09
FY10
FY11
FY12
FY13
FY14
FY
15
E
FY
16
E
FY17
E
NIMs (RHS) Credit Cost

LilladherPrabhudas Financials
Source: Company Data, Bloomberg, PL Research
P/BV
1/2/2015 79
Balance Sheet (Rs m)
FY13 FY14 FY15E FY16E FY17E
Net worth 171,852 183,644 203,635 230,245 264,356
Total depos its 2,637,616 2,976,756 3,298,246 3,766,597 4,391,852
Borrowings 170,073 207,766 252,911 307,875 374,796
Total Liabilities 3,117,498 3,536,699 3,949,952 4,529,828 5,290,058
Loans 2,081,022 2,291,044 2,556,805 2,930,099 3,428,216
Investments 808,304 937,232 1,098,397 1,264,053 1,476,375
Cash/equiv 162,104 230,729 209,677 242,433 283,159
Fixed assets 24,790 26,085 27,137 28,222 29,351
Total Assets 3,118,608 3,537,809 3,951,062 4,530,938 5,291,168
Credit growth 17.6% 12.3% 11.9% 14.6% 17.0%
Low-cost deposits 31.0% 29.5% 32.1% 32.1% 32.1%
Gross NPA ratio 3.0% 4.2% 4.4% 4.2% 3.8%
Provision coverage 46.0% 44.2% 43.3% 46.3% 49.4%
LLP/average loans 0.9% 1.1% 0.9% 0.9% 0.9%
- Tier 1 8.2% 7.5% 7.5% 7.5% 7.4%
Source: Company Data, PL Research
Income Statement (Rs m)
FY13 FY14 FY15E FY16E FY17E
Net Interest Income 75,428 78,793 88,809 105,604 123,847
Fees 20,748 23,358 31,319 37,144 43,162
Operating Expense 45,122 54,828 64,169 73,320 83,934
Operating profi t 51,054 47,324 55,959 69,428 83,074
Provis ions 25,184 28,981 21,642 24,986 27,760
PBT 30,643 23,200 34,317 44,442 55,314
PAT 21,579 16,962 23,679 30,665 38,167
Reported PAT 21,579 16,962 23,679 30,665 38,167
PPP growth 6.3% -6.5% 7.2% 24.1% 19.7%
PAT growth 20.7% -21.4% 39.6% 29.5% 24.5%
Source: Company Data, PL Research
ROA decomposition
FY13 FY14 FY15E FY16E FY17E
Net Interest Income/Assets 2.7% 2.4% 2.4% 2.5% 2.6%
Fees/Assets 0.7% 0.7% 0.9% 0.9% 0.9%
Investment profi ts/Assets 0.2% 0.1% 0.0% 0.0% 0.0%
Net revenues/Assets 3.6% 3.3% 3.3% 3.4% 3.5%
Operating Expense/Assets -1.6% -1.7% -1.8% -1.8% -1.7%
Provis ions/Assets -0.9% -0.9% -0.6% -0.6% -0.6%
Taxes/Assets -0.3% -0.2% -0.3% -0.3% -0.4%
Total Costs/Assets -2.8% -2.8% -2.6% -2.7% -2.7%
ROA 0.8% 0.5% 0.6% 0.7% 0.8%
Equity/Assets 5.7% 5.5% 5.3% 5.2% 5.1%
ROE 15.0% 10.4% 13.2% 15.2% 16.4%
RORWA 1.2% 0.8% 1.0% 1.1% 1.2%
Source: Company Data, PL Research
0.0
0.5
1.0
1.5
2.0
2.5
De
c-0
9
Mar
-10
Jun
-10
Sep
-10
De
c-1
0
Mar
-11
Jun
-11
Sep
-11
De
c-1
1
Mar
-12
Jun
-12
Sep
-12
De
c-1
2
Mar
-13
Jun
-13
Sep
-13
De
c-1
3
Mar
-14
Jun
-14
Sep
-14
De
c-1
4
P/ABV 5 yr avg. avg. + 1 SD avg. - 1 SD

LilladherPrabhudas Federal Bank
CMP: Rs150 TP: Rs165 Rating: BUY MCap: Rs128.4bn
Realigned Business model: Federal Bank undertook restructuring of its business model over the past couple of years, wherein it realigned some of its business processes and changed its focus on loan-mix towards high yielding and less risky assets like SME/Retail (LAP & Gold loans). It also started focusing on retail liability play with high focus on retail term deposit and by cutting reliance on Bulk deposit (now only ~7% of deposits from 15% in FY13). We believe that the structural change in business model, coupled with thrust on expanding beyond Kerala, will help the bank grow strongly in next couple of years. We are factoring in 17%/20% credit growth over FY15E and FY16E respectively.
Looking for fresh avenues of fee income: The Bank is cognizant on its fee income being weak, so is looking to introduce newer fee income avenues over next 2 years. It wants to improve its merchant banking, third party distribution, rationalization and centralizing process for FX fees, loan related fees, account related charges etc. It also has revamped its treasury division. It also is in process to strengthen its trade finance & cash management business for fee income.
Margins to improve gradually: Margins will improve gradually as management has put in efforts to rationalize process in terms of credit appraisal system reducing slippages (reduced interest reversals). Also, higher focus on SME/Retail especially LAP & Gold will help improve its margins upwards in FY15/FY16. On the liability side, higher term deposit reliance will not impact cost of funds in downward rate cycle as average tenure of the deposits is 1.4 years with 45% of deposits in 1-3 year bucket.
Valuations justified: Federal trades at 1.4x Sep FY16, which we believe in is reasonable for its changing business mix, superior management, improving & rationalizing processes will help achieve higher ROAs from 1.2% currently. The Bank has leadership position in Kerala and is now also focusing outside Kerala, in Maharashtra, AP, Gujarat which are strong SME/Retail driven and matches with the Bank’s strategy.
1/2/2015 80
Key Financials (Rs m)
Y/e March FY13 FY14 FY15E FY16E FY17E
Net interest income 19,747 22,286 23,712 27,178 32,726
Growth (%) 1.1 12.9 6.4 14.6 20.4
Operating profit 14,596 14,804 16,206 19,343 23,978
PAT 8,382 8,389 9,564 11,495 14,166
EPS (Rs) 9.8 9.8 11.2 13.4 16.6
Growth (%) 7.9 0.1 14.0 20.2 23.2
Net DPS (Rs) 1.8 2.0 2.3 2.7 3.4
Source: Company Data, PL Research
Profitability & valuation
Y/e March FY13 FY14 FY15E FY16E FY17E
NIM (%) 3.1 3.2 3.1 3.0 3.0
RoAE (%) 13.9 12.6 13.1 14.2 15.6
RoAA (%) 1.3 1.2 1.2 1.2 1.3
P / BV (x) 2.0 1.8 1.7 1.5 1.3
P / ABV (x) 2.2 1.9 1.8 1.6 1.4
PE (x) 15.3 15.3 13.4 11.2 9.1
Net dividend yield (%) 1.2 1.3 1.5 1.8 2.2
Source: Company Data, PL Research
Stock Performance
(%) 1M 6M 12M
Absolute 1.6 14.3 73.9
Relative to Sensex 5.3 6.5 43.8

LilladherPrabhudas Operating Metrics
Source: Company Data, PL research
Source: Company Data, PL research
CASA growth accretion still has been better despite recent slowdown
Return ratios to improve further on and will be led by reduction in costs
Source: Company Data, PL research
Federal Bank commands better Return ratios v/s regional peers
Source: Company Data, PL Research
Loan growth should improve after consolidation in FY14
1/2/2015 81
-5.0%
0.0%
5.0%
10.0%
15.0%
20.0%
25.0%
1Q
12
2Q
12
3Q
12
4Q
12
1Q
13
2Q
13
3Q
13
4Q
13
1Q
14
2Q
14
3Q
14
4Q
14
1Q
15
2Q
15
FY15
E
FY16
E
FY17
E
Loan Growth
1.91%
1.24%
1.40%
1.14%
1.54%
1.02%
1.76%
0.98%
0.50%
0.70%
0.90%
1.10%
1.30%
1.50%
1.70%
1.90%
2.10%
RORWAs ROAs
Federal ING J&K SIB
1.00%
1.10%
1.20%
1.30%
1.40%
1.50%
2.00%
2.50%
3.00%
3.50%
4.00%
FY
08
FY09
FY10
FY11
FY12
FY13
FY14
FY
15
E
FY
16
E
FY17
E
Cost/Assets ROAs (RHS)
5.0%
10.0%
15.0%
20.0%
25.0%
50
70
90
110
130
150
170
190
210
3Q
11
4Q
11
1Q
12
2Q
12
3Q
12
4Q
12
1Q
13
2Q
13
3Q
13
4Q
13
1Q
14
2Q
14
3Q
14
4Q
14
1Q
15
2Q
15
CASA (Rs bn) YoY gr. (RHS)

LilladherPrabhudas Financials
Source: Company Data, Bloomberg, PL Research
P/BV
1/2/2015 82
Balance Sheet (Rs m)
FY13 FY14 FY15E FY16E FY17E
Net worth 63,595 69,456 76,738 85,490 96,276
Total depos its 576,149 597,313 690,919 821,504 982,713
Borrowings 51,870 56,880 62,480 77,550 92,637
Total Liabilities 710,444 745,891 854,139 1,012,770 1,205,456
Loans 440,967 434,361 510,374 617,553 747,239
Investments 211,546 241,179 266,675 304,503 350,159
Cash/equiv 37,200 45,294 50,105 59,493 71,305
Fixed assets 3,923 4,199 4,476 4,753 5,030
Total Assets 710,444 745,891 854,139 1,012,770 1,205,456
Credit growth 16.0% -0.5% 17.4% 20.8% 20.8%
Low-cost deposits 27.2% 31.2% 32.3% 32.4% 32.5%
Gross NPA ratio 3.4% 2.5% 2.3% 2.1% 2.1%
Provision coverage 71.5% 69.9% 69.0% 69.1% 69.1%
LLP/average loans 0.6% 0.6% 0.5% 0.5% 0.5%
- Tier 1 14.1% 14.6% 13.8% 12.7% 11.9%
Source: Company Data, PL Research
Income Statement (Rs m)
FY13 FY14 FY15E FY16E FY17E
Net Interest Income 19,747 22,286 23,712 27,178 32,726
Fees 4,585 5,363 6,344 7,451 8,751
Operating Expense 11,795 14,421 15,476 17,035 19,199
Operating profi t 12,536 13,229 14,581 17,593 22,278
Provis ions 2,658 2,684 2,445 2,684 3,448
PBT 11,938 12,120 13,761 16,659 20,530
PAT 8,382 8,389 9,564 11,495 14,166
Reported PAT 8,382 8,389 9,564 11,495 14,166
PPP growth -3.1% 1.4% 9.5% 19.4% 24.0%
PAT growth 7.9% 0.1% 14.0% 20.2% 23.2%
Source: Company Data, PL Research
ROA decomposition
FY13 FY14 FY15E FY16E FY17E
Net Interest Income/Assets 3.1% 3.2% 3.1% 3.0% 3.0%
Fees/Assets 0.7% 0.8% 0.8% 0.8% 0.8%
Investment profi ts/Assets 0.3% 0.2% 0.2% 0.2% 0.2%
Net revenues/Assets 4.1% 4.1% 4.1% 4.0% 4.0%
Operating Expense/Assets -1.8% -2.0% -2.0% -1.9% -1.8%
Provis ions/Assets -0.4% -0.4% -0.3% -0.3% -0.3%
Taxes/Assets -0.6% -0.5% -0.5% -0.6% -0.6%
Total Costs/Assets -2.8% -3.0% -2.9% -2.8% -2.7%
ROA 1.3% 1.2% 1.2% 1.3% 1.3%
Equity/Assets 9.4% 9.4% 9.4% 9.0% 8.5%
ROE 13.9% 12.6% 13.1% 14.2% 15.6%
RORWA 2.1% 1.9% 1.9% 1.9% 2.0%
Source: Company Data, PL Research
0.5
0.7
0.9
1.1
1.3
1.5
1.7
1.9
De
c-0
9
Mar
-10
Jun
-10
Sep
-10
De
c-1
0
Mar
-11
Jun
-11
Sep
-11
De
c-1
1
Mar
-12
Jun
-12
Sep
-12
De
c-1
2
Mar
-13
Jun
-13
Sep
-13
De
c-1
3
Mar
-14
Jun
-14
Sep
-14
De
c-1
4
P/ABV 5 yr avg. avg. + 1 SD avg. - 1 SD

LilladherPrabhudas Jammu & Kashmir Bank
CMP: Rs150 TP: Rs165 Rating: Accumulate MCap: Rs72.8bn
Slowdown in loan book in FY15, pick-up seen in FY16/17: J&K bank’s loan growth has come off from 20-25% in H1FY13 to ~9.5% in H1FY15. J&K state has ~45% share of loan book and has been the growth driver. The management has guided for a lower growth of 15-20% within the J&K state from 20-25%, as the state has witnessed worst floods over the decades impacting loan demand. However, the management of the bank has guided that FY16 growth is likely to come back as J&K state would need credit post the natural calamity.
Margins to remain intact: J&K Bank earns higher margins of ~6% in J&K state and ~2.7% which brings the blended margins at ~4% and is the highest among regional banks. Although margins may be impacted slightly in near term on lower loan growth but better CASA and higher retail share would keep margins intact near ~4%. Unlike Q1FY15, we do not see large interest reversals which can impact margins in H2FY15 as well as FY16.
Asset quality on stabilization mode: Asset quality has deteriorated sharply in Q1FY15 on slippage of two large accounts into NPA, while large impact was anticipated on floods but was absorbed by restructuring package approved by RBI & J&K SLBC. It has received cases worth Rs8.3bn of which Rs1.64bn have been approved under the scheme and rest Rs6.6bn will be approved in H2FY15. Bank also expects some more additional cases of Rs5-7bn in the restructuring package. Under the package Bank has converted existing loans to term loan with moratorium of 2 years and duration of loans to 3-5years.
Multiples to move back gradually: Non-J&K book growth remains slow and now management has guided for slower growth for J&K state impacting earnings traction in near term. However FY15E ROAs of ~1% still remains better than SOE banks and we believe earnings multiple will move back to trend levels of 1.1x-1.3x gradually from 0.8x currently (Sep-16 book).
1/2/2015 83
Key Financials (Rs m)
Y/e March FY13 FY14 FY15E FY16E FY17E
Net interest income 23,160 26,845 28,705 32,925 38,627
Growth (%) 26.0 15.9 6.9 14.7 17.3
Operating profit 18,108 18,998 18,728 21,270 24,937
PAT 10,551 11,825 8,364 12,574 15,098
EPS (Rs) 21.8 24.4 17.2 25.9 31.1
Growth (%) 31.4 12.1 -29.3 50.3 20.1
Net DPS (Rs) 5.0 5.0 4.0 4.0 4.0
Source: Company Data, PL Research
Profitability & valuation
Y/e March FY13 FY14 FY15E FY16E FY17E
NIM (%) 3.6 3.6 3.5 3.5 3.5
RoAE (%) 23.6 22.3 13.9 18.4 18.9
RoAA (%) 1.6 1.6 1.0 1.3 1.3
P / BV (x) 1.5 1.3 1.1 1.0 0.8
P / ABV (x) 1.5 1.3 1.3 1.1 0.9
PE (x) 6.9 6.2 8.7 5.8 4.8
Net dividend yield (%) 3.3 3.3 2.7 2.7 2.7
Source: Company Data, PL Research
Stock Performance
(%) 1M 6M 12M
Absolute 7.5 (5.2) 4.7
Relative to Sensex 11.2 (13.0) (25.4)

LilladherPrabhudas Operating Metrics
Source: Company Data, PL research
Source: Company Data, PL research
Despite, J&K bank having highest market share, NPAs are the lowest
FY15E return ratios turned suboptimal, should rebound in FY16E/FY17E
Source: Company Data, PL research
We expect credit costs to start moving downwards to normalized levels
Source: Company Data, PL research
J&K loan book growth has slowed down with trend continuing further
1/2/2015 84
-0.50%
0.00%
0.50%
1.00%
1.50%
2.00%
2.50%
1Q11
2Q11
3Q11
4Q11
1Q12
2Q12
3Q12
4Q12
1Q13
2Q13
3Q13
4Q13
1Q14
2Q14
3Q14
4Q14
1Q15
2Q15
FY15
E
FY16
E
FY17
ECredit Costs
2.5%
3.7%
11.2%
63.2%
13.8% 4.7%0.0%
2.0%
4.0%
6.0%
8.0%
10.0%
12.0%
0.0%
10.0%
20.0%
30.0%
40.0%
50.0%
60.0%
70.0%
J&K SBI PNB
Market Share of Advances in J&K State NPA (RHS)
0.5%
0.8%
1.1%
1.4%
1.7%
2.0%
2.3%
2.6%
10.0%
12.0%
14.0%
16.0%
18.0%
20.0%
22.0%
24.0%
26.0%
FY
06
FY07
FY08
FY09
FY11
FY
12
FY13
FY14
FY15
E
FY16
E
FY
17
E
ROEs ROA (RHS) RORWAs (RHS)
0.0%
5.0%
10.0%
15.0%
20.0%
25.0%
30.0%
35.0%
40.0%
4Q
12
1Q
13
2Q
13
3Q
13
4Q
13
1Q
14
2Q
14
3Q
14
4Q
14
1Q
15
2Q
15
J&K state loan growth Non-J&K state loan growth

LilladherPrabhudas Financials
Source: Company Data, Bloomberg, PL Research
P/BV
1/2/2015 85
Balance Sheet (Rs m)
FY13 FY14 FY15E FY16E FY17E
Net worth 48,647 57,236 63,329 63,329 63,329
Total depos its 642,206 693,359 783,285 903,564 1,059,460
Borrowings 10,750 17,650 29,925 36,295 43,071
Total Liabilities 717,433 786,197 897,072 1,037,223 1,216,829
Loans 392,004 463,846 528,784 618,678 736,227
Investments 257,411 261,951 298,447 338,004 386,538
Cash/equiv 54,043 42,139 48,945 56,567 66,358
Fixed assets 4,562 5,338 6,114 6,891 7,667
Total Assets 717,433 786,197 897,072 1,037,223 1,216,829
Credit growth 18.7% 16.3% 13.8% 16.7% 18.7%
Low-cost deposits 39.2% 39.1% 39.1% 39.1% 39.1%
Gross NPA ratio 1.6% 1.7% 4.1% 3.7% 3.2%
Provision coverage 91.3% 86.8% 54.0% 59.1% 64.3%
LLP/average loans 0.6% 0.3% 1.2% 0.5% 0.4%
- Tier 1 10.9% 11.2% 10.9% 10.8% 10.7%
Source: Company Data, PL Research
Income Statement (Rs m)
FY13 FY14 FY15E FY16E FY17E
Net Interest Income 23,160 26,845 28,705 32,925 38,627
Fees 3,344 3,266 3,559 4,051 4,658
Operating Expense 9,890 11,750 14,286 16,556 19,198
Operating profi t 16,614 18,361 17,978 20,420 24,087
Provis ions 2,842 1,477 6,055 2,779 2,735
PBT 15,266 17,520 12,672 18,491 22,203
PAT 10,551 11,825 8,364 12,574 15,098
Reported PAT 10,551 11,825 8,364 12,574 15,098
PPP growth 32.1% 4.9% -1.4% 13.6% 17.2%
PAT growth 31.4% 12.1% -29.3% 50.3% 20.1%
Source: Company Data, PL Research
ROA decomposition
FY13 FY14E FY15E FY16E FY17E
NIM/Assets 3.6% 3.6% 3.5% 3.5% 3.5%
Fees/Assets 0.5% 0.4% 0.4% 0.4% 0.4%
Inv. Profi ts/Assets 0.2% 0.1% 0.1% 0.1% 0.1%
Net revenues/Assets 4.3% 4.2% 4.0% 4.0% 4.0%
Opex/Assets -1.5% -1.6% -1.7% -1.8% -1.7%
Provis ions/Assets -0.4% -0.2% -0.7% -0.3% -0.2%
Taxes/Assets -0.7% -0.8% -0.5% -0.6% -0.6%
Costs/Assets -2.7% -2.6% -3.0% -2.7% -2.6%
ROA 1.6% 1.6% 1.0% 1.3% 1.4%
Equity/Assets 6.9% 7.2% 7.3% 7.2% 7.3%
ROE 23.6% 22.3% 13.9% 18.4% 18.9%
RORWA 2.6% 2.5% 1.5% 2.0% 2.0%
Source: Company Data, PL Research
0.5
0.7
0.9
1.1
1.3
1.5
De
c-0
9
Mar
-10
Jun
-10
Sep
-10
De
c-1
0
Mar
-11
Jun
-11
Sep
-11
De
c-1
1
Mar
-12
Jun
-12
Sep
-12
De
c-1
2
Mar
-13
Jun
-13
Sep
-13
De
c-1
3
Mar
-14
Jun
-14
Sep
-14
De
c-1
4
P/ABV 5 yr avg. avg. + 1 SD avg. - 1 SD

LilladherPrabhudas South Indian Bank
CMP: Rs29 TP: Rs35 Rating: BUY MCap: Rs39.0bn
SIB’s return ratios have suffered on structural issues like low CASA, low PSL compliance, NRI deposit de-regularization, lowering fee income and increased credit costs. SIB’s loan book growth also has come down to 15% CAGR over FY14-H2FY15 from 25% during FY08-13. But, we believe, all the structural issues like asset quality risks & moderation of return ratios have been factored in P/B multiples which is at 30% discount to regional peers. We remain positive on the stock with TP of Rs35.
Profitability to remain under pressure: Bank’s gold loan business, earlier a high growth area, coupled with higher yields, has seen a sharp reversal, slowing down overall loan growth and has put pressure on yields. It has another 5‐10% chunky gold loans above Rs0.1m which could unwound over the next few quarters (gold loan share down from 22.6% in Q4FY14 to 17% now), which can impact margins at book level. Also, its Opex & Credit cost will remain high. Credit cost have remained upwards of 1% in H1FY15.
Asset quality has turned weak, but management confident on outlook: Some slippages from restructured book, lower recoveries and upgrade has impacted asset quality in last few quarters. In Q2FY15, SIB also sold one a/c to ARC at below book (Rs580m) and has provided for the same in P&L. Management is confident on better asset quality and focus on CASA will bring back NIMs at 3%. The bank is planning a QIP of Rs6bn and has taken board approval for the same.
Valuations undemanding: SIB’s high stressed assets book (6.5% of loans in Q2FY15) v/s regional peers have impacted earnings and consequently impacted its return ratios. But, given the Bank’s business presence in Kerala & increasing expansion outside Kerala (60% incremental growth outside Kerala) with well diversified book (30% Retail & SME each and 40% Corporate book) will help expansion in margins to 3% over next couple of years. SIB is currently trading at 1x its Sep-16 book which is undemanding and hence, we maintain BUY with target price of Rs35.
1/2/2015 86
Key Financials (Rs m)
Y/e March FY13 FY14 FY15E FY16E FY17E
Net interest income 12,808 13,988 16,335 18,935 22,500
Growth (%) 25.4 9.2 16.8 15.9 18.8
Operating profit 8,486 8,843 10,166 12,032 14,716
PAT 5,023 5,075 5,549 6,603 8,489
EPS (Rs) 3.8 3.8 4.1 4.9 6.3
Growth (%) 5.9 0.6 9.3 19.0 28.6
Net DPS (Rs) 0.6 0.8 0.9 1.0 1.1
Source: Company Data, PL Research
Profitability & valuation
Y/e March FY13 FY14 FY15E FY16E FY17E
NIM (%) 2.9 2.7 2.8 2.8 2.8
RoAE (%) 20.5 16.6 16.1 16.9 18.8
RoAA (%) 1.1 1.0 0.9 1.0 1.0
P / BV (x) 1.4 1.2 1.1 0.9 0.8
P / ABV (x) 1.4 1.3 1.1 1.0 0.8
PE (x) 7.7 7.7 7.0 5.9 4.6
Net dividend yield (%) 2.1 2.8 2.9 3.3 3.6
Source: Company Data, PL Research
Stock Performance
(%) 1M 6M 12M
Absolute 6.6 (8.7) 40.1
Relative to Sensex 10.3 (16.5) 10.0
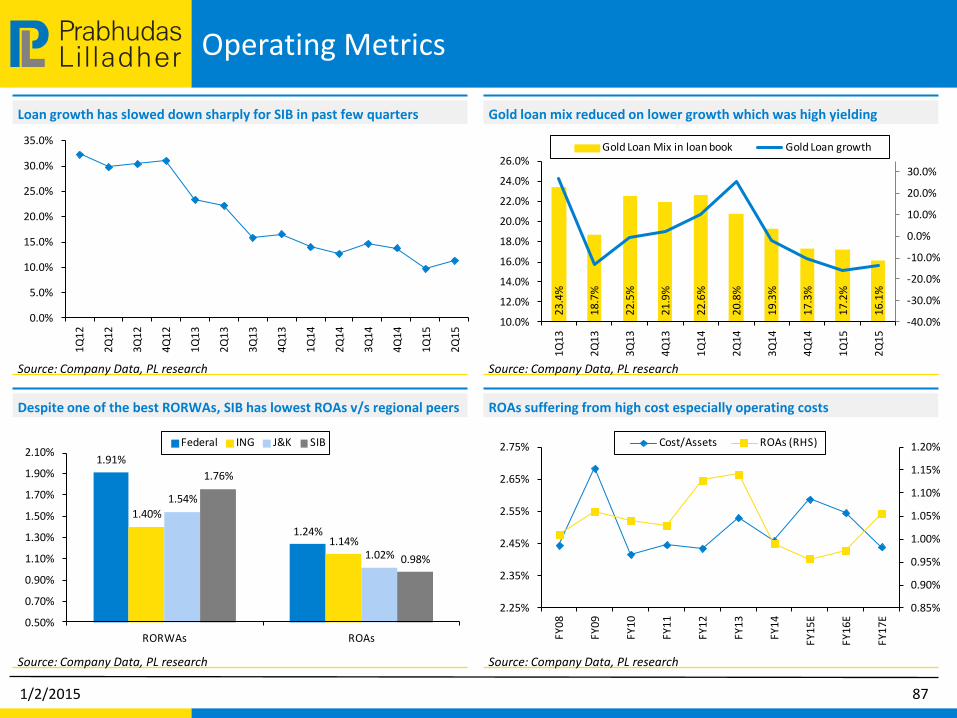
LilladherPrabhudas Operating Metrics
Source: Company Data, PL research
Source: Company Data, PL research
Gold loan mix reduced on lower growth which was high yielding
ROAs suffering from high cost especially operating costs
Source: Company Data, PL research
Despite one of the best RORWAs, SIB has lowest ROAs v/s regional peers
Source: Company Data, PL research
Loan growth has slowed down sharply for SIB in past few quarters
1/2/2015 87
0.0%
5.0%
10.0%
15.0%
20.0%
25.0%
30.0%
35.0%
1Q
12
2Q
12
3Q
12
4Q
12
1Q
13
2Q
13
3Q
13
4Q
13
1Q
14
2Q
14
3Q
14
4Q
14
1Q
15
2Q
15
23.4
%
18.7
%
22.5
%
21.9
%
22.6
%
20
.8%
19
.3%
17
.3%
17.2
%
16.1
%
-40.0%
-30.0%
-20.0%
-10.0%
0.0%
10.0%
20.0%
30.0%
10.0%
12.0%
14.0%
16.0%
18.0%
20.0%
22.0%
24.0%
26.0%
1Q
13
2Q
13
3Q
13
4Q
13
1Q
14
2Q
14
3Q
14
4Q
14
1Q
15
2Q
15
Gold Loan Mix in loan book Gold Loan growth
0.85%
0.90%
0.95%
1.00%
1.05%
1.10%
1.15%
1.20%
2.25%
2.35%
2.45%
2.55%
2.65%
2.75%
FY
08
FY09
FY10
FY11
FY12
FY13
FY14
FY
15
E
FY
16
E
FY17
E
Cost/Assets ROAs (RHS)
1.91%
1.24%
1.40%
1.14%
1.54%
1.02%
1.76%
0.98%
0.50%
0.70%
0.90%
1.10%
1.30%
1.50%
1.70%
1.90%
2.10%
RORWAs ROAs
Federal ING J&K SIB
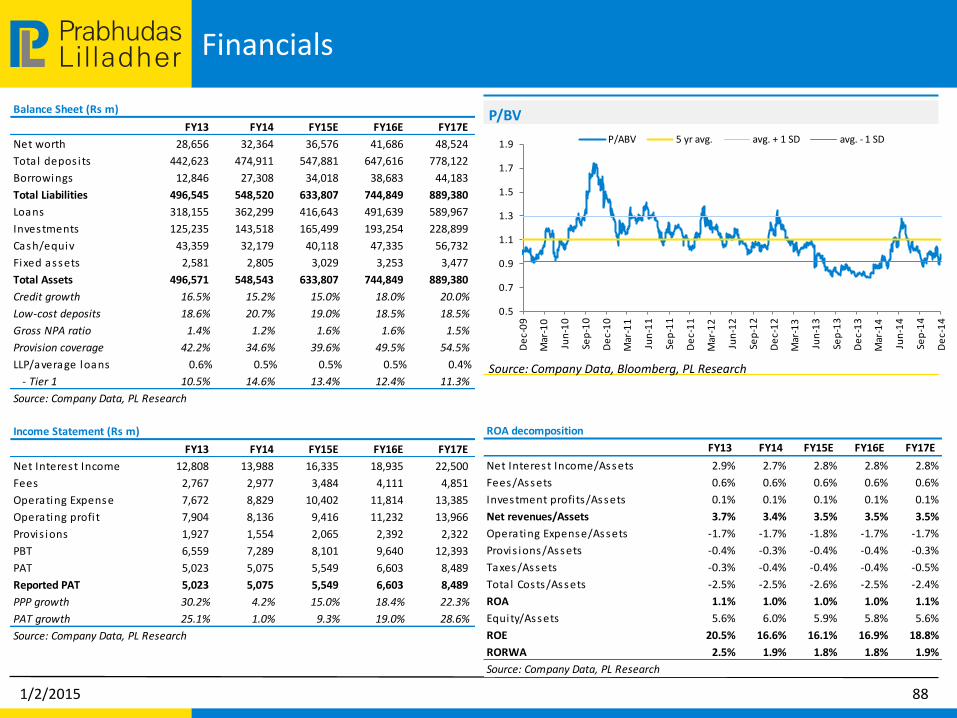
LilladherPrabhudas Financials
Source: Company Data, Bloomberg, PL Research
P/BV
1/2/2015 88
Balance Sheet (Rs m)
FY13 FY14 FY15E FY16E FY17E
Net worth 28,656 32,364 36,576 41,686 48,524
Total depos its 442,623 474,911 547,881 647,616 778,122
Borrowings 12,846 27,308 34,018 38,683 44,183
Total Liabilities 496,545 548,520 633,807 744,849 889,380
Loans 318,155 362,299 416,643 491,639 589,967
Investments 125,235 143,518 165,499 193,254 228,899
Cash/equiv 43,359 32,179 40,118 47,335 56,732
Fixed assets 2,581 2,805 3,029 3,253 3,477
Total Assets 496,571 548,543 633,807 744,849 889,380
Credit growth 16.5% 15.2% 15.0% 18.0% 20.0%
Low-cost deposits 18.6% 20.7% 19.0% 18.5% 18.5%
Gross NPA ratio 1.4% 1.2% 1.6% 1.6% 1.5%
Provision coverage 42.2% 34.6% 39.6% 49.5% 54.5%
LLP/average loans 0.6% 0.5% 0.5% 0.5% 0.4%
- Tier 1 10.5% 14.6% 13.4% 12.4% 11.3%
Source: Company Data, PL Research
Income Statement (Rs m)
FY13 FY14 FY15E FY16E FY17E
Net Interest Income 12,808 13,988 16,335 18,935 22,500
Fees 2,767 2,977 3,484 4,111 4,851
Operating Expense 7,672 8,829 10,402 11,814 13,385
Operating profi t 7,904 8,136 9,416 11,232 13,966
Provis ions 1,927 1,554 2,065 2,392 2,322
PBT 6,559 7,289 8,101 9,640 12,393
PAT 5,023 5,075 5,549 6,603 8,489
Reported PAT 5,023 5,075 5,549 6,603 8,489
PPP growth 30.2% 4.2% 15.0% 18.4% 22.3%
PAT growth 25.1% 1.0% 9.3% 19.0% 28.6%
Source: Company Data, PL Research
ROA decomposition
FY13 FY14 FY15E FY16E FY17E
Net Interest Income/Assets 2.9% 2.7% 2.8% 2.8% 2.8%
Fees/Assets 0.6% 0.6% 0.6% 0.6% 0.6%
Investment profi ts/Assets 0.1% 0.1% 0.1% 0.1% 0.1%
Net revenues/Assets 3.7% 3.4% 3.5% 3.5% 3.5%
Operating Expense/Assets -1.7% -1.7% -1.8% -1.7% -1.7%
Provis ions/Assets -0.4% -0.3% -0.4% -0.4% -0.3%
Taxes/Assets -0.3% -0.4% -0.4% -0.4% -0.5%
Total Costs/Assets -2.5% -2.5% -2.6% -2.5% -2.4%
ROA 1.1% 1.0% 1.0% 1.0% 1.1%
Equity/Assets 5.6% 6.0% 5.9% 5.8% 5.6%
ROE 20.5% 16.6% 16.1% 16.9% 18.8%
RORWA 2.5% 1.9% 1.8% 1.8% 1.9%
Source: Company Data, PL Research
0.5
0.7
0.9
1.1
1.3
1.5
1.7
1.9
De
c-0
9
Mar
-10
Jun
-10
Sep
-10
De
c-1
0
Mar
-11
Jun
-11
Sep
-11
De
c-1
1
Mar
-12
Jun
-12
Sep
-12
De
c-1
2
Mar
-13
Jun
-13
Sep
-13
De
c-1
3
Mar
-14
Jun
-14
Sep
-14
De
c-1
4
P/ABV 5 yr avg. avg. + 1 SD avg. - 1 SD

LilladherPrabhudas HDFC
CMP: Rs1,124 TP: Rs1,200 Rating: Accumulate MCap: Rs1,754.0bn
HDFC has reported steady trends in individual loan growth (~22% including loans sold to HDFC Bank) led by deeper penetration in urban/semi-urban areas as few metros shows signs of stagnation. The earnings growth has moderated in recent quarters due to higher tax rate however the spread has remained stable. We estimate earnings growth CAGR to recover to 16.4% over FY15-17E while the RoE is likely to improve to 21.5% on consolidated basis. We maintain our ACCUMULATE rating on the stock with a revised PT of Rs1,200 based on SOTP methodology.
Core performance remains on track: HDFC has been reporting ~22% YoY growth in individual loan portfolio (including loans sold to HDFC Bank) while maintaining stable spreads and margins. Asset quality has been stable despite difficult environment. AUM growth has slowed down on account of modest growth in non-individual loans, the proportion of which has declined to ~30% in total loan mix.
Margins stable; funding costs look favourable going ahead: Spreads are likely to remain stable as company passes on the benefits of decline in funding cost to its customers. The competitive intensity in the current declining rate environment will be far lower than what we saw in 2009 as base rate acts as a floor for banks while the steep decline in funding cost (NCDs) gives sufficient cushion to HFCs to compete on lending rate. Revival in commercial RE book could be margin accretive but looks unlikely in the near term.
Valuation: We maintain our ACCUMULATE rating on the stock with a revised PT of Rs1,200 based on SOTP methodology. We have valued parent HDFC at 3.7x Sep-2016E ABV while subsidiaries and associates accounts for ~45% of total value in our SOTP valuation.
Price triggers: Increase in FDI limit in life insurance, merger with HDFC Bank will act as positive triggers for the stock performance.
1/2/2015 89
Key Financials (Rs m)
Y/e March FY13 FY14E FY15E FY16E FY17E
Net interest income 61,798 70,030 80,014 91,940 107,246
Growth (%) 16.2 13.3 14.3 14.9 16.6
PPP 58,823 66,701 76,865 88,865 104,385
PAT 48,483 54,402 59,776 69,250 80,945
EPS (Rs) 32.1 35.0 38.3 44.4 51.9
Growth (%) 14.5 9.2 9.4 15.8 16.9
Net DPS (Rs) 14.6 16.4 16.8 18.0 19.1
Source: Company Data, PL Research
Profitability & valuation
Y/e March FY13 FY14E FY15E FY16E FY17E
NIM (%) 95.2 95.2 96.1 96.7 97.3
RoE (%) 22.0 20.5 20.3 21.1 21.6
RoA (%) 2.7 2.6 2.4 2.4 2.3
P / BV (x) 7.0 6.3 5.7 5.0 4.4
P / ABV (x) 6.8 6.3 5.7 5.1 4.4
PE (x) 35.0 32.1 29.3 25.3 21.7
Net dividend yield (%) 1.3 1.5 1.5 1.6 1.7
Source: Company Data, PL Research
Stock Performance
(%) 1M 6M 12M
Absolute (1.2) 14.2 41.7
Relative to Sensex 2.5 6.4 11.5

LilladherPrabhudas Operating Metrics
Source: Company Data, PL research
Source: Company Data, PL research
Wholesale and market borrowings the highest for HDFC
SOTP Valuation - Subsidiaries contribute 45% of fair price
Source: Company Data, PL research
We expect higher CAGR in loan book over FY15E-FY17E v/s last cycles
Source: Bloomberg, PL Research
Eased bond yields to have higher benefit on HDFC’s cost of funds
1/2/2015 90
20.0%
21.5%
18.2% 18.3%
20.9%
16.0%
17.0%
18.0%
19.0%
20.0%
21.0%
22.0%
FY07-FY12 FY04-FY14 FY09-FY14 FY12-FY14 FY15E-FY17E
CAGR in loan bookHDFC SOTP valuation Stake (%) Value per share (Rs)
HDFC Parent (A) 658
Subsidiaries / Associates
HDFC Bank 23.4 423
Life insurance 72.4 79
AMC 60.0 30
General Insurance 74.0 8
Others 65
Total subs/associates (B) @10% discount 543
Fair value (A+B) 1,201
Contribution of subs to total (%) 45
7.5
8.0
8.5
9.0
9.5
10.0
10.5
Jun
-11
Aug
-11
Oct
-11
Dec
-11
Fe
b-1
2
Apr
-12
Jun
-12
Aug
-12
Oct
-12
Dec
-12
Feb
-13
Apr
-13
Jun
-13
Aug
-13
Oct
-13
Dec
-13
Fe
b-1
4
Ap
r-1
4
Jun
-14
Aug
-14
Oct
-14
Dec
-14
FIMMDA 3 YR AAA FIMMDA 5 YR AAA
0%
20%
40%
60%
80%
100%
1Q13 2Q13 3Q13 4Q13 1Q14 2Q14 3Q14 4Q14 1Q15 2Q15
Term loans Bonds/ Debentures/ FCCB/ CPs Deposits

LilladherPrabhudas Financials
Source: Company Data, Bloomberg, PL Research
P/BV
1/2/2015 91
Balance Sheet (Rs m)
FY13 FY14 FY15E FY16E FY17E
Net worth 250,000 279,552 308,138 349,330 400,407
Total depos its 519,328 565,782 798,686 925,798 1,077,090
Borrowings 1,068,953 1,277,199 1,530,651 1,866,472 2,283,190
Total 1,955,308 2,257,574 2,637,475 3,141,601 3,760,688
Loans 1,695,708 1,965,544 2,328,528 2,809,915 3,404,517
Investments 136,135 139,127 149,206 160,256 172,136
Cash/equiv 44,399 54,128 56,582 61,392 66,610
Fixed assets 2,379 2,805 2,818 2,880 2,944
Total 1,955,308 2,257,574 2,637,475 3,141,601 3,760,688
Deposit growth 43.1% 8.9% 41.2% 15.9% 16.3%
Credit growth 20.8% 15.9% 18.5% 20.7% 21.2%
EA growth 20.0% 15.0% 15.5% 17.5% 18.3%
Gross NPA ratio 0.7% 0.7% 0.7% 0.7% 0.7%
Net NPA ratio -0.3% 0.0% 0.1% 0.1% 0.2%
- Tier 1 13.9% 15.4% 14.8% 14.2% 13.6%
Source: Company Data, PL Research
Income Statement (Rs m)
FY13 FY14 FY15E FY16E FY17E
Net Interest Income 61,798 70,030 80,014 91,940 107,246
Fees 2,413 2,952 3,671 4,623 5,867
Operating Expense 5,389 6,281 6,820 7,698 8,728
Operating profi t 64,023 72,913 83,653 96,397 112,568
Investment profi ts 3,156 2,490 4,482 5,378 6,454
Preprovis ion profi t 67,178 75,402 88,135 101,775 119,021
Provis ions 1,450 1,000 1,503 1,413 1,709
PBT 65,728 74,402 86,632 100,362 117,312
Taxes 17,245 20,000 26,856 31,112 36,367
PAT 48,483 54,402 59,776 69,250 80,945
Reported PAT 48,483 54,402 59,776 69,250 80,945
PPP growth 16.9% 12.2% 16.9% 15.5% 16.9%
PAT growth 17.6% 12.2% 9.9% 15.8% 16.9%
Source: Company Data, PL Research
ROA decomposition FY13 FY14 FY15E FY16E FY17E
Net Interest Income/Assets 3.4% 3.3% 3.3% 3.2% 3.1%
Fees/Assets 0.1% 0.1% 0.1% 0.1% 0.2%
Investment profi ts/Assets 0.1% 0.1% 0.1% 0.1% 0.1%
Net revenues/Assets 4.0% 3.9% 3.9% 3.8% 3.7%
Operating Expense/Assets 0.3% 0.3% 0.3% 0.3% 0.3%
Provis ions/Assets 0.1% 0.0% 0.1% 0.0% 0.0%
Taxes/Assets 1.0% 0.9% 1.1% 1.1% 1.1%
Total Costs/Assets 1.3% 1.3% 1.4% 1.4% 1.4%
ROA 2.7% 2.6% 2.4% 2.4% 2.3%
Equity/Assets 11.3% 11.7% 11.1% 10.5% 10.0%
ROE 22.0% 20.5% 20.3% 21.1% 21.6%
Source: Company Data, PL Research
3.0
3.5
4.0
4.5
5.0
5.5
6.0
6.5
De
c-0
9
Mar
-10
Jun
-10
Sep
-10
De
c-1
0
Mar
-11
Jun
-11
Sep
-11
De
c-1
1
Mar
-12
Jun
-12
Sep
-12
De
c-1
2
Mar
-13
Jun
-13
Sep
-13
De
c-1
3
Mar
-14
Jun
-14
Sep
-14
De
c-1
4
P/ABV (x) 5 yr avg. (x) avg. + 1 SD (x) avg. - 1 SD (x)

LilladherPrabhudas IDFC
CMP: Rs158 TP: Rs175 Rating: Accumulate MCap: Rs256.0bn
IDFC continues to report tepid performance as it pursues transition into a bank and focuses on building up the provisioning cushion (increased to 3.6% of loans vs 3.1% in 1Q FY15) and the G‐sec portfolio (~Rs125bn currently vs ~Rs75bn in Q2 FY14). NII growth continues to moderate led by consolidation in loan growth and successive decline in spreads while operating expenses has picked up on key hiring towards transition into a bank. Asset quality has deteriorated with restructured assets amounting to 6.1% of total loans, 87% of which pertain to energy segment. We await further clarity on its strategy of operating the bank but retain our ‘Accumulate’ rating on the stock with TP of Rs175 (1.4x Sep‐16 book).
Demerger into bank on track: The board has approved the demerger scheme and all shareholders of IDFC will get shares in the bank in ratio of 1:1. Most of investments will be moved to NOHFC like AMC, Investment Banking & Alternate assets. Though in the medium term we believe operational challenges remain but its transition into a bank is well on its way as it adds key executives, focusing on regulatory requirements and build up of adequate provisions.
Asset quality has deteriorated but prudential provisioning gives comfort: Asset quality has deteriorated with restructured assets amounting to 6.1% of total loans, 87% of which pertain to energy segment. Management sighted that there could be some restructuring in gas based assets as gas price hike has been delayed (Gas based exposure stands at Rs2.4bn or 3.3% of loan book). Also, coal related exposure stands at ~5% of loan book though is not directly linked to coal mine de‐allocation and 80% of projects lent to are operational. The company intends to add provisioning buffer on prudential basis (Provisions are 3.6% of loans v/s 3.1% in Q1FY15) for all known risks as it transforms into a bank to avoid any hiccups later on.
Valuations: We await further clarity on its strategy of operating the bank but retain our ‘Accumulate’ rating on the stock with TP of Rs175 (1.4x Sep‐16 book).
1/2/2015 92
Key Financials (Rs m)
Y/e March FY13 FY14E FY15E FY16E FY17E
Net interest income 25,350 27,040 26,434 27,949 28,411
Growth (%) 22.3 6.7 -2.2 5.7 1.7
PPP 29,176 31,912 31,920 31,822 31,975
PAT 18,368 18,022 17,259 19,884 20,032
EPS (Rs) 12.1 11.9 10.6 12.3 12.3
Growth (%) 18.2 -2.0 -10.5 15.2 0.7
Net DPS (Rs) 2.6 3.1 3.7 4.5 5.4
Source: Company Data, PL Research
Profitability & valuation
Y/e March FY13 FY14E FY15E FY16E FY17E
NIM (%) 115.1 118.0 120.8 113.9 112.5
RoE (%) 14.1 12.5 10.5 10.8 10.1
RoA (%) 2.8 2.5 2.2 2.4 2.2
P / BV (x) 1.7 1.6 1.4 1.3 1.2
P / ABV (x) 1.8 1.6 1.5 1.4 1.3
PE (x) 13.0 13.3 14.8 12.9 12.8
Net dividend yield (%) 1.6 2.0 2.4 2.9 3.4
Source: Company Data, PL Research
Stock Performance
(%) 1M 6M 12M
Absolute 0.1 16.8 43.8
Relative to Sensex 3.8 9.0 13.7
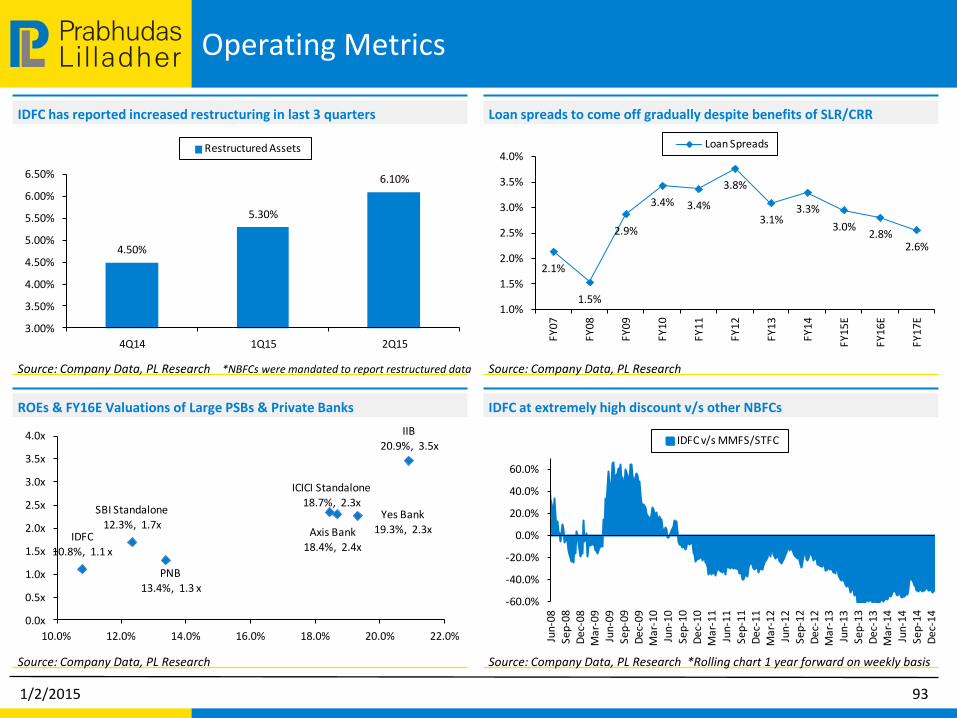
LilladherPrabhudas Operating Metrics
Source: Company Data, PL Research
Source: Company Data, PL Research *Rolling chart 1 year forward on weekly basis
Loan spreads to come off gradually despite benefits of SLR/CRR
IDFC at extremely high discount v/s other NBFCs
Source: Company Data, PL Research
ROEs & FY16E Valuations of Large PSBs & Private Banks
Source: Company Data, PL Research *NBFCs were mandated to report restructured data
IDFC has reported increased restructuring in last 3 quarters
1/2/2015 93
2.1%
1.5%
2.9%
3.4% 3.4%
3.8%
3.1%3.3%
3.0%2.8%
2.6%
1.0%
1.5%
2.0%
2.5%
3.0%
3.5%
4.0%
FY
07
FY
08
FY
09
FY
10
FY
11
FY
12
FY
13
FY
14
FY
15
E
FY
16
E
FY
17
E
Loan Spreads
-60.0%
-40.0%
-20.0%
0.0%
20.0%
40.0%
60.0%
Jun-
08
Sep
-08
Dec
-08
Ma
r-0
9Ju
n-0
9Se
p-0
9D
ec-0
9M
ar-1
0Ju
n-1
0Se
p-1
0D
ec-1
0M
ar-1
1Ju
n-1
1Se
p-1
1D
ec-
11
Mar
-12
Jun-
12
Sep
-12
Dec
-12
Ma
r-1
3Ju
n-1
3Se
p-1
3D
ec-1
3M
ar-1
4Ju
n-1
4Se
p-1
4D
ec-1
4
IDFC v/s MMFS/STFC
4.50%
5.30%
6.10%
3.00%
3.50%
4.00%
4.50%
5.00%
5.50%
6.00%
6.50%
4Q14 1Q15 2Q15
Restructured Assets
IDFC
10.8%, 1.1 x
SBI Standalone12.3%, 1.7x
PNB13.4%, 1.3 x
Axis Bank18.4%, 2.4x
ICICI Standalone
18.7%, 2.3xYes Bank
19.3%, 2.3x
IIB20.9%, 3.5x
0.0x
0.5x
1.0x
1.5x
2.0x
2.5x
3.0x
3.5x
4.0x
10.0% 12.0% 14.0% 16.0% 18.0% 20.0% 22.0%

LilladherPrabhudas Financials
Source: Company Data, Bloomberg, PL Research
P/BV
1/2/2015 94
Balance Sheet (Rs m)
FY13 FY14 FY15E FY16E FY17E
Net worth 136,826 150,583 177,294 191,827 206,476
Sub bonds/pref cap 6,500 6,500 6,500 6,500 6,500
Borrowings 535,770 559,150 564,408 631,175 729,954
Total Borrowings 535,770 559,150 564,408 631,175 729,954
LIABILITIES 710,589 751,630 786,878 871,823 989,247
Loans 557,360 565,950 582,929 629,563 679,928
Investments 110,042 113,087 129,449 165,752 230,592
Cash/equiv 2,627 3,904 4,685 5,528 6,523
Fixed assets 3,445 3,286 3,245 3,171 3,077
ASSETS 710,589 751,630 786,878 871,823 989,247
Borrowing growth 17.0% 4.4% 0.9% 11.8% 15.7%
Credit growth 15.7% 1.5% 3.0% 8.0% 8.0%
EA growth 18.8% 1.9% 5.0% 11.7% 14.5%
C-D ratio 104.0% 101.2% 103.3% 99.7% 93.1%
Gross NPA ratio 0.2% 0.6% 1.2% 1.7% 2.2%
Net NPA ratio 0.1% 0.4% 0.7% 0.9% 1.1%
- Tier 1 19.8% 21.5% 24.7% 25.1% 25.4%
Source: Company Data, PL Research
Income Statement (Rs m)
FY13 FY14 FY15E FY16E FY17E
NII 25,350 27,040 26,434 27,949 28,425
Fees 6,810 6,840 9,125 9,033 10,122
Investment ga ins 2,310 3,470 2,999 3,087 3,283
Opex 5,294 5,438 6,639 8,247 9,841
Operating profi t 29,176 31,912 31,920 31,822 31,990
Treasury ga ins - - - - -
Preprovis ion profi t 29,176 31,912 31,920 31,822 31,990
Provis ions 3,496 6,290 8,114 4,396 4,721
PBT 25,680 25,622 23,806 27,426 27,269
Taxes 7,311 7,600 6,547 7,542 7,226
PAT 18,368 18,022 17,259 19,884 20,043
Extraordinaries/Minori ty interests- - - - -
Reported PAT 18,368 18,022 17,259 19,884 20,043
PPP growth 19.8% 9.4% 0.0% -0.3% 0.5%
PAT growth 18.3% -1.9% -4.2% 15.2% 0.8%
Source: Company Data, PL Research
ROA decomposition FY13 FY14 FY15E FY16E FY17E
Net Interest Margin 4.1% 4.0% 3.8% 3.7% 3.3%
Core Fees 1.1% 1.0% 1.3% 1.2% 1.2%
Capital gains- Infra 0.4% 0.5% 0.4% 0.4% 0.4%
Treasury 0.0% 0.0% 0.0% 0.0% 0.0%
Net revenues 5.6% 5.5% 5.5% 5.3% 4.9%
Operating costs -0.9% -0.8% -0.9% -1.1% -1.1%
Provisions -0.6% -0.9% -1.2% -0.6% -0.5%
Taxes -1.2% -1.1% -0.9% -1.0% -0.8%
Costs -2.6% -2.9% -3.0% -2.7% -2.5%
ROA 3.0% 2.7% 2.5% 2.6% 2.3%
Equity/Assets 21.0% 21.2% 23.4% 24.3% 23.2%
ROE 14.1% 12.5% 10.5% 10.8% 10.1%
Adjusted ROA 1.6% 1.3% 1.0% 1.1% 0.9%
LLP/Average loans 0.7% 1.1% 1.4% 0.7% 0.7%
Source: Company Data, PL Research
0.5
1.0
1.5
2.0
2.5
3.0
De
c-0
9
Mar
-10
Jun
-10
Sep
-10
De
c-1
0
Mar
-11
Jun
-11
Sep
-11
De
c-1
1
Mar
-12
Jun
-12
Sep
-12
De
c-1
2
Mar
-13
Jun
-13
Sep
-13
De
c-1
3
Mar
-14
Jun
-14
Sep
-14
De
c-1
4
P/ABV 5 yr avg. avg. + 1 SD avg. - 1 SD

LilladherPrabhudas LIC Housing Finance
CMP: Rs438 TP: Rs490 Rating: BUY MCap: Rs221.2bn
LICHF has reported an improvement in operating performance in recent quarter with spreads improving by 6bp QoQ while GNPLs declined by 19% QoQ. Loan growth has been healthy led by the individual segment while the proportion of project loans continue to decline. Management has guided for an individual loan growth of 20-25% over next year while steep decline in funding cost is likely to aid spreads further on. We revise our PT to Rs490 which corresponds to 2.3x Sep-2016E ABV and upgrade our rating to BUY.
Spreads to improve further: In Q2FY15, spreads improved by 6bps QoQ on better loan growth especially LAP (~10‐15% QoQ disbursement growth) which led to 13bps improvement in blended yields. Funding environment has been benign in fast few months with wholesale rates softening which will be positive for LICHF spreads (already borrowing at 8.6% v/s 9.6% in Q1FY15) and robust sanctions done in Q2FY15 on builder book could add to spread improvement. Management believes margins could move to 2.75% in FY16 as about Rs280‐290bn of fixed loans re-prices upwards.
Loan growth – Disbursements & Sanctions showing good trends: Loan growth is showing signs of pick up on healthy sanctions in both individual & project loans (builder book). Though disbursements in project book has been weak the sanctions were up by 100% in Q2FY15, which may help disbursement growth in H2FY15. On the individual portfolio, disbursement growth of 24% YoY was supported by healthy disbursement in LAP of Rs4.44bn v/s 3.80bn in Q1FY15.
Asset quality to remain steady: Asset quality improved on recovery of one large a/c through auction with interest of Rs1.32bn from builder book which had become an NPA in Q3FY14. LICHF expects one more a/c of same nature to be recovered in Q4FY15/Q1FY16.
Valuation: We estimate LICHF to deliver an earnings CAGR of 24% over FY15-17E. We revise our PT to Rs490 which corresponds to 2.3x Sep-2016E ABV and upgrade our rating to BUY.
1/2/2015 95
Key Financials (Rs m)
Y/e March FY13 FY14 FY15E FY16E FY17E
Net interest income 15,463 19,158 22,219 28,815 35,485
Growth (%) 10.3 23.9 16.0 29.7 23.1
PPP 13,812 17,106 19,877 26,322 32,807
PAT 10,232 13,172 15,156 18,730 23,220
EPS (Rs) 20.3 26.1 30.0 37.1 46.0
Growth (%) 8.6 28.7 15.1 23.6 24.0
Net DPS (Rs) 4.4 5.3 4.9 5.3 5.3
Source: Company Data, PL Research
Profitability & valuation
Y/e March FY13 FY14 FY15E FY16E FY17E
NIM (%) 89.3 89.3 89.5 91.3 92.5
RoE (%) 16.8 18.8 18.6 19.5 20.3
RoA (%) 1.4 1.5 1.4 1.5 1.5
P / BV (x) 3.4 2.9 2.5 2.1 1.8
P / ABV (x) 3.6 3.1 2.6 2.2 1.9
PE (x) 21.6 16.8 14.6 11.8 9.5
Net dividend yield (%) 1.0 1.2 1.1 1.2 1.2
Source: Company Data, PL Research
Stock Performance
(%) 1M 6M 12M
Absolute 3.8 35.5 97.9
Relative to Sensex 7.5 27.7 67.8

LilladherPrabhudas Operating Metrics
Source: Company Data, PL Research
Source: Company Data, PL Research
..which will help COFs on higher wholesale funding reliance..
We expect ROEs to improve from hereon
Source: Company Data, PL Research
…but historically margins have expanded on higher project book mix
Source: Bloomberg, PL Research
LICHF’s recent bond offering is lower by at least 150bps over last year..
1/2/2015 96
Bank loans23.0%
NCDs
67.0%
NHB 5.0%
Others5.0%
2.5% 2.4% 2.8%
2.8%
2.6%
3.0%
2.3%
2.1% 2.2%
95.9
%
96.9
%
94.0
%
91.2
%
89.1
%
91.5
%
95.0
%
96.6
%
97.0
%
4.1% 3.
1%
6.0%
8.8%
10.9
% 8.5%
5.0% 3.
4% 3.0%
1.5%
1.7%
1.9%
2.1%
2.3%
2.5%
2.7%
2.9%
3.1%
85%
87%
89%
91%
93%
95%
97%
99%
101%
FY06 FY07 FY08 FY09 FY10 FY11 FY12 FY13 FY14
Individual Book Non-Housing Book NIMs
10.0%
12.0%
14.0%
16.0%
18.0%
20.0%
22.0%
24.0%
26.0%
28.0%
FY06
FY
07
FY08
FY09
FY
11
FY12
FY13
FY14
FY15
E
FY
16
E
FY17
E
ROEs
10.6
9.7
8.7
8.5
8.8
9.1
9.4
9.7
10.0
10.3
10.6
10.9
Jul-
13
Au
g-1
3
Sep
-13
Oct
-13
Nov
-13
Dec
-13
Jan
-14
Feb
-14
Mar
-14
Apr
-14
Ma
y-1
4
Jun-
14
Jul-
14
Aug
-14
Sep
-14
Oct
-14
Nov
-14
Dec
-14
Interest on Corp Bond Offered By LICHF

LilladherPrabhudas Financials
Source: Company Data, Bloomberg, PL Research
P/BV
1/2/2015 97
ROA Decomposition FY12 FY13 FY14 FY15E FY16E
NII 2.5% 2.2% 2.3% 2.3% 2.4%
Fees and other income 0.4% 0.3% 0.3% 0.3% 0.3%Total income 2.8% 2.5% 2.6% 2.6% 2.7%
Cost 0.0% 0.0% 0.0% 0.0% 0.0%
Employees 0.1% 0.1% 0.1% 0.1% 0.1%Opex 0.3% 0.3% 0.2% 0.3% 0.3%
Depericiation 0.0% 0.0% 0.0% 0.0% 0.0%
Total 0.4% 0.4% 0.4% 0.4% 0.4%PPOP 2.4% 2.1% 2.2% 2.2% 2.3%
Provis ions 0.3% 0.1% 0.0% 0.1% 0.1%
Others 0.0% 0.0% 0.0% 0.0% 0.0%PBT 2.2% 1.9% 2.2% 2.1% 2.2%
Tax 0.6% 0.5% 0.6% 0.6% 0.6%
ROA 1.6% 1.5% 1.6% 1.5% 1.6%Leverage 10.0% 9.2% 8.9% 8.8% 8.6%
ROE 18.6% 16.8% 18.8% 18.3% 19.6%
Source: Company Data, PL Research
0.5
1.0
1.5
2.0
2.5
3.0
3.5
De
c-0
9
Mar
-10
Jun
-10
Sep
-10
De
c-1
0
Mar
-11
Jun
-11
Sep
-11
De
c-1
1
Mar
-12
Jun
-12
Sep
-12
De
c-1
2
Mar
-13
Jun
-13
Sep
-13
De
c-1
3
Mar
-14
Jun
-14
Sep
-14
De
c-1
4
P/ABV (x) 5 yr avg. (x) avg. + 1 SD (x) avg. - 1 SD (x)
Income Statement (Rs m)
Y/e March FY13 FY14 FY15E FY16E FY17E
Net interest income 15,463 19,158 22,219 28,815 35,485
Growth (%) 10.3 23.9 16.0 29.7 23.1
Non interest income 1,168 1,080 1,268 1,730 2,304
Net operating income 16,631 20,239 23,486 30,545 37,789
Employees 904 1,038 1,225 1,434 1,692
Other expenses 1,839 2,018 2,381 2,786 3,287
Total expenditure 2,818 3,133 3,609 4,223 4,983
PPP 13,812 17,106 19,877 26,322 32,807
Growth (%) 6.5 23.8 16.2 32.4 24.6
Provis ion 789 215 (101) 1,492 1,853
Other income 712 1,363 1,520 1,736 1,983
Profi t before tax 13,736 18,255 21,498 26,567 32,936
Tax 3,504 5,083 6,342 7,837 9,716
PAT 10,232 13,172 15,156 18,730 23,220
Growth (%) 11.9 28.7 15.1 23.6 24.0
Source: Company Data, PL Research
Balance Sheet (Rs m)
Y/e March FY13 FY14 FY15E FY16E FY17E
Equity 1,010 1,010 1,010 1,010 1,010
Reserves & Surplus 63,803 74,319 87,011 103,041 123,562
Networth 64,813 75,329 88,021 104,051 124,572
Loan funds 679,926 808,461 983,791 1,227,733 1,535,712
Growth (%) 21.8 18.9 21.7 24.8 25.1
Total 803,113 955,204 1,152,063 1,423,154 1,768,957
Advances 778,127 913,409 1,110,817 1,375,259 1,713,741
Growth (%) 23.4 17.4 21.6 23.8 24.6
Investments 16,502 32,210 37,059 43,006 49,483
Total 803,113 955,198 1,152,063 1,423,154 1,768,957
Source: Company Data, PL Research

LilladherPrabhudas M&M Financial Services
CMP: Rs330 TP: Rs300 Rating: Reduce MCap: Rs185.8bn
Disbursement growth to be flattish to negative in FY15: MMFS is likely to witness flattish to negative growth in disbursements in FY15E as Auto/Cars/UVs (50% of AUM) have seen only some festive demand but overall has remained sluggish. Disbursement in H2FY15 was driven by used vehicles portfolio & some rebound in CV disbursements. The management is focusing on tractors (18% of AUM) which is high yielding and is having better demand (M&M commands high market share in tractors sales).
Asset quality improvement unlikely in near term: Asset quality for MMFS has deteriorated in Q1FY15 on several factors like delayed monsoon, election activity in country & states and economic slowdown. RBI also undertook revision in NPA recognition norms for NBFCs to 90days from 180 days currently (have to align by FY18). As MMFS is already on 150 day recognition cycle impact will be only 2% incremental over the ~6% GNPAs as of H1FY15, as the NBFC is likely to start moving towards 120 day recognition on commencement of FY16. We believe, asset quality to improve only gradually as collection efforts have increased but economic activity remains very soft.
Margins to remain stable: MMFS borrows ~28% of its funding from wholesale market, while 65% of funding is via banks & fixed deposits. While, wholesale rates have reduced by 200bps from Aug’13 incremental benefit to MMFS will be only 20-22bp which is likely to be passed on to borrowers on tepid demand. Hence, we believe, margins are likely to remain stable in the near term unless growth picks up materially.
Prospects improving gradually: Management has clearly been indicating growth is likely to be high effort based and will be slow & gradual. MMFS has geared up for opportunities on further penetration in rural markets, but asset quality improvement is unlikely under revised norms scenario and lower loan growth will keep return ratios below normalized levels. Hence, we maintain Reduce but we revise our TP of Rs300 from Rs255 (2.5x Sep-16 book).
1/2/2015 98
Key Financials (Rs m)
Y/e March FY13 FY14E FY15E FY16E FY17E
Net interest income 22,380 27,336 31,019 37,123 44,285
Growth (%) 35.8 22.1 13.5 19.7 19.3
PPP 15,340 18,516 20,590 24,742 29,264
PAT 8,541 8,872 8,995 11,061 13,938
EPS (Rs) 15.2 15.7 16.0 19.6 24.7
Growth (%) 25.6 3.8 1.4 23.0 26.0
Net DPS (Rs) 3.6 3.8 3.6 4.4 5.6
Source: Company Data, PL Research
Profitability & valuation
Y/e March FY13 FY14E FY15E FY16E FY17E
NIM (%) 68.5 67.7 66.4 66.6 66.1
RoE (%) 23.1 18.6 16.6 17.9 19.7
RoA (%) 4.2 3.4 2.9 3.0 3.1
P / BV (x) 4.2 3.6 3.2 2.8 2.4
P / ABV (x) 4.4 4.1 3.8 3.3 2.9
PE (x) 21.7 20.9 20.7 16.8 13.3
Net dividend yield (%) 1.1 1.2 1.1 1.3 1.7
Source: Company Data, PL Research
Stock Performance
(%) 1M 6M 12M
Absolute 8.0 15.5 3.0
Relative to Sensex 11.6 7.7 (27.2)
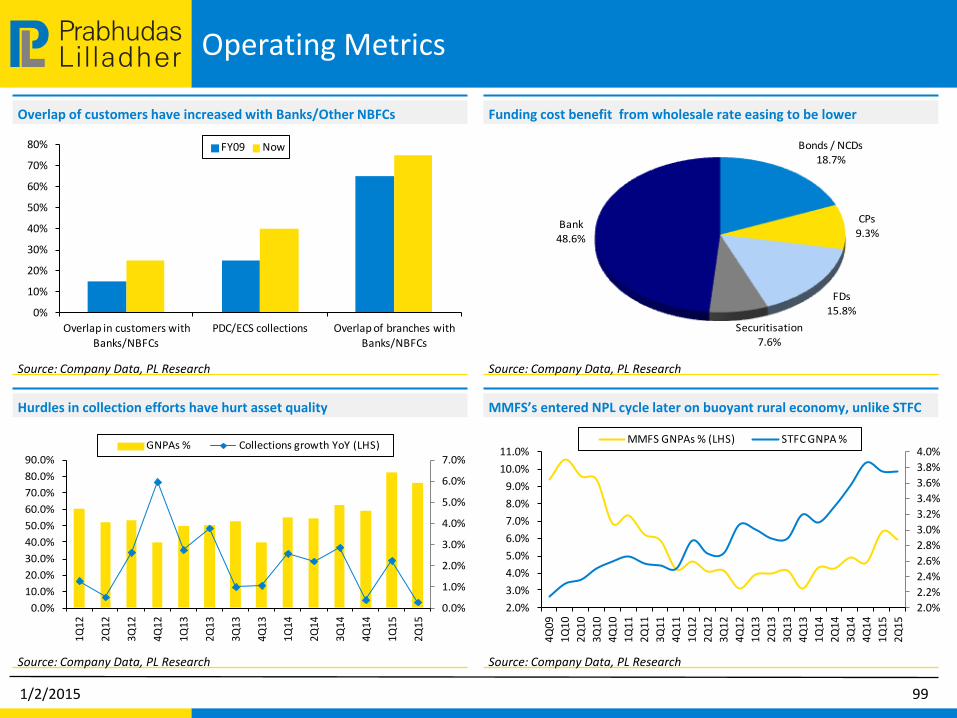
LilladherPrabhudas Operating Metrics
Source: Company Data, PL Research
Source: Company Data, PL Research
Funding cost benefit from wholesale rate easing to be lower
MMFS’s entered NPL cycle later on buoyant rural economy, unlike STFC
Source: Company Data, PL Research
Hurdles in collection efforts have hurt asset quality
Source: Company Data, PL Research
Overlap of customers have increased with Banks/Other NBFCs
1/2/2015 99
0.0%
1.0%
2.0%
3.0%
4.0%
5.0%
6.0%
7.0%
0.0%
10.0%
20.0%
30.0%
40.0%
50.0%
60.0%
70.0%
80.0%
90.0%
1Q12
2Q12
3Q12
4Q12
1Q13
2Q13
3Q13
4Q13
1Q14
2Q14
3Q14
4Q14
1Q15
2Q15
GNPAs % Collections growth YoY (LHS)
Bonds / NCDs18.7%
CPs9.3%
FDs15.8%
Securitisation
7.6%
Bank
48.6%
0%
10%
20%
30%
40%
50%
60%
70%
80%
Overlap in customers with
Banks/NBFCs
PDC/ECS collections Overlap of branches with
Banks/NBFCs
FY09 Now
2.0%
2.2%
2.4%
2.6%
2.8%
3.0%
3.2%
3.4%
3.6%
3.8%
4.0%
2.0%
3.0%
4.0%
5.0%
6.0%
7.0%
8.0%
9.0%
10.0%
11.0%
4Q
09
1Q
10
2Q
10
3Q
10
4Q
10
1Q
11
2Q
11
3Q
11
4Q
11
1Q
12
2Q
12
3Q
12
4Q
12
1Q
13
2Q
13
3Q
13
4Q
13
1Q
14
2Q
14
3Q
14
4Q
14
1Q
15
2Q
15
MMFS GNPAs % (LHS) STFC GNPA %

LilladherPrabhudas Financials
Source: Company Data, Bloomberg, PL Research
P/BV
1/2/2015 100
ROA decomposition (% of AUM) FY13 FY14E FY15E FY16E FY17E
Net Interest Income 8.3% 8.1% 7.8% 8.0% 7.9%
Interest on Securitisation 0.9% 0.7% 0.7% 0.7% 0.6%
Other income 0.2% 0.1% 0.1% 0.1% 0.1%
Net revenues 9.4% 8.9% 8.6% 8.8% 8.7%
Operating expenses 3.0% 2.9% 2.9% 3.0% 2.9%
Depreciation 0.1% 0.1% 0.1% 0.0% 0.1%
PPOP 6.3% 6.0% 5.6% 5.8% 5.7%
Provis ions and Contingencies 1.2% 1.6% 2.0% 2.0% 1.7%
PBT 5.2% 4.3% 3.6% 3.8% 4.0%
Provis ion for Tax 1.6% 1.5% 1.2% 1.2% 1.3%
ROA 3.5% 2.9% 2.5% 2.6% 2.7%
Equity/Assets 15.3% 15.4% 14.9% 14.5% 13.7%
ROE 23.8% 18.6% 16.6% 17.9% 19.7%
Source: Company Data, PL Research
1.0
1.5
2.0
2.5
3.0
3.5
4.0
De
c-0
9
Mar
-10
Jun
-10
Sep
-10
De
c-1
0
Mar
-11
Jun
-11
Sep
-11
De
c-1
1
Mar
-12
Jun
-12
Sep
-12
De
c-1
2
Mar
-13
Jun
-13
Sep
-13
De
c-1
3
Mar
-14
Jun
-14
Sep
-14
De
c-1
4
P/ABV 5 yr avg. avg. + 1 SD avg. - 1 SD
Income Statement (Rs m)
Y/e March FY13 FY14E FY15E FY16E FY17E
Net interest income 20,234 25,014 28,605 34,229 41,040
Growth (%) 30.1 23.6 14.4 19.7 19.9
Non interest income 380 314 361 415 477
Net operating income 22,759 27,650 31,379 37,538 44,762
Employees 3,616 4,729 5,674 6,809 8,171
Other expenses 511 511 511 511 511
Total expenditure 4,350 5,483 6,430 7,463 8,996
PPP 15,340 18,516 20,590 24,742 29,264
Growth (%) 41.7 20.7 11.2 20.2 18.3
Provis ion 2,833 5,058 7,363 8,476 8,767
Other income - - - - -
Profi t before tax 12,506 13,458 13,227 16,266 20,497
Tax 3,965 4,586 4,233 5,205 6,559
PAT 8,541 8,872 8,995 11,061 13,938
Growth (%) 37.7 3.9 1.4 23.0 26.0
Source: Company Data, PL Research
Balance Sheet (Rs m)
Y/e March FY13 FY14E FY15E FY16E FY17E
Equity 1,126 1,127 1,127 1,127 1,127
Reserves & Surplus 43,420 49,815 56,446 64,601 74,877
Networth 44,546 50,942 57,573 65,728 76,004
Loan funds 188,723 242,977 272,213 330,305 417,014
Growth (%) 35.2 28.7 12.0 21.3 26.3
Total 233,269 293,919 329,787 396,033 493,018
Advances 240,384 296,170 333,650 399,275 495,008
Growth (%) 37.4 23.2 12.7 19.7 24.0
Investments 5,610 8,692 8,341 9,982 12,375
Total 233,269 293,919 329,786 395,964 492,836
Source: Company Data, PL Research

LilladherPrabhudas Shriram Transport Finance Company
CMP: Rs1,102 TP: Rs1,200 Rating: BUY MCap: Rs250.1bn
We expect SHTF to be a key beneficiary of much anticipated revival in CV cycle while steep decline in corporate bond-yields help improve company's profitability. We expect credit-cost also to moderate from current levels while strong coverage ratio will help preempt any earnings shock as company migrates to a 90day NPA recognition norm.
Growth to recovery gradually; freight operators economics likely to improve: Disbursements have shown an uptick in recent months and with the improvement in macro-environment we expect CV cycle to stage a gradual recovery over FY16. Though the recent cut in diesel prices has not helped freight operators much due to weak demand, we expect transport operators profitability to improve going ahead. Management expects double digit AUM growth in H2FY15 which will help improve margins.
Margins likely to improve: SHTF’s reported margins have been under pressure over past few quarters at ~6.5%. This occurred due to a decline in off-balance sheet mix, excess liquidity on balance sheet and increased focus on used vehicles of 2–5 years vintage which have lower yields. Going ahead, we expect margins to recover to ~7.5% (6.6% in Q2FY15) as lending activity in the used business picks up and funding cost moderates.
Asset quality stable; healthy provisioning comforts us: Asset quality was stable in Q2FY15 as stress seems to be abating especially in South India where economic prospects have started looking good. But credit cost remains high in range of 200‐210bps on some movement to lower NPA buckets. Management has indicated sufficient buffers (79% PCR) exist as SHTF migrates to 90 day NPA recognition norm as required by the RBI.
Valuation: We maintain our ACCUMULATE rating on the stock with a PT of Rs1,200 which corresponds to 2.3x Sep-2016E ABV. Improving/stabilizing return ratios, resumption of mining activity, revival in CV cycle and improvement in NPL formation are the key triggers. Key risks: Rising competition with banks and CV cycle failing to revive would adversely affect SHTF’s business growth and asset quality.
1/2/2015 101
Key Financials (Rs m)
Y/e March FY13 FY14 FY15E FY16E FY17E
Net interest income 32,894 34,226 36,971 46,088 57,425
Growth (%) 9.8 4.0 8.0 24.7 24.6
PPP 28,613 28,574 30,491 38,460 48,297
PAT 13,606 12,642 13,923 16,670 20,372
EPS (Rs) 60.0 55.7 61.4 73.5 89.8
Growth (%) 7.9 -7.1 10.1 19.7 22.2
Net DPS (Rs) 7.0 7.0 7.7 10.0 12.2
Source: Company Data, PL Research
Profitability & valuation
Y/e March FY13 FY14 FY15E FY16E FY17E
NIM (%) 87.0 83.5 82.5 83.4 84.1
RoE (%) 20.6 16.3 15.7 16.4 17.4
RoA (%) 4.0 3.1 3.0 3.1 3.1
P / BV (x) 3.5 3.0 2.6 2.3 2.0
P / ABV (x) 3.6 3.1 2.8 2.4 2.2
PE (x) 18.4 19.8 18.0 15.0 12.3
Net dividend yield (%) 0.6 0.6 0.7 0.9 1.1
Source: Company Data, PL Research
Stock Performance
(%) 1M 6M 12M
Absolute (1.3) 21.9 64.0
Relative to Sensex 2.4 14.1 33.9

LilladherPrabhudas Operating Metrics
Source: IFTRT, PL Research
Source: Company Data, PL Research
Freight rates have moved downwards on monthly basis
GNPAs should move downwards by FY18E post complete move on 90dpd
Source: Company Data, PL Research
NIMs should improve as AUM growth picks-up
Source: PL Research
Demand for 35 ton vehicle has improved fleet profitability
1/2/2015 102
-6.0%
-4.0%
-2.0%
0.0%
2.0%
4.0%
6.0%
8.0%
-5.0%
0.0%
5.0%
10.0%
15.0%
20.0%
25.0%
Aug
-13
Sep
-13
Oct
-13
Nov
-13
Dec
-13
Jan
-14
Feb
-14
Mar
-14
Ap
r-1
4
May
-14
Jun-
14
Jul-
14
Aug
-14
Sep
-14
Oct
-14
Freight rates movement (YoY) Freight rates movement (MoM) - (RHS)
40.0%
50.0%
60.0%
70.0%
80.0%
90.0%
0.00%
1.00%
2.00%
3.00%
4.00%
5.00%
6.00%
7.00%
8.00%
FY08
FY09
FY
10
FY11
FY12
FY13
FY14
FY
15
E
FY16
E
FY17
E
FY18
E
FY19
E
FY
20
E
GNPAs Provision Coverage (RHS)
Distance (kms) 1410 1410 1410
Vehicle 16T 25T 35T
Running Trips 3.5 4 4
Monthly running 4935 5640 5640
Load (Tonnes) 9 16 25
Rate/ tonne/km 2.4 2.2 2.1
Total Revenues 129,021 202,138 292,152
Mileage (km/litre) 5 3.6 2.5
Cost of Diesel (Rs./Litre) 58 58 58
Diesel Cost 57,246 90,867 130,848
Total operating cost (Ex Tolls) 74,590 104,709 136,960
Operating profit/Month 21,947 49,445 106,124
Cost of Truck 1,300,000 1,600,000 1,920,000
EMI Amount @11.5% (5 yrs loan) 25,731 31,669 37,399
Profit / Month (in cash terms) -3,784 17,776 68,725
Fleet operators' profitability - Current Situation
6.0%
6.5%
7.0%
7.5%
8.0%
8.5%
9.0%
9.5%
10.0%
0.0%
10.0%
20.0%
30.0%
40.0%
50.0%
60.0%
70.0%
FY08
FY09
FY10
FY11
FY12
FY13
FY14
FY15
E
FY16
E
FY17
E
AUM Growth NIMs (RHS)

LilladherPrabhudas Financials
Source: Company Data, Bloomberg, PL Research
P/BV
1/2/2015 103
ROA Decomposition (AUM) FY13 FY14 FY15E FY16E FY17E
Income from operations 3.3% 4.2% 4.8% 5.6% 6.1%
Income from securi tization 4.0% 2.5% 1.9% 1.9% 1.7%
Opearting Revenue 7.3% 6.7% 6.7% 7.5% 7.8%
Other income 0.8% 0.8% 0.7% 0.7% 0.6%
Total revenue 8.1% 7.4% 7.5% 8.1% 8.4%
Personnel expenses 0.9% 0.8% 0.8% 0.8% 0.8%
Opex 0.9% 1.0% 1.0% 1.0% 1.0%
Total operating cost 1.7% 1.8% 1.8% 1.8% 1.8%
Depericiation 0.0% 0.1% 0.1% 0.1% 0.0%
Provis ions 1.9% 2.0% 1.8% 2.1% 2.4%
PBT 4.5% 3.6% 3.7% 4.1% 4.2%
Tax 1.5% 1.1% 1.2% 1.4% 1.4%
ROA 3.0% 2.5% 2.5% 2.7% 2.7%
Leverage 16.2% 16.8% 17.3% 16.7% 16.0%
ROE 20.6% 16.3% 15.7% 16.4% 17.4%
Source: Company Data, PL Research
1.0
1.5
2.0
2.5
3.0
3.5
4.0
De
c-0
9
Mar
-10
Jun
-10
Sep
-10
De
c-1
0
Mar
-11
Jun
-11
Sep
-11
De
c-1
1
Mar
-12
Jun
-12
Sep
-12
De
c-1
2
Mar
-13
Jun
-13
Sep
-13
De
c-1
3
Mar
-14
Jun
-14
Sep
-14
De
c-1
4
P/ABV (x) 5 yr avg. (x) avg. + 1 SD (x) avg. - 1 SD (x)
Income Statement (Rs m)
Y/e March FY13 FY14 FY15E FY16E FY17E
Net interest income 14,837 21,429 26,379 34,634 44,826
Growth (%) 50.0 44.4 23.1 31.3 29.4
Non interest income 3,579 3,909 3,941 4,078 4,724
Net operating income 36,473 38,134 40,912 50,166 62,148
Employees 3,848 4,089 4,416 4,946 5,786
Other expenses 3,829 5,181 5,699 6,440 7,728
Total expenditure 7,860 9,561 10,421 11,707 13,851
PPP 28,613 28,574 30,491 38,460 48,297
Growth (%) 8.3 (0.1) 6.7 26.1 25.6
Provis ion 8,451 10,293 10,016 13,201 17,431
Other income - - - - -
Profi t before tax 20,162 18,281 20,476 25,258 30,866
Tax 6,556 5,638 6,552 8,588 10,494
PAT 13,606 12,642 13,923 16,670 20,372
Growth (%) 8.2 (7.1) 10.1 19.7 22.2
Source: Company Data, PL Research
Balance Sheet (Rs m)
Y/e March FY13 FY14 FY15E FY16E FY17E
Equity 2,269 2,269 2,269 2,269 2,269
Reserves & Surplus 69,679 80,463 92,340 106,365 123,503
Networth 71,947 82,732 94,609 108,634 125,772
Loan funds 310,025 359,300 400,214 487,639 596,751
Growth (%) 34.1 15.9 11.4 21.8 22.4
Total 381,972 442,032 494,823 596,273 722,523
Advances 311,227 364,737 428,566 518,565 648,206
Growth (%) 42.1 17.2 17.5 21.0 25.0
Investments 35,689 27,253 29,938 36,044 40,548
Total 381,972 442,032 494,123 593,755 732,321
Source: Company Data, PL Research

LilladherPrabhudas Disclaimer
1/2/2015 104
BUY : Over 15% Outperformance to Sensex over 12-months
Accumulate : Outperformance to Sensex over 12-months
Reduce : Underperformance to Sensex over 12-months
Sell : Over 15% underperformance to Sensex over 12-months
Trading Buy : Over 10% absolute upside in 1-month
Trading Sell : Over 10% absolute decline in 1-month
Not Rated (NR) : No specific call on the stock
Under Review (UR) : Rating likely to change shortly
DISCLAIMER/DISCLOSURES ANALYST CERTIFICATION We/I, Mr. Nitin Kumar (B.E, PGDM, CFA ), Mr. Pritesh Bumb (MBA, M.com), Research Analysts, authors and the names subscribed to this report, hereby certify that all of the views expressed in this research report accurately reflect our views about the subject issuer(s) or securities. We also certify that no part of our compensation was, is, or will be directly or indirectly related to the specific recommendation(s) or view(s) in this report. Terms & conditions and other disclosures: Prabhudas Lilladher Pvt. Ltd, Mumbai, India (hereinafter referred to as “PL”) is engaged in the business of Stock Broking, Portfolio Manager, Depository Participant and distribution for third party financial products. PL is a subsidiary of Prabhudas Lilladher Advisory Services Pvt Ltd. which has its various subsidiaries engaged in business of commodity broking, investment banking, financial services (margin funding) and distribution of third party financial/other products, details in respect of which are available at www.plindia.com This document has been prepared by the Research Division of PL and is meant for use by the recipient only as information and is not for circulation. This document is not to be reported or copied or made available to others without prior permission of PL. It should not be considered or taken as an offer to sell or a solicitation to buy or sell any security. The information contained in this report has been obtained from sources that are considered to be reliable. However, PL has not independently verified the accuracy or completeness of the same. Neither PL nor any of its affiliates, its directors or its employees accepts any responsibility of whatsoever nature for the information, statements and opinion given, made available or expressed herein or for any omission therein. Recipients of this report should be aware that past performance is not necessarily a guide to future performance and value of investments can go down as well. The suitability or otherwise of any investments will depend upon the recipient's particular circumstances and, in case of doubt, advice should be sought from an independent expert/advisor. Either PL or its affiliates or its directors or its employees or its representatives or its clients or their relatives may have position(s), make market, act as principal or engage in transactions of securities of companies referred to in this report and they may have used the research material prior to publication. PL may from time to time solicit or perform investment banking or other services for any company mentioned in this document. PL is in the process of applying for certificate of registration as Research Analyst under Securities and Exchange Board of India (Research Analysts) Regulations, 2014 PL submits that no material disciplinary action has been taken on us by any Regulatory Authority impacting Equity Research Analysis activities. PL or its research analysts or its associates or his relatives do not have any financial interest in the subject company. PL or its research analysts or its associates or his relatives do not have actual/beneficial ownership of one per cent or more securities of the subject company at the end of the month immediately preceding the date of publication of the research report. PL or its research analysts or its associates or his relatives do not have any material conflict of interest at the time of publication of the research report. PL or its associates might have received compensation from the subject company in the past twelve months. PL or its associates might have managed or co-managed public offering of securities for the subject company in the past twelve months or mandated by the subject company for any other assignment in the past twelve months. PL or its associates might have received any compensation for investment banking or merchant banking or brokerage services from the subject company in the past twelve months. PL or its associates might have received any compensation for products or services other than investment banking or merchant banking or brokerage services from the subject company in the past twelve months PL or its associates might have received any compensation or other benefits from the subject company or third party in connection with the research report. PL encourages independence in research report preparation and strives to minimize conflict in preparation of research report. PL or its analysts did not receive any compensation or other benefits from the subject Company or third party in connection with the preparation of the research report. PL or its Research Analysts do not have any material conflict of interest at the time of publication of this report. It is confirmed that Mr. Nitin Kumar (B.E, PGDM, CFA ), Mr. Pritesh Bumb (MBA, M.com), Research Analysts of this report have not received any compensation from the companies mentioned in the report in the preceding twelve months Compensation of our Research Analysts is not based on any specific merchant banking, investment banking or brokerage service transactions. The Research analysts for this report certifies that all of the views expressed in this report accurately reflect his or her personal views about the subject company or companies and its or their securities, and no part of his or her compensation was, is or will be, directly or indirectly related to specific recommendations or views expressed in this report. The research analysts for this report has not served as an officer, director or employee of the subject company PL or its research analysts have not engaged in market making activity for the subject company Our sales people, traders, and other professionals or affiliates may provide oral or written market commentary or trading strategies to our clients that reflect opinions that are contrary to the opinions expressed herein, and our proprietary trading and investing businesses may make investment decisions that are inconsistent with the recommendations expressed herein. In reviewing these materials, you should be aware that any or all o the foregoing, among other things, may give rise to real or potential conflicts of interest. PL and its associates, their directors and employees may (a) from time to time, have a long or short position in, and buy or sell the securities of the subject company or (b) be engaged in any other transaction involving such securities and earn brokerage or other compensation or act as a market maker in the financial instruments of the subject company or act as an advisor or lender/borrower to the subject company or may have any other potential conflict of interests with respect to any recommendation and other related information and opinions.
Prabhudas Lilladher Pvt. Ltd.
3rd Floor, Sadhana House, 570, P. B. Marg, Worli, Mumbai 400 018, India.
Tel: (91 22) 6632 2222 Fax: (91 22) 6632 2209
Rating Distribution of Research Coverage PL’s Recommendation Nomenclature
37.4%
43.9%
17.8%
0.9%
0%
10%
20%
30%
40%
50%
BUY Accumulate Reduce Sell
% o
f To
tal C
ove
rage