Click to edit Master text styles -...
22
Kellogg Company September 8, 2011 Page 1 of 22 • Click to edit Master text styles – Second level • Third level – Fourth level » Fifth level 1 | September 8, 2011 | Barclays 2011 Back to School Conference 1 This presentation contains, or incorporates by reference, “forward‐looking statements” with projections concerning, among other things, the Company’s strategy, and the Company’s sales, earnings, margin, operating profit, costs and expenditures, interest expense, tax rate, capital expenditure, dividends, cash flow, debt reduction, share repurchases, costs, brand building, ROIC, working capital, growth, new products, innovation, cost reduction projects, and competitive pressures. Forward‐looking statements include predictions of future results or activities and may contain the words “expects,” “forecasts,” “believes,” “should,” “will,” “will deliver,” “anticipates,” “projects,” “estimates,” or words or phrases of similar meaning. The Company’s actual results or activities may differ materially from these predictions. The Company’s future results could also be affected by a variety of factors, including the impact of competitive conditions; the effectiveness of pricing, advertising, and promotional programs; the success of innovation, renovation and new product introductions; the recoverability of the carrying value of goodwill and other intangibles; the success of productivity improvements and business transitions; commodity and energy prices; labor costs; disruptions or inefficiencies in supply chain; the availability of and interest rates on short‐term and long‐term financing; actual market performance of benefit plan trust investments; the levels of spending on systems initiatives, properties, business opportunities, integration of acquired businesses, and 2 | September 8, 2011 | Barclays 2011 Back to School Conference other general and administrative costs; changes in consumer behavior and preferences; the effect of U.S. and foreign economic conditions on items such as interest rates, statutory tax rates, currency conversion and availability; legal and regulatory factors; including changes in advertising and labeling laws and regulations; the ultimate impact of product recalls; business disruption or other losses from war, terrorist acts or political unrest; and other items. Forward‐looking statements speak only as of the date they were made, and the Company undertakes no obligation to publicly update them.
Transcript of Click to edit Master text styles -...

Kellogg Company September 8, 2011
Page 1 of 22
• Click to edit Master text styles
– Second level
• Third level– Fourth level
» Fifth level
1 | September 8, 2011 | Barclays 2011 Back to School Conference1
This presentation contains, or incorporates by reference, “forward‐looking statements” with projections concerning, among
other things, the Company’s strategy, and the Company’s sales, earnings, margin, operating profit, costs and expenditures,
interest expense, tax rate, capital expenditure, dividends, cash flow, debt reduction, share repurchases, costs, brand
building, ROIC, working capital, growth, new products, innovation, cost reduction projects, and competitive pressures.
Forward‐looking statements include predictions of future results or activities and may contain the words “expects,”
“forecasts,” “believes,” “should,” “will,” “will deliver,” “anticipates,” “projects,” “estimates,” or words or phrases of similar
meaning.
The Company’s actual results or activities may differ materially from these predictions. The Company’s future results could
also be affected by a variety of factors, including the impact of competitive conditions; the effectiveness of pricing,
advertising, and promotional programs; the success of innovation, renovation and new product introductions; the
recoverability of the carrying value of goodwill and other intangibles; the success of productivity improvements and
business transitions; commodity and energy prices; labor costs; disruptions or inefficiencies in supply chain; the availability
of and interest rates on short‐term and long‐term financing; actual market performance of benefit plan trust investments;
the levels of spending on systems initiatives, properties, business opportunities, integration of acquired businesses, and
2 | September 8, 2011 | Barclays 2011 Back to School Conference
other general and administrative costs; changes in consumer behavior and preferences; the effect of U.S. and foreign
economic conditions on items such as interest rates, statutory tax rates, currency conversion and availability; legal and
regulatory factors; including changes in advertising and labeling laws and regulations; the ultimate impact of product
recalls; business disruption or other losses from war, terrorist acts or political unrest; and other items.
Forward‐looking statements speak only as of the date they were made, and the Company undertakes no obligation to
publicly update them.

Kellogg Company September 8, 2011
Page 2 of 22
Path to rebuilding momentum John Bryant
Marketing & consumer agenda Mark Baynes
Financial model Ron Dissinger
Long‐term growth potentialand Q&A John Bryant
3 | September 8, 2011 | Barclays 2011 Back to School Conference
y
®
®
® ™ ™
®™
®
2010Grow Gross
Grow Internal Net Sales1
SustainableGrowth
Overhead Discipline1
Profit Dollars1
Improve Price / Mix
Net Sales1
4 | September 8, 2011 | Barclays 2011 Back to School Conference
Drive Innovation2 Grow Brand
Building1
1) Internal metrics exclude the impact of foreign currency translation and if applicable, acquisitions,dispositions and shipping day differences.
2) Rolling 3‐year innovation.

Kellogg Company September 8, 2011
Page 3 of 22
Supply chain significant progresssignificant progress
Innovation
Deflation
5 | September 8, 2011 | Barclays 2011 Back to School Conference
Non‐measured channels
HACCP ProgramsHazard Analysis
Food protection plan – key foundational components
Transportation
GMP SSOPHygienicZoning
Hygienic Equipment & Infrastructure
Training and EducationSkills / Culture
Materials Ingredients Packaging
Key ManufacturingPrograms
6 | September 8, 2011 | Barclays 2011 Back to School Conference
Training and EducationSkills / Culture
Verification / Validation Lethality Validation Environmental Monitoring Audits

Kellogg Company September 8, 2011
Page 4 of 22
2011Grow Gross Grow Internal
2010
SustainableGrowth
Overhead Discipline(a)
Grow Gross Profit Dollars
Improve Price / Mix
Grow Internal
Net Sales(a)
SustainableGrowth
Overhead Discipline1
Profit Dollars1
Improve Price / Mix
Net Sales1Drive Innovation(b) Grow Brand
Building(a)
7 | September 8, 2011 | Barclays 2011 Back to School Conference
1) Internal metrics exclude the impact of foreign currency translation and if applicable, acquisitions,dispositions and shipping day differences.
2) Rolling 3‐year innovation.
Drive Innovation2 Grow Brand
Building1
Net Sales from innovation over 3 years
Net Sales from current –year innovation
12.3%13.5% ≈14%
16.0%
2009 2010 2011 Estimate
2012 Forecast
2009 2010 2011 Estimate
2012 Forecast
more than2011
more than2011
8 | September 8, 2011 | Barclays 2011 Back to School Conference
Estimate ForecastEstimate Forecast

Kellogg Company September 8, 2011
Page 5 of 22
DRIVERS
4 – 5% •Base price increase
•Trade spend decrease
•Coupon reductions
9 | September 8, 2011 | Barclays 2011 Back to School Conference
2009 2010 2011 Est.
• Innovation driving positive mix
Trade spend reduction – example
+12%$ sales vs YAG
Special K Year‐to‐Date
Results
20112010$2.99$2.50
10 | September 8, 2011 | Barclays 2011 Back to School Conference
Source: Nielsen 24 w/e 6/18/11 vs. YA; promoted price point increase on select Special K SKUs representing approximately 20% of total Special K gross sales
$ sales vs. YAG

Kellogg Company September 8, 2011
Page 6 of 22
Internal Net Sales TrendsYear‐over‐year growth
5% 5%
3%
‐1%
5%4 – 5%
11 | September 8, 2011 | Barclays 2011 Back to School Conference
2007 2008 2009 2010 2011Guidance
Gross Profit Dollar GrowthInternal, year‐over‐year growth
5%
2%
6%
‐2%
3%2 – 3%
12 | September 8, 2011 | Barclays 2011 Back to School Conference
Guidance
2007 2008 2009 2010 2011

Kellogg Company September 8, 2011
Page 7 of 22
Remain disciplined on overhead in 2011
Significant bonus headwind in 2011
Long‐term goal of half the rate of sales growth (HOG)
Will continue to invest in digital and R&D
13 | September 8, 2011 | Barclays 2011 Back to School Conference
Will continue to invest in digital and R&D capabilities
9%Advertising as a Percent of Net Sales
9%
7%
6%5%
3% 3% 3% 3%
Over$1 billionOver
$1 billion
14 | September 8, 2011 | Barclays 2011 Back to School Conference
Kellogg A B C D E F G
Source: Data from most recent 10‐K filing as of 07/28/11.
Peers

Kellogg Company September 8, 2011
Page 8 of 22
Brand Building GrowthInternal, year‐over‐year
5%
‐2%
2%
0%
2%LSD
flat
15 | September 8, 2011 | Barclays 2011 Back to School Conference
2007 2008 2009 2010 2011Estimate
Note: LSD = low single‐digit
Stabilized our business in 2011 with t t li th d i bstrong top‐line growth driven by innovation
Will need to increase brand‐building investment in 2012 to continue regaining
t
16 | September 8, 2011 | Barclays 2011 Back to School Conference
momentum

Kellogg Company September 8, 2011
Page 9 of 22
SubheadingClick to edit Master title style
• Click to edit Master text styles
– Second level
• Third level– Fourth level
» Fifth levelPlaceholder
17 | September 8, 2011 | Barclays 2011 Back to School Conference9/7/2011 17
The right brandsThe right brands . . .
The right ideas . . .
The right investment . . .
18 | September 8, 2011 | Barclays 2011 Back to School Conference

Kellogg Company September 8, 2011
Page 10 of 22
Significant upgrade of our marketing capabilities in the last 2 years
Enhanced category understanding globally to create stronger portfolio design and investment focus
Strengthening our innovation capability and delivery while building stronger long‐term visibility
Improving returns on our marketing investment through significant upgrade in our creative, media / digital capability and focus
19 | September 8, 2011 | Barclays 2011 Back to School Conference
Becoming a stronger technology‐enabled organization to drive stronger participation in all aspects of the emerging digital agenda
A marketing function upgraded in talent and capability to operate effectively in the changing brand and consumer landscape
To maximize growth and returns,g ,
it is key that we optimize our portfolio
design by market to ensure we are
maximizing coverage of the core category needs
and aligning our investment accordingly.
20 | September 8, 2011 | Barclays 2011 Back to School Conference
and aligning our investment accordingly.
Kellogg Company September 8, 2011
Page 11 of 22
Global Segmentation • Common / category understanding across 16 markets
• Studies conducted amongst adults / moms
• Largest global study conducted at Kellogg• Provides common view, language and approach across markets
Benefits
21 | September 8, 2011 | Barclays 2011 Back to School Conference
Every brand plan
b ild dibilimust strive to build credibility
and relevance amongst users and non‐users.
We accomplish this by executing fresh and powerful ideas
that drive breakthrough and differentiation
22 | September 8, 2011 | Barclays 2011 Back to School Conference
within the categories in which we compete.

Kellogg Company September 8, 2011
Page 12 of 22
To win in our categories, we must have bigger and better ideas
Targeting ProspectsDriving Brand Reappraisal
(non‐food)Innovation
• Boomers
• Millenials
• Hispanics
• SpK drop a jeans size
• All‐Bran 7‐day promise
• Kashi day of change
• Rice Krispies recipes
• Line extensions
• New brands
• New categories
Building Category Credentials
Communications IdeasDriving Brand Reappraisal
(food renovation)
23 | September 8, 2011 | Barclays 2011 Back to School Conference
• Love Your Cereal
• Breakfast 365
• SpK restage Mexico
• Coco Pops – Choc ’N Roll
• Kids fiber / whole grain U.S.
• New campaign idea
• New media partnerships
• Extended media presence
Strengthening the front‐end process
IdeaIdea
Idea
Good ideas
Brand/
Portfolio strategy
Consumer insight
24 | September 8, 2011 | Barclays 2011 Back to School Conference
Four Lens approach to insight generation
Platforms identified as broad opportunity areas for idea development
A bigger funnel of well‐connected ideas
Kellogg Company September 8, 2011
Page 13 of 22
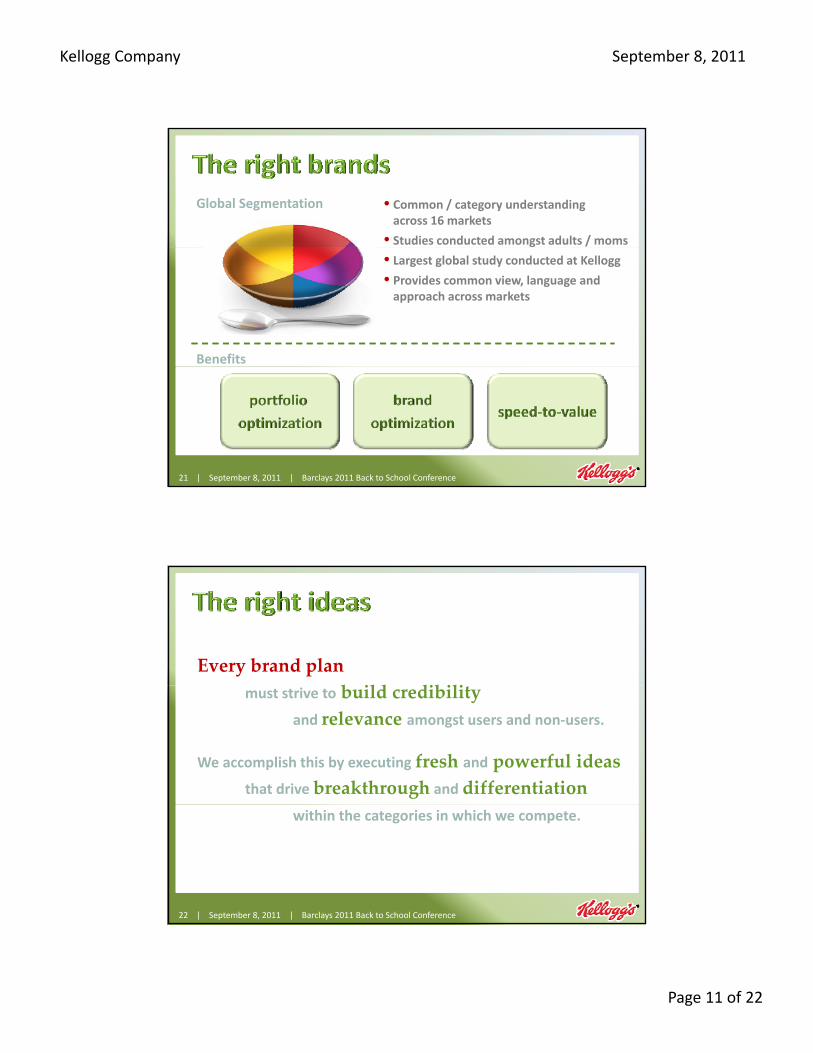
Line Extension / Existing Brands
Expansion of Ideas across Markets New to Category
• Special K Clusters (Europe)
• Crunchy Nut from UK to US
• All‐Bran Golden Crunch (UK)
• Mini‐WheatsTouch of Fruit
• Trésor from France to UK to Mexico
• Special K Cracker Chips (US)
• Be Natural Cereal (Australia)
25 | September 8, 2011 | Barclays 2011 Back to School Conference
(US)
• Eggo – Thick & Fluffy Waffle (US)
• Fiber Plus from US to Canada & UK
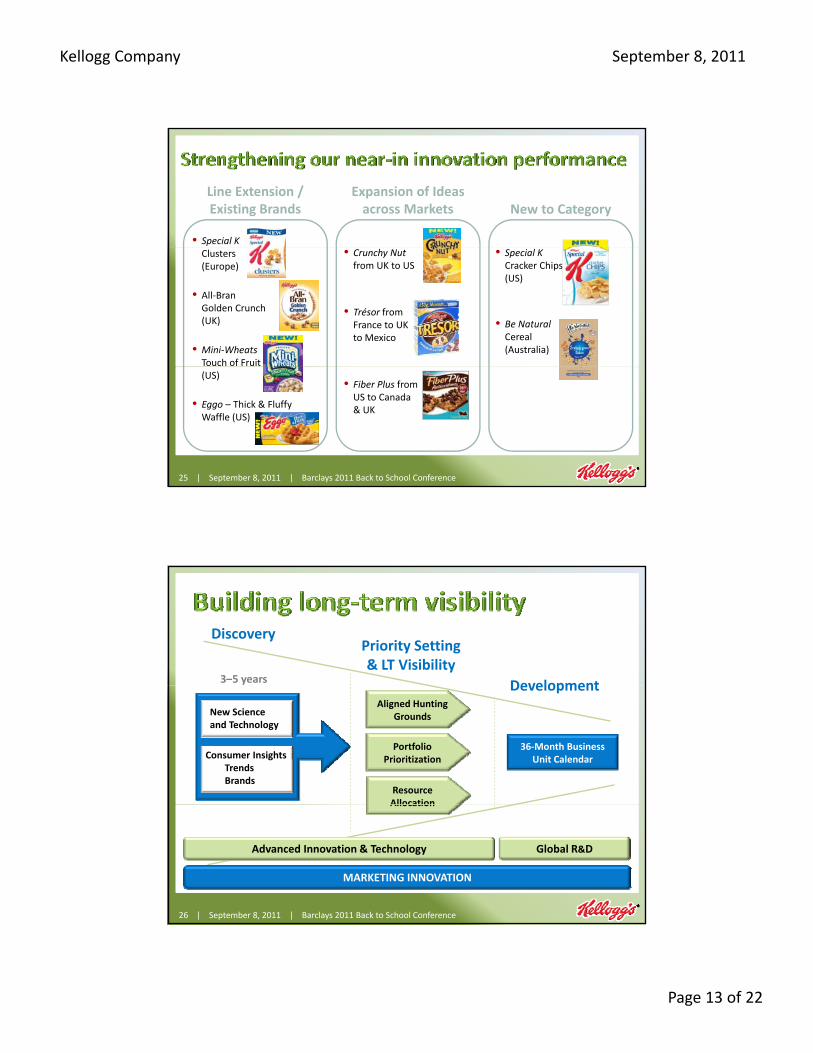
Development3–5 years
Priority Setting & LT Visibility
Discovery
Development
Consumer InsightsTrendsBrands
New Science and Technology
36‐Month Business Unit Calendar
PortfolioPrioritization
ResourceAllocation
Aligned Hunting Grounds
26 | September 8, 2011 | Barclays 2011 Back to School Conference
Global R&D
Allocation
Advanced Innovation & Technology
MARKETING INNOVATION

Kellogg Company September 8, 2011
Page 14 of 22
As the consumer marketing landscape
grows increasingly complex, having the ability to reach
the right people,
with the right message
at the right time and place
27 | September 8, 2011 | Barclays 2011 Back to School Conference
g p
is essential to advancing the effectiveness and
efficiency of our marketing investment.
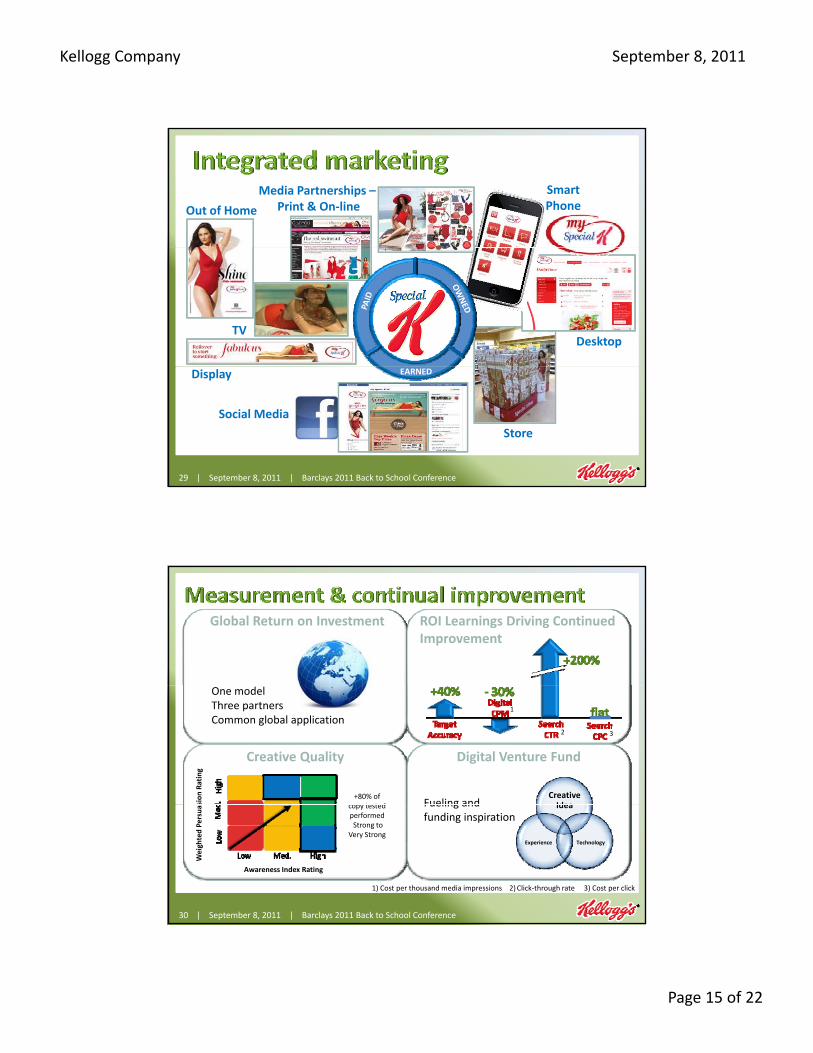
New Reality
All media is becoming
New Opportunity
Deliver integrated
Restructured Agency Model
Creating Integrated Experience Plans
AdvancingCapability & Process
Fewer,
All media is becoming digitally‐enabled media
Deliver integrated experiences across Paid, Owned, Earned media
28 | September 8, 2011 | Barclays 2011 Back to School Conference
Paid Own Earn
,Better,
Aligned
Kellogg Company September 8, 2011
Page 15 of 22
Out of Home
Media Partnerships –Print & On‐line
SmartPhone
TVDesktop
29 | September 8, 2011 | Barclays 2011 Back to School Conference
Display
Store
Social Media
EARNED
ROI Learnings Driving Continued Improvement
Global Return on Investment
Digital Venture FundCreative Quality
One modelThree partnersCommon global application
Fueling andCreative Idea
+80% of copy testedsi
on Rating
1
2 3
30 | September 8, 2011 | Barclays 2011 Back to School Conference
Fueling and funding inspiration
Idea
TechnologyExperience
copy tested performedStrong to
Very Strong
Weighted Persuas
Awareness Index Rating
1) Cost per thousand media impressions 2)Click‐through rate 3) Cost per click

Kellogg Company September 8, 2011
Page 16 of 22
Invite
ConnectGrow
Formed Built global digital Implemented state‐
Digital Marketing Digital Platform Consumer Database
31 | September 8, 2011 | Barclays 2011 Back to School Conference
Formed consumer‐centric digital marketing IT function enabling marketing agenda
Built global digital platform for superior consumer experience and efficient content
Implemented stateof‐the‐art consumer database; rapidly scaling size and capability
Marketing and consumer agenda fully aligned to support the path to rebuilding momentum
Playing our game playing our game better
Significant upgrade of our marketing capability through the development of The K Way
• Stronger consumer centricity
• Investing in talent and capability against changing
32 | September 8, 2011 | Barclays 2011 Back to School Conference
Investing in talent and capability against changing consumer / brand landscape
Win in our categories through the right brands, the right ideas and the right investment

Kellogg Company September 8, 2011
Page 17 of 22
Town HouseFrosted Flakes
Special K All‐Bran (Australia)
33 | September 8, 2011 | Barclays 2011 Back to School Conference
•Text
SubheadingClick to edit Master title style
• Click to edit Master text styles
TextTextText
•Text•Text•Text
– Second level
• Third level– Fourth level
» Fifth level
34 | September 8, 2011 | Barclays 2011 Back to School Conference9/7/2011 34

Kellogg Company September 8, 2011
Page 18 of 22
Operating Principles
Grow Internal Net Sales1
LT Outlook: 3 to 4%
Grow Gross Profit Dollars1
LT Outlook: grow in line with l li htl b
SustainableGrowth
LT Outlook: 3 to 4%
Overhead Discipline1
LT Outlook: half the rate of sales growth
sales or slightly above
Improve Price / MixLT Outlook: improvements
to mitigate inflation
35 | September 8, 2011 | Barclays 2011 Back to School Conference
1) Internal metrics exclude the impact of foreign currency translation and if applicable, acquisitions,dispositions and shipping day differences.
2) Rolling 3‐year innovation.
Drive Innovation2
LT Outlook: approx. 15% of net sales Grow Brand Building1
LT Outlook: low to mid single‐digit growth
Operating Principles
Grow Net EarningsLT Outlook: mid single‐digit growth
Managefor Cash
Increase Return on Invested Capital
LT Outlook: improve over time
Reduce CoreWorking Capital
LT Outlook: continuous improvement
36 | September 8, 2011 | Barclays 2011 Back to School Conference
Return Cash to Shareowners– dividends– share repurchases
Prioritize Capital ExpenditureLT Outlook: 3 to 4% of sales

Kellogg Company September 8, 2011
Page 19 of 22
•Dividends per share (five‐year CAGR1) +8%
•Average annual share repurchases2 >$650 million
Dividends
(billions)
$0.7
$1.1 $1.1
$1.6
$1.4 est.
Share Repurchases
37 | September 8, 2011 | Barclays 2011 Back to School Conference
2007 2008 2009 2010 2011Estimate
1) CAGR base year 2006 to estimate for 2011. 2) Average annual share repurchases 2007 through estimate for 2011.
Net Debt5(billions)
Allocation of CashCumulative 2007 – 20111(billions)
38 | September 8, 2011 | Barclays 2011 Back to School Conference
Net cash from operations
Share repurchases
Dividends
Discretionary pension contributions
Acquisitions
2 1) Data for 2011 are estimates only.2) Cash proceeds from issuances of stock related to employee stock
option exercises.3) Cash from operations less capital spending before incremental
pension contributions.4) Incremental pension contribution above base, net of tax.5) Net debt includes current maturities of long‐term debt, notes
payable, and long‐term debt less total cash and cash equivalents.
3
Cash from options4

Kellogg Company September 8, 2011
Page 20 of 22
Committed to returning cash to shareowners through dividends and share repurchasesdividends and share repurchases
Evaluate bolt‐on acquisitions or other partnerships to support long‐term growth strategy
Comfortable with capital structure andcredit rating
39 | September 8, 2011 | Barclays 2011 Back to School Conference
Operating principles are a foundationalelement of our business
Long‐term Guidance
Internal Net Sales1
Internal Operating Profit1
Earnings Per Share2
+3 to 4%
+ High single‐digits
+ Mid single‐digits
40 | September 8, 2011 | Barclays 2011 Back to School Conference
1) Internal net sales and operating profit growth exclude the impact of foreign currency translation and if applicable, acquisitions,dispositions and shipping day differences.
2) Currency‐neutral earnings per share growth excludes the impact of translational foreign exchange.
Earnings Per Sharecurrency‐neutral basis
Kellogg Company September 8, 2011
Page 21 of 22
•Text
SubheadingClick to edit Master title style
• Click to edit Master text styles
TextTextText
•Text•Text•Text
– Second level
• Third level– Fourth level
» Fifth level
41 | September 8, 2011 | Barclays 2011 Back to School Conference9/7/2011 41
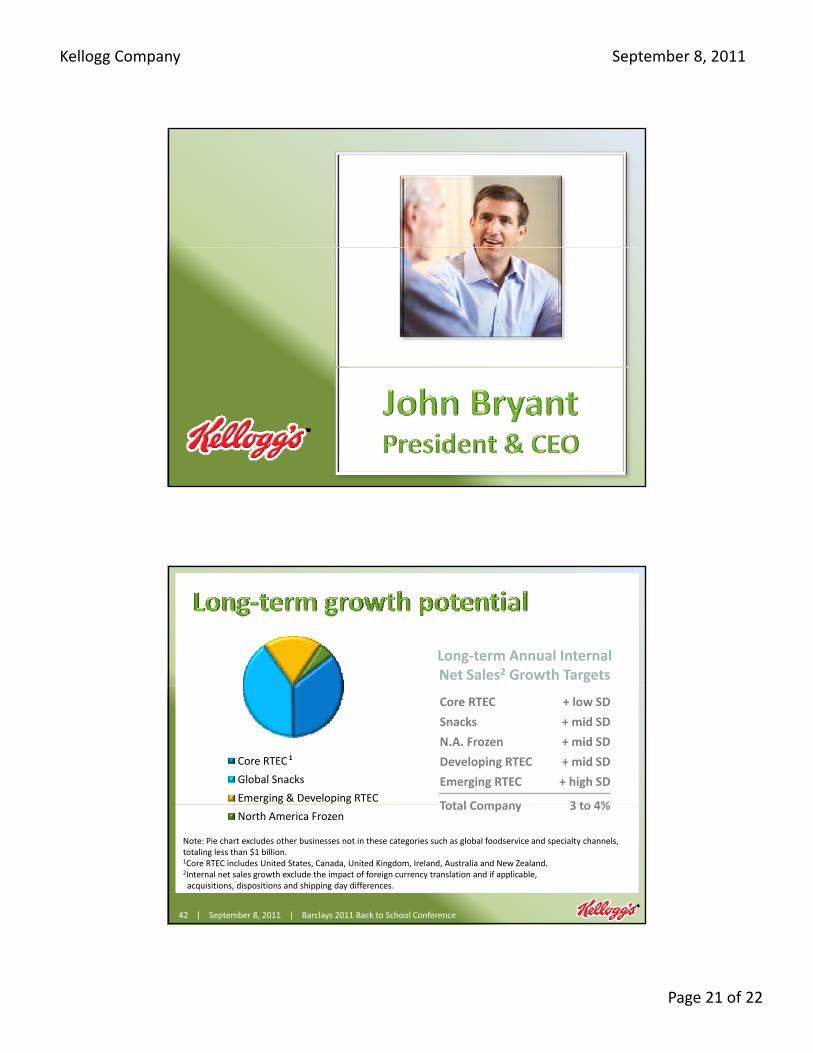
Long‐term Annual InternalNet Sales2 Growth Targets
Core RTEC + low SD
Snacks + mid SD
N.A. Frozen + mid SD
Developing RTEC + mid SD
Emerging RTEC + high SD
Total Company 3 to 4%
Core RTEC
Global Snacks
Emerging & Developing RTEC
1
42 | September 8, 2011 | Barclays 2011 Back to School Conference
Total Company 3 to 4%North America Frozen
Note: Pie chart excludes other businesses not in these categories such as global foodservice and specialty channels, totaling less than $1 billion. 1Core RTEC includes United States, Canada, United Kingdom, Ireland, Australia and New Zealand.2Internal net sales growth exclude the impact of foreign currency translation and if applicable, acquisitions, dispositions and shipping day differences.

Kellogg Company September 8, 2011
Page 22 of 22
Committed to realistic goals and managing the business for the long termbusiness for the long term
Committed to brand building and innovationto sustainably win in the marketplace
Exciting long‐term growth
43 | September 8, 2011 | Barclays 2011 Back to School Conference
g g gpotential
44 | September 8, 2011 | Barclays 2011 Back to School Conference