Click to edit Master subtitle style 2/6/12 Quantification of anthropogenic emissions from an urban...
16
Click to edit Master subtitle style 2/6/12 Quantification of anthropogenic emissions from an urban region: First results of time- integrated flask samples from the Indianapolis Flux Project (INFLUX) Jocelyn Turnbull , Colm Sweeney, Doug Guenther, Anna Karion, Tim Newberger, Pieter Tans, NOAA/ESRL and CIRES, University of Colorado Natasha Miles, Scott Richardson, Thomas Lauvaux, Kenneth Davis, Pennsylvania State University Paul Shepson, Obie Cambaliza, Purdue University Kevin Gurney, Arizona State University Scott Lehman, INSTAAR, University of Colorado NOAA/ESRL Carbon Cycle Group, INSTAAR Isotope and 14C Lab Staff
-
Upload
ethelbert-harrington -
Category
Documents
-
view
216 -
download
2
Transcript of Click to edit Master subtitle style 2/6/12 Quantification of anthropogenic emissions from an urban...
Click to edit Master subtitle style
2/6/12
Quantification of anthropogenic emissions from an urban region:
First results of time-integrated flask samples from the Indianapolis Flux
Project (INFLUX)Jocelyn Turnbull, Colm Sweeney, Doug Guenther, Anna Karion, Tim Newberger, Pieter Tans, NOAA/ESRL and CIRES, University of Colorado
Natasha Miles, Scott Richardson, Thomas Lauvaux, Kenneth Davis, Pennsylvania State University
Paul Shepson, Obie Cambaliza, Purdue UniversityKevin Gurney, Arizona State University
Scott Lehman, INSTAAR, University of ColoradoNOAA/ESRL Carbon Cycle Group, INSTAAR Isotope and 14C Lab Staff

2/6/12
Why use time-integrated flask samples?
In urban regions, can have substantial variability in mixing ratios – integrated samples reduce some of this noise
Match atmospheric sampling with the ~1 hour time step of regional models and meteorological data
Keep integrating time short enough that meteorology is consistent
0 10 20 30 40 50 6002468
1012
Minute of hour
In s
itu C
O2
(p
pm
)
INFLUX tower 1, 2011-04-09 20:00-21:00 UTC

Click to edit Master subtitle style
2/6/12
integrating volume (15L)
filter
valve
water
trap
Dryer/integrater package Integrating compressor package Portable flask package
filter
fast flushvalve
ventvalve
0-1L flow controller
pump
pressure reliefvalve pressure
sensor
pump
• Sample collected over 1 hour• Mix 1 hour of air by flowing through
a large mixing volume• Vary flow rate during filling to obtain
close to linear mixture• Collect air into 2 PFP flasks for
measurement
Integrated flask sampling
0 12 24 36 48 6002468
1012
Weighting function
Time (minutes)
Percentage of air in flask at
end of 60 minutes
0 12 24 36 48 600
0.0050.01
0.0150.02
0.0250.03
0.0350.04
0.0450.05
Weighting function
Time (minutes)
Percentage of air in flask at
end of 60 minutes

2/6/12
Integrated flask sampling validation
in situ – flask difference 0.01±0.09 ppm
Hourly averaged continuous – integrated flask CO2
For comparison: LEF 396 m in situ vs grab flask samples (2006-2011) in situ – flask difference 0.03±0.38 ppm

2/6/12
INFLUX: Tower flask results
Flask samples collected only when Tower 2 is downwind
Tower 1 is always upwind, background station
(Criteria met 25% of days)
Towers are 120-150m tall cell phone towers
Prevailing wind

2/6/12
CO2 enhancements across Indianapolis
Tower 2 (downwind) - Tower 1 (upwind)

2/6/12
Enhancements across Indianapolis
Strong enhancements in most anthropogenic species

2/6/12
Methane not always enhanced!

2/6/12
D14CO2 and fossil fuel
CO2D14CO2 is lower at
Tower 2 – 14C-free CO2ff
decreases D14CO2
D14CO2
CO2ff
CO2ff =
CO2obs (Δobs -Δbg)
Δff -Δbg
CO2r (Δr -Δbg)
Δff -Δbg
CO2ff enhanced at Tower 2

2/6/12
Contributions to CO2 enhancement
Flask samples from Dec 2010 – May 2011Slope = 1.1 ± 0.2 ppm/ppm
1:1 line (if DCO2 all due to CO2ff)
2/6/12
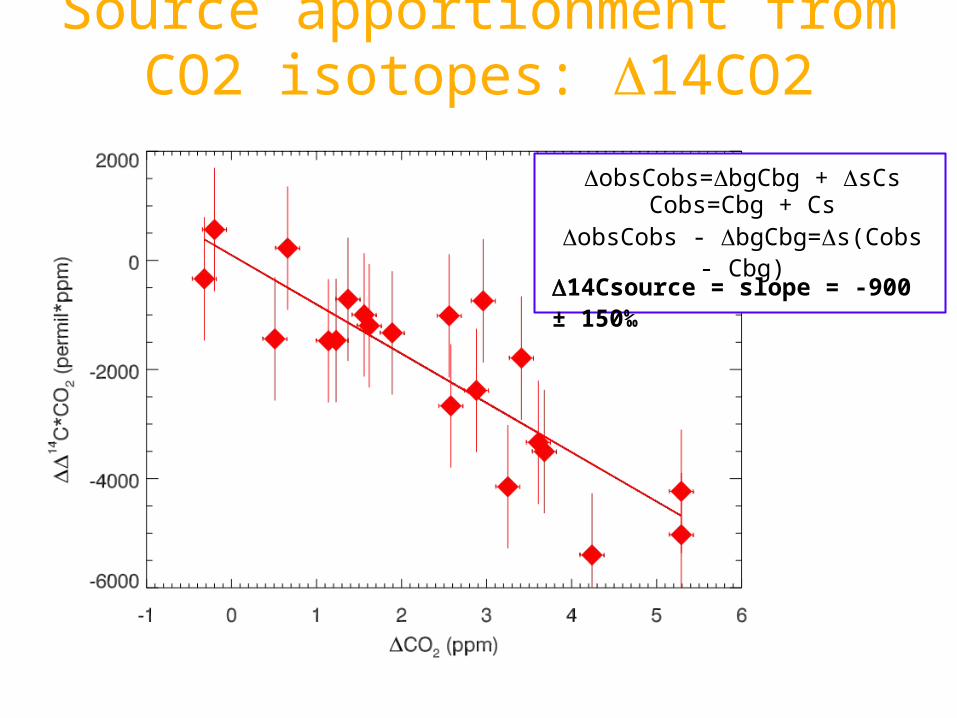
Source apportionment from CO2 isotopes: D14CO2
D14Csource = slope = -900 ± 150‰
DobsCobs=DbgCbg + DsCsCobs=Cbg + Cs
DobsCobs - DbgCbg=Ds(Cobs - Cbg)

2/6/12
D14C DCO2 fraction
Background atmosphere 40 ‰
Urban source -900 ± 150 ‰
Fossil fuels -1000 ‰(zero 14C content)
0.9 ± 0.15
Other sources (biofuel/respiration/photosynthesis)
40 ‰ 0.1 ± 0.15
DsCs=DffCff + DotherCother Cff/Cs=(Ds – Dother)/(Dff – Dother)
Source apportionment from CO2 isotopes: D14CO2
Indiana mandates 10% bio-ethanol in gasoline In winter, Indianapolis urban CO2 emissions are 90% CO2ff,
10% biofuelNo significant respiration/photosynthesis contribution, even in
summer!

2/6/12
Source apportionment from CO2 isotopes: d13CO2
d13Csource = slope = -29.1 ± 1.1‰

2/6/12
d13C D14C DCO2 fraction
Background atmosphere -8.0 ‰ 40 ‰
Winter urban source -29.1 ± 1.1 ‰ -900 ± 150 ‰
Fossil fuels -1000 ‰ 0.9 ± 0.15
Natural gas -40 ‰ 0.33
Petroleum -28 ‰ 0.30
Coal -24 ‰ 0.27
Other sources 40 ‰ 0.1 ± 0.15
Bioethanol (from corn) -10.4 ‰ 0.1
Respiration/photosynthesis
-26.0 ‰ 0.0
dsCs=dngCng + dpetCpet + dcoalCcoal + dbfCbf + dbioCbio
Source apportionment from CO2 isotopes: D14CO2 and d13CO2
Split CO2ff into different fuel types using d13CO2Compare with inventory estimates of fuel types

2/6/12
Correlation with CO and benzene
Emission ratios for CO and benzene are ~20% lower than observed in other US cities Large power plant contributes 30% of Indy CO2ff = lower emission ratios?
CO:CO2ff12±3 ppb/ppm
Benzene:CO2ff14±3 ppt/ppm

2/6/12
Summary INFLUX towers use a new time-integrated flask sampling
system to collect samples averaged over a 1 hour period
Tower sampling is designed to capture both upwind (background) and downwind signals
Strong enhancements in anthropogenic species across the urban region
In winter and in spring in Indianapolis, the CO2 enhancement appears to be entirely due to CO2ff and bio-ethanol (there is no apparent photosynthesis/respiration signal)
Reasonable correlations of CO2ff with combustion tracers such as CO and benzene, with emission ratios slightly lower than Western US cities, likely due to influence of power plant