CLICK HERE TO KNOW MORE - GeoSmart Asiageosmartasia.org/2017/ppts/Blanco.pdf · Yield Estimation...
43
CLICK HERE TO KNOW MORE
Transcript of CLICK HERE TO KNOW MORE - GeoSmart Asiageosmartasia.org/2017/ppts/Blanco.pdf · Yield Estimation...

CLICKHERETOKNOWMORE
The UP-SRA
Yield Estimation System for Sugarcane (YESS) Project
a Department of Geodetic Engineering
b Training Center for Applied Geodesy and Photogrammetry
University of the Philippines Diliman
A.C. Blancoa,b*, A.B. Baloloyb, M.A.G. Manalilib, M.A.L.S. Rascob, M.E.R. Tagleb, B.M.M.S. Ganab,
R.R.C. Sta. Anab , R.R.T. Franciscob, L.C. Olaliac c Sugar Regulatory Administration
Department of Agriculture
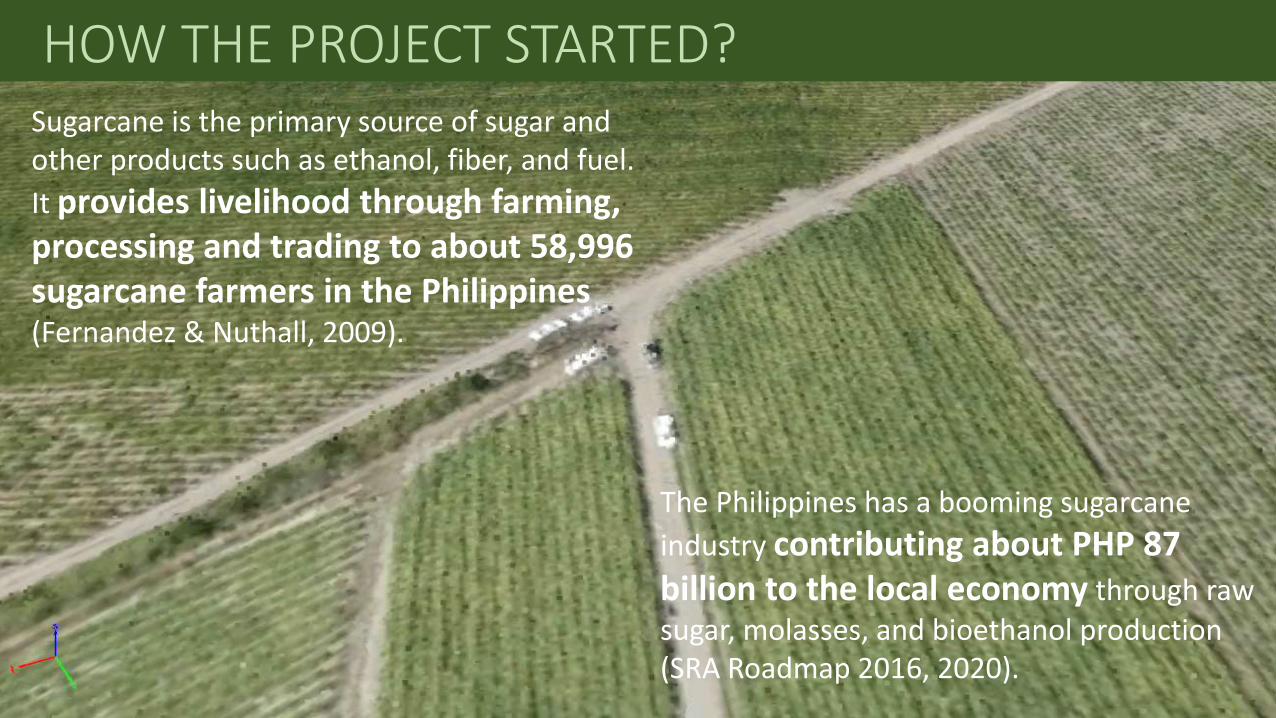
HOW THE PROJECT STARTED? Sugarcane is the primary source of sugar and other products such as ethanol, fiber, and fuel.
It provides livelihood through farming, processing and trading to about 58,996 sugarcane farmers in the Philippines (Fernandez & Nuthall, 2009).
The Philippines has a booming sugarcane
industry contributing about PHP 87 billion to the local economy through raw sugar, molasses, and bioethanol production (SRA Roadmap 2016, 2020).
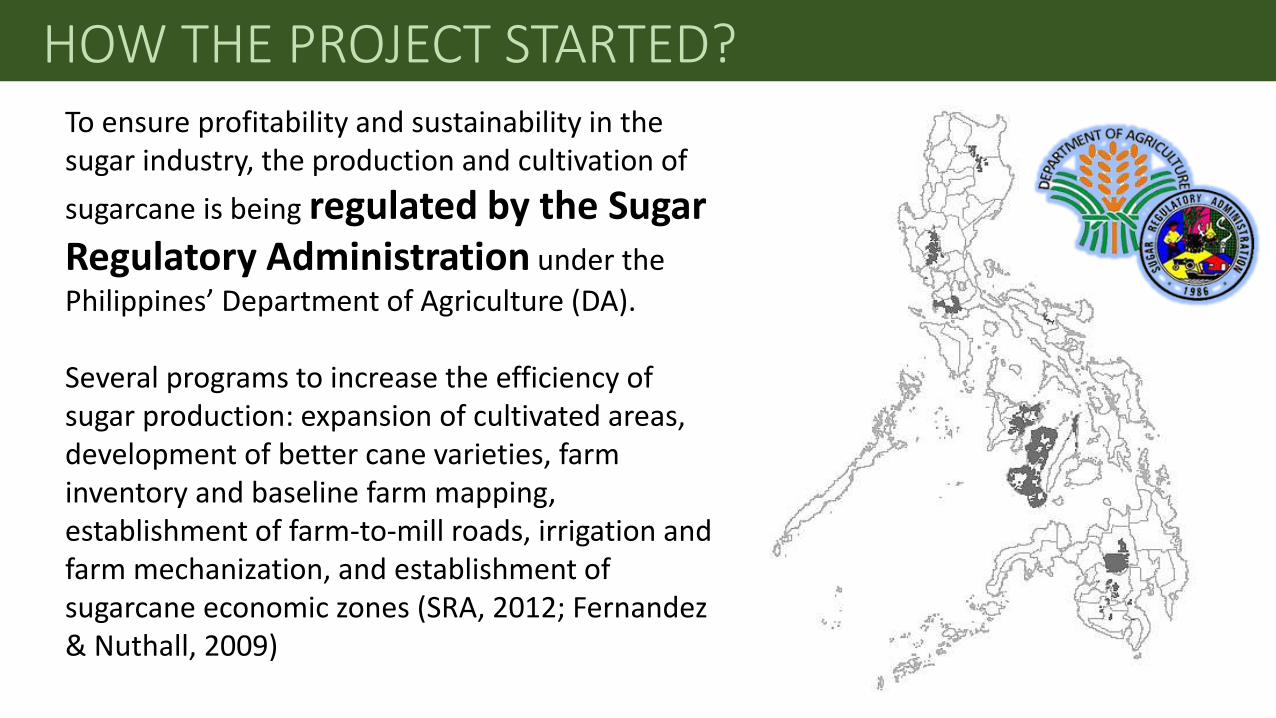
HOW THE PROJECT STARTED? To ensure profitability and sustainability in the sugar industry, the production and cultivation of
sugarcane is being regulated by the Sugar Regulatory Administration under the
Philippines’ Department of Agriculture (DA). Several programs to increase the efficiency of sugar production: expansion of cultivated areas, development of better cane varieties, farm inventory and baseline farm mapping, establishment of farm-to-mill roads, irrigation and farm mechanization, and establishment of sugarcane economic zones (SRA, 2012; Fernandez & Nuthall, 2009)
HOW THE PROJECT STARTED?
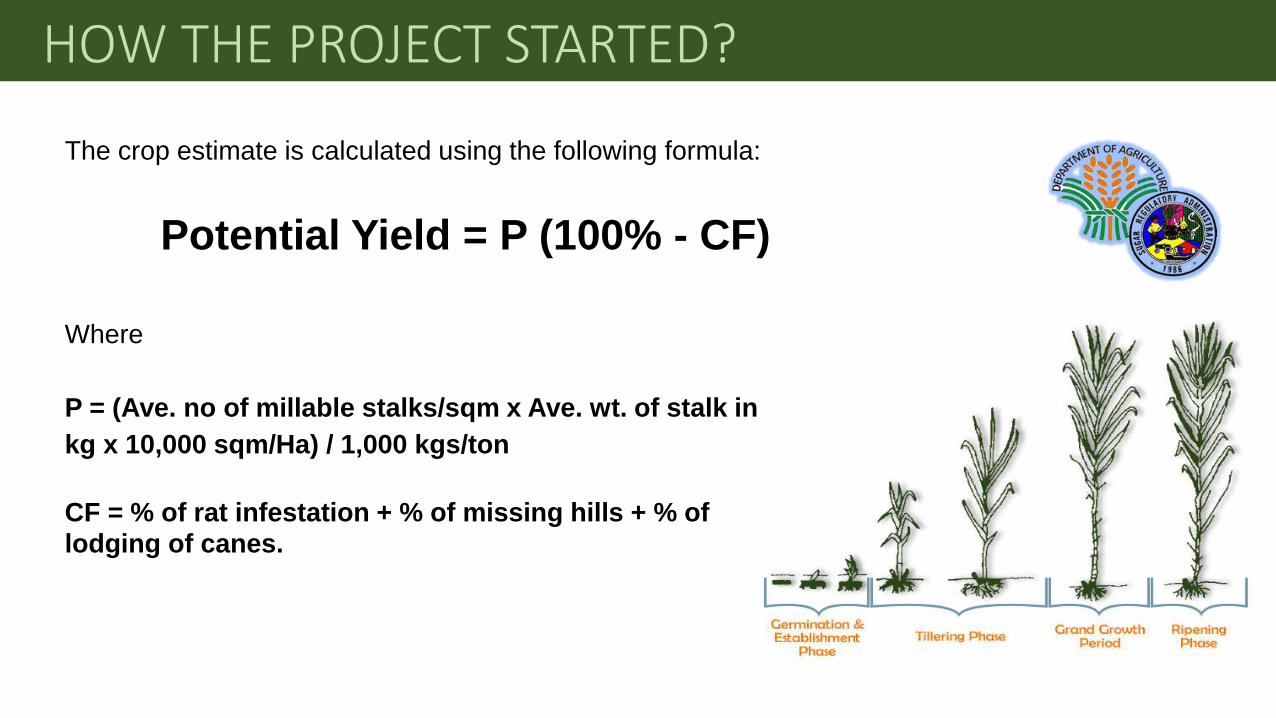
The crop estimate is calculated using the following formula:
Potential Yield = P (100% - CF)
Where
P = (Ave. no of millable stalks/sqm x Ave. wt. of stalk in
kg x 10,000 sqm/Ha) / 1,000 kgs/ton
CF = % of rat infestation + % of missing hills + % of lodging of canes.

- Launched in January 2016 by the Sugar Regulatory Administration and the University of the Philippines Training Center for Applied Geodesy and Photogrammetry (UP TCAGP)
Yield Estimation System for Sugarcane (YESS)
BACKGROUND
- Aims to generate rapid, realistic, & science-based estimates on annual yield production; includes satellite-derived products for crop monitoring
BACKGROUND
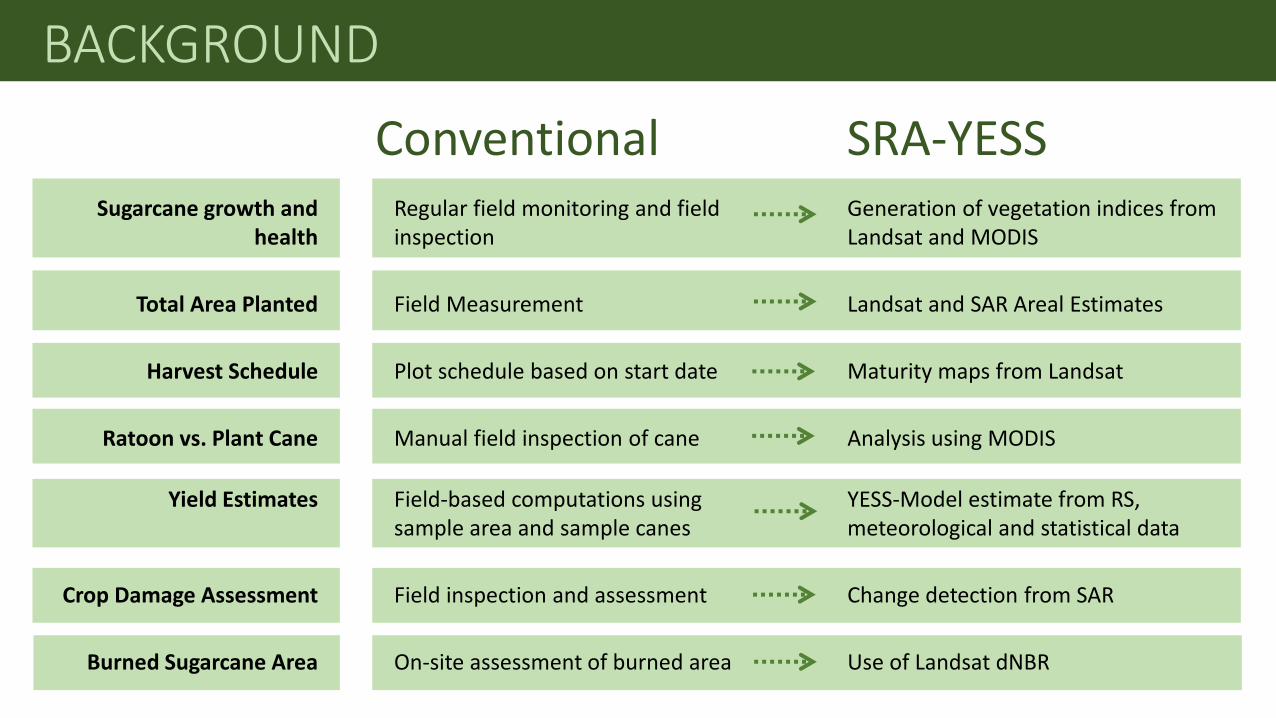
Conventional SRA-YESS Sugarcane growth and
health
Regular field monitoring and field inspection
Generation of vegetation indices from Landsat and MODIS
Total Area Planted
Field Measurement Landsat and SAR Areal Estimates
Harvest Schedule
Plot schedule based on start date Maturity maps from Landsat
Ratoon vs. Plant Cane Manual field inspection of cane Analysis using MODIS
Yield Estimates
Field-based computations using sample area and sample canes
YESS-Model estimate from RS, meteorological and statistical data
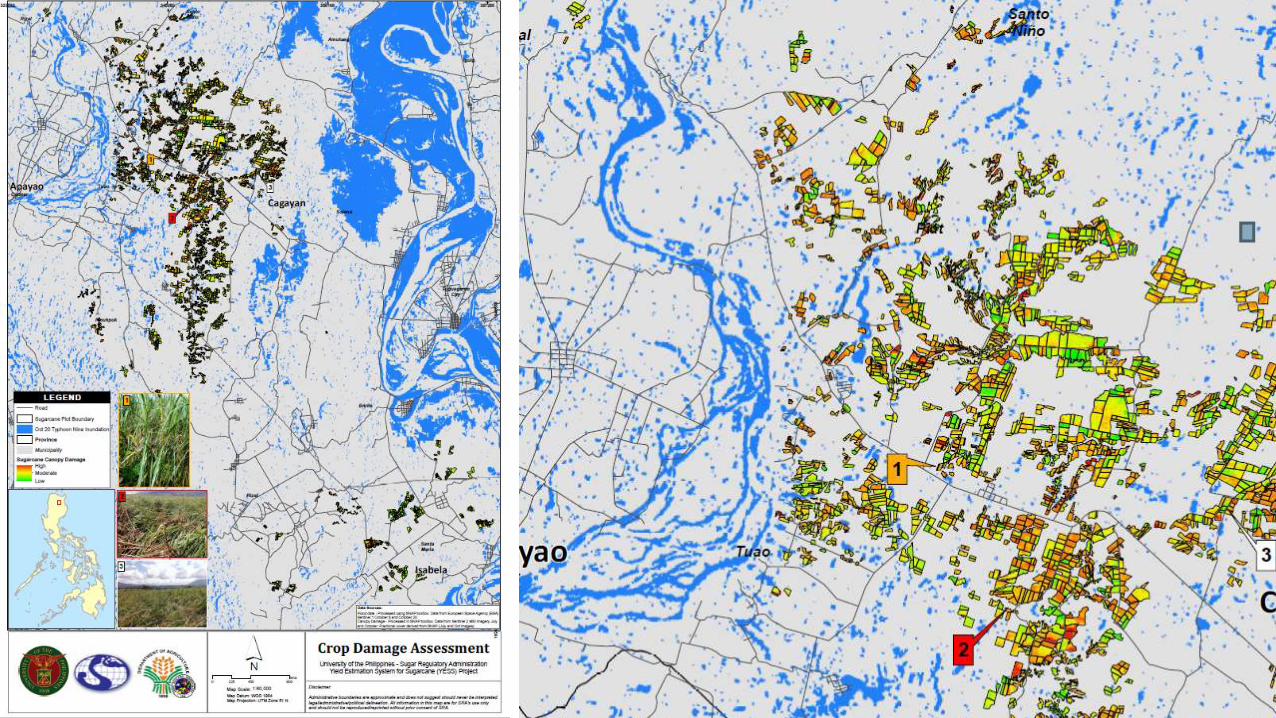
Crop Damage Assessment
Field inspection and assessment Change detection from SAR
Burned Sugarcane Area On-site assessment of burned area Use of Landsat dNBR
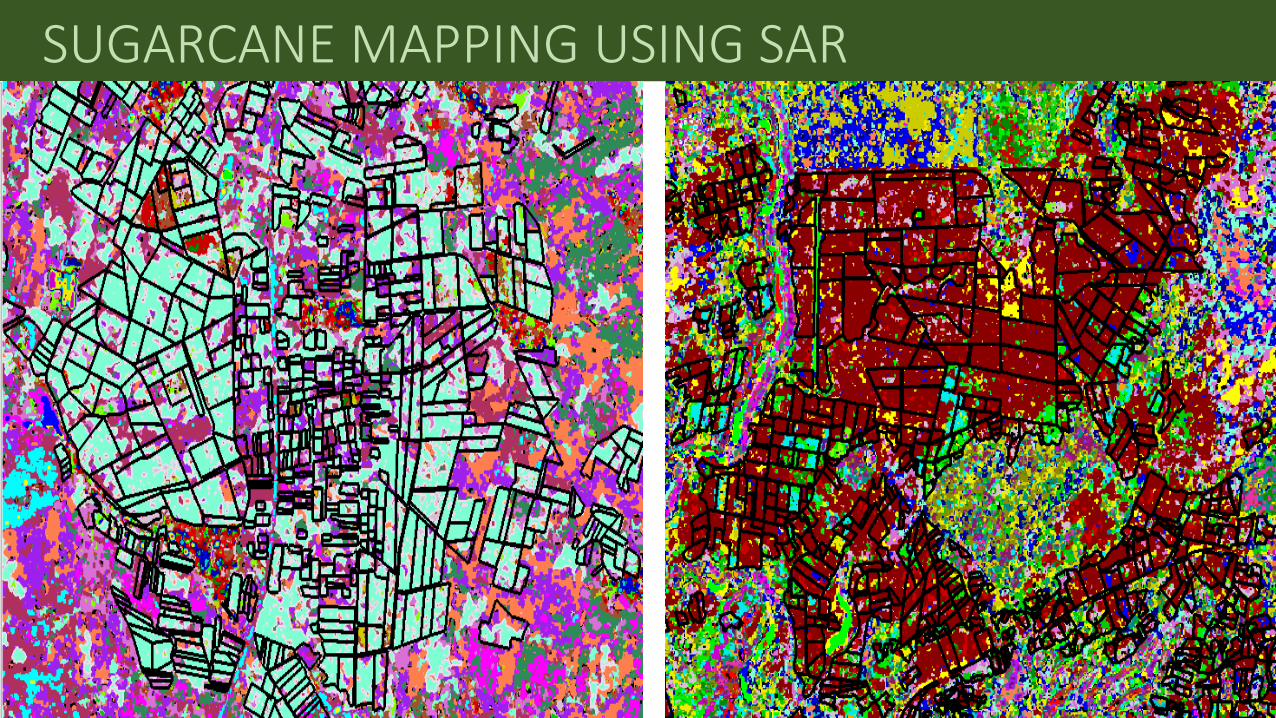
SUGARCANE MAPPING USING SAR
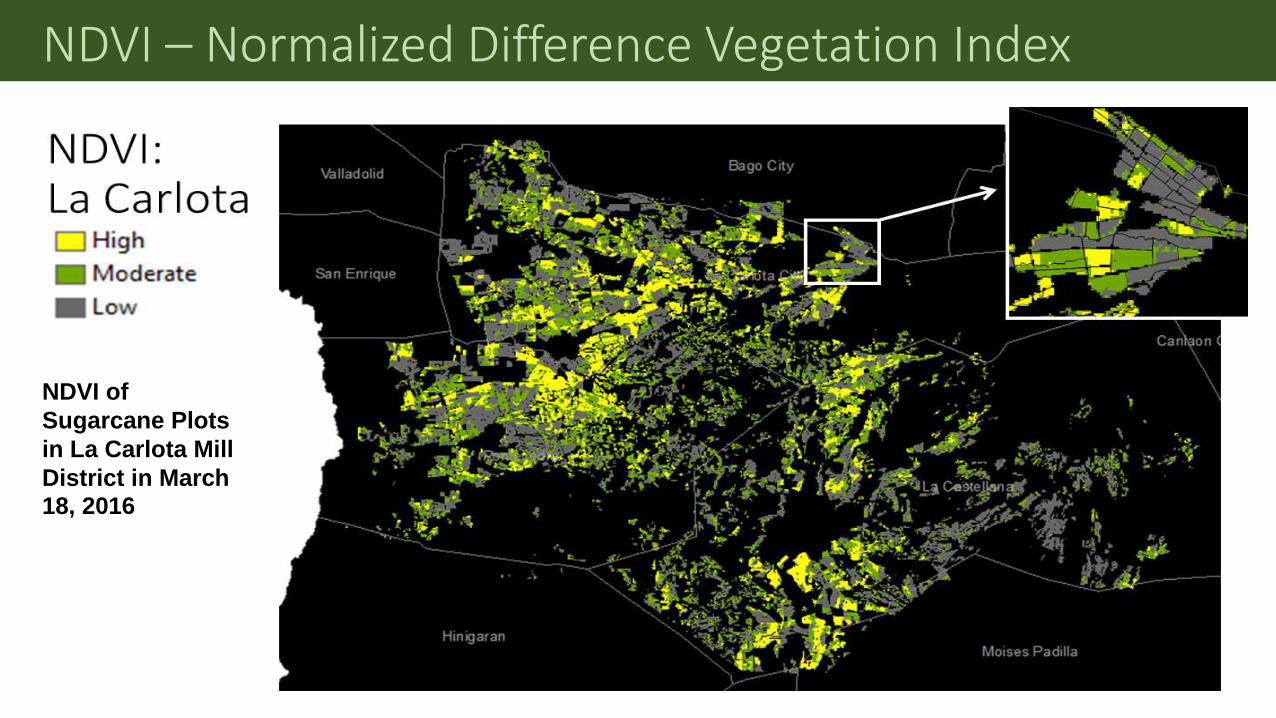
NDVI – Normalized Difference Vegetation Index
NDVI of
Sugarcane Plots
in La Carlota Mill
District in March
18, 2016
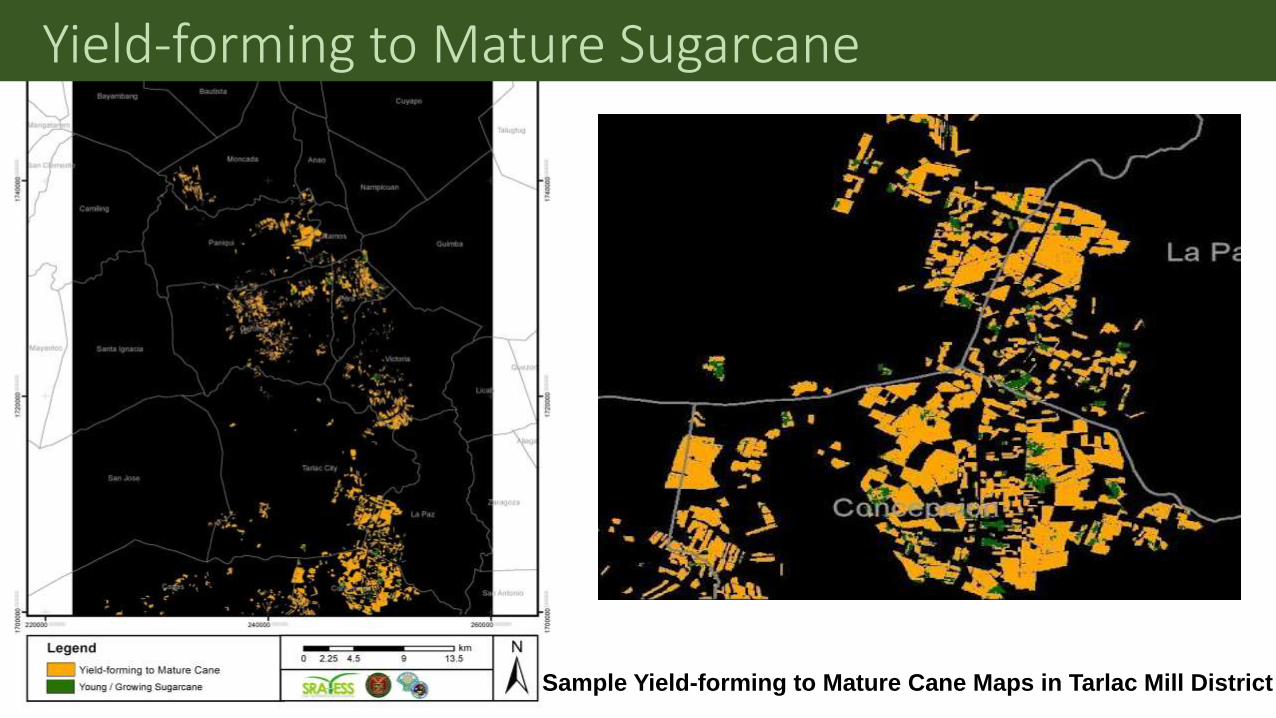
Yield-forming to Mature Sugarcane
Sample Yield-forming to Mature Cane Maps in Tarlac Mill District
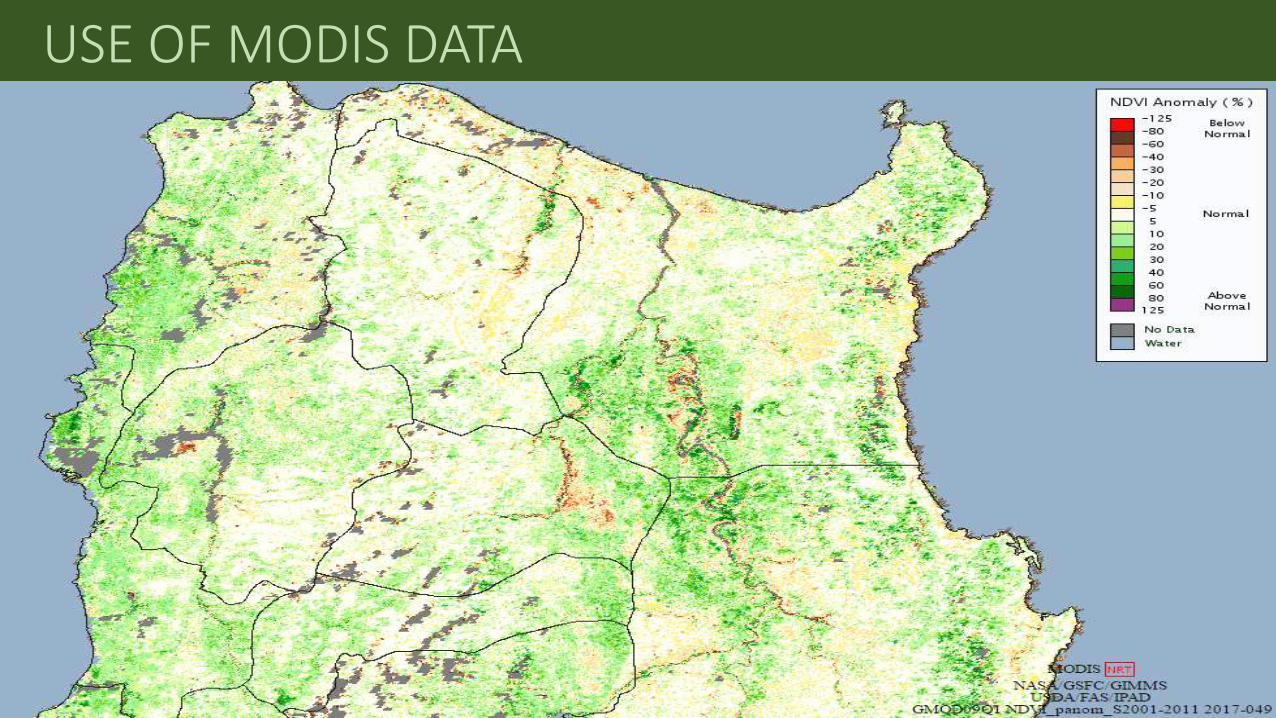
USE OF MODIS DATA

USE OF MODIS DATA
Near Real time MODIS NDVI Anomaly Plot for Cagayan
NDVI anomalies can be detected especially when extreme events (e.g.,
droughts, strong typhoon, and change of crop type) occur within the region/area.
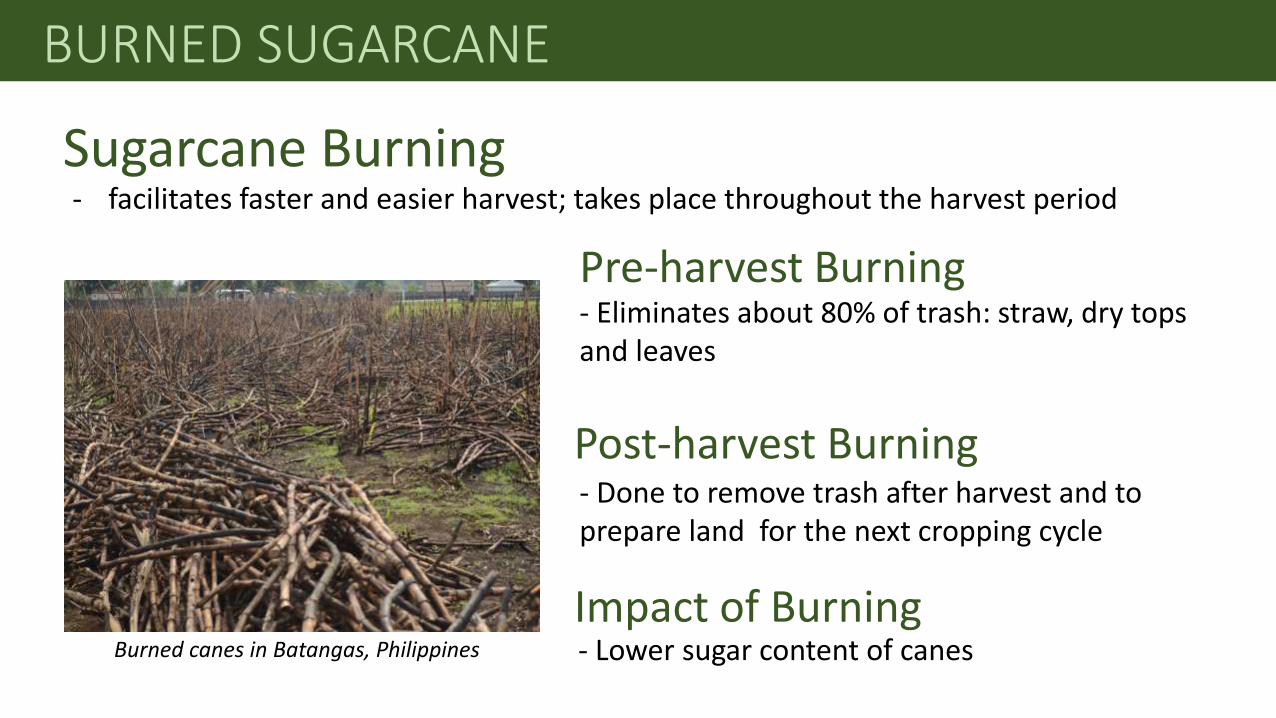
BURNED SUGARCANE
- facilitates faster and easier harvest; takes place throughout the harvest period
Sugarcane Burning
Pre-harvest Burning - Eliminates about 80% of trash: straw, dry tops and leaves
Post-harvest Burning - Done to remove trash after harvest and to prepare land for the next cropping cycle
Burned canes in Batangas, Philippines
Impact of Burning - Lower sugar content of canes
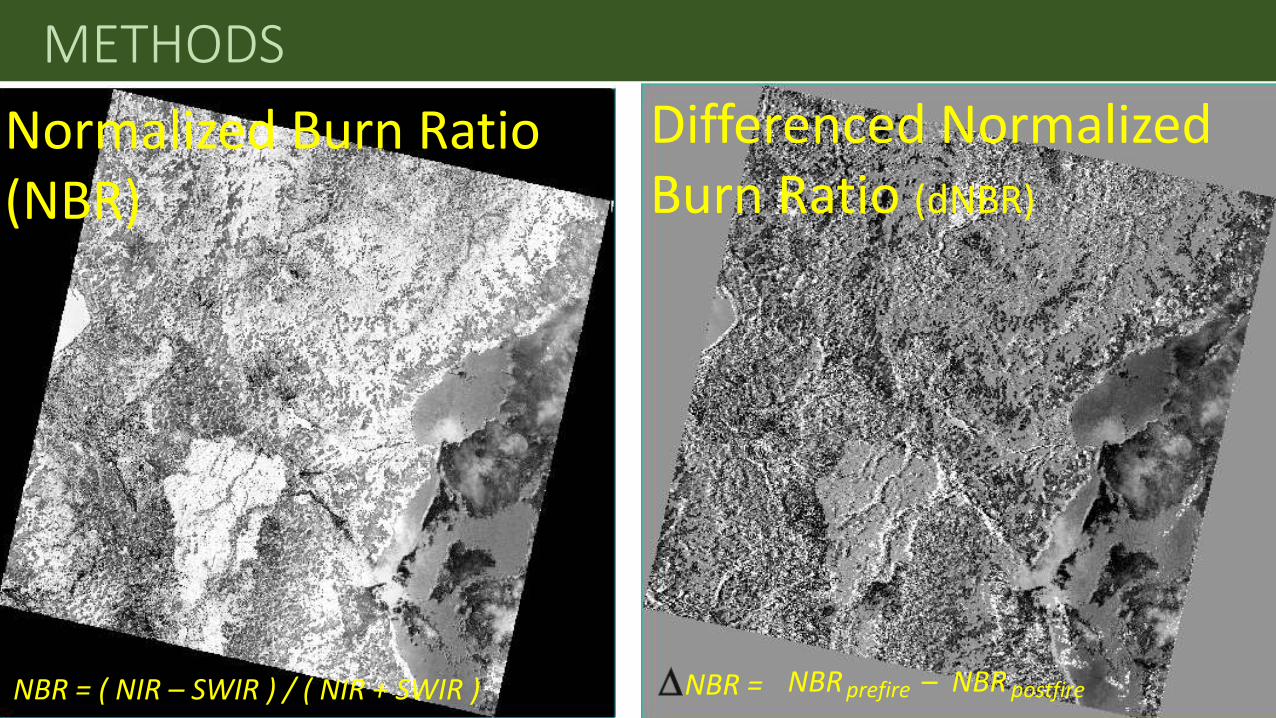
METHODS
Normalized Burn Ratio (NBR)
NBR = NBR – NBR prefire postfire
Differenced Normalized Burn Ratio (dNBR)
NBR = ( NIR – SWIR ) / ( NIR + SWIR )
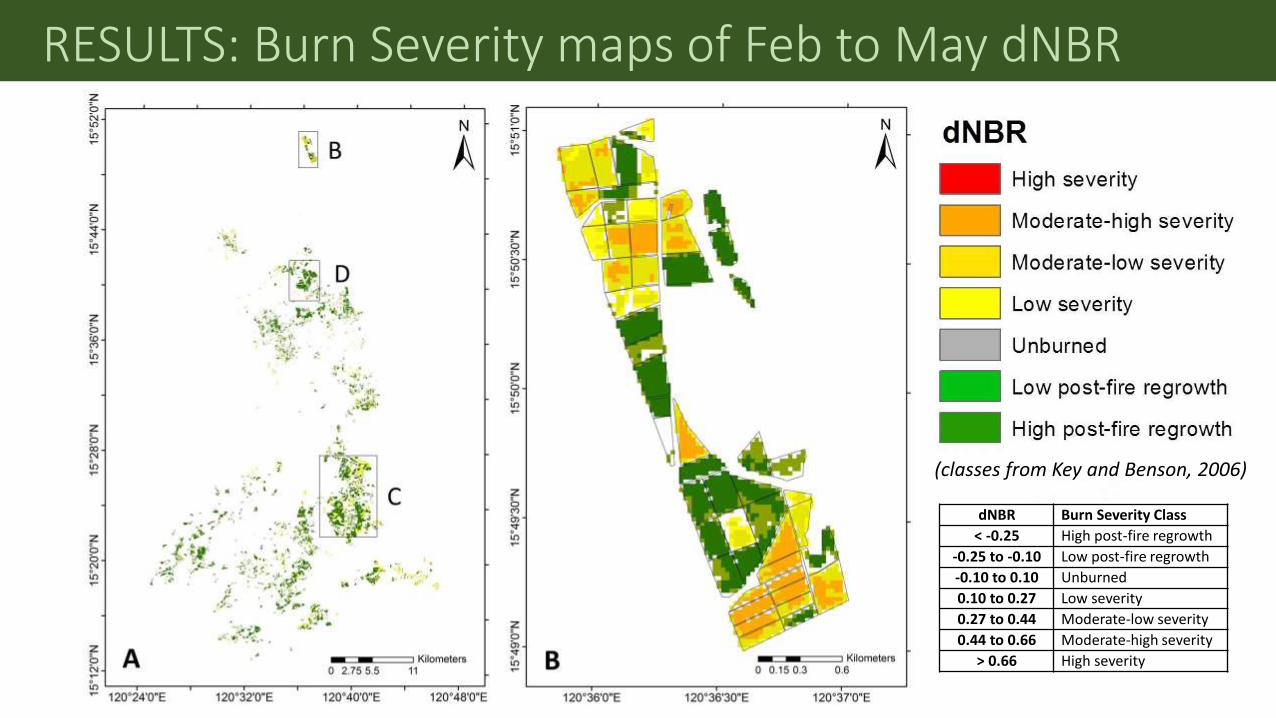
RESULTS: Burn Severity maps of Feb to May dNBR
(classes from Key and Benson, 2006)
dNBR Burn Severity Class
< -0.25 High post-fire regrowth
-0.25 to -0.10 Low post-fire regrowth
-0.10 to 0.10 Unburned
0.10 to 0.27 Low severity
0.27 to 0.44 Moderate-low severity
0.44 to 0.66 Moderate-high severity
> 0.66 High severity
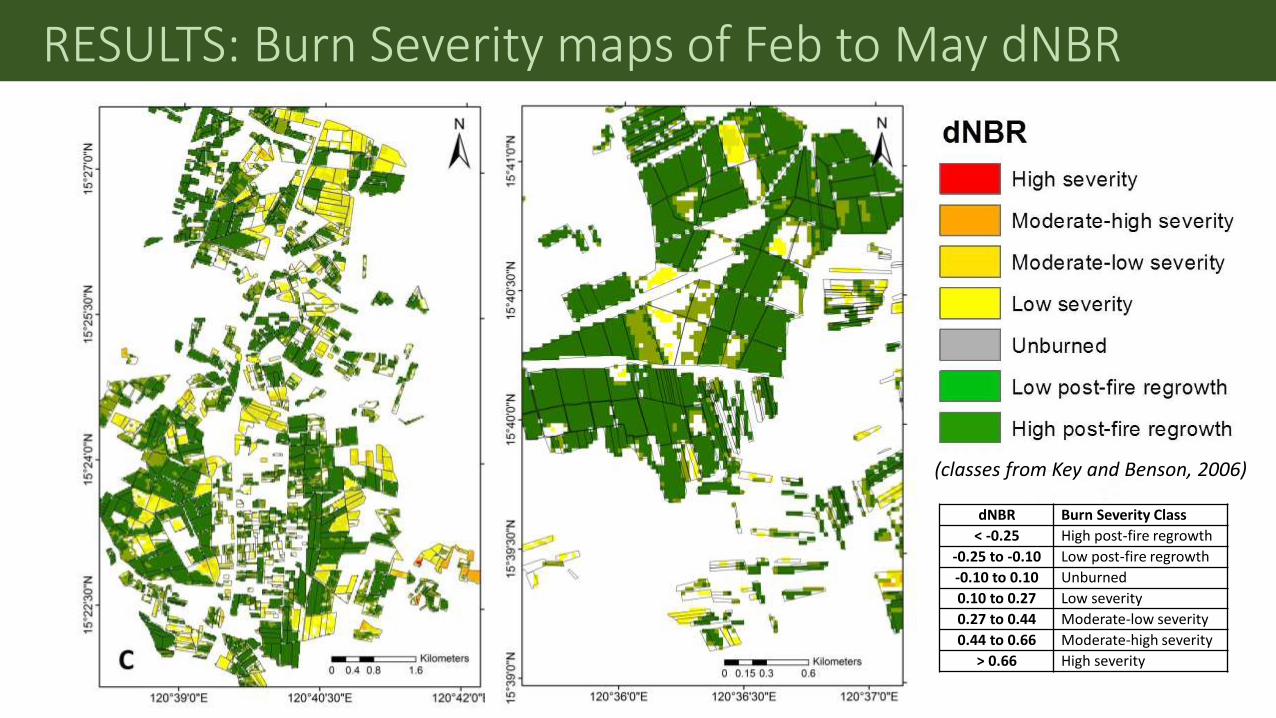

Unmanned Aerial System (UAS)
Platforms Software
People Protocol
Control, Monitor
Sensors

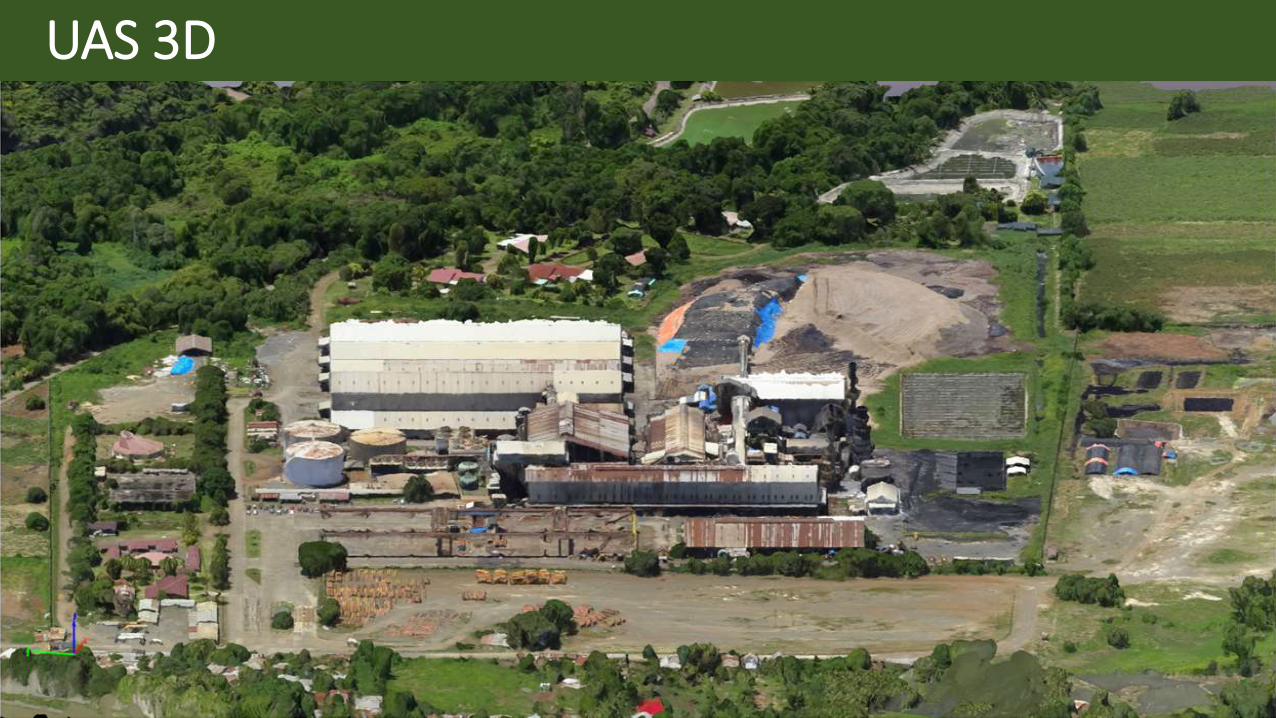
UAS 3D
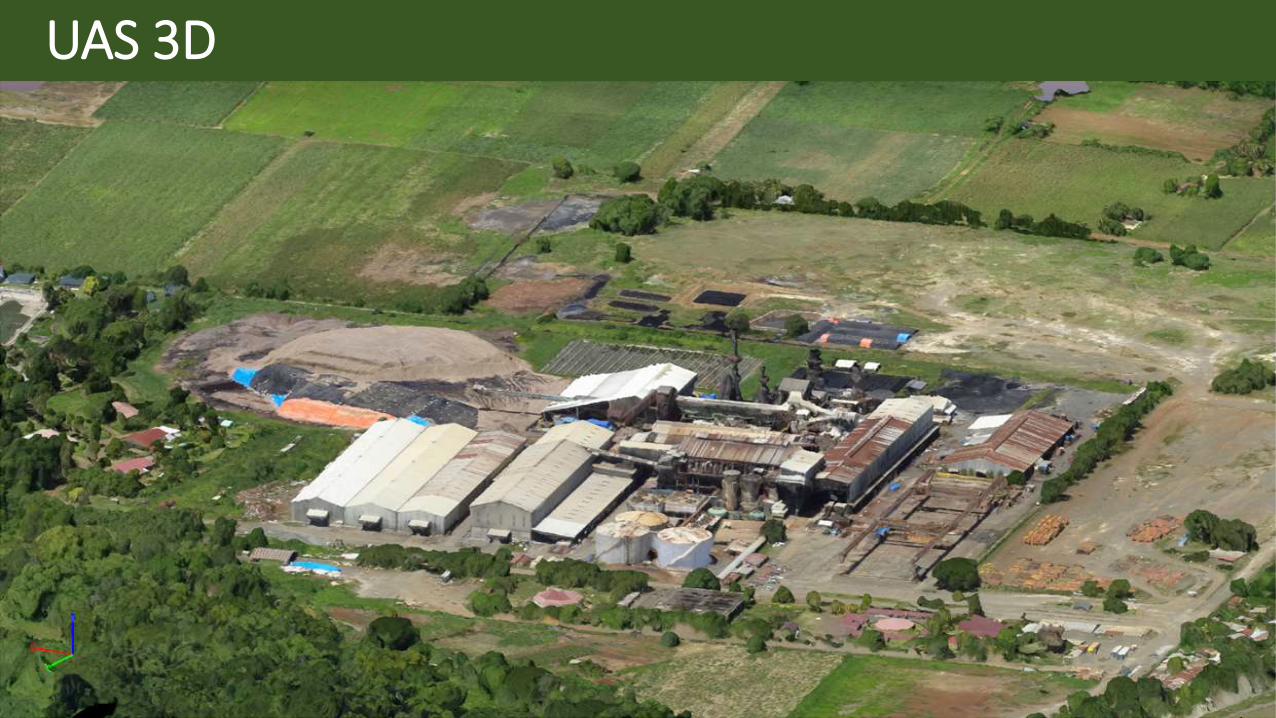
UAS 3D
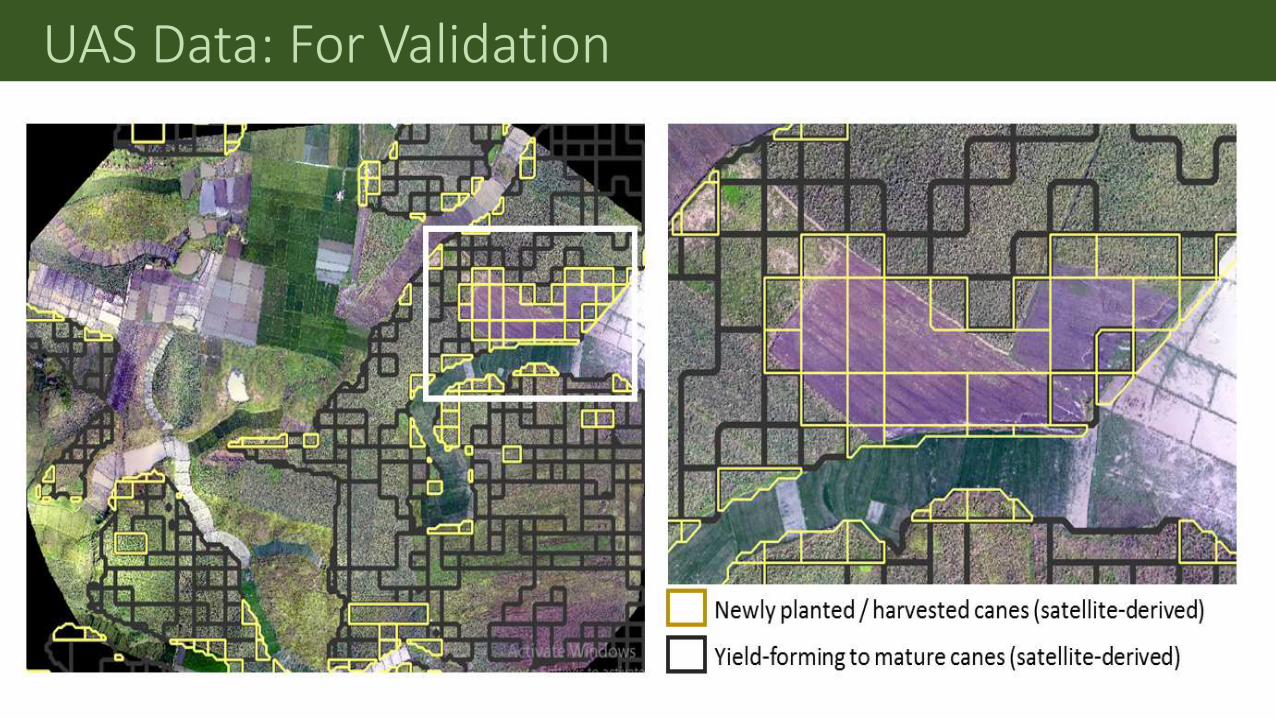
UAS Data: For Validation
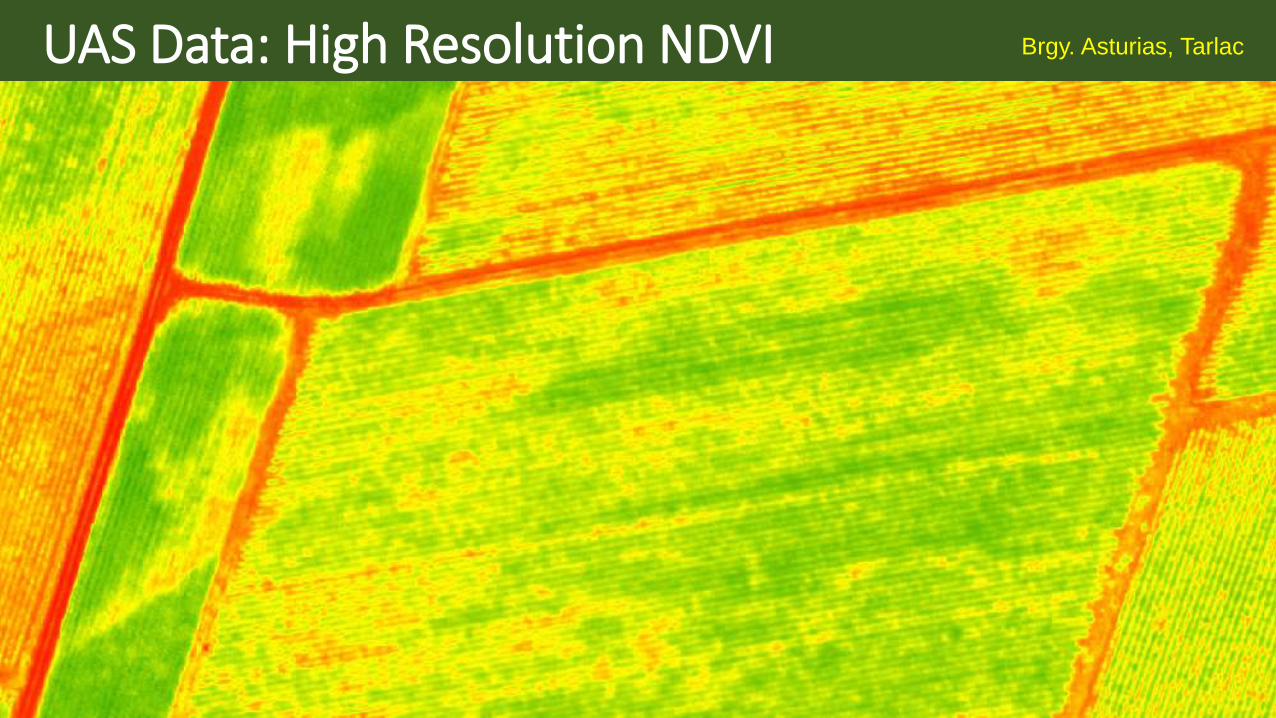
UAS Data: High Resolution NDVI Brgy. Asturias, Tarlac
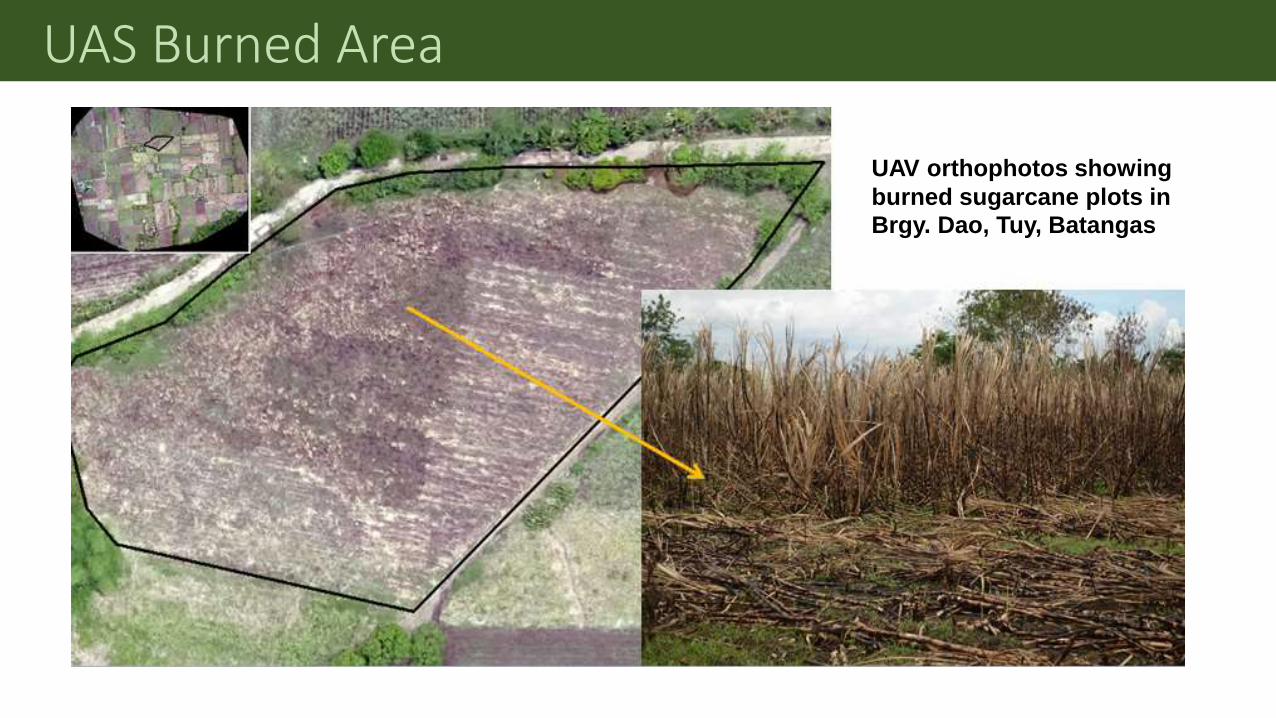
UAS Burned Area
UAV orthophotos showing
burned sugarcane plots in
Brgy. Dao, Tuy, Batangas

Crop Damage Assessment
Classified UAV image in
Cagayan Study Area
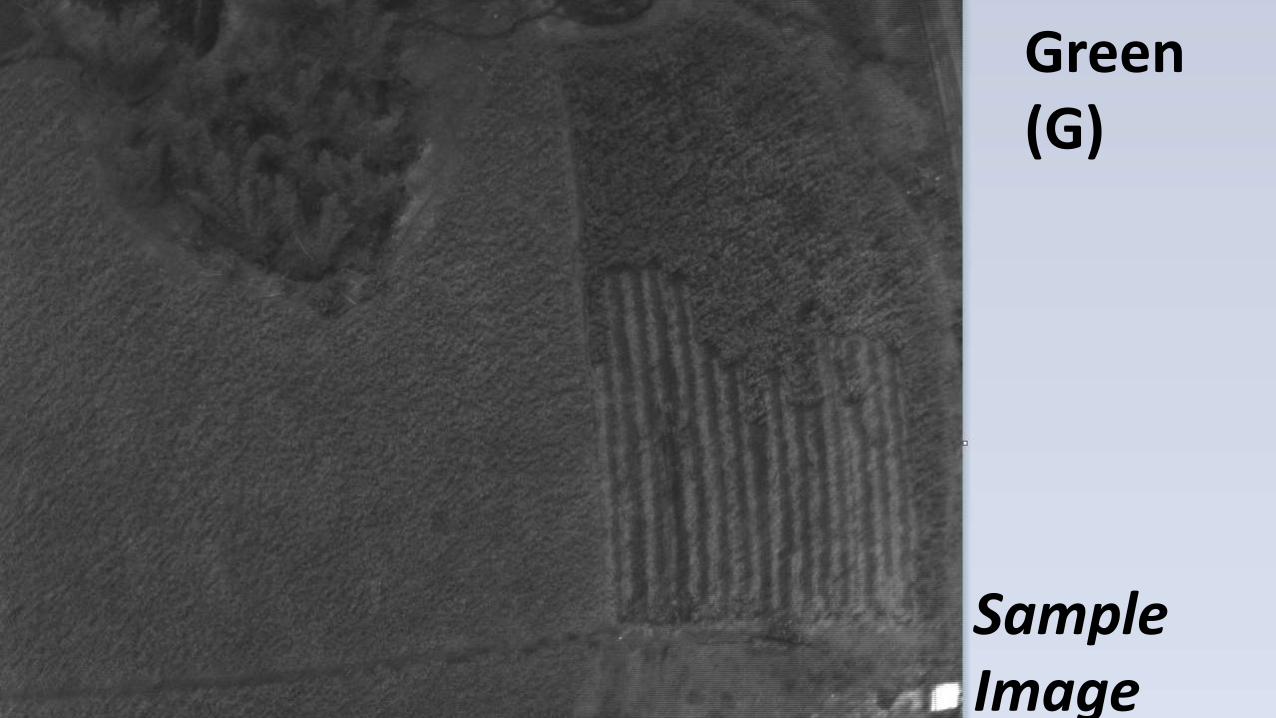
Green (G)
Sample Image
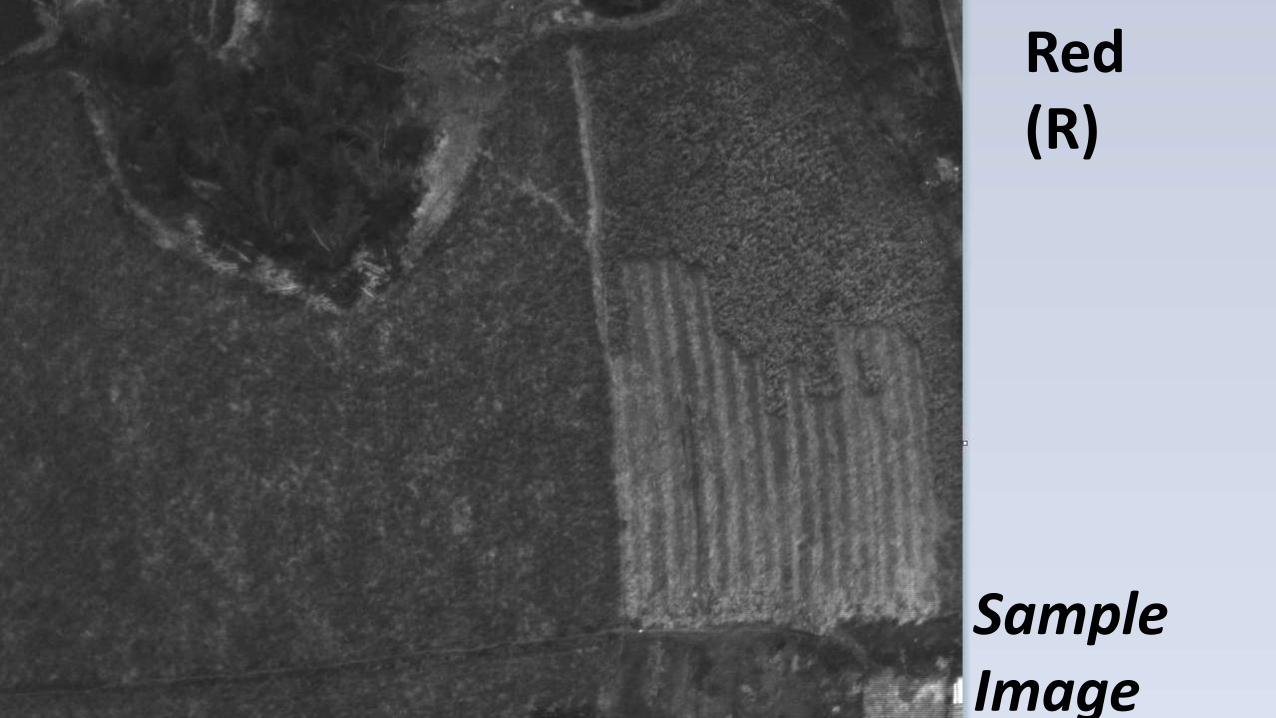
Red (R)
Sample Image

Red Edge (RE)
Sample Image
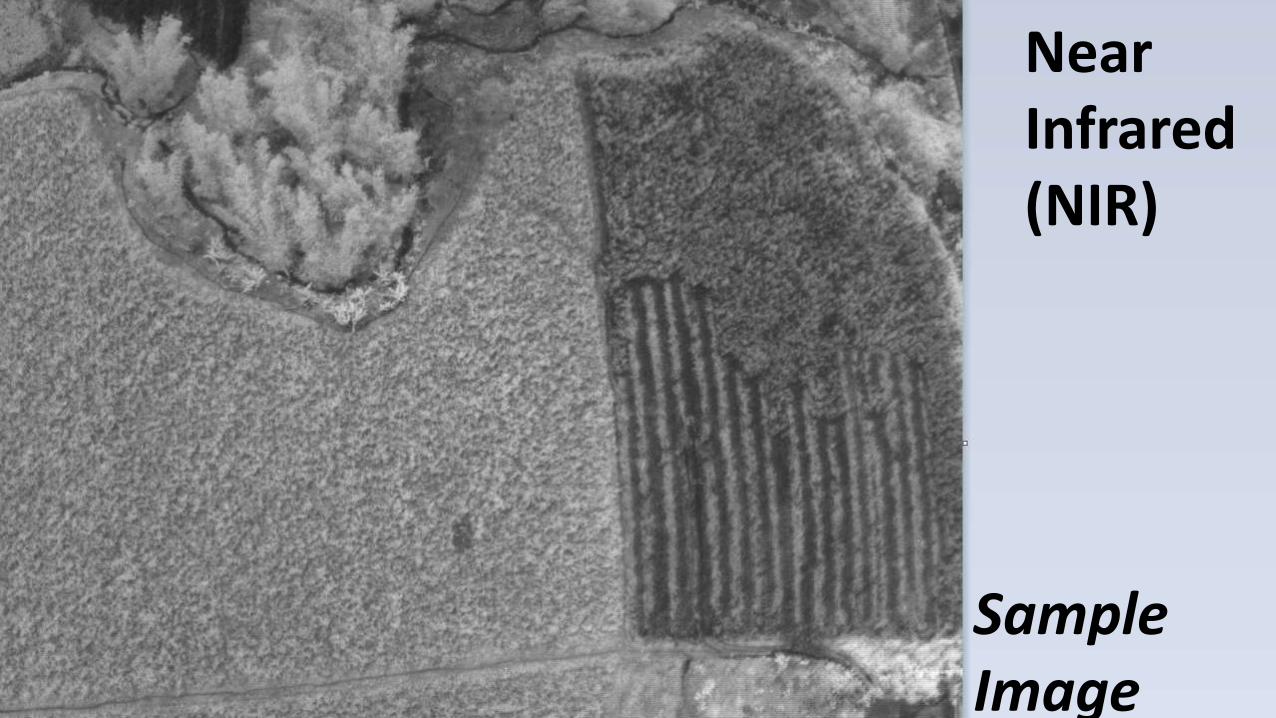
Near Infrared (NIR)
Sample Image

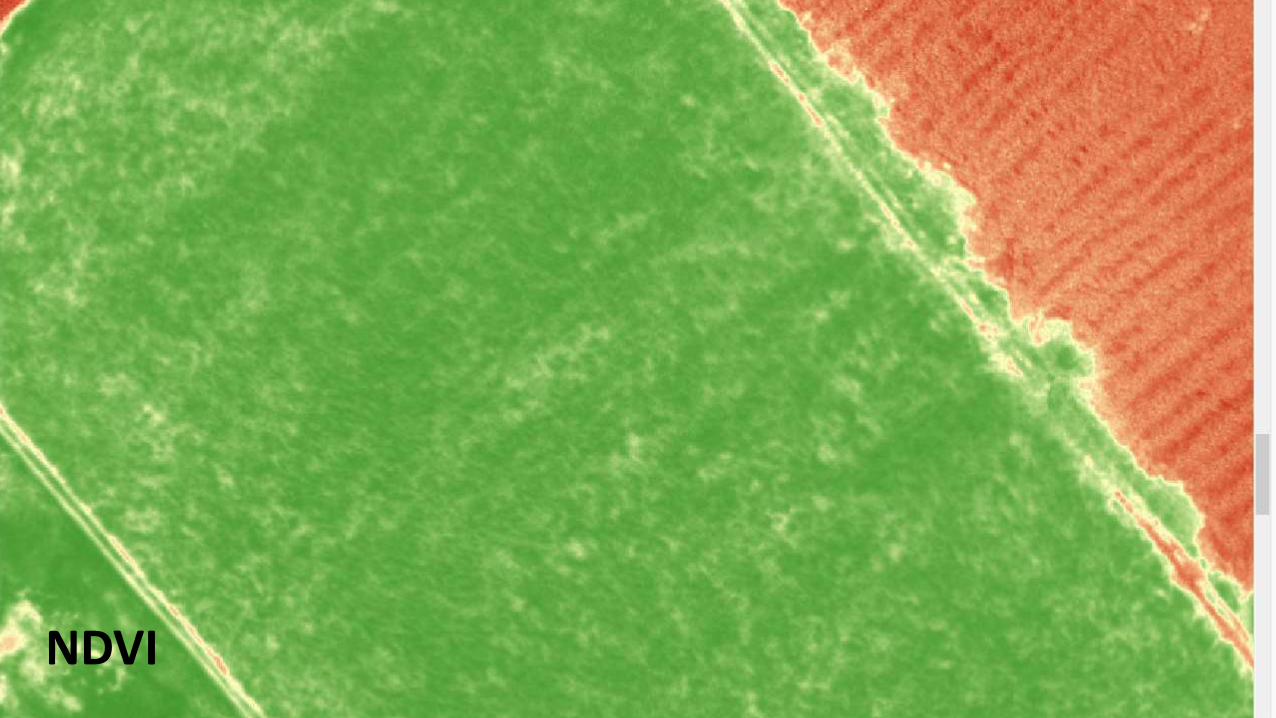
NDVI
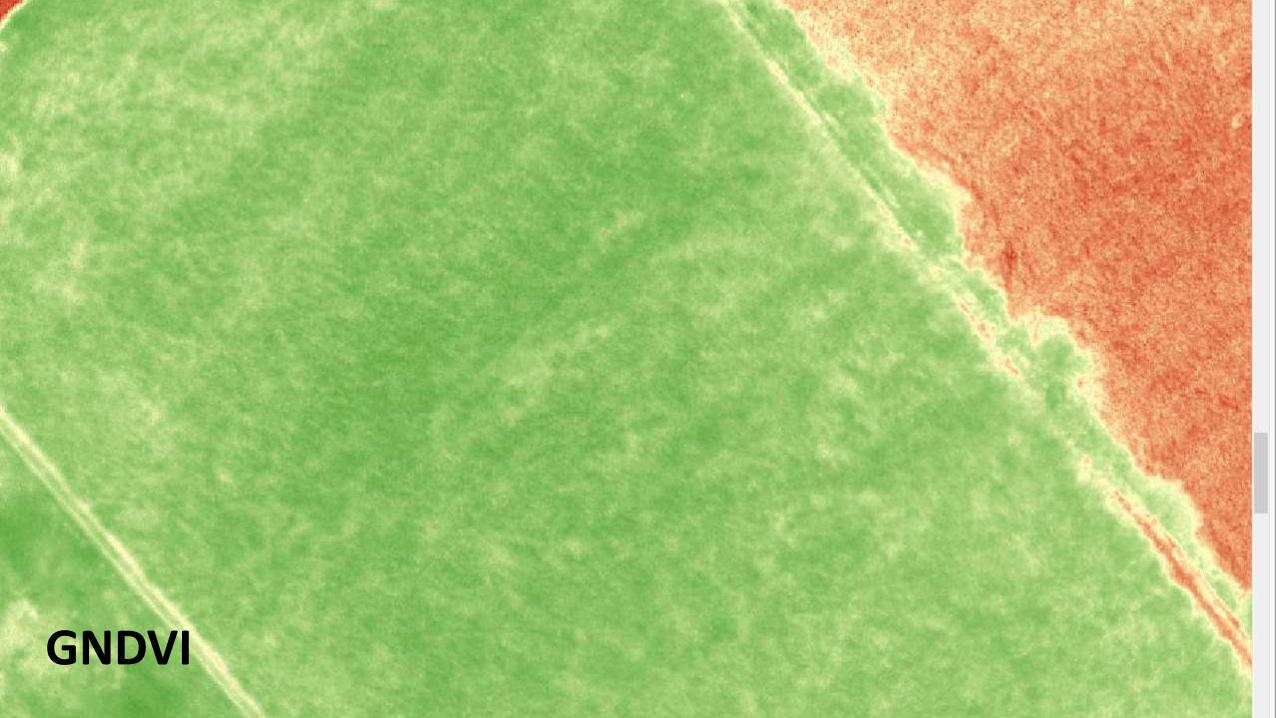
GNDVI

GSAVI
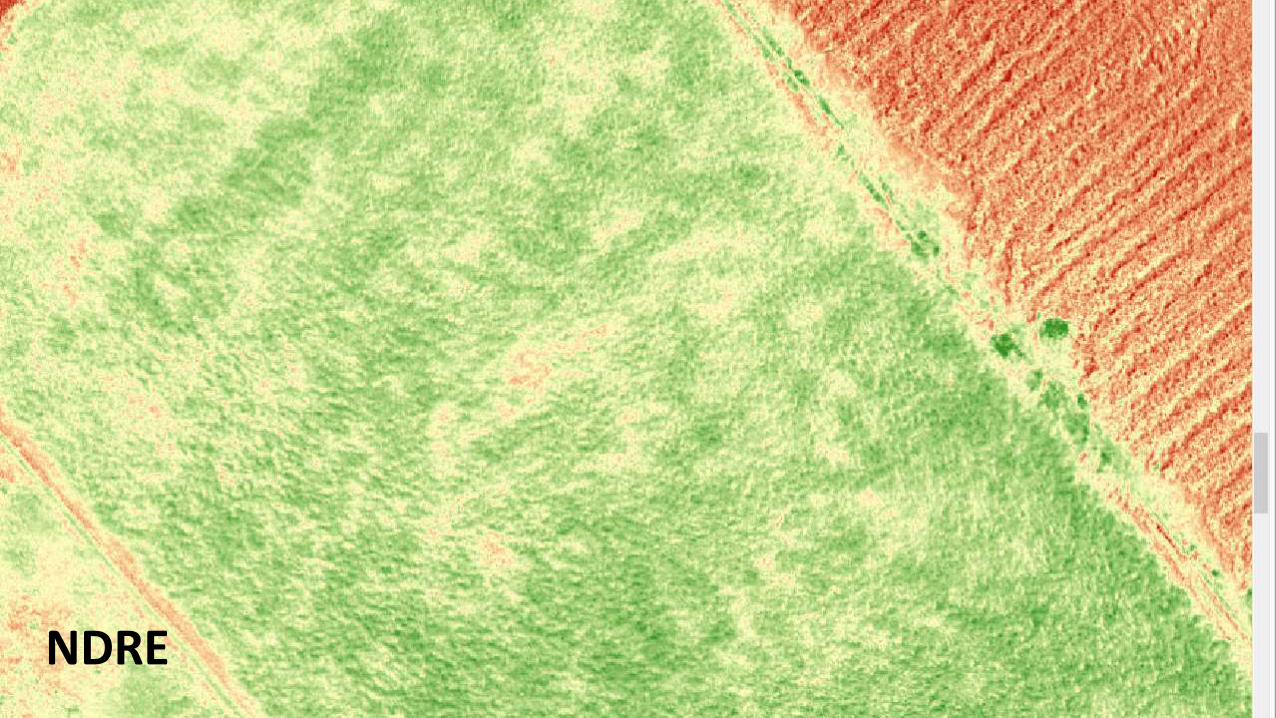
NDRE
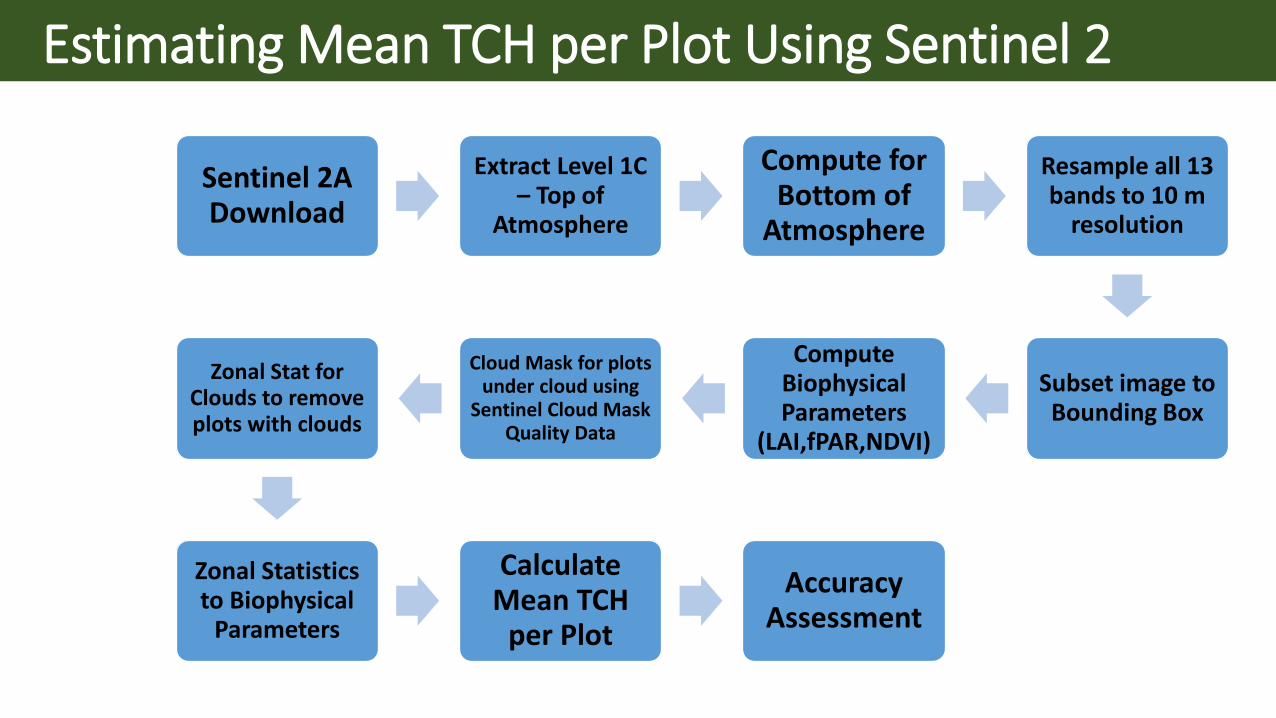
Sentinel 2A Download
Extract Level 1C – Top of
Atmosphere
Compute for Bottom of
Atmosphere
Resample all 13 bands to 10 m
resolution
Subset image to Bounding Box
Compute Biophysical Parameters
(LAI,fPAR,NDVI)
Cloud Mask for plots under cloud using
Sentinel Cloud Mask Quality Data
Zonal Stat for Clouds to remove plots with clouds
Zonal Statistics to Biophysical
Parameters
Calculate Mean TCH
per Plot
Accuracy Assessment
Estimating Mean TCH per Plot Using Sentinel 2
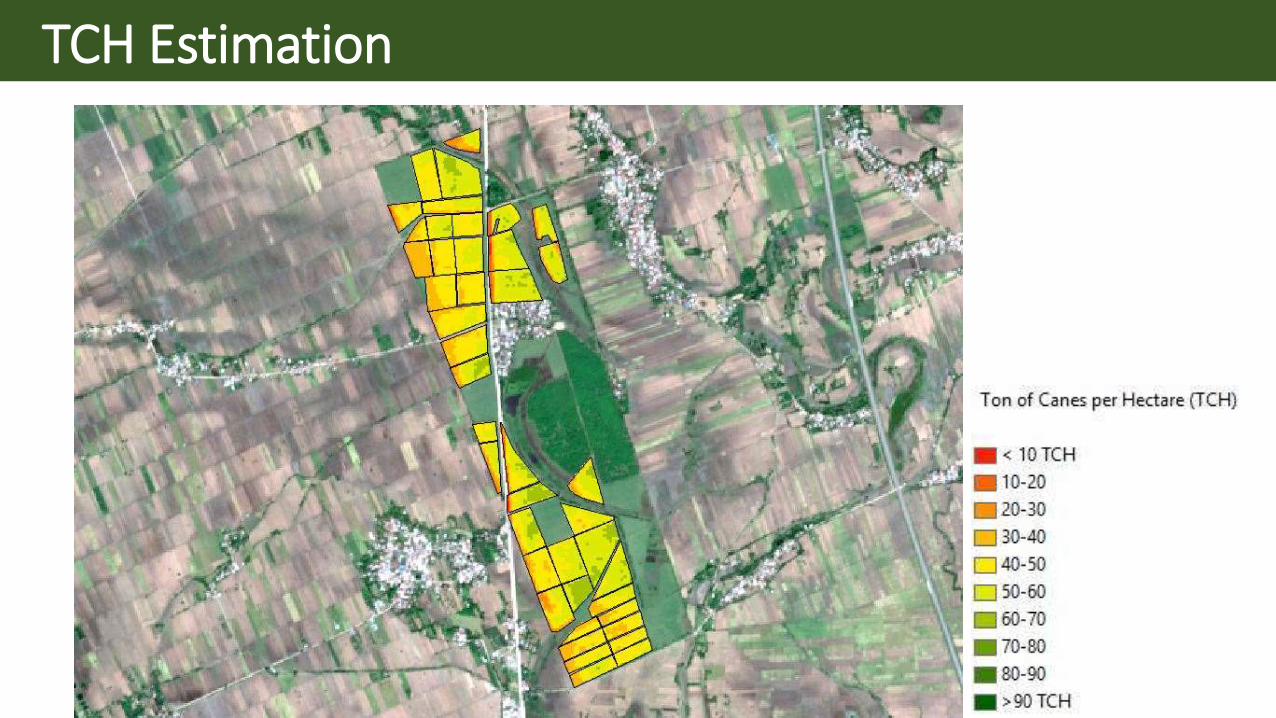
TCH Estimation

TCH Estimation
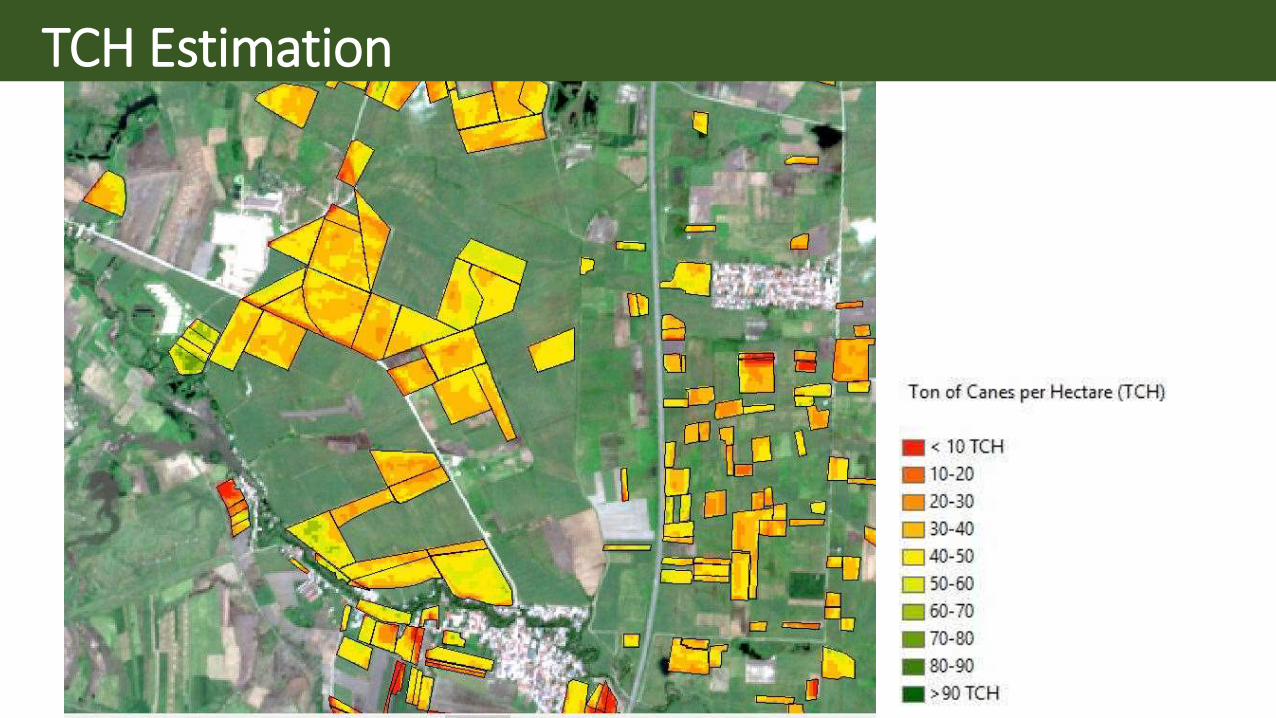
TCH Estimation
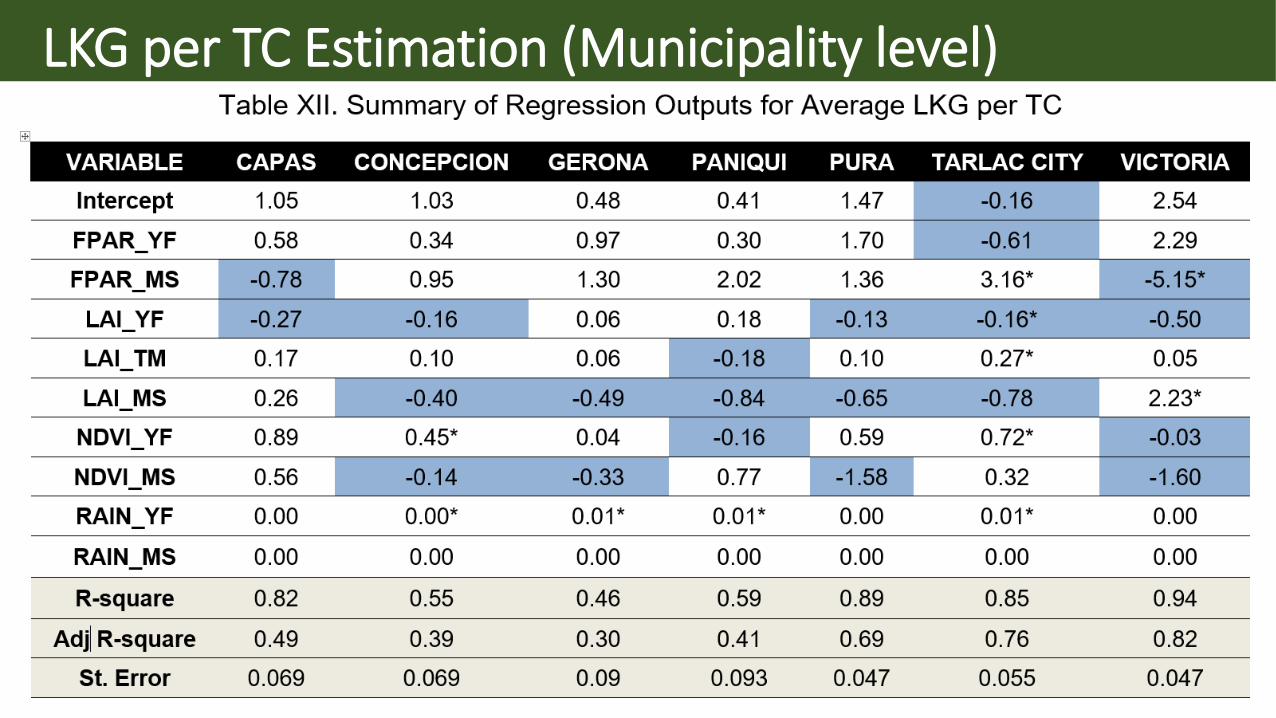
LKG per TC Estimation (Municipality level)
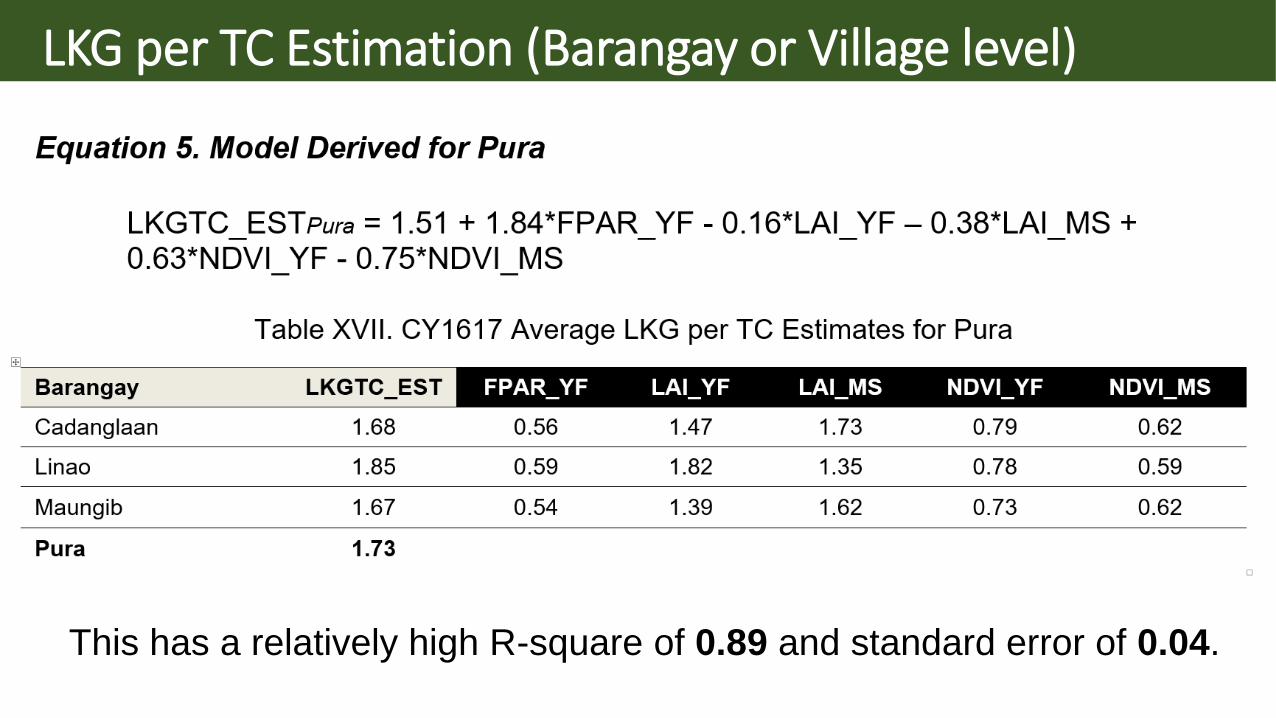
LKG per TC Estimation (Barangay or Village level)
This has a relatively high R-square of 0.89 and standard error of 0.04.

SRA WebGIS
Looking Forward…
Incorporating damage due to infestations…
Projecting damages due to typhoons and drought…
Utilizing more imagery, including from the Philippines’ microsatellite and UAS…
Improving the yield estimation models…
Providing other useful geospatial information…