Clearance Intervals NCHRP 172: Signal Timing Improvement Practices.
73
Clearance Intervals NCHRP 172: Signal Timing Improvement Practices
-
date post
20-Dec-2015 -
Category
Documents
-
view
216 -
download
2
Transcript of Clearance Intervals NCHRP 172: Signal Timing Improvement Practices.

Clearance Intervals
NCHRP 172: Signal Timing Improvement Practices

Clearance Interval
Clearance Interval = Yellow + All Red
Yellow = Y = t + v2a ± Gg
All Red = AR =w + L v or
Pv or
P + L v
According to the ITE recommended practice:

Where:Y = yellow interval (seconds)t = driver perception-reaction time for stopping, taken as 1 secv = approach speed (ft/sec) taken as the 85th percentile speed or the speed limita = deceleration rate for stopping taken as 10 ft/sec2 G = percent of grade divided by 100 (positive for upgrade, negative for downgrade)

L = length of the clearing vehicle, normally 20 feet
W = width of the intersection in feet, measured from the upstream stop bar to the
downstream extended edge of pavement P = width of the intersection (feet) measured
from the near-side stop line to the far side of the farthest conflicting pedestrian crosswalk along an actual vehicle path

Clearance Interval
w
P

Uses a comfortable and attainable deceleration rate of 10 ft/sec/sec As opposed to the ‘emergency’ rate of
15 ft/sec/sec used earlier Adds one second to the calculated
yellow time
Yellow Interval At least half the states use the
“permissive yellow rule” allows vehicles to enter the intersection
on a yellow signal and to be in the intersection when the signal turns red

Specifies the length of the yellow change interval as:
“The yellow vehicle change intervals should have a range of approximately 3 to 6 seconds. Generally, the longer intervals are appropriate to higher approach speeds.”
National MUTCD

Fraley vs. the City of Flint, MITort suit in Michigan (1974)
Court’s opinion:
“it is not enough that a yellow time merely be between 3 and 6 seconds”
The yellow interval must be designed for intersection-specific conditions
truck use intersection geometry other site specific characteristics
Yellow Interval
ITE formula gives a yellow interval long enough so that a clearing driver will not be forced to enter the intersection on the red, which is an unlawful act
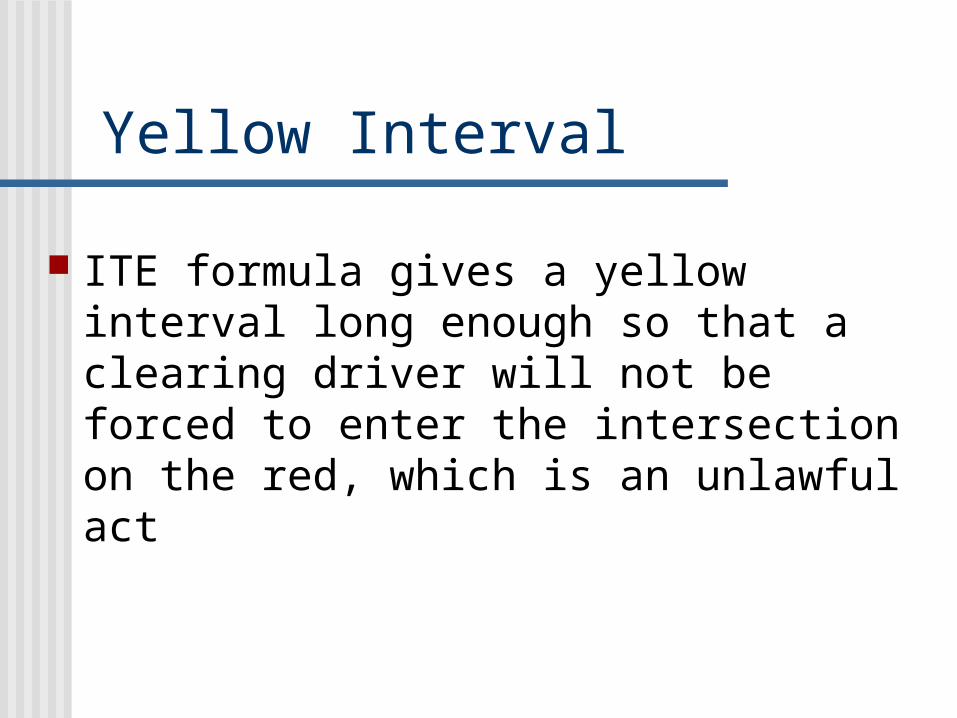
Yellow Interval Based on equation for stopping:
S = vot + vo2/2a
vot: gives the distance traveled at initial speed vo during braking perception-reaction time tVo
2/2a: braking distance to a final speed v = 0, from the fundamental equation of linear kinematics
v2 = vo2 + 2as
where v = final speed (ft/sec) vo = initial speed (ft/sec)
a = deceleration rate (ft/sec/sec)s = distance traveled during braking (ft)
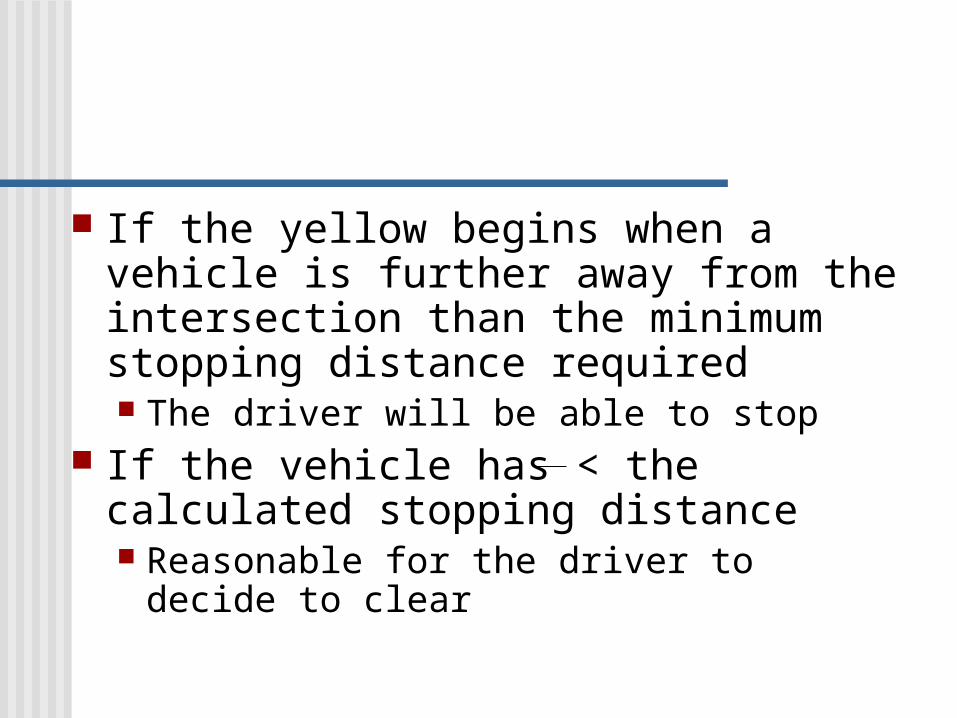
If the yellow begins when a vehicle is further away from the intersection than the minimum stopping distance required The driver will be able to stop
If the vehicle has < the calculated stopping distance Reasonable for the driver to decide to
clear

Minimum required yellow time will carry the clearing vehicle into just into the intersection Legally entered (permissive rule) Just before the red begins
Minimum yellow time
Y = t + v2a ± Gg
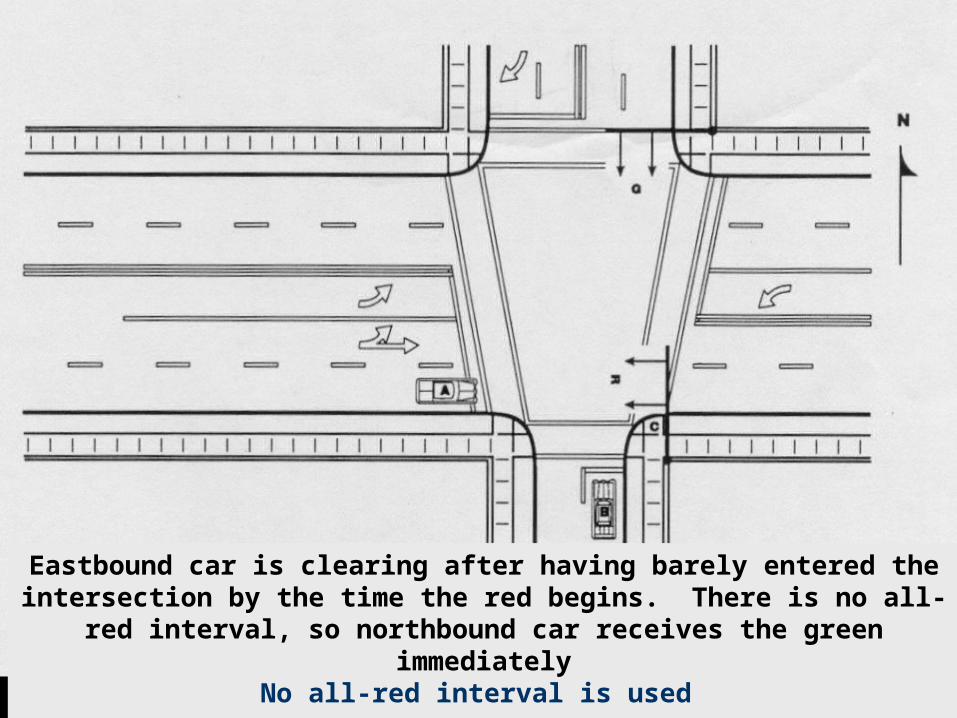
Figure 6. Possible scenario with no all-red clearance
Eastbound car is clearing after having barely entered the intersection by the time the red begins. There is no all-red interval, so northbound car receives the green immediately
No all-red interval is used

Yellow time calculated according to the ITE formula will carry the clearing vehicle just into the intersection by the time it ends As shown by vehicle A in the preceding slide
If there is no all-red interval, then oncoming traffic is released on a green signal (vehicle B) Vehicle A will not be protected

Driver of vehicle B has a duty to yield the right-of-way to vehicle A legally within the intersection Permissive rule
However, many drivers do not know this law
Naïve for traffic engineer to expect drivers to yield the ROW To ensure safety, use all-red intervals

Figure 6. Possible scenario with no all-red clearance
Northbound car fails to yield ROW to car A legally in the intersection, enters soon after receiving the
green and is struckNo all-red interval is used

All-Red Interval
“In order to time phase-change intervals for safety, traffic engineers sometimes need to go beyond the minimums implied by the rules of the road. An All-red clearance interval should be considered in some cases in addition to the yellow”
Signal Timing Improvement Practices
NCHRP 172

MUTCD “The yellow vehicle change interval
may be followed by a red clearance interval, of sufficient duration to permit traffic to clear the intersection before conflicting traffic movements are released”
TCDH “The policy of some jurisdictions is
to time the phase change interval to allow the outset of the green interval for conflicting movements without the intersection having been cleared”

TCDH “Some authorities believe that the timing of
a phase-change interval should enable a vehicle to clear the intersection before the onset of the green for conflicting movements. The following equation may be used to determine the phase change interval. It includes a reaction time, deceleration element and an intersection clearing time”
= t + v2a ± Gg
w + L v
+
Where CP is the non dilemma change period
CP

TCDH “the yellow change interval be equal to
the first two terms of the equation and the equation rounded up to the next ½ second, but no less than 3 seconds and no greater than 5 seconds. The remainder of the change period should consist of an all-red interval.

Eastbound car clears intersection by the time the northbound car receives green
Intersection where an all-red interval is used
Older Driver Highway Design Handbook Recommendations
and Guidelines
“To accommodate age differences in perception-reaction time, it is recommended that an all-red clearance interval be consistently implemented, with the length determined according to the Institute of Transportation Engineers (1992) expressions”

Where there is no pedestrian traffic, use:
Where there is the probability of pedestrian crossing, use the greater of:
Where there is significant pedestrian traffic or pedestrian signals protect the crosswalk, use:
All Red = r =w + L v
or Pv
P + L v
All Red = r =
P + L v
All Red = r =

According to traffic laws in Michigan, USA a vehicle must stop when confronted with a yellow light,
unless such an abrupt stop would endanger the safety of the driver as well as others
Law enforcement officials are reluctant to issue a citation for not stopping during the yellow interval Unless someone is observed to have accelerated
through the intersection•citation is rare•hard to prove when contested in a court of law

Entering the intersection when a signal turns red is what most officials consider a citable offense Red light violation Violations are affected by the duration of
the change interval of the traffic signal•yellow interval•all-red interval

When entering the intersection at the end of the clearance interval, motorist are exposed to the danger of being struck by the cross street traffic unless an all-red interval is present

Uniform Vehicle Code in the State of Michigan, USA
“If the signal exhibits a steady yellow indication, vehicular traffic facing the signal shall stop before entering the nearest crosswalk at the intersection or at a limit line when marked, but if the stop cannot be made safely, a vehicle must be driven cautiously through the intersection”.

A vehicle can enter an intersection legally, even a fraction before it turns red If it takes a vehicle two-seconds of time to
cross, then the vehicle is under eminent danger of being involved in a right angle crash in the absence of an all red interval
An intersection without an all red interval runs the risk of having right angle crashes, even if no one violated the red light

Example: Calculate Clearance Intervals for the Intersection of Middlebelt
Road and 5 Mile Road
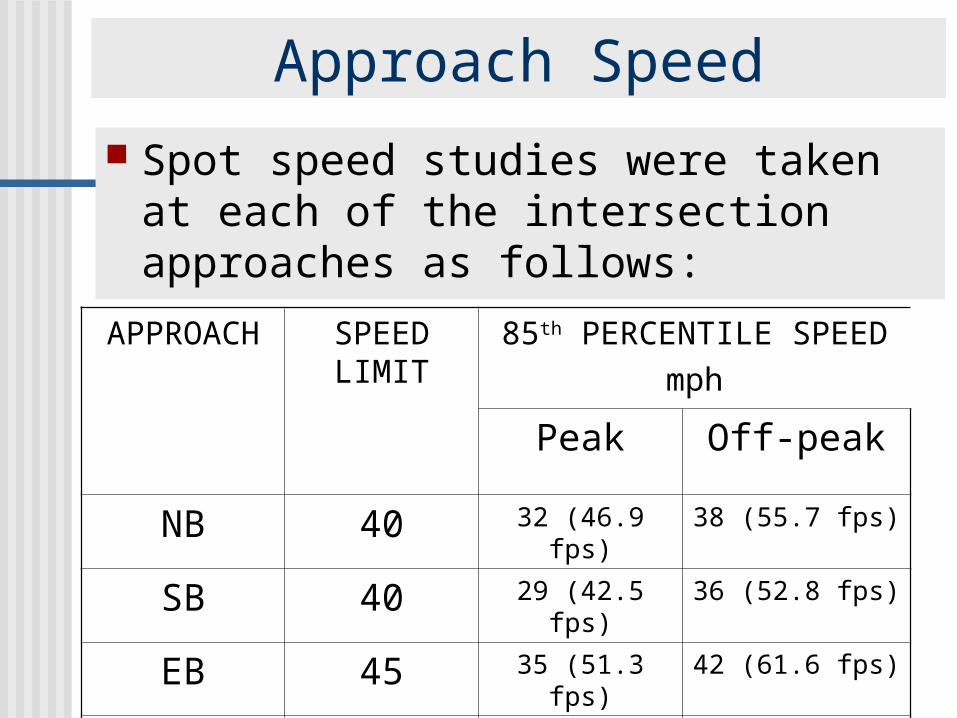
Approach Speed Spot speed studies were taken at
each of the intersection approaches as follows:
APPROACH SPEED LIMIT
85th PERCENTILE SPEEDmph
Peak Off-peak
NB 40 32 (46.9 fps) 38 (55.7 fps)
SB 40 29 (42.5 fps) 36 (52.8 fps)
EB 45 35 (51.3 fps) 42 (61.6 fps)
WB 45 36 (52.8 fps) 46 (67.5 fps)

Figure 2. Condition Diagram of the Middlebelt Road and Five Mile Road Intersection
N
10’11’5’
39’ONLY ONLY
58’
11’
43’
MobileGasolineStation
Mid-FiveCenter
Drivewayand Alley
West FenkellBakery
QuickStop DryCleaning
M-5 Party Store
ONLY ONLY
6’11’ 7’
12’
12’
14’
14’
12’
10’
10’ 13’ 13’14’11’ 15’
14’10’12’14’ 13’ 11’
Precision Tune
83’
12’
14’
12’
11’
12’
12’
ONLY
ONLY
ONLY
ONLY
28’ 33’43’26’52’239’
Proposed Development Site
Thrifty Flowers and
Plants
Abandoned Office
Building
Co-Op ServicesCreditUnion
Street Name Signs
Center LaneTurn Left Only Sign
Center Two-Way Left-Turn Lane Sign
Center LaneTurn Left Only Sign
Center Two-Way Left-Turn Lane Sign
ONL
YO
NLY
ONL
YO
NLY
ONLYONLY
ONLYONLY
Middlebelt Road Sign
Speed Limit 45
Sign
Street Name Signs
20’ 11’5’ 19’ 70’ 33’
Left-Turn Signals
Right Turn Arrows
Right Turn Arrows
20’
12’
Alley
SunocoGasolineStation
6’
18’
Right Lane Must Turn Right Sign
44’
37’
52’
Parnin Janitorial Supplies
Faygo Discount
138’
13’
40’
BurgerKing
Restaurant
McDonald’sRestaurant
19’
52’
74’11’ 12’13’13’ 12’
Cambridge GroupOffice Building Speed
Limit 40 Sign
FIVE MILE ROAD
MID
DL
EB
EL
T R
OA
D
$2 Car Wash
Figure 2. Condition Diagram of the Middlebelt Road and Five Mile Road Intersection
N
10’11’5’
39’ONLY ONLY
58’
11’
43’
MobileGasolineStation
Mid-FiveCenter
Drivewayand Alley
West FenkellBakery
QuickStop DryCleaning
M-5 Party Store
ONLY ONLY
6’11’ 7’
12’
12’
14’
14’
12’
10’
10’ 13’ 13’14’11’ 15’
14’10’12’14’ 13’ 11’
Precision Tune
83’
12’
14’
12’
11’
12’
12’
ONLY
ONLY
ONLY
ONLY
28’ 33’43’26’52’239’
Proposed Development Site
Thrifty Flowers and
Plants
Abandoned Office
Building
Co-Op ServicesCreditUnion
Street Name Signs
Center LaneTurn Left Only Sign
Center Two-Way Left-Turn Lane Sign
Center LaneTurn Left Only Sign
Center Two-Way Left-Turn Lane Sign
ONL
YO
NLY
ONL
YO
NLY
ONL
YO
NLY
ONL
YO
NLY
ONLYONLY
ONLYONLY
Middlebelt Road Sign
Speed Limit 45
Sign
Street Name Signs
20’ 11’5’ 19’ 70’ 33’
Left-Turn Signals
Right Turn Arrows
Right Turn Arrows
20’
12’
Alley
SunocoGasolineStation
6’
18’
Right Lane Must Turn Right Sign
44’
37’
52’
Parnin Janitorial Supplies
Faygo Discount
138’
13’
40’
BurgerKing
Restaurant
McDonald’sRestaurant
19’
52’
74’11’ 12’13’13’ 12’
Cambridge GroupOffice Building Speed
Limit 40 Sign
FIVE MILE ROAD
MID
DL
EB
EL
T R
OA
D
$2 Car Wash
120’
122’
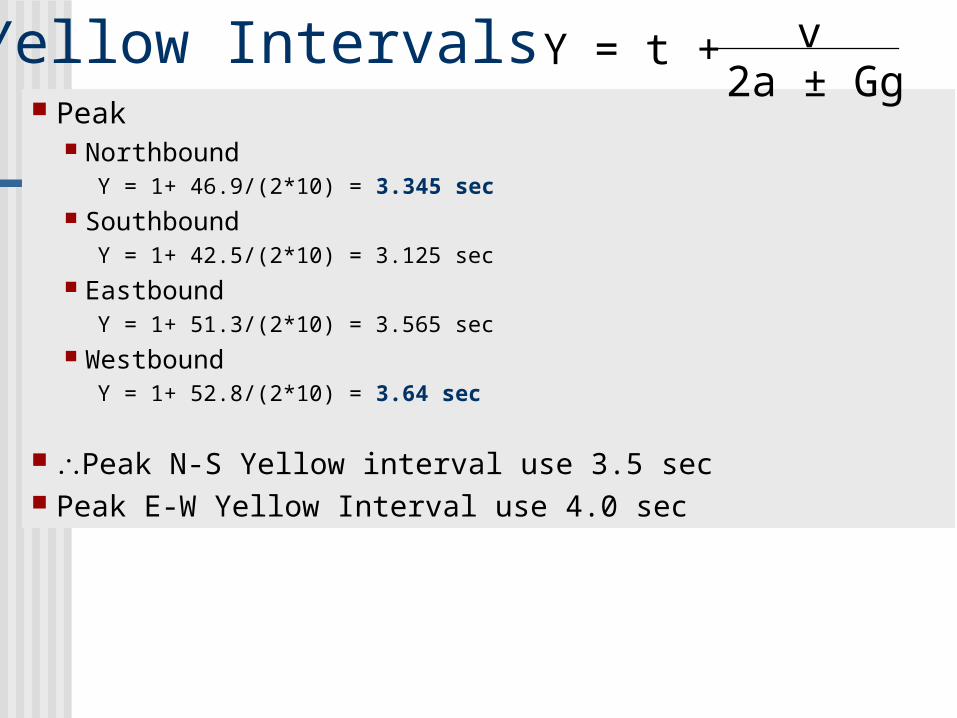
Yellow Intervals Peak
NorthboundY = 1+ 46.9/(2*10) = 3.345 sec
SouthboundY = 1+ 42.5/(2*10) = 3.125 sec
EastboundY = 1+ 51.3/(2*10) = 3.565 sec
WestboundY = 1+ 52.8/(2*10) = 3.64 sec
Peak N-S Yellow interval use 3.5 sec Peak E-W Yellow Interval use 4.0 sec
Y = t + v2a ± Gg

Yellow Intervals Off Peak
NorthboundY = 1+ 55.7/(2*10) = 3.785 sec
SouthboundY = 1+ 52.8/(2*10) = 3.640 sec
EastboundY = 1+ 61.6/(2*10) = 4.08 sec
WestboundY = 1+ 67.5/(2*10) = 4.375 sec
Off Peak N-S Yellow interval use 4.0 sec Off-Peak E-W Yellow Interval use 4.5 sec

All-Red Intervals Peak
Northbound(122+20)/46.9 = 3.0 sec
Southbound(122+20)/42.5 =3.3 sec
Eastbound(120+20)/51.3 =2.7 sec
Westbound(120+20)/52.8 =2.6 sec
Peak N-S All-Red interval use 3.3 sec Peak E-W All-Red Interval use 2.7 sec
All Red = r =w + L v

All-Red Intervals Off Peak
Northbound(122+20)/55.7 = 2.5 sec
Southbound(122+20)/52.8 =2.7 sec
Eastbound(120+20)/61.6 =2.3 sec
Westbound(120+20)/67.5 =2.1 sec
Off-Peak N-S All-Red interval use 2.7 sec Off-Peak E-W All-red Interval use 2.3 sec
All Red = r =w + L v

Clearance Intervals (CI) Peak Period
North-South East-WestY = 3.5 sec Y = 4.0 secAR = 3.3 sec AR = 2.7 sec CI = 6.8 sec CI = 6.7 sec
Off-Peak PeriodNorth-South East-West
Y = 4.0 sec Y = 4.5 sec AR = 2.7 sec AR = 2.3 secCI = 6.7 sec CI = 6.8 sec
Driver’s Decision Whether to stop or not stop at the
traffic signal may be related to:
vehicle approach speed color of the traffic signal when
noticed by the driver location of the vehicle with respect to
the intersection

Driver’s Decision natural driver behaviors: aggressive vs.
non-aggressive type of vehicle vehicle condition trip purpose
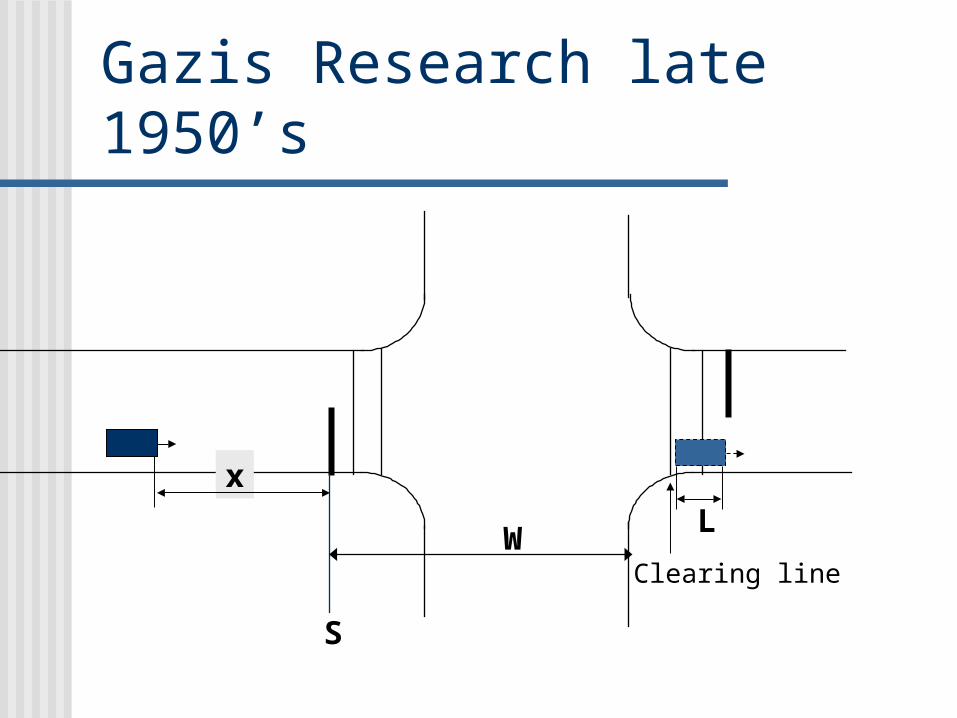
Gazis Research late 1950’s
W
xL
S
Clearing line

Gazis Study Car traveling at a constant speed = v0
Location of the car is at x feet from the stop bar, S
Driver has 2 options Must decelerate and stop before line S (stop bar) Must continue and go through the intersection Dilemma Zone

Dilemma Zone
xc
SCannot go xo
Dilemma zone
Cannot stop
Gazis Study

1, 2 : time at which acceleration or deceleration will begin after the starting of the yellow interval
a1: constant acceleration rate for crossing the intersection= 10 ft/sec2
a2: constant deceleration rate for stopping before the intersection = 10 ft/sec2
W: effective width of the intersection L: length of the car (usually 20’) : Length of the clearance interval
(Y+AR)
Gazis Study

WVehicle location when
light turns yellow
xL
S
Clearing line
Gazis Study

If the driver is to come to a complete stop before entering the intersection
(x - vo2) vo2/2a2
If the driver is to clear the intersection completely before the light turns red
(x + w + L) - vo 1 vo ( - 1) + ½ a1 ( - 1)2
Gazis Study

Assuming a maximum deceleration rate of a2
*, the critical distance is:
Xc = vo 1 + vo2/2a2
*
If x > xc the car can be stopped before the intersection
If x < xc it will be uncomfortable, unsafe or impossible to stop
Gazis Study
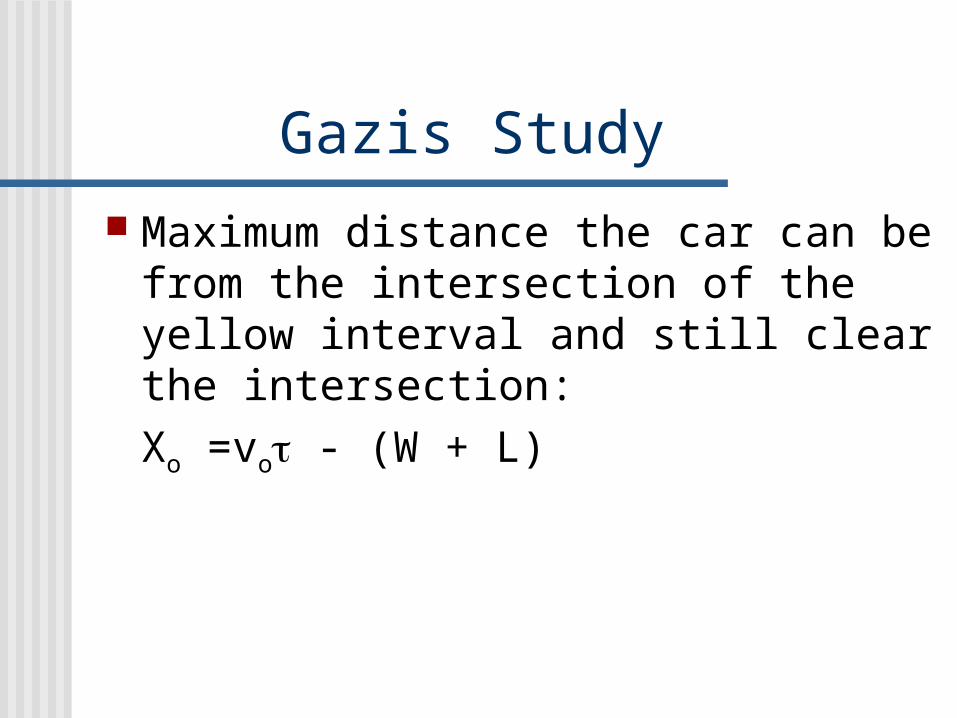
Maximum distance the car can be from the intersection of the yellow interval and still clear the intersection:Xo =vo - (W + L)
Gazis Study

Thus, if xo > xc the driver, once past the critical distance xc can clear the intersection before the signal turns red
If xo < xc , a driver at a distance x from the intersection, such that
xo <x< xc will find him/herself in an awkward position if the yellow interval begins at that moment
• cannot stop safely and has to attempt to go through the intersection
Gazis Study

Minimum length of the clearance interval min = (xc+ W+L)/vo OR
min = 2 + ½ vo/2a2*+
(W+L)vo
Gazis Study

Example:
W = 80’Vehicle location when
light turns yellow, traveling at 30 mph
(44 fps)
xL = 20’
S
Clearing line
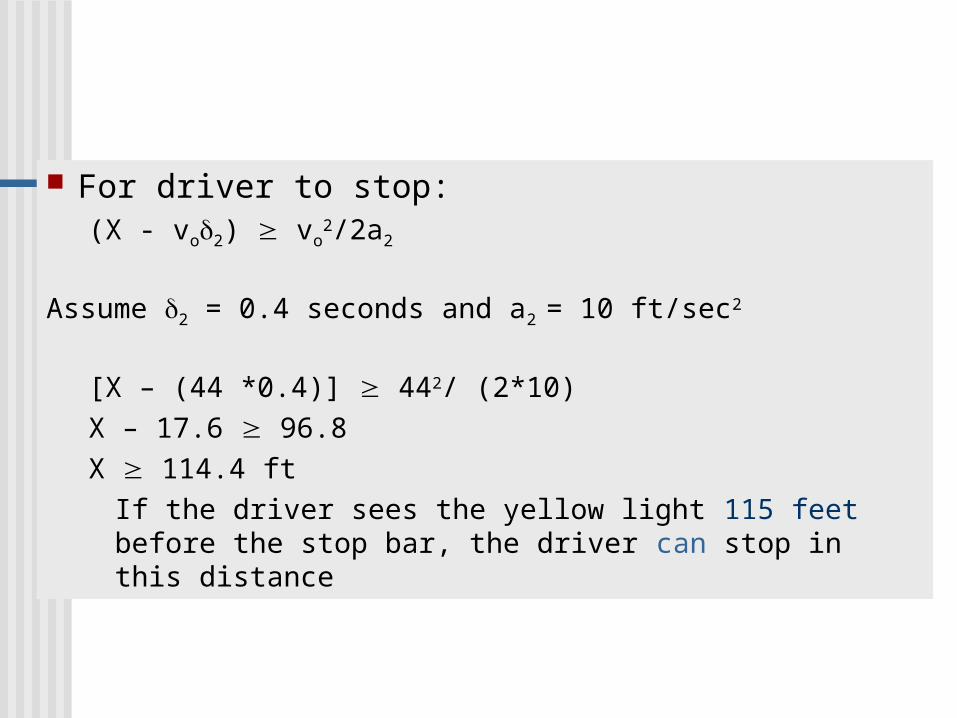
For driver to stop:(X - vo2) vo
2/2a2
Assume 2 = 0.4 seconds and a2 = 10 ft/sec2
[X – (44 *0.4)] 442/ (2*10)X – 17.6 96.8X 114.4 ft
If the driver sees the yellow light 115 feet before the stop bar, the driver can stop in this distance
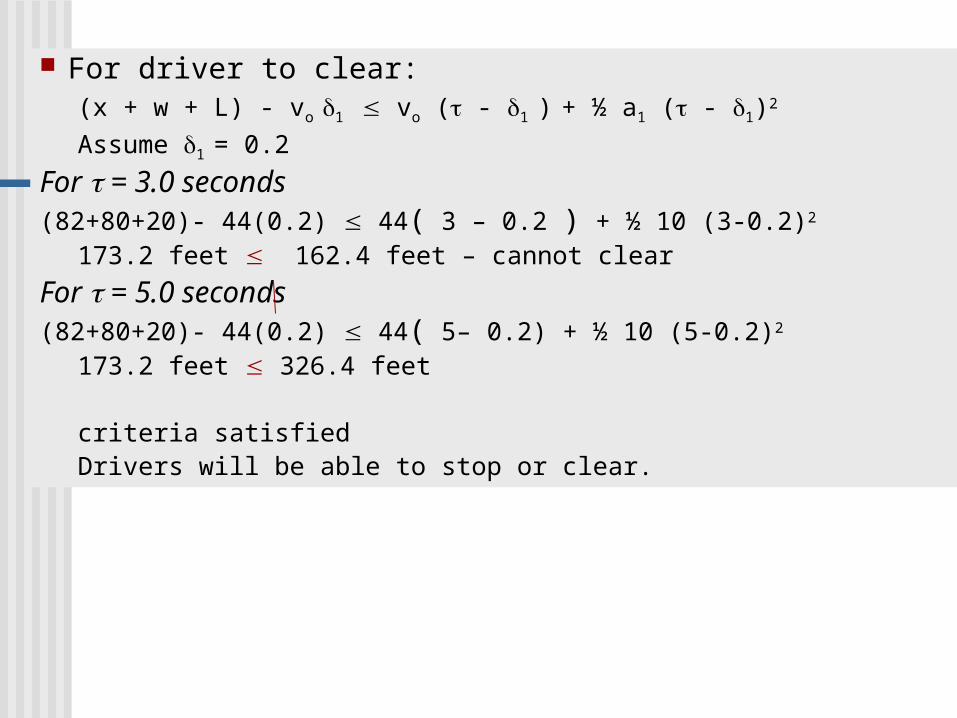
For driver to clear:(x + w + L) - vo 1 vo ( - 1 ) + ½ a1 ( - 1)2
Assume 1 = 0.2
For = 3.0 seconds(82+80+20)- 44(0.2) 44( 3 – 0.2 ) + ½ 10 (3-0.2)2
173.2 feet 162.4 feet – cannot clear
For = 5.0 seconds(82+80+20)- 44(0.2) 44( 5– 0.2) + ½ 10 (5-0.2)2
173.2 feet 326.4 feet
criteria satisfiedDrivers will be able to stop or clear.

For = 6.0 seconds(82+80+20)- 44(0.2) 44(6– 0.2) + ½ 10 (6-0.2)2
173.2 feet 423.4 feet – criteria satisfiedDrivers will be able to stop or clear.

Highway Capacity Software(HCS)
Highway Capacity Software
Based on the Highway Capacity Manual (HCM) Special Report 209 Transportation Research Board (TRB),
National Research Council (NRC)

Ten Modules1. Freeways2. Weaving 3. Ramps4. Multi-lane Highways5. Two-lane Highways6. Signalized Intersections7. Unsignalized Intersections8. Arterials9. Transit10. Pedestrians

Signalized Intersections Capacity
Defined for each lane group• Lane group: one or more lanes that accommodate
traffic and have a common stopline Lane group capacity: maximum rate of flow
for the subject lane group that may pass through the intersection under prevailing traffic, roadway and signalized conditions

Traffic Conditions Approach volumes (left, through, right) Vehicle type Location of bus stops Pedestrian crossing flows

Roadway Conditions Number and width of lanes Grades Lane use
• Including parking lanes
Signalized Conditions Signal phasing Signal timing Type of control Signal progression

Level of Service (LOS) for Signalized Intersections
Defined in terms of delay as a measure of driver discomfort Driver frustration Fuel consumption Lost travel time

Delay experienced by a motorist includes many factors: Signal control Geometrics Incidents

Total delay: Difference between actual travel time and
ideal travel time• In the absence of traffic control, geometric delay,
incidents and when there are no vehicles on the road
In HCS only control delay is quantified• initial deceleration delay• Queue move-up time• Stopped delay• Final acceleration delay
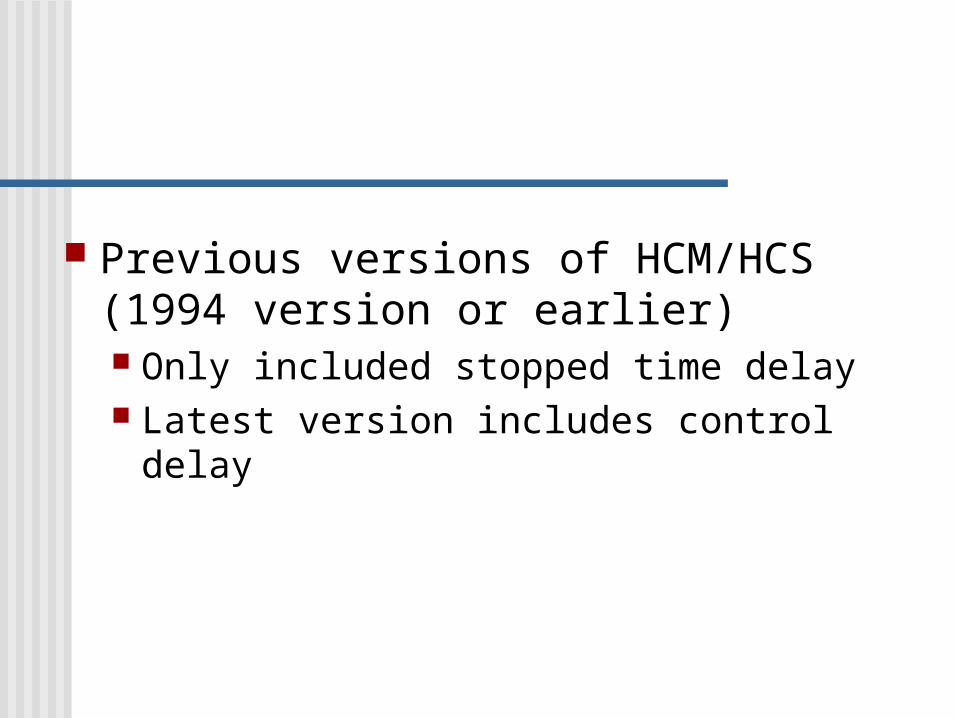
Previous versions of HCM/HCS (1994 version or earlier) Only included stopped time delay Latest version includes control delay

LOS LOS criteria are stated in terms of
average control delay per vehicle Delay is dependent on
• Quality of progression• Cycle length• Green ratio• V/c ratio for lane group• Phasing design
Designated by letters A - F

LEVEL OF SERVICE
CONTROL DELAY PER VEHICLE
(SEC/VEHICLES)
A
B
C
D
E
F
10
>10 and 20
>20 and 35
>35 and 55
>55 and 80
> 80
LOS Criteria for Signalized Intersections

LOS A Describes operations with very low
control delay, up to 10 sec/veh Occurs when progression is extremely
favorable When most cars arrive during the green Most vehicles do not stop at all Drivers can select speed and path

LOS B Describes operations with control
delay > 10 and up to 20 sec/veh Occurs with good progression, short
cycle lengths or both More vehicles stop than with LOS A
• Causing higher levels of average delay
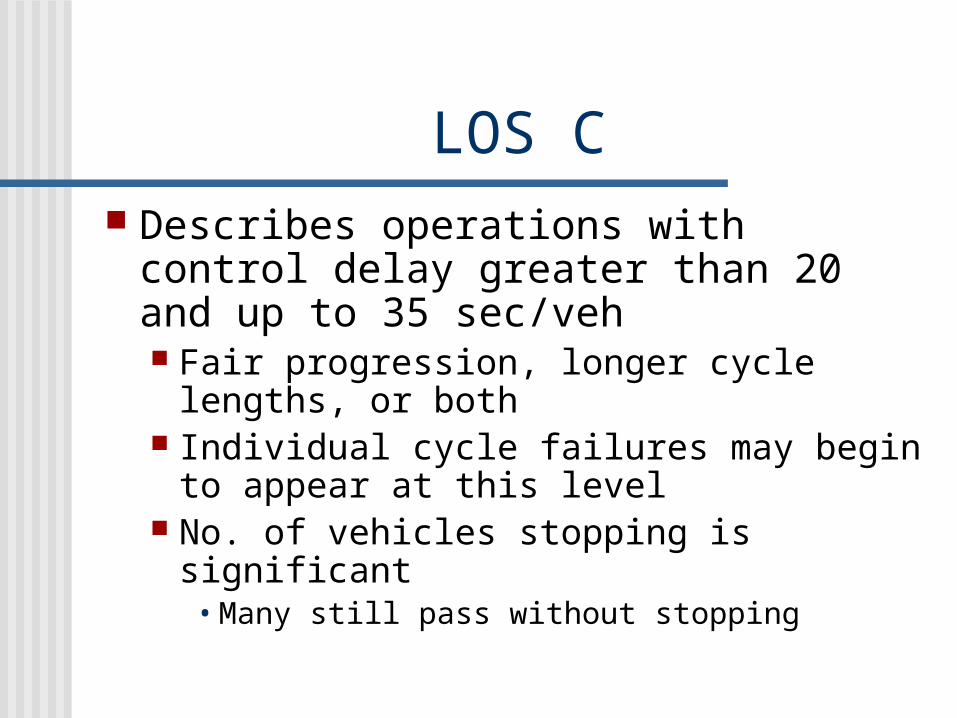
LOS C Describes operations with control
delay greater than 20 and up to 35 sec/veh Fair progression, longer cycle lengths,
or both Individual cycle failures may begin to
appear at this level No. of vehicles stopping is significant
• Many still pass without stopping

LOS D Describes operations with control delay >
35 and up to 55 sec/veh Influence of congestion becomes more
noticeable Longer delays result
• Unfavorable progression• Long cycle lengths• High v/c ratios
Many vehicles stop• Proportion of vehicles not stopping declines
Individual cycle failures are noticeable
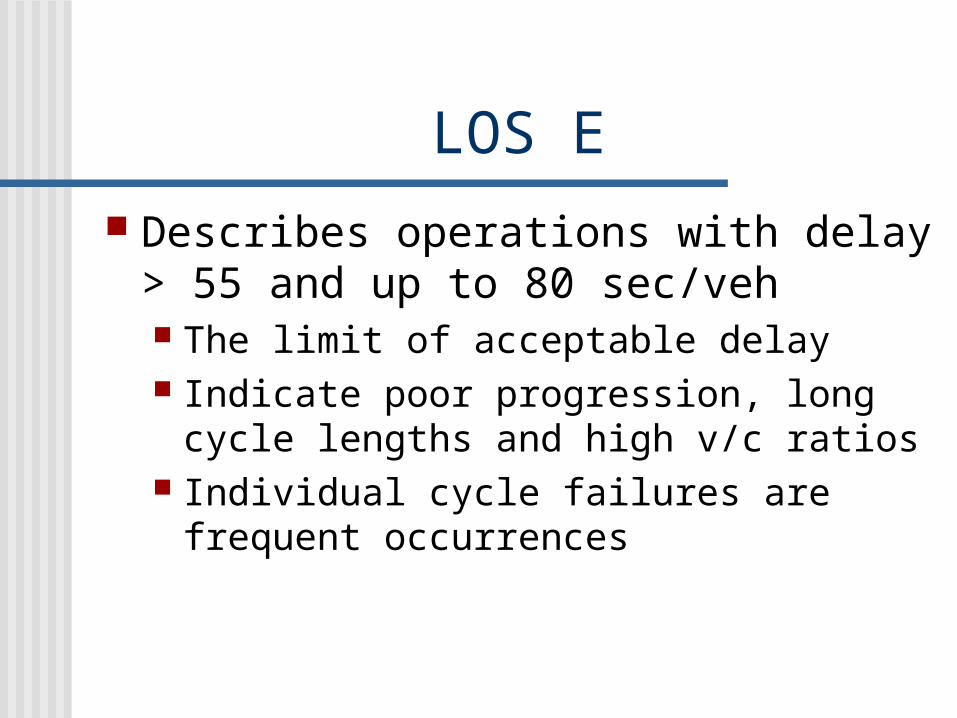
LOS E Describes operations with delay >
55 and up to 80 sec/veh The limit of acceptable delay Indicate poor progression, long cycle
lengths and high v/c ratios Individual cycle failures are frequent
occurrences

LOS F Describes operations with delay > 80
sec/veh Considered unacceptable to most drivers Occurs with oversaturation
• When arrival flow rates exceed the capacity of the intersection
Occurs at high v/c rations below 1.0 with many individual cycle failures
Poor progression and long cycle lengths may also contribute

Operational Analysis
Procedure
2.2. VOLUME ADJUSTMENTVOLUME ADJUSTMENT• Peak hour factor• Establish lane groups• Assign volumes to lane groups
1.1. INPUT INPUT • Geometric conditions• Traffic conditions• Signalization conditions
4.4. CAPACITY ANALYSIS MODULECAPACITY ANALYSIS MODULE• Compute lane group capacitiesCompute lane group capacities• Compute lane group v/c ratiosCompute lane group v/c ratios• Aggregate resultsAggregate results
5.5. LEVEL OF SERVICE MODULELEVEL OF SERVICE MODULE• Compute lane group delays• Aggregate delays• Determine levels of service
3. SATURATION FLOW RATE3. SATURATION FLOW RATE• Ideal saturation flow rate• Adjustments