Clearance Analysis of 3D Printed Assemblies Using Fused ...
62
Rochester Institute of Technology Rochester Institute of Technology RIT Scholar Works RIT Scholar Works Theses 3-9-2016 Clearance Analysis of 3D Printed Assemblies Using Fused Clearance Analysis of 3D Printed Assemblies Using Fused Filament Extrusion Filament Extrusion Kshitij Luthria [email protected] Follow this and additional works at: https://scholarworks.rit.edu/theses Recommended Citation Recommended Citation Luthria, Kshitij, "Clearance Analysis of 3D Printed Assemblies Using Fused Filament Extrusion" (2016). Thesis. Rochester Institute of Technology. Accessed from This Thesis is brought to you for free and open access by RIT Scholar Works. It has been accepted for inclusion in Theses by an authorized administrator of RIT Scholar Works. For more information, please contact [email protected].
Transcript of Clearance Analysis of 3D Printed Assemblies Using Fused ...

Rochester Institute of Technology Rochester Institute of Technology
RIT Scholar Works RIT Scholar Works
Theses
3-9-2016
Clearance Analysis of 3D Printed Assemblies Using Fused Clearance Analysis of 3D Printed Assemblies Using Fused
Filament Extrusion Filament Extrusion
Kshitij Luthria [email protected]
Follow this and additional works at: https://scholarworks.rit.edu/theses
Recommended Citation Recommended Citation Luthria, Kshitij, "Clearance Analysis of 3D Printed Assemblies Using Fused Filament Extrusion" (2016). Thesis. Rochester Institute of Technology. Accessed from
This Thesis is brought to you for free and open access by RIT Scholar Works. It has been accepted for inclusion in Theses by an authorized administrator of RIT Scholar Works. For more information, please contact [email protected].
ROCHESTER INSTITUTE OF TECHNOLOGY
CLEARANCE ANALYSIS OF 3D PRINTED ASSEMBLIES USING
FUSED FILAMENT EXTRUSION
Kshitij Luthria
Thesis submitted to the Faculty of the
Rochester Institute of Technology
In partial fulfillment of the requirements for the degree of
Master of Science in Industrial Engineering
Rochester Institute of Technology
Rochester, NY
March 9, 2016
DEPARTMENT INDUSTRIAL ENGINEERING
KATE GLEASON COLLEGE OF ENGINEERING
ROCHESTER INSTITUTE OF TECHNOLOGY
ROCHESTER, NEW YORK
CERTIFICATE OF APPROVAL
____________________
M.S. DEGREE THESIS
The M.S. Degree Thesis of Kshitij Luthria
has been examined and approved by the
thesis committee as satisfactory for the
thesis requirement for the
Master of Science degree
Approved by:
__________________________________
Dr. Denis Cormier, Thesis Advisor
__________________________________
Dr. Ronald Aman, Committee Member

i
Abstract 3D Printing technologies have been around for the better part of 30 years now, and researchers today have
a reasonably good understanding of how the different processes work. A focus for the next era of 3D
printing will likely be to gain a deeper understanding of how these processes can be used in unique
applications. One such unique application that can potentially change the way conventional manufacturing
works involves 3D printing of assemblies. By printing assemblies ‘in-situ’, multiple assembly steps can be
by-passed, thus increasing efficiency and decreasing costs. This research specifically seeks to develop an
understanding of how clearances between mating surfaces in 3D printed assembly components should be
designed based on the orientations of the surfaces and the 3D printing process used.
A design of experiments (DOE) approach was used to identify significant process parameters affecting the
clearances obtained between mating surfaces in a 3D printed assembly. Factors such as the surface angle,
CAD clearance between mating surfaces, and 3D printer layer thickness were all considered. The
experiments were carried out on a MakerBot Replicator 2X machine, although the experimental
methodology applies to other processes as well. The samples obtained were examined using a Hirox 7700
digital microscope to quantify differences between the CAD model design clearances and 3D printed
clearances between mating surfaces in the assembly. The optimal ranges for experimental factors were thus
derived.
Based on results of the designed experiments, pin-hole assembly test samples were printed using the optimal
range of parameter values. An unconventional method was then applied using a cylindrical pin-polygon
assembly, which revealed that this method was more accurate in obtaining the desired clearances in a 3D
printed moving assembly.
Acknowledgements

ii
I wish to express my most sincere gratitude to my advisor Dr. Denis Cormier for giving me the opportunity
to work on this research and for his continuous support, motivation and guidance. I feel fortunate to learn
from his breadth of knowledge and valuable research literature in the field of additive manufacturing. I
would also like to thank Dr. Ron Aman for his insights and guidance during the course of my thesis.
Additionally, I would like to thank John Bonzo & Chaitanya Mahajan for their kind help and suggestions.
Sincere thanks to the entire faculty in the Industrial & Systems Engineering department for their help and
support as always.
I would like to extend my gratitude to my fellow Industrial engineering graduate students, roommates and
to all who helped me throughout my master’s journey. A special thanks my girlfriend Laura Vas for being
with me through thick and thin.
Finally, I want to thank my parents and sister for their love and support, their spiritual point of view in life
has helped me get through tough times with ease.
iii
Table of Contents 1 Introduction .......................................................................................................................................... 1
1.1 Fused Filament Extrusion .............................................................................................................. 3
2 Literature Review .................................................................................................................................. 5
2.1 Research Objectives ...................................................................................................................... 8
3 Research Methodology ......................................................................................................................... 9
3.1 Preliminary Experimentation: Analysis of slot width at various angles of printing ..................... 9
3.1.1 Methods and Material ........................................................................................................ 10
3.1.2 Evaluation and Measurement ............................................................................................. 11
3.1.3 Preliminary Results ............................................................................................................. 15
3.1.4 Conclusions from the Feasibility test .................................................................................. 17
3.2 Design of Experiments ................................................................................................................ 17
3.2.1 Experimental Set-up ............................................................................................................ 18
3.2.2 Evaluation and Measurement ............................................................................................. 21
3.2.3 Analysis of Results from the Design of Experiments........................................................... 23
3.2.4 Conclusions from the Design of Experiments ..................................................................... 28
4 3D Printing a moving assembly ........................................................................................................... 29
4.1 3D Printed Hole Methodology .................................................................................................... 29
4.2 3D Printed Hole Results .............................................................................................................. 30
4.3 3D Printed Hole Conclusions ....................................................................................................... 33
4.4 3D Printed Polygonal Hole-Pin Features ..................................................................................... 33
5 Conclusions and Recommendations for Future Research .................................................................. 40
5.1 Summary ..................................................................................................................................... 40
5.2 Recommendations for Future Work ........................................................................................... 41
6 References .......................................................................................................................................... 43
7 Appendix: Micrographs for Design of Experiments ............................................................................ 45

iv
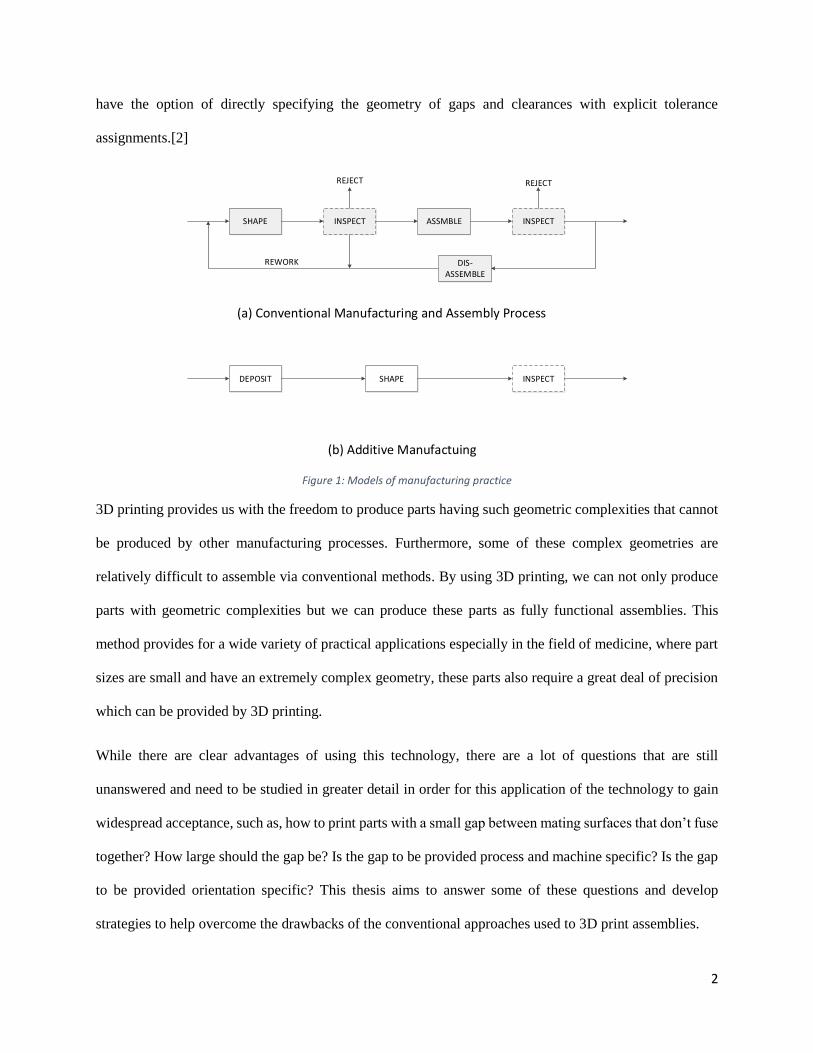
Table of Figures Figure 1: Models of manufacturing practice ................................................................................................. 2
Figure 2:Slicing in a STL model[6] ................................................................................................................. 3
Figure 3: FFE process ..................................................................................................................................... 4
Figure 4: Staircase effect in FDM: (a) Original CAD geometry; (b) Faceted STL file of CAD geometry; (c)
Representation of 3D printed part with stair-stepping effect due to printed layers. ..................................... 5
Figure 5:1mm Slot width analysis Figure 6: 0.5mm Slot width analysis................. 10
Figure 7: Measurements (in mm) taken for each region of the slot .......................................................... 12
Figure 8: Measurements within each region of the slot ............................................................................ 12
Figure 9: Interval plot of slot width error for specified slot width of 1mm ................................................ 16
Figure 10: Interval plot of slot width error for specified slot width of 0.5mm ........................................... 17
Figure 11: Print settings for design of experiment ..................................................................................... 18
Figure 12: Whole plot design ...................................................................................................................... 19
Figure 13: Slot width and slot orientation .................................................................................................. 20
Figure 14: Layer Thickness .......................................................................................................................... 20
Figure 15: Slot width measurements taken at 4 points of the slot ............................................................ 21
Figure 16: Enlarged view of measurements taken for DOE ........................................................................ 21
Figure 17: Row number vs residuals for error in slot width ....................................................................... 24
Figure 18: Normality plot for error in slot width ........................................................................................ 24
Figure 19: Interaction plot for error in slot width ....................................................................................... 25
Figure 20: (a) Surface plot slot width error w.r.t slot angle (b) Surface plot slot width error w.r.t slot width
(c) Surface plot slot width error w.r.t layer thickness ................................................................................ 27
Figure 21: Diagrammatic representation of the drooping phenomenon in down facing surfaces ............ 28
Figure 22: 3D printed holes samples........................................................................................................... 29
Figure 23: Relative error measured for 3D printed hole ............................................................................ 33
Figure 24: (a) Conventional approach for a pin-hole assembly; (b) Unconventional approach for a pin-hole
assembly where hexagonal hole is at a 30 to the build plate; (c) Unconventional approach for a pin-hole
assembly where hexagonal hole is at a parallel to the build plate ............................................................. 35
Figure 25: Print preview in of the build platform showing assemblies in four different orientations along
with support structures .............................................................................................................................. 36
Figure 26: Moving cylindrical pin-hexagon hole assembly ......................................................................... 37
Figure 27: Fused cylindrical pin- cylindrical hole assembly ........................................................................ 38
Figure 28: Whole Plot 1 ............................................................................................................................... 46
Figure 29: Whole Plot 2 ............................................................................................................................... 47
Figure 30: Whole Plot 3 ............................................................................................................................... 48
Figure 31: Whole Plot 4 ............................................................................................................................... 49
Figure 32: Whole Plot 5 ............................................................................................................................... 50
Figure 33: Whole Plot 6 ............................................................................................................................... 51
Figure 34: Whole Plot 7 ............................................................................................................................... 52
Figure 35: Whole Plot 8 ............................................................................................................................... 53
Figure 36: Whole Plot 9 ............................................................................................................................... 54

v
List of Tables Table 1: Print settings for analysis of slot width at various angles of printing ........................................... 11
Table 2: Measurement data (in mm) for 1mm slot width ............................. Error! Bookmark not defined.
Table 3: Measurement data (in mm) for 0.5mm slot width (mm units) .................................................... 14
Table 4: DOE factors and levels................................................................................................................... 20
Table 5: Design table and data for design of experiment ........................................................................... 22
Table 6: Summary of fit and parameter Estimates ..................................................................................... 23
Table 7 : Measured hole diameters for a nominal (specified) hole diameter of 8 mm printed at different
orientations w.r.t the X-Y build plane along with the calculated relative error ......................................... 30
Table 8: Measured hole diameters for a nominal (specified) hole diameter of 10 mm printed at different
orientations w.r.t the X-Y build plane along with the calculated relative error ......................................... 31
Table 9: Measured hole diameters for a nominal (specified) hole diameter of 12 mm printed at different
orientations w.r.t the X-Y build plane along with the calculated relative error ....................................... 31
Table 10: Measured hole diameters for a nominal (specified) hole diameter of 14 mm printed at different
orientations w.r.t the X-Y build plane along with the calculated relative error ....................................... 32
Table 11: Dimensions used to print the hexagonal hole-cylindrical pin validation assembly .................... 39
Table 12: Dimensions used to print the cylindrical hole-cylindrical pin validation assembly .................... 39

1
Introduction
3D printing technologies have asserted their presence in the manufacturing world over the past decade and
have the ability to potentially replace some conventional manufacturing processes in the years to come.
Though the technology has grown leaps and bounds, there are still several drawbacks limiting its use for
rapid manufacturing [1]. That being said, there is a great amount of research being carried out to help this
technology become a primary manufacturing process in factories across the world.
Much of modern manufacturing relies on interchangeability and standardization [2]. This method works
perfectly well in a mass production environment, where lot sizes range from hundreds of thousands to
millions. However, consider a situation where a customer wants to place a large order in which every piece
is unique. Conventional manufacturing methods will fail as the manufacturer will have to develop special
tooling for each part. The economies of scale do not add up, resulting in an unprofitable business model.
Conventional assembly lines are designed as a series of stations where new components are added to the
product at every station (Figure 1 a). Consider a situation where a change is to be made at Station 1 which
alters the outer shape of the product. This change will now affect the next station and may even affect the
tooling at all other stations downstream, hence this method is rigid and doesn’t allow changes to the process
freely.
Subsequently, recent advancements in the field of additive manufacturing can help overcome the
aforementioned problems related to manufacturing. Recent technologies make it possible to manufacture
entire assemblies incrementally, with no subsequent assembly operations required (Figure 1 b). 3D printing
technologies are capable of fabricating parts with complex internal geometry and multiple materials.
Additionally, these processes’ build parts are encapsulated in a sacrificial support structure, which makes
it possible to fabricate multiple-part assemblies with bearing, mating and fitting surfaces in-situ. Designers
2
have the option of directly specifying the geometry of gaps and clearances with explicit tolerance
assignments.[2]
DEPOSIT SHAPE INSPECT
SHAPE ASSMBLE INSPECTINSPECT
DIS-ASSEMBLE
REJECT
REWORK
REJECT
(a) Conventional Manufacturing and Assembly Process
(b) Additive Manufactuing
Figure 1: Models of manufacturing practice
3D printing provides us with the freedom to produce parts having such geometric complexities that cannot
be produced by other manufacturing processes. Furthermore, some of these complex geometries are
relatively difficult to assemble via conventional methods. By using 3D printing, we can not only produce
parts with geometric complexities but we can produce these parts as fully functional assemblies. This
method provides for a wide variety of practical applications especially in the field of medicine, where part
sizes are small and have an extremely complex geometry, these parts also require a great deal of precision
which can be provided by 3D printing.
While there are clear advantages of using this technology, there are a lot of questions that are still
unanswered and need to be studied in greater detail in order for this application of the technology to gain
widespread acceptance, such as, how to print parts with a small gap between mating surfaces that don’t fuse
together? How large should the gap be? Is the gap to be provided process and machine specific? Is the gap
to be provided orientation specific? This thesis aims to answer some of these questions and develop
strategies to help overcome the drawbacks of the conventional approaches used to 3D print assemblies.

3
Fused Filament Extrusion
Fused Filament Extrusion (FFE) is the most common and widely used additive manufacturing process
available today [3]. The process was developed in the late 1980’s and was patented by Stratasys in 1989
[4]. With the expiration of the patent and increased interest in the technology, there has been a surge of
companies and crowd sourcing projects which utilize the FFE process or a variation of it to manufacture
products.
The process starts with creation of a 3D CAD model of the object to be printed. The CAD model is
converted into the STL file format. The STL model is “mathematically sliced by intersecting it with
horizontal planes, each slice represents a cross-section data for the part and the layer thickness is defined
as the distance between the planes” [5]. Using the section data, the software generates tool paths which
drive the extrusion head. The toolpath data is then downloaded to the FFE machine to be used.
Figure 2: Slicing in a CAD model
A thermoplastic filament is fed into a heated nozzle whose temperature exceeds the melting point of the
feedstock. The soft polymer is extruded through a nozzle of a given diameter. An X-Y stage with a belt and
pulley mechanism moves the nozzle over the prescribed tool path while the material is extruded onto a
heated build plate, thus printing the first layer of material. Once a layer is printed, the build plate lowers by
an amount equal to the set layer height, thus enabling the next layer to be printed on top of the previous

4
printed layer (Figure 3). The movement of the build plate in the vertical direction (Z axis) and the movement
of the nozzle in the horizontal (X-Y axis) is controlled using a microprocessor [4].
Figure 3: FFE process
The FFE process allows the user to print support structures beneath down-facing surfaces as well. A support
structure is formed by depositing material which will ultimately be under suspended portions of the object
being formed. As the part is being printed one layer at a time, the overhanging portions or portions of the
part suspended against gravity are held in place by these support structures. They prevent the material from
falling into undercuts, hollow features or onto the base [6]. Following completion of the build, the support
structure is removed by either breaking it away, or dissolving it in a suitable solution [7].
The amount of support structure required will vary according to the build orientation of the part with respect
to the build plate. Parts being printed parallel to the build plate will require less support material as a lesser
portion of the part will be suspended under gravity, while parts which are at an angle to the build plate will
require more support material to hold the part in place. The use of support material also has an effect on the
surface finish of the part as the support structure minimizes the sagging of the part which is suspended
against gravity.

5
Literature Review
The FFE process builds parts using a layering process based upon the STL file format. The STL file format
approximates the surfaces of an object by a set of facets (triangles) as illustrated in Figure 4(b). When this
part is sliced into the layers to be printed, the well-known staircase effect results as illustrated in Figure
4(c). According to Arni and Gupta [8], the extent of the staircase effect depends on the layer thickness and
slope of the surface relative to the build plane. As shown in Figure 4, different orientations of the shaded
face with respect to the build plane produce different degrees of the staircase effect. Whether a part can be
produced with an acceptable accuracy and surface finish therefore depends on the build orientation. In the
case where an assembly of parts are 3D printed, the accuracy and surface finish of opposing faces in the
assembly components are critical in determining whether or not the printed assembly will function properly.
(a) (b) (c)
Figure 4: Staircase effect in FDM: (a) Original CAD geometry; (b) Faceted STL file of CAD geometry; (c) Representation of 3D
printed part with stair-stepping effect due to printed layers.
Although relatively little research has been published on the subject of 3D printed assemblies, there is a
wealth of published research on accuracy and surface finish. Paul et al. studied the effect of build orientation
on cylindricity error using an analytical approach and by simulating the manufacturing surface based on
the CAD and STL models of the part. The concept of a feasibility range for cylindricity tolerance was
introduced, and the acceptable ranges of the orientation angles between the cylinder axis and build vector
were also calculated.
The main contributions of the approach presented by the authors is a graphical method to identify optimal
orientation zones that satisfy the cylindricity tolerance for a part with multiple cylindrical features. This

6
contribution provides designers with a technique to tweak the tolerance callouts on the cylindrical features
depending upon the process parameters of the RM process [9].
Ippolito et al. investigated the development, manufacture and testing of a benchmark to investigate
dimensional accuracy and surface finish of five rapid prototyping techniques: stereolithography (SLA),
solid ground curing (SGC), selective laser sintering (SLS), fused deposition modeling (FDM) and laminated
object manufacturing (LOM). The study showed that surface finish was the crucial feature in many cases.
This was often corrected by means of manual operations to the detriment of precision, production times,
and cost. Hence the final result is greatly dependent on the skillfulness of the operator. The authors further
specify the need for advancement from the present stage of empiricism to a fuller knowledge of the links
between process parameters and the geometrical and physical features of the part produced [10].
The influence of FDM machining parameters on surface finish of ABS parts was studied by Galantucci et
al. The surface finish of the products after the modification of extrusion parameters was measured and
processed through designed experiments. The results indicated that the process parameters had an effect on
the Ra values. They identified slice height and raster width as important parameters, while the tip diameter
had little importance. The authors proposed a post-processing treatment that yielded a significant
improvement of the Ra [11].
The effect of part orientation on cylindricity and flatness errors was analyzed by Paul and Anand [12]. The
authors’ intent was to manufacture precision parts through optimal part orientation of 3D printed parts with
minimal support structures. The authors point out that one of the main contributors to the energy and
material consumption in layered manufacturing processes are the support structures. They developed a
voxel based algorithm to determine the optimal part orientation for minimum support structure volume.
They were able to minimize the support structures while still satisfying the tolerance callouts on critical
features. The authors also state that the areas requiring support structures tend to have poor surface
roughness, and the production of error free high precision parts with minimal material utilization will push
layered manufacturing from a niche to a more widespread industry accepted manufacturing process.
7
Relvas et al. identified that there is a lack of published data related to rapid prototyping processes and
feature accuracy. They conducted their research to minimize this gap and provide much needed accuracy
in terms of dimensional and geometric information. The research showed that there are few benefits to
generating STL files with extremely high resolution. This kind of refinement would not necessarily result
in obtaining more accurate models. The research further showed that despite technological advances in
processes such as FFE and binder jetting, the accuracy of these processes can exceed the ± 0.300mm range.
The researchers conclude that these technologies may be acceptable for concept modeling, but caution is
needed for parts with certain functional requirements [13].
A surface roughness visualization model was developed by Campbell et al. The basis of this research was
that surface roughness of Rapid Prototype (RP) models will vary predictably across their total surface area.
The challenge to the RP user is to minimize the adverse effects of surface roughness through careful
orientation of the model during production. The authors developed a test geometry part; this part was printed
in a single setting so that surface roughness measurements could easily be taken for surface orientations
ranging from 2° to 180° at intervals of 2°. For the FFE process, the results showed that surface roughness
was predictable for surface orientations between 45° and 180°. However, on upward facing surfaces that
were within 45° of horizontal, there was considerable variation in measured surface roughness. The authors
concluded that stair stepping was not the main factor in determining surface roughness. They also suggest
that researchers should look at other ways of improving surface roughness other than reducing layer
thickness [14].
Krolczyk et al. investigated the surface integrity of both turned machined parts and FFE parts. Surface
analysis was made using novel metrology methods: auto correlation and gradient distribution. An Infinite
Focus Measurement Machine (IFM) was used for the surface texture analysis. Surfaces obtained by FFE
technology were composed of high peaks providing a small initial contact area and thus high areas of
contact stress when the surface was contacted. The authors observed smooth gradients on turned surfaces,
while FFE surfaces were characterized by steep gradients [15].

8
Research Objectives
Limited research is available on many RP processes. It has been found that questions pertaining to accuracy,
surface quality and strength are often avoided in case studies and equipment manufacturer’s websites. At
most, this information is stated in the vaguest form [16]. There are many books available which cover the
basics of RP technologies. However, many of the important details pertaining to RP are only available in
papers, patents, or proprietary corporate documents. Therefore, standardized methods for evaluating the
accuracy, surface quality, and mechanical properties of RP parts have not been sufficiently developed [17].
Literature on the subject shows that the accuracy of RP parts can be very important. However, the process
of determining the dimensional accuracy of parts produced by various RP systems is not a simple task.
Tolerance and precision are obviously important factors when choosing an RP process. 3DP is continuing
to improve, but it still is unable to hold the accuracy that CNC machining can [18]. In order to exploit the
strengths of 3DP, process capability profiles that include characteristics such as accuracy, surface finish,
strength, elongation, build times and cost must be determined [16]. Vayre et al. state the need for greater
study in the field with respect to 3D printing of assemblies in their paper Designing for Additive
Manufacturing [19].
The literature shows that researchers have worked on improving the properties of 3D printed parts relating
to surface finish and dimensional accuracy. The available literature on surface finish and dimensional
accuracy is very specific to printing individual parts, while very little research has been done to study these
parameters on 3D printed assemblies. Hence, there exists a need to study the surface finish and dimensional
accuracy that is needed to successfully 3D print functional assemblies of parts. Furthermore, virtually
nothing has been published on determining the minimum separation distance between mating surfaces in
an assembly. This research focuses developing a standardized method to determine the ideal part orientation
and separation distance (gap) between mating surfaces.

9
Research Methodology
In the previous chapter, 3D printing of assemblies was found to be a promising application of the
technology. However, very limited research has been performed that is specific to the printing of
assemblies. To build upon the existing research and gain a deeper understanding of the clearances required
to successfully 3D print a functional assembly, the research objectives presented here can be summarized
as follows:
1. Experimentally determine the magnitude of error between specified CAD model dimensions and
the corresponding measured dimensions in 3D printed assemblies.
2. Identify the process parameters (experimental factors) that have the greatest influence on
dimensional errors in 3D printed assemblies.
3. Use lessons learned from the experimental studies to propose build strategies for successful 3D
printing of component assemblies.
4. Demonstrate a fully functional moving 3D printed assembly whose geometry has been modified
using the build strategies to compensate for dimensional errors.
Preliminary Experimentation: Analysis of slot width at various angles of printing
In order to determine the magnitude of error between the specified CAD model dimensions of a clearance
slot between mating surfaces in an assembly and the corresponding measured clearance slot dimensions in
a 3D printed sample, a feasibility test was conducted. The aim of this test was to determine the clearance
slot width dimension at different print orientations and to compare the measured dimensions with the
specified CAD model dimensions.

10
Methods and Material
Two solid models, having slot widths of 1 mm and 0.5 mm respectively were designed using the
SolidWorks CAD package. These models consisted of rectangular 75 mm x 25 mm x 10 mm blocks. Two
blocks were created (Figure 5 & 6), each with a set of slots at different angles with respect to the horizontal
plane. These slots were designed to serve as simulated gaps between pairs of mating surfaces in a printed
assembly. Two blocks having slot widths of 1mm and 0.5 mm, respectively, were created. This study aimed
to find a correlation between actual 3D printed error in slot width from the specified CAD slot width and
the orientation of the slot. To analyze this relationship, it was decided to take a range of angles between the
0° (horizontal slot orientation) and 90° (vertical slot orientation). The angles chosen for the study were 0°,
15°, 30°, 45°, 60°, 75°and 90°. Figures 5 and 6 show the wide and narrow gap CAD models respectively.
The rationale behind taking a range of angles between 0° and 90° was to measure the actual slot width at
these angles and to compare them with the specified CAD model slot width in order to determine the
possibility of spotting any trends in the printing process.
Figure 5:1mm Slot width analysis Figure 6: 0.5mm Slot width analysis
The SolidWorks CAD models were saved in the STL file format prior to being loaded into the Makerware
software 3.5.0.39 and run on MakerBot Replicator 2X 3D printers. The default print parameters for ABS
plastic were chosen as shown in Table 1. The models were printed on a MakerBot Replicator 2x 3D printer
using 1.75 mm diameter black ABS filament (Makerbot Inc., Brooklyn, NY).

11
Table 1: Print settings for analysis of slot width at various angles of printing
Evaluation and Measurement
Once the models were printed, the slot widths were measured using a Hirox 7700 digital microscope. The
microscope’s integrated software measurement tool was used to analyze the 3D printed gap width in relation
to the nominal gap width from the CAD model. Low magnification images were obtained to provide the
largest possible field of view.
For every slot printed nine width measurements were taken along the length (3 in the top third of the slot,
3 in the middle third of the slot and 3 in the bottom third of the slot) as shown in Figures 7 and 8. As shown
in Figure 8, the expected peaks and valleys associated with the stair stepping effect are quite evident. For
purposes of determining suitable assembly clearances, the minimum gap widths between the peaks of
opposing faces were measured. The numerical values shown in Figure 7 correspond to the 3 separate
measurements that were taken for each region of the slot (top, middle, and bottom), and the numerical
values in Figure 8 correspond to the 3 measurements taken within each region. This data was collected for
the 1 mm gap width sample as well as the 0.5 mm gap width sample. A total of 63 slot width data points (7
slots x 9 measurements per slot) were obtained for each of the above printed samples as shown in Tables 2
and 3.
PRINT SETTINGS
Left Extruder: No Filament Quality: Right Extruder: MakerBot ABS
Resolution: Standard Infill: 20% Raft: Right Extruder
Profile: Standard Number of Shells: 3 Supports: Off
Slicer: Makerbot Slicer Layer Height: 0.1 mm
Temperature:
Left Extruder: 90 C
Right Extruder: 230 C
Build Plate: 110 C
Speed:
Speed while Extruding: 90 mm/s
Speed while Extruding: 150 mm/s

12
Figure 7: Measurements (in mm) taken for each region of the slot
Figure 8: Measurements within each region of the slot
2
3
4
5
6
7
8
9
10
11
B C D E F G
0.866 0.765
0.851 0.813
0.845 0.784
0.789 0.781
0.778 0.724
0.845 0.725
0.794 0.778
0.747 0.75
0.758 0.785
1
2
3
1mm
7590
3
1
2

13
Table 2: Measurement data (in mm) for 1mm slot width

14
Table 3: Measurement data (in mm) for 0.5mm slot width (mm units)

15
Preliminary Results
The slot width data obtained using the Hirox microscope was entered into Minitab and analyzed for the
presence of trends which would help determine the co-relation between the slot angle and the error obtained
between the specified CAD slot width and slot width measured from the printed samples.
An interval plot was created for the data obtained from the 1mm slot width sample using Minitab. The
interval plot (Figure 9) shows the mean and 95% confidence interval of the slot width error at every angle
of print. The slot width error was calculated by using the formula:
𝑆𝑙𝑜𝑡 𝑊𝑖𝑑𝑡ℎ 𝐸𝑟𝑟𝑜𝑟 (𝑚𝑚)= 𝑆𝑝𝑒𝑐𝑖𝑓𝑖𝑒𝑑 𝐶𝐴𝐷 𝑆𝑙𝑜𝑡 𝑊𝑖𝑑𝑡ℎ 𝐷𝑖𝑚𝑒𝑛𝑠𝑖𝑜𝑛 − 𝑀𝑒𝑎𝑠𝑢𝑟𝑒𝑑 𝑆𝑙𝑜𝑡 𝑊𝑖𝑑𝑡ℎ 𝐷𝑖𝑚𝑒𝑛𝑠𝑖𝑜𝑛 (1)
It was observed that the average slot width error was very high for orientations of 0° and 15°. As the slot
orientation angle was increased, it was observed that the average error decreased till about 60°, providing
the lowest error at 60° with a mean of 0.065 mm. As the slot orientation was further increased, it was
observed that the slot width error increased at 75° and 90° but was lower than the error observed between
0° and 15°. It was also observed that though the error was high for lower angles they also had lower
variance, as the orientation was increased, it was observed that the highest variance between measurements
occurred at around 30° after which the variance reduced with increase in orientation reaching a minimum
value at 75°.

16
Figure 9: Interval plot of slot width error for specified slot width of 1mm
An interval plot was created for the data obtained from the 0.5 mm slot width sample using Minitab. The
interval plot (Figure 10) shows the mean and 95% confidence interval of the slot width error at every angle
of print. It was observed that the average slot width error was very high for slot orientations of 0° and 15°.
As the slot orientation was increased, it was observed that the error reduced till about 60°, providing the
lowest error at 60° with a mean of -0.075 mm. As the slot orientation was further increased, it was observed
that the slot width error increased at 75° and 90° but was lower than the error observed between 0° and 15°.
It was also observed that though the error was high for lower angles they also had lower variance, as the
orientation was increased; it was observed that the highest variance between measurements occurred at
around 30° after which the variance reduced with increase in orientation reaching a minimum value at 75°.
9075604530150
0.7
0.6
0.5
0.4
0.3
0.2
0.1
0.0
-0.1
-0.2
Slot Orientation
Slo
t W
idth
Err
or
95% CI for the Mean
Individual standard deviations are used to calculate the intervals.
Interval Plot of Slot Width Error for specified Slot Width of 1mm
(mm
)
m
(°)

17
Figure 10: Interval plot of slot width error for specified slot width of 0.5mm
Conclusions from the Feasibility test
The first objective of the study was to determine the extent to which slot angle had on 3D printed slot width
for two target slot widths of 1.0 mm and 0.5 mm. The results obtained from the feasibility test confirmed
that slot width and variability in slot width does vary as a function of slot orientation. Such discrepancies
are problematic with respect to 3D printing of fully functional moving assemblies, as the mating surfaces
will either fuse together due to low clearance or have excessive clearance which results in a large amount
of “play” between the moving parts.
Design of Experiments
A Design of Experiments (DOE) approach was used to determine the degree to which layer thickness, slot
orientation and specified CAD slot width affect the measured slot width in each 3D printed sample. All
experiments were performed using a MakerBot Replicator 2X 3D printer with ABS plastic (Makerbot Inc.,
Brooklyn, NY). The same machine was used to conduct the 36 runs (9 whole plots), and the 3D printing
process parameters (e.g. temperature, extrusion speed, etc.) were kept constant throughout the experimental
procedure. A new filament reel was used to conduct the DOE, in order to avoid any variation caused by
moisture, for the same reason testing was done in just over two days. The default print parameters of the
9075604530150
0.75
0.50
0.25
0.00
-0.25
-0.50
Slot Orientation
Slo
t W
idth
Err
or
95% CI for the Mean
Individual standard deviations are used to calculate the intervals.
Interval Plot of Slot Width Error for specified Slot Width of 0.5mm
(mm
)
m
(°)

18
MakerBot Replicator 2X were used, while only changing the ‘Layer Height’ for each whole plot. Figure 11
shows the default print settings used.
Figure 11: Print settings for design of experiment
Experimental Set-up
JMP statistical software was used to create a Split Plot Design having 36 runs (9 whole plots). The DOE
was divided into whole plots having two hard to change factors for each whole plot - Slot Width and Layer
Thickness, while the factor of Slot Angle was kept as an easy to change factor. This was done to study the
effect of slot orientation while keeping the slot width and layer thickness constant for a given run. Figure
12 shows an example of the whole plots generated by the JMP software and the whole plots drafted in
SolidWorks.
19
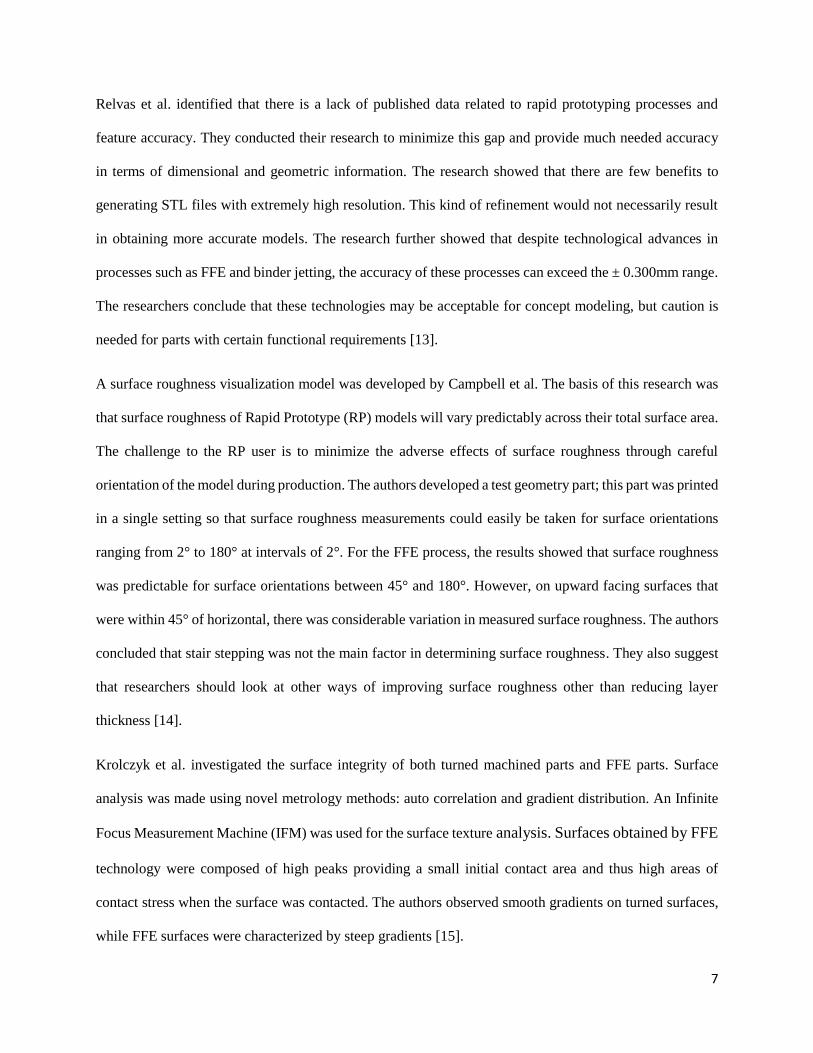
Figure 12: Whole plot design
Factor Levels of Experimental Design
Three factors were considered for each experiment. Figures 13 and 14 illustrate the schematic representation
of the factors considered for the experiments.
Slot Width (mm): This is the specified CAD model dimension for the slot to be printed. A 3D printed slot
between two parallel surfaces is used to simulate the gap between mating surfaces in a 3D printed assembly.
A series of slot widths were considered in order to determine how the printing process affects the clearance
obtained between opposing surfaces when larger gaps were printed compared to when smaller gaps were
printed.
Slot Orientation (): The angle (or orientation) with respect to the build plate at which the slot is printed.
The slot orientation affects the width of the 3D printed slot. A series of angles were therefore studied in the
spectrum of 0 to 90 degrees to quantify the variation caused with the change of slot orientations.
Layer Thickness (mm): Layer thickness is a measure of the height of each successive addition of material
in the additive manufacturing or 3D printing process in which layers are stacked.
Whole Plot 1 Whole Plot 2
Run Order
Slot Angle (°)
Slot Width (mm)
Layer Thickness
(mm) Run Order
Slot Angle (°)
Slot Width (mm)
Layer Thickness
(mm)
1 90 1 0.3 5 30 0.75 0.1
2 0 1 0.3 6 0 0.75 0.1
3 0 1 0.3 7 60 0.75 0.1
4 90 1 0.3 8 90 0.75 0.1

20
Figure 13: Slot width and slot orientation
Figure 14: Layer Thickness
The slot orientation was studied at 4 levels, while the slot width and layer thickness were studied at 3 levels
each. Table 4, shows the factors and levels for the DOE.
Table 4: DOE factors and levels
MAKERBOT REPLICATOR 2X DOE
FACTOR LEVEL
1 2 3 4
Slot Angle (°) 0 30 60 90
Slot Width (mm) 0.5 0.75 1 -
Layer Thickness (mm) 0.1 0.2 0.3 -

21
Evaluation and Measurement
The test pieces were printed on a MakerBot Replicator 2X. The test blocks were 125mm × 45mm × 20mm
and the slots were 35mm in length. The test pieces were then placed under the Hirox 7700 microscope for
image acquisition. The stitching feature of the microscope software was used to merge together multiple
images into an image that contained the entire slot. The slot width was then measured for each sample.
Width measurements were taken at 4 points (at 8.75mm distances starting from the top) along the length of
the slot (Figure 15 and 16). This was done to obtain data across the sample and to measure the variation in
the process in order to help eliminate noise. Experimental results are tabulated in Table 5.
Figure 15: Slot width measurements taken at 4 points of the slot
Figure 16: Enlarged view of measurements taken for DOE

22
Table 5: Design table and data for design of experiment (Refer Appendix)
Run Order
Whole Plot
Slot
Orientation(°)
Slot Width (mm)
Layer Thick. (mm)
Measured Distance (mm) Error (mm) Avg. Error (mm)
1 2 3 4 1 2 3 4
1 1 90 1 0.3 0.869 0.904 0.940 1.011 0.131 0.096 0.060 -0.011 0.069
2 1 0 1 0.3 0.634 0.224 0.000 0.468 0.366 0.776 1.000 0.532 0.669
3 1 0 1 0.3 0.573 0.191 0.000 0.506 0.427 0.809 1.000 0.494 0.683
4 1 90 1 0.3 0.832 0.849 0.867 1.044 0.168 0.151 0.133 -0.044 0.102
5 2 30 0.75 0.1 0.711 0.825 0.759 0.822 0.039 -0.075 -0.009 -0.072 -0.029
6 2 0 0.75 0.1 0.278 0.140 0.000 0.000 0.472 0.610 0.750 0.750 0.646
7 2 60 0.75 0.1 0.767 0.748 0.707 0.798 -0.017 0.002 0.043 -0.048 -0.005
8 2 90 0.75 0.1 0.872 0.908 0.872 0.882 -0.122 -0.158 -0.122 -0.132 -0.134
9 3 90 0.5 0.3 0.384 0.397 0.386 0.402 0.116 0.103 0.114 0.098 0.108
10 3 0 0.5 0.3 0.293 0.000 0.245 0.378 0.207 0.500 0.255 0.122 0.271
11 3 0 0.5 0.3 0.375 0.235 0.000 0.229 0.125 0.265 0.500 0.271 0.290
12 3 90 0.5 0.3 0.423 0.397 0.432 0.400 0.077 0.103 0.068 0.100 0.087
13 4 90 1 0.1 1.073 1.120 1.120 1.130 -0.073 -0.120 -0.120 -0.130 -0.111
14 4 90 1 0.1 1.166 1.145 1.120 1.109 -0.166 -0.145 -0.120 -0.109 -0.135
15 4 0 1 0.1 0.477 0.000 0.000 0.631 0.523 1.000 1.000 0.369 0.723
16 4 60 1 0.1 1.083 1.062 1.136 1.118 -0.083 -0.062 -0.136 -0.118 -0.100
17 5 90 1 0.1 1.130 1.068 1.130 1.130 -0.130 -0.068 -0.130 -0.130 -0.115
18 5 0 1 0.1 0.615 0.114 0.000 0.315 0.385 0.886 1.000 0.685 0.739
19 5 30 1 0.1 0.931 0.984 1.015 0.882 0.069 0.016 -0.015 0.118 0.047
20 5 60 1 0.1 1.061 1.018 1.071 1.088 -0.061 -0.018 -0.071 -0.088 -0.060
21 6 0 1 0.2 0.615 0.159 0.418 0.642 0.385 0.841 0.582 0.358 0.542
22 6 0 1 0.2 0.755 0.112 0.371 0.588 0.245 0.888 0.629 0.412 0.544
23 6 90 1 0.2 0.940 0.952 0.967 0.975 0.060 0.048 0.033 0.025 0.042
24 6 30 1 0.2 0.915 0.900 0.977 0.877 0.085 0.100 0.023 0.123 0.083
25 7 60 0.75 0.3 0.740 0.721 0.767 0.753 0.010 0.029 -0.017 -0.003 0.005
26 7 0 0.75 0.3 0.410 0.240 0.000 0.186 0.340 0.510 0.750 0.564 0.541
27 7 0 0.75 0.3 0.395 0.147 0.000 0.206 0.355 0.603 0.750 0.544 0.563
28 7 90 0.75 0.3 0.619 0.650 0.650 0.762 0.131 0.100 0.100 -0.012 0.080
29 8 0 0.5 0.1 0.120 0.000 0.000 0.000 0.380 0.500 0.500 0.500 0.470
30 8 0 0.5 0.1 0.150 0.000 0.000 0.000 0.350 0.500 0.500 0.500 0.463
31 8 30 0.5 0.1 0.728 0.642 0.578 0.540 -0.228 -0.142 -0.078 -0.040 -0.122
32 8 90 0.5 0.1 0.642 0.652 0.652 0.602 -0.142 -0.152 -0.152 -0.102 -0.137
33 9 0 0.5 0.2 0.100 0.000 0.000 0.000 0.400 0.500 0.500 0.500 0.475
34 9 60 0.5 0.2 0.561 0.521 0.554 0.517 -0.061 -0.021 -0.054 -0.017 -0.038
35 9 90 0.5 0.2 0.485 0.530 0.495 0.511 0.015 -0.030 0.005 -0.011 -0.005
36 9 30 0.5 0.2 0.459 0.455 0.476 0.388 0.041 0.045 0.024 0.112 0.056

23
In Table 5, errors were calculated using Equation 1. A positive error indicated that the printed slot width
was smaller than the specified slot width. A negative error indicated that the 3D printed slot had a
dimension greater than the specified slot width. The average of the four measured values was then
calculated. The average error was the response variable considered for each experiment.
Analysis of Results from the Design of Experiments
JMP statistical software was used to analyze the data obtained from the experiments and to formulate the
analysis of variance (ANOVA). From the ANOVA in Table 6, it is clear that the factors of Slot Angle, Slot
Width and Layer thickness were significant with a p-value less than 0.05. There was no strong correlation
between the higher order interactions of Slot Angle + Slot Width, Slot Angle + Layer Thickness and Slot
Width + Layer Thickness. It was observed the the p-value for Slot Angle was the smallest while the p-
values for Slot Width and Layer Thickness were a little higher but less than 0.05. This meant that the
statistical values were unlikely to be that extreme by happenstance. The conclusion drawn from the
interaction effects was that even though the effects did not meet the significance criteria of being less than
0.05, this could easily be by happenstance. More data would help in providing us with a more in-depth
response.
Table 6: Summary of fit and parameter Estimates
Summary of Fit RSquare 0.589421
RSquare Adj 0.504474
Root Mean Square Error 0.161132
Mean of Response 0.202875
Observations (or Sum Wgts) 36
Parameter Estimates Term Estimate Std Error DFDen t Ratio Prob>|t|
Intercept 0.1941475 0.012221 2.818 15.89 0.0008*
Slot Angle -0.251955 0.032772 28.41 -7.69 <.0001*
Slot Width 0.0658001 0.014236 3.02 4.62 0.0188*
Layer Thickness 0.074034 0.014221 2.982 5.21 0.0140*
Slot Angle*Slot Width -0.033555 0.037021 29 -0.91 0.3722
Slot Angle*Layer Thickness 0.0576798 0.03645 26.73 1.58 0.1253
Slot Width*Layer Thickness 0.018398 0.017494 3.261 1.05 0.3646

24
Figure 17 shows that the variance is constant (homoscedacity). As the spread seems equally distributed
above and below the mean line and has a consistent spread, we can conclude the assumption of equal
variance for errors is met. Also, there is no trend observed in the above graph, hence it can also be concluded
the errors are independent. Figure 18 shows the histogram for the residuals. It can be observed that the data
is a little skewed but follows a normal distribution overall.
Figure 17: Row number vs residuals for error in slot width
Figure 18: Normality plot for error in slot width

25
Figure 19: Interaction plot for error in slot width
From Figure 19 (b), when the slot angle is changed from 0° to 90°, the error reduces at a faster rate for the
0.5 mm wide slot compared to slot width of 1 mm. An increase in slot width with an increase in angle is
therefore not necessarily a better combination.
From Figure 19 (c),when the slot angle is changed from 0° to 90°, the error for a 0.1 mm layer thickness
decreases at a faster rate compared to a layer thickness of 0.3 mm. This means that as the slot angle increases
from 0° to 90°, thinner layers are better. At a slot angle of 60° and a layer thickness value of 0.1 mm, the
error value is closest to zero.
From Figure 19 (f),when the slot width increases from 0.5 mm to 1.0 mm, the error is higher for thicker
layers. This means that with change in slot width from 0.5 mm to 1.0 mm, having a thinner layer produces

26
stable results. However, there is an error at lower levels as well but a combination of lower layer thickness
and thinner slot width has a least error closest to zero.
The surface plots are represented in Figure 20. Figure 20 (a) is the plot of Slot Angle vs Error. It can be
observed that the print error from the nominal is highest for slot angle of 0°. As the slot angle is increased,
it can be observed that the print error reduces and provides a minimum error at a slot angle of 60°. As the
slot angle is further increased, it is observed that we get a negative error. It is important to note here that
our optimal error value is 0, a positive error signifies that for that particular slot angle the slot width printed
is smaller than the specified CAD slot width, while a negative error signifies that the slot width printed is
larger than the specified CAD slot width. This observation falls in line with the observations conducted
from the preliminary experiments.
Figure 20 (b), Slot Width vs Error indicates that as the slot width is increased the amount of error measured
between the printed sample and the specified CAD model also increases, providing the least error at the 0.5
mm slot width.
Figure 20 (c), Layer Thickness vs Error indicates that as the layer thickness is increased from 0.1 mm to
0.3 mm it is observed that the magnitude of error increases, providing the least error for a layer thickness
of 0.1 mm

27
(a) (b)
(c)
Figure 20: (a) Surface plot slot width error w.r.t slot angle (b) Surface plot slot width error w.r.t slot width (c) Surface plot slot width error w.r.t layer thickness
28
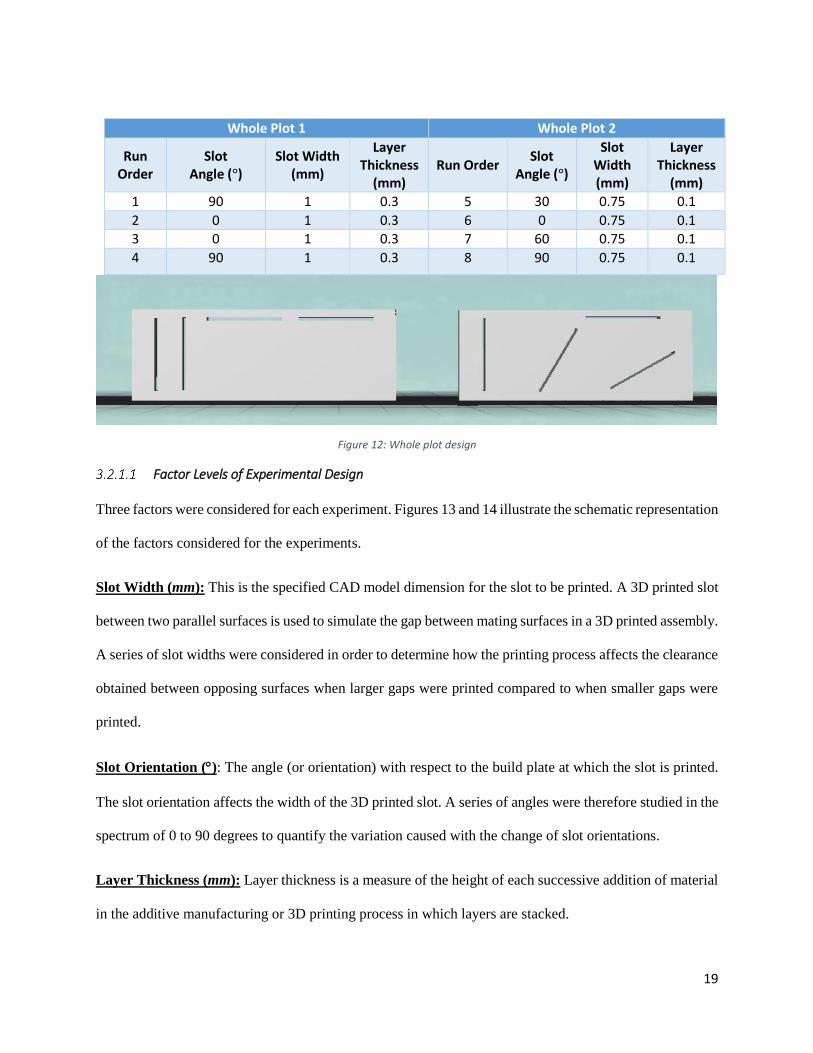
Conclusions from the Design of Experiments
By studying the micrographs, we could observe that as the slot angle was increased from 0 to 90, the
dimension error was caused largely due to poor surface quality of down facing surfaces. The down facing
surface was the one which was being printed against gravity. For a slot angle of 0, as there was no surface
or support structure on which to print, it was observed that the error was very large. It appears that as more
layers were printed, the first layer is pushed further down into the gap of the slot width thus in some cases
fusing the up facing and down facing surfaces together causing the high magnitude of error. As the slot
angle was increased, it was observed that the magnitude of error decreased. This was primarily due to the
fact that the down facing surfaces at higher angles (i.e. 30, 60 and 90) were not completely against the
force of gravity. The amount of overhang also reduced as the slot angle was increased.
Figure 21: Diagrammatic representation of the drooping phenomenon in down facing surfaces
From the DOE analysis, it was concluded that a 60 slot angle, 0.5 mm slot width, and a 0.1 mm layer
thickness provided reasonably good results. For practical applications, the slot orientation can vary
depending on the application of the desired print and end use of the print. The user now has some knowledge
of the process and can use this data to determine the most favorable print parameters required to print an
assembly. This takes the user from relying on judgement or trial and error to using a standardized and
scientific method of designing an assembly for 3D printing.

29
3D Printing a moving assembly
The experiments described in Chapter 3 studied dimensional accuracy of a gap between opposing faces in
a 3D printed assembly as a function of surface orientation, layer thickness and distance between opposing
surfaces. This was done in order to help validate the need for obtaining a deeper understanding of the
process. The preliminary experiments along with the analysis of their results proved that there is a gap in
the process which has not been studied completely. The final aim of this research was to apply insight
gained from prior experimentation in order to 3D print a moving pin-hole assembly. A pin-hole assembly
is one of the most commonly used assemblies in conventional manufacturing due to its simple design and
wide array of applications. For this reason, the next experiment was conducted by 3D printing holes of
various diameters at various angles of orientation.
3D Printed Hole Methodology
Parts with four holes having diameters of 8mm, 10mm, 12mm and 14mm respectively were designed in
SolidWorks. 3D printed examples are seen in Figure 22. In the context of prior experiments, a hole has both
up-facing and down-facing surfaces at every angle ranging from 0 to 90. The aim of this experiment,
therefore, was to determine how much the printed hole dimensions vary from the specified hole dimensions.
Hole diameter plays a key role when assemblies are 3D printed. It was also important to study whether the
magnitude of error changed as a function of hole diameter.
Figure 22: 3D printed holes samples

30
3D Printed Hole Results
For each hole of a given diameter, a sample was 3D printed in which the axis of the hole was oriented at
0, 15, 45, 60, 75, and 90 relative to the X-Y build plane using a MakerBot Replicator 2X. ABS plastic
was used with an extruder temperature of 230 C, layer thickness of 0.2 mm, and 10% infill. The minimum
diameter of each hole was measured using a telescoping hole gauge and a digital caliper. The minimum
hole diameter corresponds to the diameter of the largest pin that may be able to be inserted into the hole in
an assembly. Three measurements were taken for each sample, and the average printed diameter was
calculated (as shown in Tables 8-11). The average error was then calculated for each sample. This was done
by taking the difference between the specified CAD model dimension and the average printed diameter.
Table 7 : Measured hole diameters for a nominal (specified) hole diameter of 8 mm printed at different orientations w.r.t the X-Y build plane along with the calculated relative error
Angle of
Print()
Individual Diameter Measurements (mm)
Average
Dia. (mm)
Standard Deviation
Error (mm) from
specified 8 mm hole
dia.
Relative Error
(mm/mm) 1
2
3
0 7.68 7.57 7.57 7.61 0.06 0.39 0.05
15 7.41 7.25 7.49 7.38 0.12 0.62 0.08
30 7.29 7.43 7.4 7.37 0.07 0.63 0.08
45 7.44 6.28 7.12 6.95 0.60 1.05 0.13
60 7.26 7.35 7.25 7.29 0.06 0.71 0.09
75 7.24 7.23 7.23 7.23 0.01 0.77 0.10
90 7.42 7.47 7.55 7.48 0.07 0.52 0.06

31
Table 8: Measured hole diameters for a nominal (specified) hole diameter of 10 mm printed at different orientations w.r.t the X-Y build plane along with the calculated relative error
Table 9: Measured hole diameters for a nominal (specified) hole diameter of 12 mm printed at different orientations w.r.t the X-Y build plane along with the calculated relative error
Angle of
Print()
Individual Diameter
Measurements (mm)
Average
Dia. (mm)
Standard Deviation
Error (mm) from
specified 10 mm
hole dia.
Relative
Error (mm/mm)
1
2
3
0 9.67 9.58 9.35 9.53 0.17 0.47 0.05
15 9.42 9.49 9.46 9.46 0.04 0.54 0.05
30 9.14 9.06 9.22 9.14 0.08 0.86 0.09
45 8.90 9.13 9.28 9.10 0.19 0.90 0.09
60 8.95 9.21 8.94 9.03 0.15 0.97 0.10
75 9.33 9.40 9.47 9.40 0.07 0.60 0.06
90 9.51 9.58 9.47 9.52 0.06 0.48 0.05
Angle of
Print()
Individual Diameter
Measurements (mm)
Average
Dia. (mm)
Standard Deviation
Error (mm) from
specified 12 mm
hole dia.
Relative
Error (mm/mm)
1
2
3
0 11.47 11.62 11.52 11.54 0.08 0.46 0.04
15 11.16 11.1 11.49 11.25 0.21 0.75 0.06
30 11.27 11.28 11.30 11.28 0.02 0.72 0.06
45 11.39 11.53 11.38 11.43 0.08 0.57 0.05
60 11.46 11.54 11.50 11.50 0.04 0.50 0.04
75 11.62 11.83 11.48 11.64 0.18 0.36 0.03
90 11.72 11.6 11.51 11.61 0.11 0.39 0.03

32
Table 10: Measured hole diameters for a nominal (specified) hole diameter of 14 mm printed at different orientations w.r.t the X-Y build plane along with the calculated relative error
The relative error in Tables 7-10 was calculated using the equaition:-
𝑅𝑒𝑙𝑎𝑡𝑖𝑣𝑒 𝐸𝑟𝑟𝑜𝑟 =𝑀𝑒𝑎𝑠𝑢𝑟𝑒𝑑 𝐸𝑟𝑟𝑜𝑟
𝑆𝑝𝑒𝑐𝑖𝑓𝑖𝑒𝑑 𝐶𝐴𝐷 𝑚𝑜𝑑𝑒𝑙 𝑑𝑖𝑚𝑒𝑛𝑠𝑖𝑜𝑛 (2)
The relative error was calculated to determine if there was a correlation between the error and the diameter
of the printed hole. Figure 23 shows the relative error and the angle of orientation was plotted. Careful study
of the graph suggests that although the hole orientation appears to have little effect on relative error, the
smaller hole diameters appeared to have somewhat larger relative error than the larger holes.
Angle
of Print()
Individual Diameter Measurements (mm)
Average Dia. (mm)
Standard Deviation
Error (mm)
from specified 14
mm hole dia.
Relative Error (mm/mm)
1
2
3
0 13.49 13.49 13.50 13.49 0.01 0.51 0.04
15 13.35 13.25 13.41 13.34 0.08 0.66 0.05
30 13.31 13.27 13.20 13.26 0.06 0.74 0.05
45 13.20 13.08 13.19 13.16 0.07 0.84 0.06
60 12.82 13.10 13.13 13.02 0.17 0.98 0.07
75 12.84 13.17 13.15 13.05 0.19 0.95 0.07
90 13.45 13.34 13.42 13.40 0.06 0.60 0.04

33
Figure 23: Relative error measured for 3D printed hole
3D Printed Hole Conclusions
The 3D printed hole experiments showed that the variability between the specified dimension and the
printed dimension was very high. The process was looked into more closely, and it was observed that 3D
printed holes all have concave down-facing sections which are printed against gravity. When these down-
facing sections are printed, the unsupported extruded plastic has a tendency to sag from its original shape.
As more layers are deposited on this unsupported concave contour, the cylindrical surface deforms to a
shape that resembles an ellipse. It was concluded that due to the sagging phenomenon and the inherent
variability in the process, it would be difficult to get standard results on a consistent basis. An alternative
approach to 3D printing of pin-hole assemblies was therefore sought.
3D Printed Polygonal Hole-Pin Features
Results from the 3D printed hole tests revealed challenges pertaining to sagging of the down-facing region
of each hole. As an alternative, the use of polygonal, rather than a cylindrical, holes was studied. Using
polygonal holes is an intriguing concept, as it allows one to inscribe a cylindrical hole inside the polygonal
hole. Figure 24 shows three variations of assemblies that can be 3D printed, the three figures have the exact
pin diameter and the same minimum CAD clearance between the pin and hole. Figure 24 (a) shows the
0
0.02
0.04
0.06
0.08
0.1
0.12
0.14
0 15 30 45 60 75 90
Prp
oti
on
al E
rro
r(Er
ror/
Dia
. of
Ho
le)
Print Orientation
8mm
10mm
12mm
14mm

34
conventional approach of printing a simple pin-hole assembly, where the pin and the hole are cylindrical in
shape. When the model is sliced in the unconventional approach, the software generates the slices as line
segments in a plan and thus does not require to generate line segments as circular interpolations as is the
case with the conventional approach. Therefore when the conventional pin-hole assembly is 3D printed, the
down facing concave sections are printed under gravity and have the tendency to sag from their original
shape and hence are likelier to fuse with the mating surface. Due to the above reasons, it was sought to
apply an unconventional approach to overcome the drawbacks of the conventional pin-hole assembly. The
unconventional approach consisted of using a cylindrical pin-hexagonal hole assembly. There are several
ways the assembly could have been printed, shown in Figures 24 (b) and 23 (c). The primary difference
between Figures (b) and (c) is that hexagonal hole in Figure (b) would be printed at a 30 angle to the build
plate whereas in Figure (c), it would be printed parallel or horizontal to the build plate. It was decided to
use the Figure (b) approach, wherein the hexagonal hole will be printed at a 30 angle to the build plate. As
it was seen from earlier experiments, a horizontal or parallel contour will be unsupported and though it
follows a linear contour it will tend to sag thus having a higher chance of fusing with its mating surface.
Secondly, where the filament would be pulled into the hole-pin clearance area in the pin-hole assembly
causing the mating surfaces to fuse is where in the pin-hexagon assembly we get the maximum clearance,
which is in the corners. Therefore even though both the assemblies (i.e. the pin-hole and hexagonal pin-
hole) have the same specified CAD clearance, the hexagonal pin-hole assembly provides with the additional
clearance in the corners. Thus having a less likely chance of the mating surfaces fusing.

35
Figure 24: (a) Conventional approach for a pin-hole assembly; (b) Unconventional approach for a pin-hole assembly where
hexagonal hole is at a 30 to the build plate; (c) Unconventional approach for a pin-hole assembly where hexagonal hole is at a parallel to the build plate
In order to experimentally test whether or not a hexagonal hole-pin feature is more effective than a
cylindrical hole-pin feature, another set of experiments were conducted. Specifically, sets of 3D printed
hexagonal hole-pin assemblies were 3D printed at different pin axis orientations and pin-hole clearances.
As a baseline for comparison, a set of conventional hole-pin assemblies were produced in the same print as
the hexagonal hole-pin assemblies.
The assemblies were 3D printed in ABS plastic on a MakerBot Replicator 2X with a nozzle temperature of
230C , a build plate temperature of 110C, and a layer thickness of 0.2mm. The samples were printed at
different orientations such that the axis of the pins were at angles of 0, 30, 60 and 90 with respect to the
build plate. All process parameters were kept constant for all the prints. Due to the build orientation,
automatically generated support structures were inserted by the slicing software to hold the pin in place
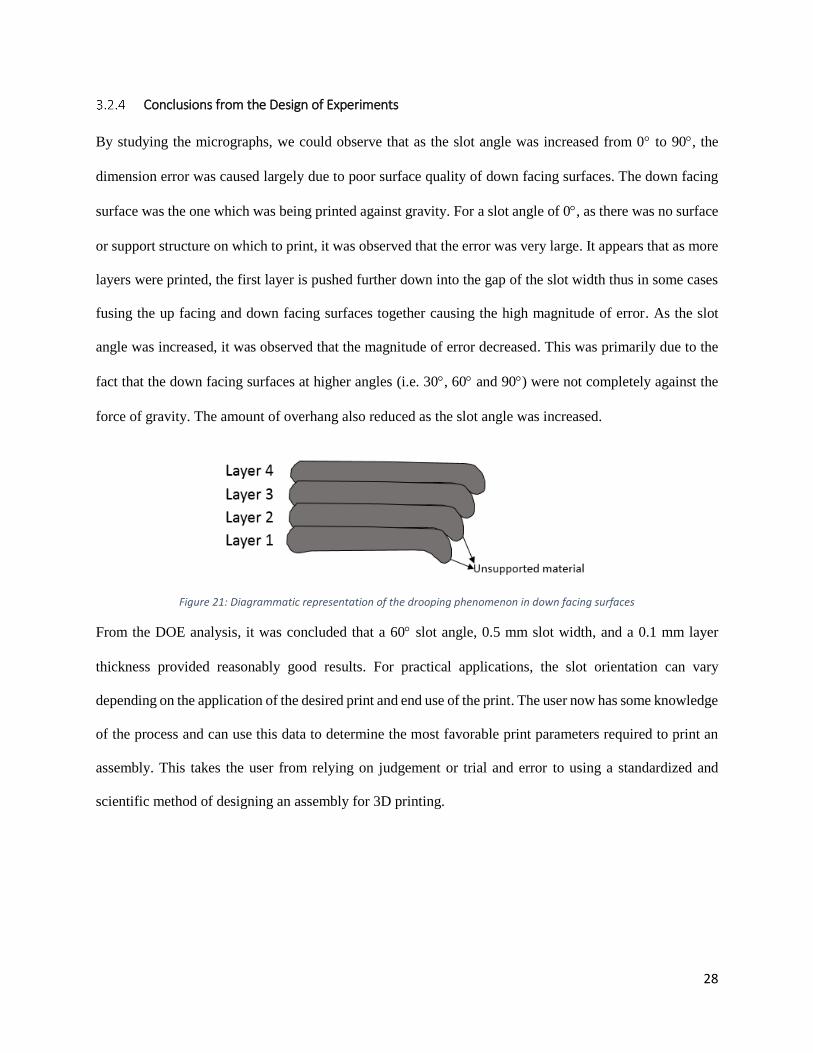
during the print. A preview of the build platform showing the assemblies in four different orientations plus
the support structure is seen in Figure 25.
36
Figure 25: Print preview in of the build platform showing assemblies in four different orientations along with support structures
Once the samples were printed, the support structure was removed by applying slight twisting pressure to
the cylindrical pin in the hexagonal hole-pin assembly. The cylindrical pin was separated from the
hexagonal hole, and rotary motion of the pin in the hexagonal hole was thus obtained.

37
Figure 26: Moving cylindrical pin-hexagon hole assembly
Figure 26 demonstrates the moving assembly. Figure 26(a) shows the pin-hole assembly after components
have been completely separated from each other. Figure 26(b) shows the pin-hexagon assembly at 0,
Figure 26(c) shows the assembly once it is rotated 90 and finally Figure 26(d) shows the assembly at a
position at 180 once it is rotated again. Thus sucessfully demonstrating a 3D printed moving assembly.

38
When the same method was applied to the cylindrical hole-pin assembly, it was observed that the pin had
fused with the hole, thus making a moving assembly infeasible. Figure 27 shows a cylindrical hole-pin
assembly which has fused.
Figure 27: Fused cylindrical pin- cylindrical hole assembly
Tables 11 and 12 show results obtained from the validation experiments. A value of 1 indicates that a
moving 3D printed assembly was successfully produced, and a value of 0 indicates that the assembly fused
together and the print was unsuccessful.
Table 11 shows that 11 out of 12 hexagonal hole-pin assemblies i.e. 91% of test samples were successfully
printed. The print at 13.6mm at 30 was unsuccessful. When these results were compared to 3D printed
cylindrical hole-pin assemblies (Table 12), it was found that only 3 out of 12 cylindrical hole-pin assemblies
i.e. only 25% of test samples were successfully produced. These three prints had the maximum hole-pin
clearance of 0.5 mm, while the prints having a clearance of 0.25 mm and 0.2 mm failed completely. From
this, it can be concluded that this new approach to producing hole-pin assemblies using hexagonal holes
rather than cylindrical holes yields better results.

39
Table 11: Dimensions used to print the hexagonal hole-cylindrical pin validation assembly
Table 12: Dimensions used to print the cylindrical hole-cylindrical pin validation assembly
Pin Dia. (mm)
Hole Dia. (mm)
Hole/Pin Clearance
(mm)
Pin Axis Orientation (degrees)
0 30 60 90
14.00 13.00 0.50 0 1 1 1
14.00 13.50 0.25 0 0 0 0
14.00 13.60 0.20 0 0 0 0
Pin Dia. (mm)
Hexagon Inscribed
Circle Dia.
(mm)
Min. Hex/Pin
Clearance (mm)
Pin Axis Orientation (degrees)
0 30 60 90
14.00 13.00 0.50 1 1 1 1
14.00 13.50 0.25 1 1 1 1
14.00 13.60 0.20 1 0 1 1

40
Conclusions and Recommendations for Future Research
Summary
The primary focus of this work was to gain a better understanding of parameters leading to success or
failure of 3D printed assemblies produced using the FFE process. The success or failure of a printed
assembly is largely determined by the amount of clearance between mating surfaces, as well as process
parameters such as surface orientation and layer thickness. When the 3D printed gap between mating
surfaces is substantially smaller than the CAD model clearance, it results in a failed attempt to 3D print a
moving assembly. From the experiments performed, it was concluded that the three factors, slot orientation,
slot width and layer thickness had a significant effect on printed clearance along with the interaction effects
between. From the design of experiments, it was observed that as the slot orientation was increased from
0 to 90 the magnitude of error between the printed sample and specified CAD model reduced and reach
a minimum error value closest to 0 at the 60 slot angle. Careful study of the micrographs and data showed
that at a 0 slot angle, the downward facing surface of the slot width is unsupported and under the infulence
of gravity, this causes the layers to sag causing the two mating surfaces to fuse. It was also observed that
the least error was obatined for a slot width of 0.5 mm and a layer thickness of 0.1 mm. Hence it was
concluded that a slot angle of 60, a slot width of 0.5 mm and a layer thickness of 0.1 mm result in the least
error.
In addition to developing a better understanding of process parameters that affect printed clearances
between mating parts, another aim of this work was to successfully print a hole-pin moving assembly.
Cylindrical hole samples were printed, and it was observed that the unsupported down-facing portion of
each hole loses its shape and produces a slightly elliptical out-of-round shape. This observation led to a
new unconventional method of 3D printing moving hole-pin assembly features.
It was decided to use a polygonal hole-pin assembly feature rather than a cylindrical hole-pin assembly
feature. The polygonal hole geometry overcame the drawbacks of the pin-hole assembly which were:

41
1) The horizontal down-facing “ceiling” of holes slumps against gravity as the material is extruded.
2) Infinite points of contact between a cylindrical hole and pin increases the chances of the two
surfaces fusing together.
The printed samples corroborated the assumptions of the advantage of the hexagonal hole-pin assembly
over the cylindrical hole-pin assembly. Based on the results of the validation experiment, it is suggested
that users should use the hexagonal hole-pin assembly approach over the cylindrical hole-pin assembly
approach for 3D printing applications for consistent results.
Recommendations for Future Work
In this research, a DOE was performed using the Fused Filament Extrusion (FFE) approach on a MakerBot
Replicator 2X 3D printer. However, the FDM/FFE process is fundamentally different from other 3D
printing processes such as stereolithography, selective laser sintering, etc. It would be worthwhile to extend
the study to other 3D printing processes on which printed assemblies are of interest.
The novel portion of this research using polygonal holes was experimentally validated using hexagonal
hole-pin assembly. It would be interesting to further the research and determine the optimal number of sides
or side length of a polygon to 3D print assemblies. The number of polygon sides affects the number of
contact points between the pin and hole, and it also affects the orientation of down-facing printed surfaces.
It is also suggested that a study be done by using an equilateral triangle inscribed in a circle instead of a
hexagon. Once consistent results are established, future work should also include developing an
optimization algorithm which takes into account the printing error and compensates for the printing error
in the CAD file.
It would be interesting to study how the printer position resolution affects the dimensions of the printed slot
width. As the MakerBot Replicator 2X uses a belt and pulley mechanism, it will be interesting to either use
pulleys of smaller diameter to improve print resolution or designing the part such that the slot width is a

42
multiple of the printer position resolution. The printer position resolution can be calculated by using the
equation:-
𝑃𝑟𝑖𝑛𝑡𝑒𝑟 𝑝𝑜𝑠𝑖𝑡𝑖𝑜𝑛 𝑟𝑒𝑠𝑜𝑙𝑢𝑡𝑖𝑜𝑛 (𝑚𝑚
𝑠𝑡𝑒𝑝) =
𝜋𝐷
𝑛𝑢𝑚𝑏𝑒𝑟 𝑜𝑓 𝑠𝑡𝑒𝑝𝑠 𝑝𝑒𝑟 𝑟𝑒𝑣𝑜𝑙𝑢𝑡𝑖𝑜𝑛 (3)
Therefore, for example if the pulley diameter is (D) 12. 7 mm and the number of steps per revolution is
200, the printer position resolution will be 0.199 mm/step. This phenomenon may be a significant source
of error.

43
References [1] G. N. Levy, R. Schindel, and J.-P. Kruth, "Rapid manufacturing and rapid tooling with layer
manufacturing (LM) technologies, state of the art and future perspectives," CIRP Annals-
Manufacturing Technology, vol. 52, pp. 589-609, 2003.
[2] S. Rajagopalan and M. R. Cutkosky, "Tolerance representation for mechanism assemblies in
layered manufacturing," in Proceedings of the 1998 ASME DETC/DFM Conference, 1998, pp. 13-
16.
[3] E. Palermo, "Fused Deposition Modeling: Most Common 3D Printing Method," 2015.
Available:http://www.livescience.com/39810-fused-deposition-modeling.html
[4] (2015, Fused Deposition Modeling (FDM); http://www.custompartnet.com/wu/fused-deposition-
modeling. Available: http://www.custompartnet.com/wu/fused-deposition-modeling
[5] M. Eragubi. (2015, Slicing 3D CAD Model in STL Format and Laser Path Generation," International
Journal of Innovation, Management and Technology vol. 4, no. 4, pp. 410-413, 2013. Available:
http://www.ijimt.org/papers/431-M1007.pdf
[6] M. Armbruster, "3D Printing: Understanding Support Material," 2015. Available:
http://www.pddnet.com/blog/2012/07/3d-printing-understanding-support-material
[7] S. S. Crump, J. W. Comb, W. R. Priedeman Jr, and R. L. Zinniel, "Process of support removal for
fused deposition modeling," ed: Google Patents, 1996.
[8] R. Arni and S. Gupta, "Manufacturability analysis of flatness tolerances in solid freeform
fabrication," TRANSACTIONS-AMERICAN SOCIETY OF MECHANICAL ENGINEERS JOURNAL OF
MECHANICAL DESIGN, vol. 123, pp. 148-156, 2001.
[9] R. Paul and S. Anand, "Optimal part orientation in Rapid Manufacturing process for achieving
geometric tolerances," Journal of Manufacturing Systems, vol. 30, pp. 214-222, 2011.

44
[10] R. Ippolito, L. Iuliano, and A. Gatto, "Benchmarking of rapid prototyping techniques in terms of
dimensional accuracy and surface finish," 1995.
[11] L. Galantucci, F. Lavecchia, and G. Percoco, "Experimental study aiming to enhance the surface
finish of fused deposition modeled parts," CIRP Annals-Manufacturing Technology, vol. 58, pp.
189-192, 2009.
[12] R. Paul and S. Anand, "Optimization of layered manufacturing process for reducing form errors
with minimal support structures," Journal of Manufacturing Systems, 2014.
[13] C. Relvas, A. Ramos, A. Completo, and J. A. Simões, "A systematic approach for an accuracy level
using rapid prototyping technologies," Proceedings of the Institution of Mechanical Engineers,
Part B: Journal of Engineering Manufacture, vol. 226, pp. 2023-2034, 2012.
[14] R. I. Campbell, M. Martorelli, and H. S. Lee, "Surface roughness visualisation for rapid prototyping
models," Computer-Aided Design, vol. 34, pp. 717-725, 2002.
[15] G. Krolczyk, P. Raos, and S. Legutko, "Experimental analysis of surface roughness and surface
texture of machined and fused deposition modelled parts," Tehnički Vjesnik-Technical Gazette,
vol. 21, pp. 217-221, 2014.
[16] D. Dimitrov, K. Schreve, and N. De Beer, "Advances in three dimensional printing-state of the art
and future perspectives," Journal for New Generation Sciences, vol. 4, pp. p. 21-49, 2006.
[17] J. Kietzman, "Rapid prototyping polymer parts via shape deposition manufacturing," Stanford
University, 1999.
[18] I. Fidan, "Bench marking studies for 3D printing process," 1st Annual Manufacturing Technology
Summit, p. 2, 2004.
[19] B. Vayre, F. Vignat, and F. Villeneuve, "Designing for additive manufacturing," Procedia CIRP, vol.
3, pp. 632-637, 2012.

45
Appendix: Micrographs for Design of Experiments
Run order 1: Slot Angle of 0
Run order 2: Slot Angle of 0

46
Run order 3: Slot Angle of 90 Run order 4: Slot Angle of 90
Figure 28: Whole Plot 1
Run order 5: Slot Angle of 0

47
Run order 6: Slot Angle of 30 Run order 7: Slot Angle of 60
Run order 8: Slot Angle of 60
Figure 29: Whole Plot 2
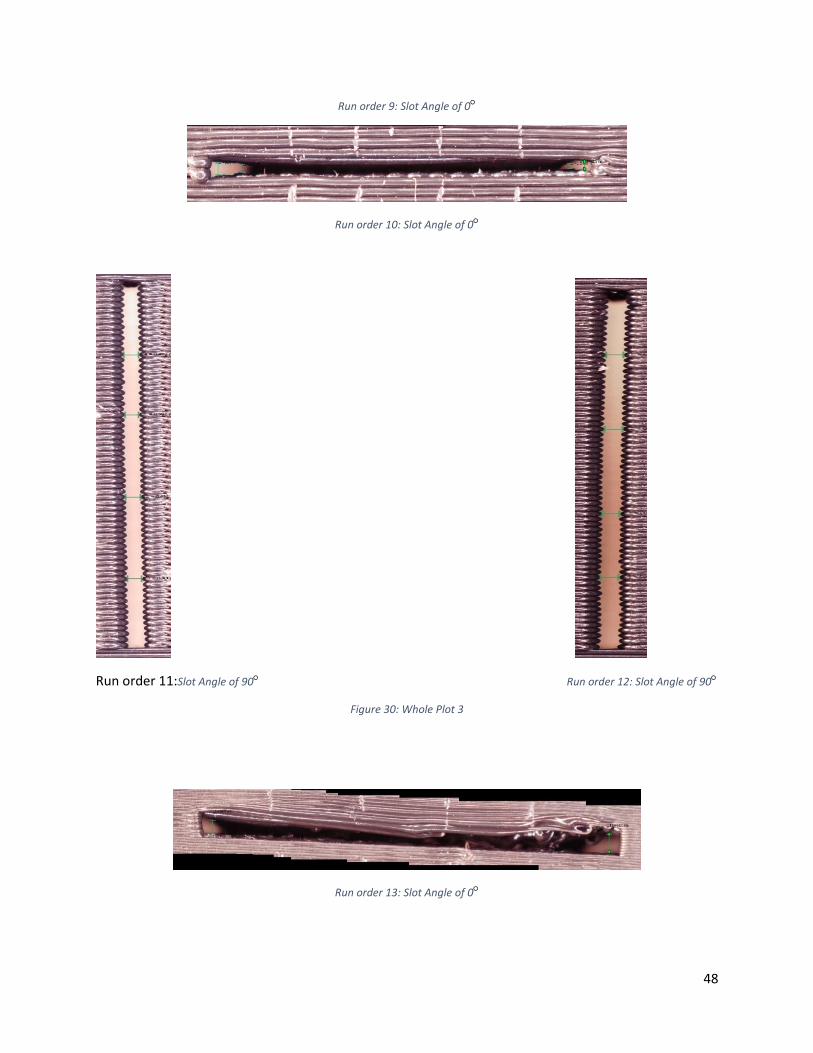
48
Run order 9: Slot Angle of 0
Run order 10: Slot Angle of 0
Run order 11:Slot Angle of 90 Run order 12: Slot Angle of 90
Figure 30: Whole Plot 3
Run order 13: Slot Angle of 0

49
Run order 14: Slot Angle of 60
Run order 15: Slot Angle of 90 Run order 16: Slot Angle of 90
Figure 31: Whole Plot 4
Run order 17: Slot Angle of 0
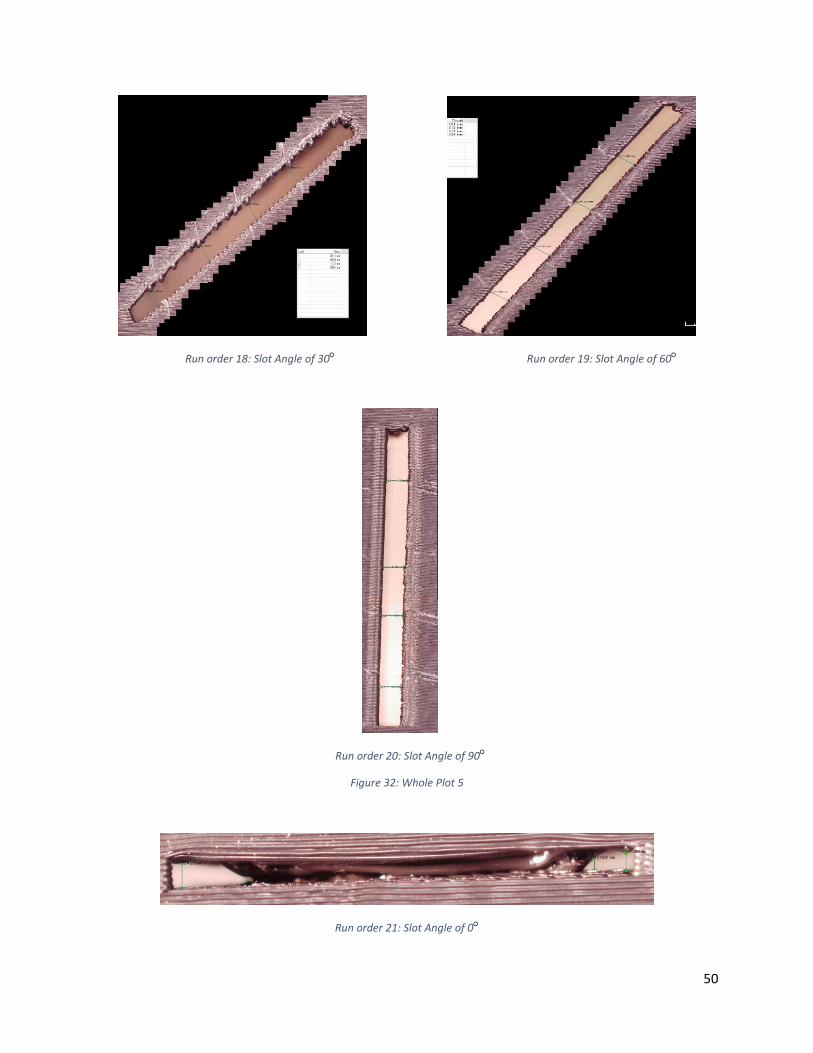
50
Run order 18: Slot Angle of 30 Run order 19: Slot Angle of 60
Run order 20: Slot Angle of 90
Figure 32: Whole Plot 5
Run order 21: Slot Angle of 0

51
Run order 22: Slot Angle of 0
Run order 23: Slot Angle of 30
Run order 24: Slot Angle of 30
Figure 33: Whole Plot 6

52
Run order 25: Slot Angle of 0
Run order 26: Slot Angle of 0
Run order 27: Slot Angle of 60
Run order 28: Slot Angle of 30
Figure 34: Whole Plot 7
Run order 29: Slot Angle of 0

53
Run order 30: Slot Angle of 0
Run order 31: Slot Angle of 30
Run order 32: Slot Angle of 90
Figure 35: Whole Plot 8
Run order 33: Slot Angle of 0

54
Run order 34: Slot Angle of 30 Run order 35: Slot Angle of 60
Run order 36: Slot Angle of 90
Figure 36: Whole Plot 9