
Clear Roads Project 18-03 Evaluation of SSI and WSI ...
144
Appendices Clear Roads Project 18-03 Evaluation of SSI and WSI Variables Final Report December 2020 Leigh Sturges of the Narwhal Group Laura Fay, Karalyn Clouser, and Natalie Villwock-Witte of the Western Transportation Institute
Transcript of Clear Roads Project 18-03 Evaluation of SSI and WSI ...

Appendices
Clear Roads Project 18-03 Evaluation of SSI and WSI Variables
Final Report
December 2020
Leigh Sturges of the Narwhal Group
Laura Fay, Karalyn Clouser, and Natalie Villwock-Witte of the Western
Transportation Institute

129
Table of Contents Appendix A. Task 1 Literature Review ....................................................................................................... 133 Appendix B. Task 2 Survey Questionnaire ................................................................................................. 155 Appendix C. Task 2 Survey Results ............................................................................................................ 159 Appendix D. Task 3 Agencies and Follow-up Questions ............................................................................ 175 Appendix E. Task 4 Summary Report ......................................................................................................... 178 Appendix F. Maryland Method .................................................................................................................. 265 Appendix G. Iowa Method Modifications.................................................................................................. 266 Appendix H. Matthews Method Weather Triggers ................................................................................... 267 Appendix I. Utah Method Derivation ........................................................................................................ 268

130
List of Figures Figure 35: Variables and WSI categories and values developed for Nebraska DOT. ................................ 163 Figure 36: Meteorological station where IVH is calculated. Red circles show data gaps. ........................ 170 Figure 37: Average IVH over the decade 2000-2010 across France. ......................................................... 171 Figure 38: Interface showing January 2019 snowfall contours over Finland compared to the average. This
particular analysis shows that southeast Finland received greater snowfall during that month versus the
climatological average. .............................................................................................................................. 172 Figure 39: Interface showing the exceptional snowfall calendar product for February 2019 in Etelä-
Pohjanmaa province. ................................................................................................................................. 172 Figure 40: Interface showing the same data from Figure 39 (exceptional snowfall, shown in pink), but in
a map view and on a single day. ................................................................................................................ 173 Figure 41: Cumulative WSI over each winter season since 2008/2009. The y-axis shows the unitless WSI
value, and the x-axis is dates over the winter season. Source: Iowa DOT. ............................................... 197 Figure 42: WSI comparison of salt use at the District and Statewide level. .............................................. 205 Figure 43: Summary of variables and associated points in the AWSSI method. ....................................... 215 Figure 44: The AWSSI map from the 2018/2019 winter season showing the final severity values
computed over that time for the continental US and Alaska (inset). The visual also shows the location of
the sites at which the AWSSI is calculated. Source: Midwestern Regional Climate Center (MRCC),
https://mrcc.illinois.edu/research/awssi/indexAwssi.jsp#info ................................................................. 217 Figure 45: A breakdown of variables and categories developed for Nebraska DOT................................. 220 Figure 46: showing data from the existing 11 AWSSI sites that are usable by NYSDOT for their WSI
calculation. ................................................................................................................................................. 226 Figure 47: Map of NY showing mesonet sites. .......................................................................................... 226 Figure 48: Map of NY topography and mesonet sites as an example map that can be made using the
mesonet network/data. ............................................................................................................................. 227 Figure 49: Map of NY mesonet sites. The red dots represent sites that measure the average surface
temperature of the ground (not necessarily pavement) nearby the sites. ............................................... 228 Figure 50: Mesonet data showing forecasted weather risk assessment that is updated hourly based on
actual data. ................................................................................................................................................ 229 Figure 51: Mesonet public website to access real-time data. ................................................................... 231 Figure 52: Crew reporting system used by Oregon DOT. .......................................................................... 236 Figure 53: Worker field report used by Oregon DOT. ............................................................................... 236 Figure 54: Summary of variables and points used by Pennsylvania DOT.................................................. 240 Figure 55: WSI rating assigned to counties in Pennsylvania. .................................................................... 241 Figure 56: Utah index defined by weather events and precipitation type and amount. .......................... 245 Figure 57: (top left) RCV, (top right) SRV, (bottom) RTV developed by Utah DOT. .................................. 247 Figure 58: BSV developed by Utah DOT. ................................................................................................... 248 Figure 59: Flowchart showing the approach used by Matthews et al. (2017a). ....................................... 257 Figure 60: Weather triggers defined by Matthews et al. (2017a,b). ......................................................... 267 Figure 61: Relationship between RCV and grip in Utah method (Oppermann and Williams, 2018). ....... 269 Figure 62: Relationship between SRV and snowfall rate in Utah method (Oppermann and Williams,
2018). ......................................................................................................................................................... 269 Figure 63: Relationship between RTV and road temperature in Utah method (Oppermann and Williams,
2018). ......................................................................................................................................................... 270

131
Figure 64: Relationship between BSV, wet-bulb temperature, and wind gust in Utah method
(Oppermann and Williams, 2018).............................................................................................................. 270
132
List of Tables Table 7: Summary of Reviewed Literature and Relevant Findings. ........................................................... 133 Table 8: Data Used by Strong et al. (2005) ................................................................................................ 153 Table 9: Variables used in Maze el al. (2009) ............................................................................................ 154 Table 10: Response Summaries from Agencies Using a WSI .................................................................... 161 Table 11: Severity Classes in France .......................................................................................................... 170 Table 12: Agencies Contacted in Task 3 .................................................................................................... 175 Table 13: Data and Data Source Information for Each Method Investigated during Tasks 3 and 4 ......... 178 Table 14: Variables used by Indiana DOT and the data sources. .............................................................. 191 Table 15: Data sources and QA used by each............................................................................................ 193 Table 16: Variables used in the SHRP index. ............................................................................................. 201 Table 17: RWIS and NWS weather sources used by Maze et al. (2009).................................................... 208

133
Appendix A. Task 1 Literature Review
Each publication is summarized in Table 7, organized first by year, and then alphabetically. A superscript
numeral after a reference indicates that more details on the data and methods used are described
below the table. An asterisk (*) following a reference indicates the publication was added during Task 2,
and a double-asterisk (**) indicates it was added during later tasks.
Table 1: Summary of Reviewed Literature and Relevant Findings.
Author (Year) Title
Web Link Findings
Boselly et al. (1993) Road Weather Information Systems Volume 1: Research Report http://onlinepubs.trb.org/onlinepubs/shrp/shrp-h-350.pdf
The SHRP goal was to create a broadly applicable index with “only a few general common parameters.” It is an index which was intended to be calculated over an entire season.
The variables used in the SHRP index were:
Temperature Index (TI)
TI = 0 if the minimum air temperature is above 32°F; TI = 1 if the maximum temperature is above freezing while the minimum temperature is below 32°F; and TI = 2 if the maximum temperature is at or below 32°F. The average daily value is used.
Snowfall (S) Mean daily values in millimeters (the number of days with snowfall was also considered but did not improve the index).
Number of Air Frosts (N)
Mean daily values of number of days with minimum air temperature at or below32°F (0 ≤ N ≤ 1).
Temperature Range (R)
The value of mean monthly maximum air temperature minus mean monthly minimum temperature in °C.
The equation for the index is:
where a = -25.58, b = -35.68, c = -99.5, and d = 50.0. These terms account for temperature, snowfall, and frost, respectively, and d is a corrective term. The coefficients were derived by assigning values to TI (1.87), S (16.5) and N (1), which were deemed “critically significant” thresholds for maintenance cost.
Carmichael et al. (2004) A Winter Weather Index for Estimating Winter Roadway Maintenance Costs in the Midwest https://journals.ametsoc.org/doi/abs/10.1175/JAM2167.1
Carmichael et al. made use of an artificial neural network (ANN) to create a winter weather index. They suggested that this was superior to a linear regression technique, citing the ANNs ability to learn by induction. For example, in the project the ANN was able to “reconstruct” snowfall information that had been unavailable. A drawback, however, is that since ANNs have no prior knowledge, they require vastly large datasets. For this project, the National Climatic Data Center (NCDC) and Iowa Climate Summary (IA Climo) data sets were utilized. They noted a challenge to create a good correlation between winter severity and road treatment costs was the fact that urban maintenance garages have more lane miles to maintain than rural ones. The authors compared the results of the ANN to Strategic Highway Research Program (SHRP) index and
134
concluded that the ANN was superior. Not only did it have better correlations with operational variables, it was better able to correctly predict “small-scale spatial variations.” When considering which operational variables ANN could predict, it was found that ANN was better able to predict winter index in terms of hours of labor, as compared with the cost of labor.
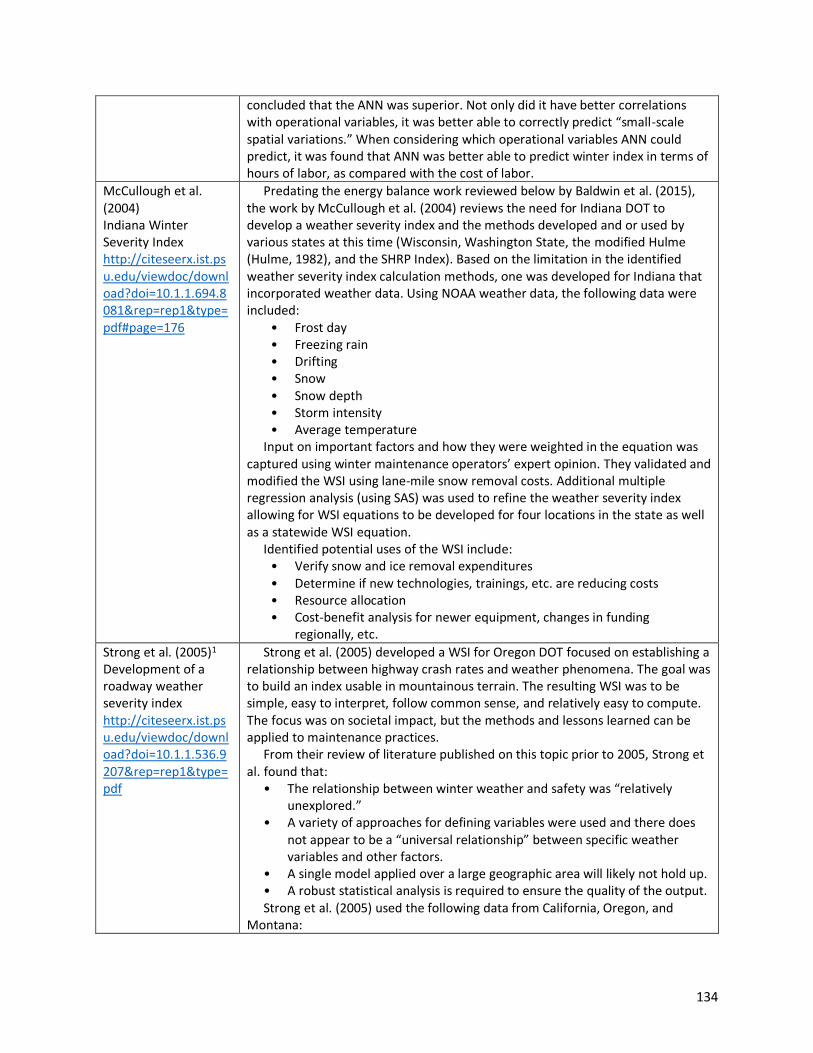
McCullough et al. (2004) Indiana Winter Severity Index http://citeseerx.ist.psu.edu/viewdoc/download?doi=10.1.1.694.8081&rep=rep1&type=pdf#page=176
Predating the energy balance work reviewed below by Baldwin et al. (2015), the work by McCullough et al. (2004) reviews the need for Indiana DOT to develop a weather severity index and the methods developed and or used by various states at this time (Wisconsin, Washington State, the modified Hulme (Hulme, 1982), and the SHRP Index). Based on the limitation in the identified weather severity index calculation methods, one was developed for Indiana that incorporated weather data. Using NOAA weather data, the following data were included:
• Frost day • Freezing rain • Drifting • Snow • Snow depth • Storm intensity • Average temperature
Input on important factors and how they were weighted in the equation was captured using winter maintenance operators’ expert opinion. They validated and modified the WSI using lane-mile snow removal costs. Additional multiple regression analysis (using SAS) was used to refine the weather severity index allowing for WSI equations to be developed for four locations in the state as well as a statewide WSI equation.
Identified potential uses of the WSI include: • Verify snow and ice removal expenditures • Determine if new technologies, trainings, etc. are reducing costs • Resource allocation • Cost-benefit analysis for newer equipment, changes in funding
regionally, etc.
Strong et al. (2005)1 Development of a roadway weather severity index http://citeseerx.ist.psu.edu/viewdoc/download?doi=10.1.1.536.9207&rep=rep1&type=pdf
Strong et al. (2005) developed a WSI for Oregon DOT focused on establishing a relationship between highway crash rates and weather phenomena. The goal was to build an index usable in mountainous terrain. The resulting WSI was to be simple, easy to interpret, follow common sense, and relatively easy to compute. The focus was on societal impact, but the methods and lessons learned can be applied to maintenance practices.
From their review of literature published on this topic prior to 2005, Strong et al. found that:
• The relationship between winter weather and safety was “relatively unexplored.”
• A variety of approaches for defining variables were used and there does not appear to be a “universal relationship” between specific weather variables and other factors.
• A single model applied over a large geographic area will likely not hold up. • A robust statistical analysis is required to ensure the quality of the output. Strong et al. (2005) used the following data from California, Oregon, and
Montana:

135
• Weather data from agency road weather information system (RWIS) or NWS stations
• Crash counts • Annual average daily traffic (AADT) counts • Monthly adjusted factors (MAF) to average daily traffic (ADT) counts
A full list of data and equations used for each state is available below under Strong et al. (2005).
Assumptions made in the data processing were that weather data can only be extrapolated out 5 miles from each RWIS location, and crash data can only be used if it occurred within the 5-mile radius of the RWIS site. Locations with very high and very low traffic counts were removed because crashes in these locations can distort the crash rate (AADT>60,000 vehicles per day and AADT<800 vehicles per day). New variables were calculated to create a consistent data set with the data collected by the state. Weather station locations were classified by climactic zone: (1) mountains, (2) valleys, (3) plains. Sites with high crash rates related to road condition and geometry were removed.
In processing the data, a normal distribution was used to model the crash data, and monthly average crash rates were used as crashes per month per 1,000 daily vehicles on the road to account for AADT. The cube root transformation of the response was adopted in the analysis of the data. Missing data presented a problem.
For each statewide data set, the models were tailored and run separately each month for each zone (1,2,3) and statewide, and found that crash rates are more attributed to weather in Oregon and Montana than in California. It is also important to note that for California NWS data was used, whereas RWIS was used for Oregon and Montana. The use of one set of MAF was a deficiency in the dataset and may have caused significant bias in the models. Different weather variables had different levels of significance in each state, such that black ice was well correlated with crash rates in California but was not the case in Montana.
Takeaways from Strong et al. (2005): • The models used between climactic regions, even between maintenance
shops, may vary. • Key weather variables used in the models may vary between climactic
regions and maintenance shops. The recommended method would be to test various models on all data sets to
define which models works best where, and calibrate the weather index to be intuitive.
Suggett et al. (2006) Development of Winter Severity Indicator Models for Canadian Winter Road Maintenance http://conf.tac-atc.ca/english/resourcecentre/readingroom/conference/conf2006/docs/s003/Suggett.pdf
The Transportation Association of Canada wished to develop a winter severity model that would be more applicable to practices and conditions in Canada, relative to other methods that had been developed elsewhere prior to 2006. Specific issues the research group wished to avoid from prior work included:
• Some models appear to have poor transferability;
• Some models failed to adequately control for non-weather-related variables;
• Some models lack information on how they were developed or are to be applied; and
• Some models would require an extensive amount of data extraction and manipulation to calculate the Index.
Weather data and winter road maintenance data—specifically, salt (tonnes) per lane-km per day (a standardized value)—were used as inputs to the model.

136
Two models were created which used different weather data. The first used Meteorological Service of Canada (MSC) weather stations alone, and the second used MSC data plus RWIS data. Though the two networks have different observational abilities, the key variables the team deemed important for the model were:
• Precipitation variables (where available)
• Number of days of snowfall accumulation above a particular threshold
• Snowfall accumulation
• Number of days in which a particular precipitation type was observed (note: freezing rain was included in this research; it is directly reported at MSC stations)
• Temperature variables
• Air temperature
• Pavement temperature, where available
• Dew point temperature (to indicate frost when combined with pavement temperature)
• Drifting variables
• Blowing snow observations where available, or
• Threshold wind speed, snowfall, snow on the ground and temperature data combined to indicate blowing snow potential
• Variables for winter road maintenance practices and roadway characteristics were considered, but not included due to lack of data.
Suggett et al. (2006) note that weather tends to account for around half (or less) of the variability in maintenance practices. They found this in prior research and in their own models. Their models’ performance improved as the geographical scope was narrowed (e.g., from national to regional). They also noted that only using pavement temperature within the range that salt is actually applied makes sense for an index that is based on salt usage. The team also noted that RWIS data were a major limiting factor: the time period the data were available was limited, there was no standard format in the way RWIS data are reported, and the quality varied from location to location. Nevertheless, the model that combined MSC weather data with RWIS data performed the best.
Qiu (2008) Performance measurement for highway winter maintenance operations https://ir.uiowa.edu/cgi/viewcontent.cgi?article=1213&context=etd
While the ultimate objective of Qiu’s study is to relate mitigation efficiency to traffic and accidents, in the process, Qiu goes through the calculation of a storm severity index for snow and ice mitigation.
Qiu’s research defines a storm using a flowchart that considers different features of storms and their importance. The flowchart describes a storm in terms of six variables: storm type, in-storm temperature, in-storm wind conditions, early storm behavior, post-storm temperature and post-storm wind conditions.
These variables were weighted based on their mitigation disruption capabilities. First approximations of these were obtained by Qiu from the Federal Highway Administration (FHWA) Manual of Practice of Recommended Treatments (1999) and were modified by Qiu after a survey conducted among winter maintenance supervisors.

137
Qiu revised the Boselly et al. (1993) equation to match his findings. The
resulting equation for SSI—the calculated storm severity index for mitigation efforts—is:
where ST = storm type, Ti = in-storm road surface temperature, Wi = in-storm wind condition, Bi = early storm behavior, Tp = post-storm temperature, Wp = post-storm wind condition, a,b = parameters to normalize storm severity index from 0 to 1.
Marquis (2009) A Winter Severity Index for the State of Maine https://trid.trb.org/view/1238126
The Maine Department of Transportation changed from a reactive approach to a proactive approach to winter maintenance, recognizing that twenty percent of their operating costs were going to winter maintenance and the costs were increasing annually. They wanted to evaluate the impact of the effectiveness of the change, thus created a seasonal WSI for the five regions within Maine. The authors made use of Cooperative Observer Program (COOP) weather stations. The process is somewhat rudimentary as they suggested “assigning point values to snow events” to generate the WSI. The document does provide an equation with which to incorporate freezing rain, the Modified Daily Snowfall formula. They made use of Financial Activity Data Warehouse (FACT) data which provides a summary of labor, equipment, and material costs. Through the Maintenance Activity Tracking System (MATS), the Maine DOT tracks activities and material usage for every maintenance crew. The authors modeled their maintenance zones based on the forecast zones identified by the National Weather Service.
Maze et al. (2009)2 Estimating the relationship between snow and ice maintenance performance and current weather conditions https://trid.trb.org/View/880902
This work estimated the relationship between winter maintenance performance and weather condition data. This project was the first attempt to determine a relationship between weather data and winter maintenance performance in Minnesota. To assign value to performance variables they took road classifications and the time to achieve the prescribed LOS, for example 3 hours to achieve bare pavement on super commuter routes. Then, if it took 4 hours to achieve bare pavement (4hr to reach bare pavement divided by 3hr bare pavement goal or 4/3 = 1.33) performance index that can now be used in the severity index calculation. The overall calculation method used was a mixed linear retrospective model, i.e., using past data. Weather related variables used included snow, maximum and minimum temperatures, location of the road segment, and time. Another variable identified by practitioners to be of importance was the direction of the road segment (north-south or east-west), which was built into the equation. Roads trending N-S trending were assigned a 1, and E-W trending roads were assigned a 0. Average daily traffic was also included.
A combination of RWIS and NWS weather sources were used.
138
A full list of variables is available below under Maze et al. (2009). The report provides details on how the equation/model was derived and
tested and provides the equation for the model used. The work found that it is possible to use measurable weather data to estimate differences in winter maintenance performance across routes, districts, and sub-districts based on storm severity. They also found that the analysis can be done within a day or two of each storm, so that performance can be modified during the season.
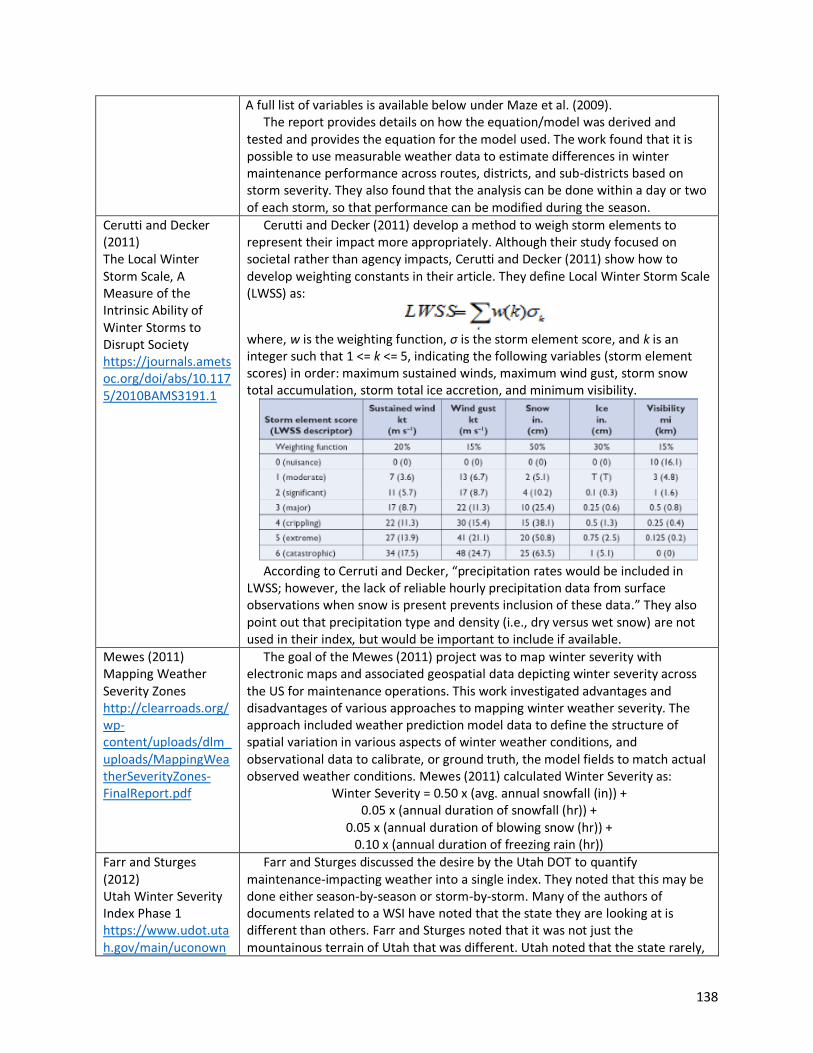
Cerutti and Decker (2011) The Local Winter Storm Scale, A Measure of the Intrinsic Ability of Winter Storms to Disrupt Society https://journals.ametsoc.org/doi/abs/10.1175/2010BAMS3191.1
Cerutti and Decker (2011) develop a method to weigh storm elements to represent their impact more appropriately. Although their study focused on societal rather than agency impacts, Cerutti and Decker (2011) show how to develop weighting constants in their article. They define Local Winter Storm Scale (LWSS) as:
where, w is the weighting function, σ is the storm element score, and k is an integer such that 1 <= k <= 5, indicating the following variables (storm element scores) in order: maximum sustained winds, maximum wind gust, storm snow total accumulation, storm total ice accretion, and minimum visibility.
According to Cerruti and Decker, “precipitation rates would be included in
LWSS; however, the lack of reliable hourly precipitation data from surface observations when snow is present prevents inclusion of these data.” They also point out that precipitation type and density (i.e., dry versus wet snow) are not used in their index, but would be important to include if available.
Mewes (2011) Mapping Weather Severity Zones http://clearroads.org/wp-content/uploads/dlm_uploads/MappingWeatherSeverityZones-FinalReport.pdf
The goal of the Mewes (2011) project was to map winter severity with electronic maps and associated geospatial data depicting winter severity across the US for maintenance operations. This work investigated advantages and disadvantages of various approaches to mapping winter weather severity. The approach included weather prediction model data to define the structure of spatial variation in various aspects of winter weather conditions, and observational data to calibrate, or ground truth, the model fields to match actual observed weather conditions. Mewes (2011) calculated Winter Severity as:
Winter Severity = 0.50 x (avg. annual snowfall (in)) + 0.05 x (annual duration of snowfall (hr)) +
0.05 x (annual duration of blowing snow (hr)) + 0.10 x (annual duration of freezing rain (hr))
Farr and Sturges (2012) Utah Winter Severity Index Phase 1 https://www.udot.utah.gov/main/uconown
Farr and Sturges discussed the desire by the Utah DOT to quantify maintenance-impacting weather into a single index. They noted that this may be done either season-by-season or storm-by-storm. Many of the authors of documents related to a WSI have noted that the state they are looking at is different than others. Farr and Sturges noted that it was not just the mountainous terrain of Utah that was different. Utah noted that the state rarely,

139
er.gf?n=11539601019505676
if ever, experiences freezing rain. In contrast, the occurrence of freezing rain was noted to be incorporated by others for Iowa, Indiana, and Maine.
The document defined WSI as a single value representing the impact of individual elements of a storm. These elements are those which have the greatest impact. Impact can be to society (i.e. a state’s travelers) or to the organization (i.e. a DOT).
They suggest that precipitation (i.e. type, rate, quantity, and duration including impact of elevation) and road surface temperature are the most influential storm elements for road conditions.
Badelt (2012) A new model for a winter index for estimating and evaluating de-icing salt consumption Full report in German; abstract only in English. https://trid.trb.org/View/1142994
The abstract describes the work as developing a better method to estimate and evaluate how much salt will be needed and used in the future by looking at daily weather data from the German National Meteorological Service. The data was used to derive when slippery road conditions occurred from snow, ice, and frost, and to relate these conditions to deicer application rate.
Balasundaram et al. (2012) Proactive approach to transportation resource allocation under severe winter weather emergencies https://rosap.ntl.bts.gov/view/dot/27048
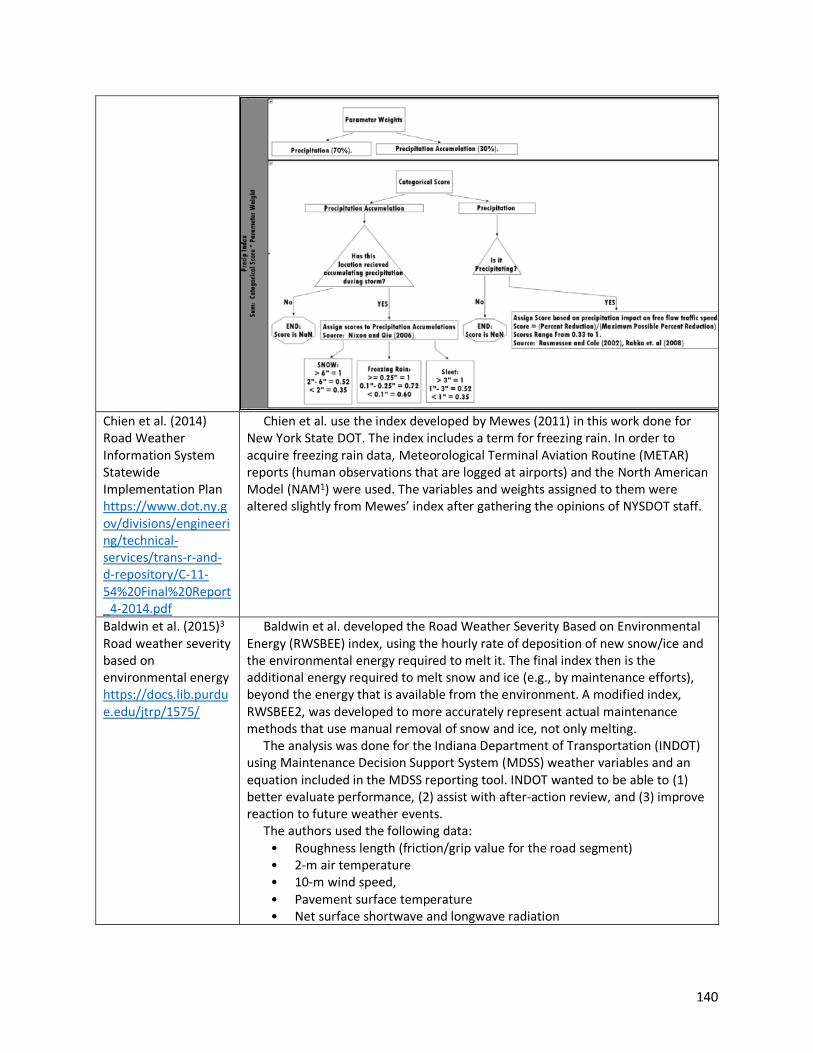
Produced for the Oklahoma Transportation Center, this research cites the Boselly et al. (1993) index as a base to their index development. Notably, they include freezing rain by using high-resolution weather prediction models (such as the Weather Research and Forecasting [WRF1] model) to assist with the determination of freezing rain. The authors state that:
Unfortunately, freezing rain’s impact on free flow traffic speed is not well studied and accurate impacts on free flow traffic speed are not available. To account for freezing rain it was assumed that for any three hour period, or time step of the model, if a location was forecast to experience freezing rain with radial ice accumulations greater than .01” then that location would receive a maximum score of 1. This may be excessive, but the impact of freezing rain cannot be overemphasized.
Freezing rain accumulation was derived using a method described in Jones (1998), which is based on precipitation rate and wind speed. Because weather models are used in the calculation of the index, the solution is only valid at 3-hour time steps and over 1-km grid boxes (consistent with the models’ resolution) and is subject to error inherent in the model.
The chart below (next page) illustrates the flow of the index calculation. The authors indicate that a statistical validation of the index is expected
in a subsequent publication. The research team has been unable to locate this publication and will contact Balasundaram et al. directly in forthcoming project tasks.
140
Chien et al. (2014) Road Weather Information System Statewide Implementation Plan https://www.dot.ny.gov/divisions/engineering/technical-services/trans-r-and-d-repository/C-11-54%20Final%20Report_4-2014.pdf
Chien et al. use the index developed by Mewes (2011) in this work done for New York State DOT. The index includes a term for freezing rain. In order to acquire freezing rain data, Meteorological Terminal Aviation Routine (METAR) reports (human observations that are logged at airports) and the North American Model (NAM1) were used. The variables and weights assigned to them were altered slightly from Mewes’ index after gathering the opinions of NYSDOT staff.
Baldwin et al. (2015)3 Road weather severity based on environmental energy https://docs.lib.purdue.edu/jtrp/1575/
Baldwin et al. developed the Road Weather Severity Based on Environmental Energy (RWSBEE) index, using the hourly rate of deposition of new snow/ice and the environmental energy required to melt it. The final index then is the additional energy required to melt snow and ice (e.g., by maintenance efforts), beyond the energy that is available from the environment. A modified index, RWSBEE2, was developed to more accurately represent actual maintenance methods that use manual removal of snow and ice, not only melting.
The analysis was done for the Indiana Department of Transportation (INDOT) using Maintenance Decision Support System (MDSS) weather variables and an equation included in the MDSS reporting tool. INDOT wanted to be able to (1) better evaluate performance, (2) assist with after-action review, and (3) improve reaction to future weather events.
The authors used the following data: • Roughness length (friction/grip value for the road segment) • 2-m air temperature • 10-m wind speed, • Pavement surface temperature • Net surface shortwave and longwave radiation
141
• Sensible and latent heat fluxes from North American Land Data Assimilation System (NLDAS)
• Vertical temperature profile • Categorical precipitation type • Visibility • 10-m wind gusts from Rapid Refresh (RAP 38F
1) model • Snow depth from Snow Data Assimilation System (SNODAS) • Hourly accumulated precipitation from the National Centers for
Environmental Prediction (NCEP) Stage IV A full list of data collected is available below under Baldwin et al (2015).
Severity indices were computed for each INDOT district, sub-district, and unit for an entire season. They were displayed in the document randomly, so as not to convey documented criticism of the district, sub-district, or unit. The authors concluded that nearly seventy-five percent of the areas across the state were within plus or minus five percent of the value (actual cost that year) when viewing costs in terms of the RWSBEE instead of costs per weather hour. However, they acknowledge that the approach could not account for maintenance costs (i.e. salt application).
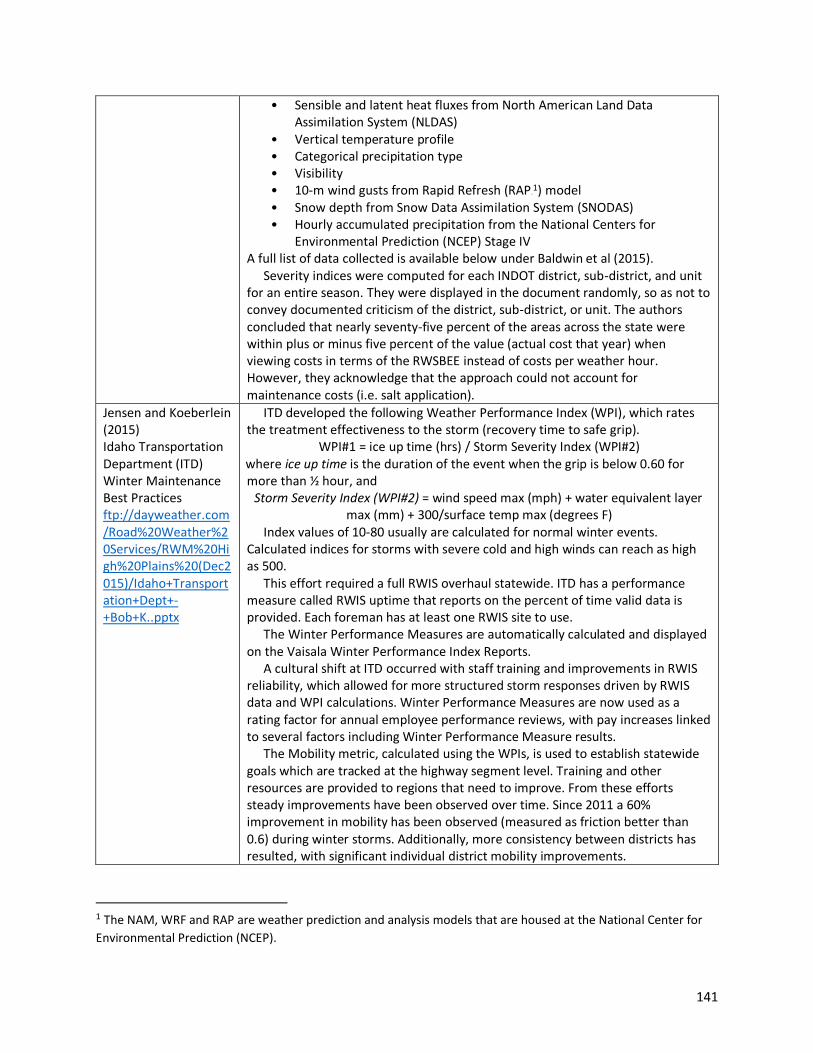
Jensen and Koeberlein (2015) Idaho Transportation Department (ITD) Winter Maintenance Best Practices ftp://dayweather.com/Road%20Weather%20Services/RWM%20High%20Plains%20(Dec2015)/Idaho+Transportation+Dept+-+Bob+K..pptx
ITD developed the following Weather Performance Index (WPI), which rates the treatment effectiveness to the storm (recovery time to safe grip).
WPI#1 = ice up time (hrs) / Storm Severity Index (WPI#2) where ice up time is the duration of the event when the grip is below 0.60 for more than ½ hour, and
Storm Severity Index (WPI#2) = wind speed max (mph) + water equivalent layer max (mm) + 300/surface temp max (degrees F)
Index values of 10-80 usually are calculated for normal winter events. Calculated indices for storms with severe cold and high winds can reach as high as 500.
This effort required a full RWIS overhaul statewide. ITD has a performance measure called RWIS uptime that reports on the percent of time valid data is provided. Each foreman has at least one RWIS site to use.
The Winter Performance Measures are automatically calculated and displayed on the Vaisala Winter Performance Index Reports.
A cultural shift at ITD occurred with staff training and improvements in RWIS reliability, which allowed for more structured storm responses driven by RWIS data and WPI calculations. Winter Performance Measures are now used as a rating factor for annual employee performance reviews, with pay increases linked to several factors including Winter Performance Measure results.
The Mobility metric, calculated using the WPIs, is used to establish statewide goals which are tracked at the highway segment level. Training and other resources are provided to regions that need to improve. From these efforts steady improvements have been observed over time. Since 2011 a 60% improvement in mobility has been observed (measured as friction better than 0.6) during winter storms. Additionally, more consistency between districts has resulted, with significant individual district mobility improvements.
1 The NAM, WRF and RAP are weather prediction and analysis models that are housed at the National Center for
Environmental Prediction (NCEP).

142
Koeberlein (2015) Idaho Transportation Department Winter Performance Measure http://www.westernstatesforum.org/Documents/2015/presentations/Idaho_JensenKoeberlein_FINAL3_WinterMaintUpdate.pdf
Some weather events are exempt from the WPI scoring– for ITD this includes drifting and powder snow events. Along these lines, the following weather events are modified in the WPI scoring – hydroplaning, frost events leading into storms, drifting/powder snow events that adhere to the roadway, fog that affects non-invasive sensor readings, and sensor errors.
Williams et al. (2015) UDOT Weather Operations, Road Weather Index/ Performance Metric http://www.nationalruralitsconference.org/wp-content/uploads/2018/04/Williams_RM2.pdf
More recently, Utah DOT presented on Road Weather Index/Performance Metrics and reported on follow-up research of work reviewed above by Farr and Sturges (2012). The goal of developing a road weather index is to provide real-time information to allow for the evaluation of weather, road conditions, and maintenance performance.
The road weather index accounts for snowfall rate, road temperature, blowing snow, freezing rain, and road grip/condition, and was developed in-house. Information used in the winter road weather index (WRWI) follows. For the initial condition that the road temperature is below 35°F and the road is not dry:
• Road condition (snow, ice, friction) • Road temperature • Visibility (used to estimate snowfall rate) • Precipitation occurrence (yes/no)
• Defines start and end of storm • Differentiates snow from fog
• Wet-bulb temperature (used to distinguish dryness of snow, and to distinguish snow from rain)
• Wind gust (greater than or equal to 20 mph) Williams et al. have found that snowfall rate and road temperatures have the greatest impacts on roads.
The calculation uses a cause and effect approach – atmospheric conditions and road temperature (cause) versus road friction or condition (result). One inch of snow per hour is the benchmark, and the index differentiates between snowfall at warmer temperatures versus at colder temperatures (all else being equal) from the perspective of maintenance.
The index can be calculated at different temporal scales (real-time to seasonal) and spatial scales (RWIS location to statewide).
Index results are shown as a color-coded performance metric, where green boxes mean the road condition is better than acceptable for the given weather conditions, yellow boxes mean the road is acceptable for the conditions, and red means there is potential for improvement.

143
Williams et al. show how the performance index can be calculated in real time
at an RWIS. In the examples shown, an improvement in performance (grip) can be seen after a plow goes by the RWIS, even as the weather index is reporting severe weather.
Benefits of this index include assessing winter plow performance for specific weather conditions, resource budgeting and planning, public response to poor road conditions during intense storms, and indirectly improving mobility.
One identified limitation is that the information is based on a small sample area (around a single RWIS), which could be improved with AVL, mobile sensors or modeling. Flurries occurring in fog also cause issues, as precipitation is estimated using visibility. Investments in newer technology and more frequent calibrations could help to remedy this issue.
Boustead et al. (2015) The Accumulated Winter Season Severity Index (AWSSI) https://journals.ametsoc.org/doi/abs/10.1175/JAMC-D-14-0217.1
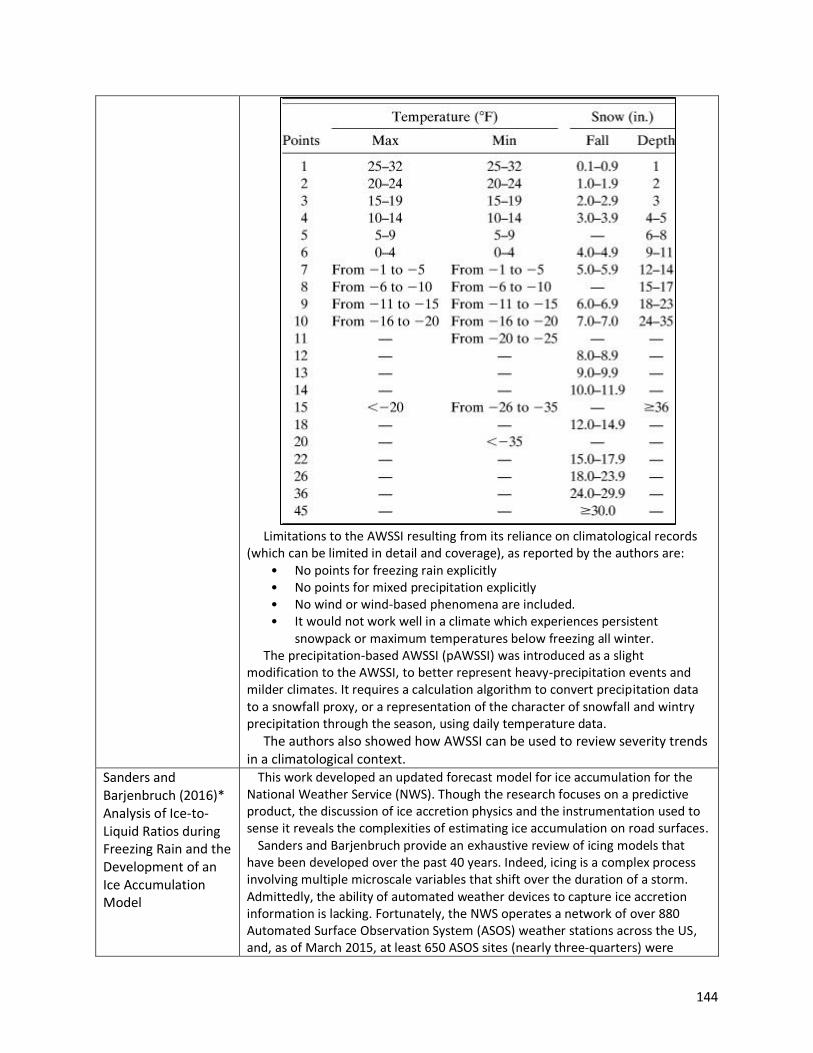
Boustead et al. (2015) developed a method to estimate snowfall where snow data was unavailable or unreliable by using a proxy that combines temperature and precipitation. Ultimately the data and proxy values were used to calculate accumulated WSIs. The method is called the Accumulated Winter Season Severity Index (AWSSI). Data used include daily maximum, minimum, and average temperature, precipitation, snowfall, and snow-depth data from the Applied Climate Information System (ACIS) database.
This paper includes a discussion of how winter was defined which for this effort winter onset occurs when:
1) The daily maximum temperature is ≤ 32 °F, 2) Daily snowfall ≥ 0.1 in., or 3) It is December 1st.
The end of winter was defined as occurring when: 1) The daily maximum temperature ≤ 32 °F no longer occurs, 2) Daily snowfall ≥ 0.1 in. is no longer observed, or 3) It is March 1st.
To calculate the WSI, points were assigned for various parameters (see table below), from which summary categories were created, in order to make the severity values more understandable in a statistical context:
• W-1: Mild; min to 20th percentile • W-2: Moderate; 21st to 40th percentile • W-3: Average; 41st to 60th percentile • W-4: Severe; 61st to 80th percentile • W-5: Extreme; 81st percentile to max
144
Limitations to the AWSSI resulting from its reliance on climatological records
(which can be limited in detail and coverage), as reported by the authors are: • No points for freezing rain explicitly • No points for mixed precipitation explicitly • No wind or wind-based phenomena are included. • It would not work well in a climate which experiences persistent
snowpack or maximum temperatures below freezing all winter. The precipitation-based AWSSI (pAWSSI) was introduced as a slight
modification to the AWSSI, to better represent heavy-precipitation events and milder climates. It requires a calculation algorithm to convert precipitation data to a snowfall proxy, or a representation of the character of snowfall and wintry precipitation through the season, using daily temperature data.
The authors also showed how AWSSI can be used to review severity trends in a climatological context.
Sanders and Barjenbruch (2016)* Analysis of Ice-to-Liquid Ratios during Freezing Rain and the Development of an Ice Accumulation Model
This work developed an updated forecast model for ice accumulation for the National Weather Service (NWS). Though the research focuses on a predictive product, the discussion of ice accretion physics and the instrumentation used to sense it reveals the complexities of estimating ice accumulation on road surfaces.
Sanders and Barjenbruch provide an exhaustive review of icing models that have been developed over the past 40 years. Indeed, icing is a complex process involving multiple microscale variables that shift over the duration of a storm. Admittedly, the ability of automated weather devices to capture ice accretion information is lacking. Fortunately, the NWS operates a network of over 880 Automated Surface Observation System (ASOS) weather stations across the US, and, as of March 2015, at least 650 ASOS sites (nearly three-quarters) were

145
https://journals.ametsoc.org/doi/full/10.1175/WAF-D-15-0118.1
equipped with an icing sensor which can detect freezing rain in real time: the Goodrich Sensor System 872C3.
The model described in Sanders and Barjenbruch (2016) calculates an ice accretion rate by estimating ice accumulation on various surfaces (from a liquid precipitation equivalent), and when the following meteorological conditions are known: precipitation rate, air temperature, wet-bulb temperature, and wind speed. The model has been undergoing testing at the NWS since its development.
Walsh (2016) Winter Maintenance Performance Measure https://trid.trb.org/view/1396354
The WPI developed for Colorado DOT shows the total amount of time roads were compromised by winter weather. Walsh (2016) used this method to evaluate Colorado DOT maintenance practices, and suggested the index (1) is a “valuable tool” that can be used to perform post-storm analyses, (2) can be used as a training tool for maintenance personnel, and (3) can identify areas for cost savings and improved performance.
A Storm Severity Index (SSI) was also developed that rates the severity of a winter storm event based on wind speed, precipitation, and surface temperature. The SSI allows for comparison of performance across geographic areas with unique climactic conditions. The SSI “normalizes the different storm events because it quantifies and compensates for variation in the severity and duration of storms.”
The goal was to utilize the WSI developed by ITD and Vaisala (Jensen and Koeberlein, 2015):
SSI = Max Wind Speed (mph) + Max Layer Thickness (mm) +
(300/Min Surface Temperature (°F)) A mobility index (MI) was also calculated, as was a performance index (PI).
MI = (Grip ≥ 0.60 duration (hours)) / (Combined Event Duration (hours)) % PI = Grip < 0.60 duration (hours) / SSI
Suggested next steps included an evaluation of the RWIS network in Colorado, training and support for the use of the WPI in CDOT operations, detailed evaluation of Red and Orange rated events (WPI scale shown below), and upgrades to CDOT software to support WPI use.
Brettschneider (2016) The New Winter Severity Index in Alaska https://accap.uaf.edu/sites/default/files/Alaska_Climate_Dispatch_winter_2015-6_0.pdf
Brettschneider uses the AWSSI to state that the winter of 2015-16 was one of the least severe on record. He explains how AWSSI is used in the state of Alaska, and admits that “quantifying a winter in a single, numerical index is an elusive goal that is fraught with complications.” He notes that the winter season itself begins much earlier and ends much later in some parts of the state versus others. He acknowledges that opinions abound on how to rate severity; there will be differences arising from perception, geography, climate, etc. The author then notes that the AWSSI seems to solve many of the problems he’s experienced in working to create a WSI for years in Alaska, but he notes that there should be adjustments made to account for the differences in Alaska versus most lower 48 climates, where the AWSSI was developed. For example:
146
• Snow on the ground is nearly continuous in most of Alaska during winter, rather than being transient.
• There could be heavier weighting of low snowfall events (these are the majority of the snowstorms Alaska receives in mid-winter).
• There could be lower low temperature thresholds. The author compared AWSSI values for the 2015-16 winter season to
climatologically average AWSSI values to show that the season was relatively mild in Alaska, and he showed that severity has trended downward, on average, over Alaska for the past 60 years.
Fu et al. (2017) A Risk-Based Approach to Winter Road Surface Condition Classification https://www-nrcresearchpress-com.offcampus.lib.washington.edu/doi/full/10.1139/cjce-2016-0215#.XQ0ulehKi70
Currently there is an inconsistency in how road agencies report road surface conditions, both in the number of road surface categories and in the terminology used. For example, the North Dakota Department of Transportation has seven road surface conditions ranging from snow covered to dry whereas Washington State Department of Transportation only has three categories ranging from ice/snow to dry. In this paper, Fu et al. present a “relative risk index” which determines the collision risk on a highway using weather condition data. This index could be used to monitor road conditions, the effectiveness of winter road maintenance, and to report road conditions to the traveling public. Using historical crash data along with traffic volume data and road weather information, the authors were able to model collision risk based on climate factors. High traffic volume, precipitation, wind speed, road surface condition, and visibility were found to have a significant effect on road risk.
Toms et al. (2017) Development of a Novel Road Ice Detection and Road Closure System: Modeling, Observations, and Risk Communication https://ams.confex.com/ams/97Annual/webprogram/Paper315187.html
This conference presentation provided a summary of the project in Oklahoma, funded by Oklahoma DOT, to develop a multi-faceted road ice prediction and warning network across the state. The system uses a Road Ice Model (RIM), RWIS data, and a GIS database to access and visualize the data. Data sources used observational data from Oklahoma Mesonet and Automated Surface Observation Station (ASOS), National Weather Service (NWS), and National Digital Forecast Database (NDFD). Using the aforementioned data sources and RWIS data, a stochastic method was developed to determine road ice risk. Additional information including topography, traffic flow, and population were considered and incorporated into the model and GIS visualization tool.
A goal of the project was to create a cost-effective and computationally efficient tool that offers diagnostic and forecasted information. The research team will continue to work to obtain more information and/or a report or journal article on this topic.
Matthews et al. (2017a) Development of a flexible winter severity index for snow and ice control https://doi.org/10.1061/(ASCE)CR.1943-5495.0000130
Matthews et al. (2017a) developed a WSI for the province of Alberta. The team recommended using RWIS data in conjunction with Environment Canada (EC) weather station networks to improve the amount, quality, and types of data. The EC network has good quality data, but there are fewer stations in northern Canada, and they do not report road surface conditions. The RWIS data has a lower level of quality control, with only few RWIS stations having historic rainfall and snow depth data.
The following weather conditions (“triggers”) were used for the development of the WSI:
• Three different categories of snowfall differentiated by snowfall amount (EC data)
• Two sets of conditions associated with icing (pavement ice warnings and rain with low temperatures; EC precipitation data, RWIS ice warnings)
147
• Series of cold days (where treatment may occur because bare pavement has not been achieved, RWIS temperature data)
• Blowing snow (RWIS wind data, EC snowfall data) The index also adds in a shoulder season adjustment factor which reduces the severity scores when the average mean temperature remains above freezing for an extended period (RWIS temperature data).
The index calculates a point value for each day. The points can then be aggregated weekly, monthly, and seasonally. These daily and aggregated scores have been found to be easily interpreted because they are directly tied to distinct weather conditions and events.
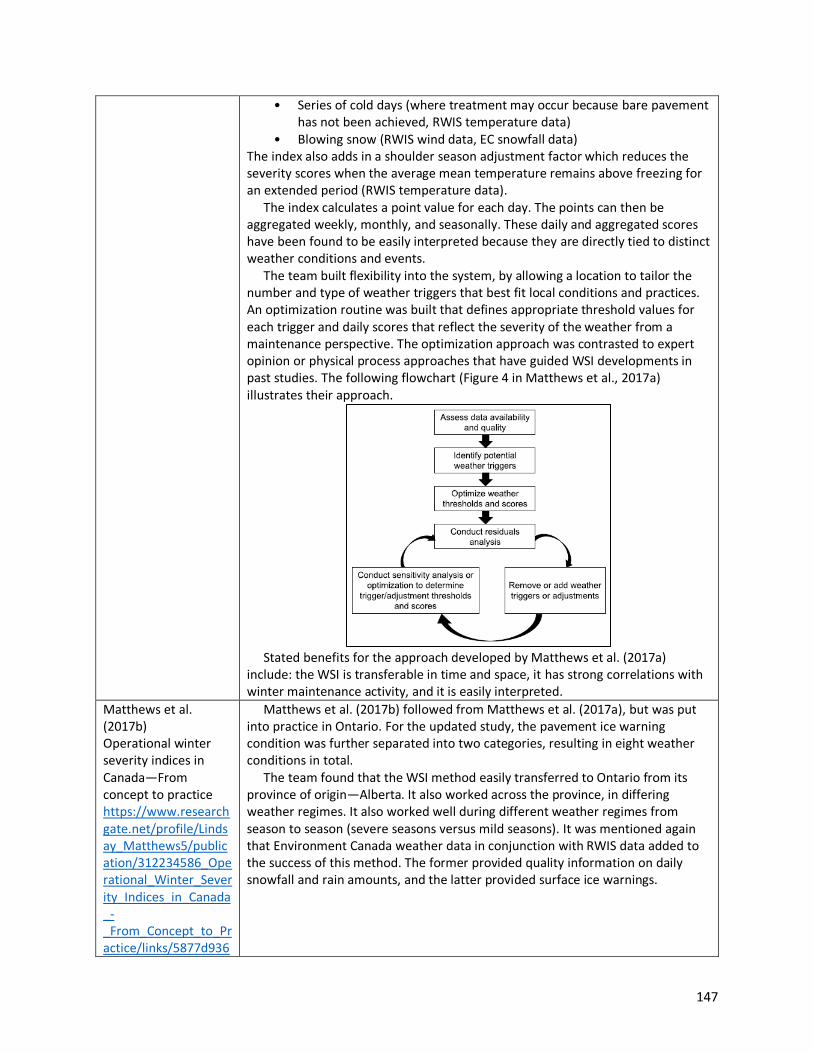
The team built flexibility into the system, by allowing a location to tailor the number and type of weather triggers that best fit local conditions and practices. An optimization routine was built that defines appropriate threshold values for each trigger and daily scores that reflect the severity of the weather from a maintenance perspective. The optimization approach was contrasted to expert opinion or physical process approaches that have guided WSI developments in past studies. The following flowchart (Figure 4 in Matthews et al., 2017a) illustrates their approach.
Stated benefits for the approach developed by Matthews et al. (2017a)
include: the WSI is transferable in time and space, it has strong correlations with winter maintenance activity, and it is easily interpreted.
Matthews et al. (2017b) Operational winter severity indices in Canada—From concept to practice https://www.researchgate.net/profile/Lindsay_Matthews5/publication/312234586_Operational_Winter_Severity_Indices_in_Canada_-_From_Concept_to_Practice/links/5877d936
Matthews et al. (2017b) followed from Matthews et al. (2017a), but was put into practice in Ontario. For the updated study, the pavement ice warning condition was further separated into two categories, resulting in eight weather conditions in total.
The team found that the WSI method easily transferred to Ontario from its province of origin—Alberta. It also worked across the province, in differing weather regimes. It also worked well during different weather regimes from season to season (severe seasons versus mild seasons). It was mentioned again that Environment Canada weather data in conjunction with RWIS data added to the success of this method. The former provided quality information on daily snowfall and rain amounts, and the latter provided surface ice warnings.

148
08aebf17d3bbc863/Operational-Winter-Severity-Indices-in-Canada-From-Concept-to-Practice.pdf
Matthews et al. (2017c) Planning for Winter Road Maintenance in the Context of Climate Change https://journals.ametsoc.org/doi/10.1175/WCAS-D-16-0103.1
The purposes of this study were (1) to develop a WSI that explains the historical variation in winter maintenance expenditures using weather data as the explanatory variables and (2) to apply the WSI to future climate change projections in order to understand potential future changes to maintenance expenditures. The study area was Prince George, British Columbia.
While all previous WSIs have been developed for use in performance management and/or public communications, this study for Prince George looks to further the application of a WSI for use in climate change adaptation planning. As such, there is a need to adapt the WSI in such a way as to allow for projected climate data to be used as a WSI weather input. For Prince George, the WSI must be applied to both past winters as well as modeled climate futures and thus was limited to two weather conditions: days of snowfall and days with the potential for icing during or after rainfall (i.e., rain occurring on days where temperatures are within the freezing range). Future projections of climate change do not currently contain projections of RWIS variables (such as road surface conditions). Furthermore, climate projections of wind speed are less confident than temperatures or precipitation. Because of these data limitations as they pertain to the future and also the past (availability of RWIS data), a simplified WSI was developed.
Walker et al. (2017) Developing a Winter Severity Index to Improve Safety and Mobility https://ams.confex.com/ams/97Annual/webprogram/Paper315564.html
This conference presentation provided a summary of the winter severity index, called NeWINS, developed for the State of Nebraska. NeWINS is unique in that it calculates varying levels of complexity of atmospheric conditions. NeWINS is also simple and easy to use. The project included a literature review and rigorous data collection to create a ten-year database, including the following storm types – light snow, moderate snow, heavy snow, and air and road surface temperatures, and wind conditions. Data was captured from the High Plains Regional Climate Centers Automated Weather Data Network (AWDN), the National Centers for Environmental Information (NCEI), and the Meteorological Assimilation Data Ingest System (MADIS).
The NeWINS is designed to provide data at the district level across the state. Testing of system was conducted in 2016-2017 winter season.
Walker et al. (2018) Development of the Nebraska Department of Transportation Winter Severity Index https://dot.nebraska.gov/media/12698/final-report-m054.pdf
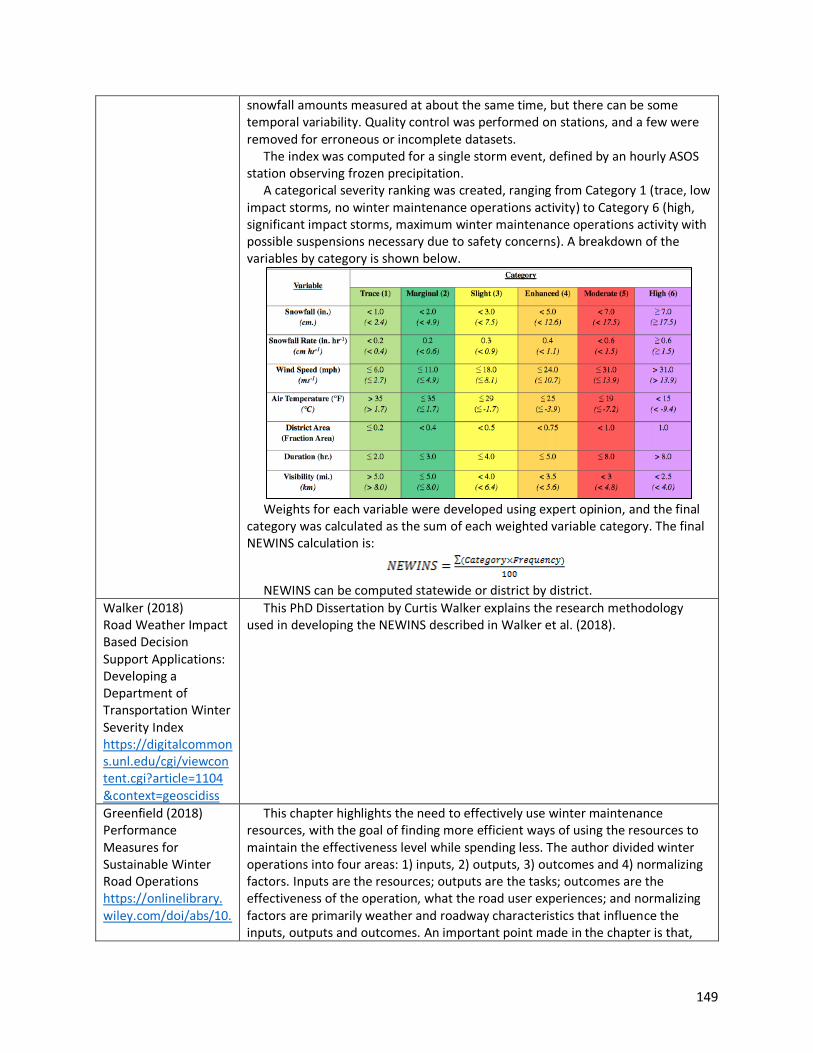
Walker et al. (2018) developed the Nebraska Winter Severity Index (NEWINS) for the Nebraska DOT. This technical paper follows from the presentation by Walker et al. (2017). Weather variables included were: snowfall total, snowfall rate (derived), wind speed, air temperature, district area (fraction of district experiencing storm), duration, and visibility. Road temperature and freezing rain data were not included in the development of the NEWINS despite their desirability, due to their lack of reliability and availability over the study period.
Atmospheric data came from ASOS stations, and snowfall observations were obtained from Global Historical Climatology Network-Daily (GHCN-D) sites within 9 miles of an ASOS station. The GHCN-D sites include data from the Community Collaborative Rain, Hail and Snow Network (CoCoRaHS), the Nebraska Rainfall Assessment and Information Network (NeRAIN), and the NWS Cooperative Observer (COOP) network. Most GHCN-D sites record once-daily, 24-hour
149
snowfall amounts measured at about the same time, but there can be some temporal variability. Quality control was performed on stations, and a few were removed for erroneous or incomplete datasets.
The index was computed for a single storm event, defined by an hourly ASOS station observing frozen precipitation.
A categorical severity ranking was created, ranging from Category 1 (trace, low impact storms, no winter maintenance operations activity) to Category 6 (high, significant impact storms, maximum winter maintenance operations activity with possible suspensions necessary due to safety concerns). A breakdown of the variables by category is shown below.
Weights for each variable were developed using expert opinion, and the final
category was calculated as the sum of each weighted variable category. The final NEWINS calculation is:
NEWINS can be computed statewide or district by district.
Walker (2018) Road Weather Impact Based Decision Support Applications: Developing a Department of Transportation Winter Severity Index https://digitalcommons.unl.edu/cgi/viewcontent.cgi?article=1104&context=geoscidiss
This PhD Dissertation by Curtis Walker explains the research methodology used in developing the NEWINS described in Walker et al. (2018).
Greenfield (2018) Performance Measures for Sustainable Winter Road Operations https://onlinelibrary.wiley.com/doi/abs/10.
This chapter highlights the need to effectively use winter maintenance resources, with the goal of finding more efficient ways of using the resources to maintain the effectiveness level while spending less. The author divided winter operations into four areas: 1) inputs, 2) outputs, 3) outcomes and 4) normalizing factors. Inputs are the resources; outputs are the tasks; outcomes are the effectiveness of the operation, what the road user experiences; and normalizing factors are primarily weather and roadway characteristics that influence the inputs, outputs and outcomes. An important point made in the chapter is that,

150
1002/9781119185161.ch19
“factors that rely on weather and agency decisions cannot be used to separate weather from agency decisions.” In other words, crew activities, material use, and traffic conditions are examples of variables that should not be included in a weather index. The author also recommends checking the correlation of the index with winter operations data. Furthermore, she recommended a topography normalization if one region is hillier than another with the expectation that, as an example, more deicing chemical is needed to ensure keep vehicles from sliding off of curves. Regarding outputs, the author discussed data latency (how soon after the event is the data available) and data resolution (information desired by a maintenance shed manager versus a department head). The author also presented a dashboard from the Iowa Department of Transportation (copied below) that can be accessed at various levels of detail, dependent upon the user (maintenance shed manager versus department head):
Dowds and Sullivan (2019) Snow and Ice Control Performance Measurement: Comparing ‘Grip,’ Traffic Speed Distributions and Safety Outcomes During Winter Storms https://vtrans.vermont.gov/sites/aot/files/planning/documents/research/publishedreports/2019-08_GRIP.pdf
This recent work at Vermont Agency of Transportation sought to further advance a comprehensive performance measurement system that is consistent with the state’s winter maintenance goals. In the context of performance measurement methods, a review of the precipitation-based Accumulated Winter Season Severity Index found the method appropriate for use in Vermont because it was well calibrated, captured key factors influencing winter maintenance activities and was calculated from data that are readily available across the state.
Malcheva et al. (2019) Complex Approach for Classification of Winter Severity in Bulgaria
Malcheva et al. analyzed climate data in order to create a winter severity index which could be used to determine the general winter severity of Bulgaria geographically. Meteorological data from 1931 to 2011 was obtained from the National Institute of Meteorology and Hydrology for non-mountainous weather stations in Bulgaria. Data for average, maximum temperature, minimum temperature, snowfall, snow cover, and wind speed were used to develop a winter severity index and to determine a statistically typical winter season. Each

151
https://aip.scitation.org/doi/10.1063/1.5091269
historical winter season was compared to the statistically typical winter season. The authors found that low average air temperature, prolonged cold temperatures, and heavy snow fall resulted in a higher winter severity index. Using the winter severity index, the authors created an average winter severity index for each weather station, this data was mapped in order to determine geographic differences in winter severity. A significant correlation was found between the winter severity index and altitude and latitude. The authors found that Southern Bulgaria and along the coast of the Black Sea were less severe (lower index) and Northern and Western Bulgaria more severe (higher index).
Walker et al. (2019a) Developing a winter severity index: A critical review https://www.sciencedirect.com/science/article/pii/S0165232X18302672
This study reviews and categorizes the indices that have been developed and put into operation across the United States. (Conveniently, the publication lists equations used at a number of states [though not all], and it can be used as an easily accessible, up-to-date resource.)
Walker et al. (2019) review common variables used in severity indices across the US, including temperature, snow, wind, and freezing rain. The authors acknowledge the importance of freezing rain’s contribution to severity, and the challenges in acquiring data to adequately represent its occurrence.
The authors highlight details of each variable typically used in the available literature. For example, the singular variable of temperature can be used in multiple ways, such as: air temperature, pavement temperature, temperature thresholds, temperature trends, temperature ranges, temperature in relation to other weather factors, dewpoint temperature and wet-bulb temperature.
Additional parameters are highlighted as important. Precipitation changes during storms can have a marked impact on the ease of mitigation efforts (positively or negatively). Weather before and/or after storms (especially wind and temperatures) can also impact maintenance efforts. In light of these observations, it becomes important that local knowledge and regionally specific methods are employed in the development of an index, in order to capture nuances of the weather that may be important to the calculation of severity locally.
Walker et al. (2019) conclude with a request that clear documentation of methods developed at different agencies be made available to others to facilitate reproduction of indices as desired.
Walker et al. (2019b)* Developing a Department of Transportation Winter Severity Index https://journals.ametsoc.org/doi/abs/10.1175/JAMC-D-18-0240.1
Included for completeness, this is the peer-reviewed version of the following publications, which are summarized elsewhere in this table:
• Walker, C.L. (2018) Road Weather Impact Based Decision Support Applications: Developing a Department of Transportation Winter Severity Index. Doctoral dissertation. University of Nebraska, Lincoln, Nebraska.
• Walker, C., Anderson, M., Esmaeili, B. (2018) Development of the Nebraska Department of Transportation Winter Severity Index. Technical Document. Nebraska Department of Transportation, Lincoln, Nebraska.

152
1STRONG ET AL. (2005)
The data used by Strong et al. (2005) are listed by state in Table 8.
The calculations developed in Strong et al. (2005) follow.
Montana Mountain Zone:
Montana Valley Zone:
Montana Plains Zone:
Oregon Mountain Zone:
Oregon Valley Zone:
Oregon Plains Zone:
California Mountain Zone:
California Valley Zone:
California Plains Zone:
where AccRate = Accident Rate, Sfreq = Frequency of snowfall events, F = Average daily likelihood of frost,
Tmax = Average daily maximum temperature, Tmin = Average daily minimum temperature, Tdp = Dew point
temperature, S = Average daily snowfall, T<freeze = Number of days with temperature below freezing, Wavg
= Average daily wind speed, Nsno = Number of days per month with snowfall.

153
Table 2: Data Used by Strong et al. (2005)
California Weather data (15 NWS stations, 1991-2000):
Daily precipitation Daily snowfall Daily min and max temperature Temperature at the observation time Snow depth at the observation time
Crash data (1991-1999): County and route codes Ramp milepost Roadway classification Time of accident County code Highway group (divided/undivided) File type Side of the highway Weather condition (rain, snow, fog, etc.) Light condition Road surface (slippery, muddy, etc.) Type of collision Total number of vehicles Population group (city, rural, etc.) Collision severity Number of vehicles involved Case number (includes date of crash)
Traffic counts (from 1991-2000): AADT MAF (calculated for 2001-2003)
Oregon Weather Data (32 RWIS sites, 1997-2003):
Region code RWIS station code Location description Latitude, longitude, elevation Air temperature Dew Point Relative humidity Barometric pressure Avg. wind speed, wind gust speed Min., max., and avg. wind direction Precip. type, rate, accumulation, intensity Visibility Date and time
Crash data (1997-2003): Date of accident Route number Description of location Milepost Pavement condition Number of vehicles involved Fatalities (yes/no) Injuries recorded (yes/no)
Traffic counts (32 sites, 1997-2003): AADT MAF
Montana Weather data (60 RWIS sites, Nov. 1996-Sept. 2003):
MDT server, RPU, and sensor ID numbers Date and GMT Avg. wind speed, gust speed, avg. direction Pavement surface condition Pavement surface temperature; back, bottom, freeze, reference temperatures Chemical factor Chemical percent Water depth Percent of sensor covered with ice System on/off Atmospheric temperature Dew point Precipitation type, intensity, rate, accumulation Subsurface temperature
Crash data (Jan. 1996-Sept. 2003, within 5 miles in each direction of each RWIS site):
Date and time of accident Highway route number and milepost Weather condition Pavement condition Number of vehicles involved Pedestrians involved (yes/no) Number of fatalities Number of injuries
Traffic counts (near 60 RWIS sites): AADT (1996-2003) MAF (1998-2003)
2MAZE ET AL. (2009)

154
A combination of RWIS and NWS weather sources were used. A full list of variables used is provided in
Table 9.
Table 3: Variables used in Maze el al. (2009)
Index Variable Variable Definition Type of Variable Variable District Geographic location Classification Districti
Storm of season 1,2,….,7 Classification Stormj
Volume (ADT) Avg volume on road per 1000 Continuous Volumeijk Performance relative to goal (LOS)
Actual bare lane time versus goal Continuous Yijk
Route Orientation E-W or N-S Integer Variable EWijk
Snow quantities Amount of snow at nearest NWS site Continuous Snowijk Wind speed Max wind speed at nearest NWS site Continuous Windijk
Max Temp Max temp record by nearest NWS site Continuous Tmaxijk
Min Temp Min temp record by nearest NWS site Continuous Tminijk
3BALDWIN ET AL (2015)
Weather data sources used by Baldwin et al (2015) are:
• Rapid Refresh (RAP) – an hourly, short-range weather prediction and data assimilation system
(http://rapidrefresh.noaa.gov, version 4 released June 2018):
1-hr temporal resolutions
1/8° spatial resolution
• North American Land Data Assimilation System (NLDAS) – a land-surface model dataset that
has built in quality controls and spatial and temporal consistency:
1-hr temporal resolutions
1/8° spatial resolution
• Snow Data Assimilation System (SNODAS) – provides a framework to integrate snow and ice
cover data from satellites and aircraft with surface observations and numerical weather
model estimates of snow and ice cover and depth (National Operational Hydrologic Remote
Sensing Center [NOHRSC]), http://nsidc.org/data/G02158)
Daily temporal resolution
1-km spatial resolution
• NCEP Stage IV Precipitation Analysis – uses NWS data from the 12 River Forecast Centers to
create an hourly mosaic of precipitation accumulation from water gauges and radar data; tied
to the RAP analysis method (http://www.emc.ncep.noaa.gov/mmb/ylin/pcpanl/stage4/):
1-, 6-, 24-hr temporal resolution aggregates
4-km spatial resolution
Local Winter Storm Scale (LWSS; Cerruti and Decker (2011) – classifies winter storms on a scale from 0
(nuisance) to 6 (catastrophic), and weights various storm elements (e.g., maximum wind gust, snowfall,
ice accumulation, and visibility).
155
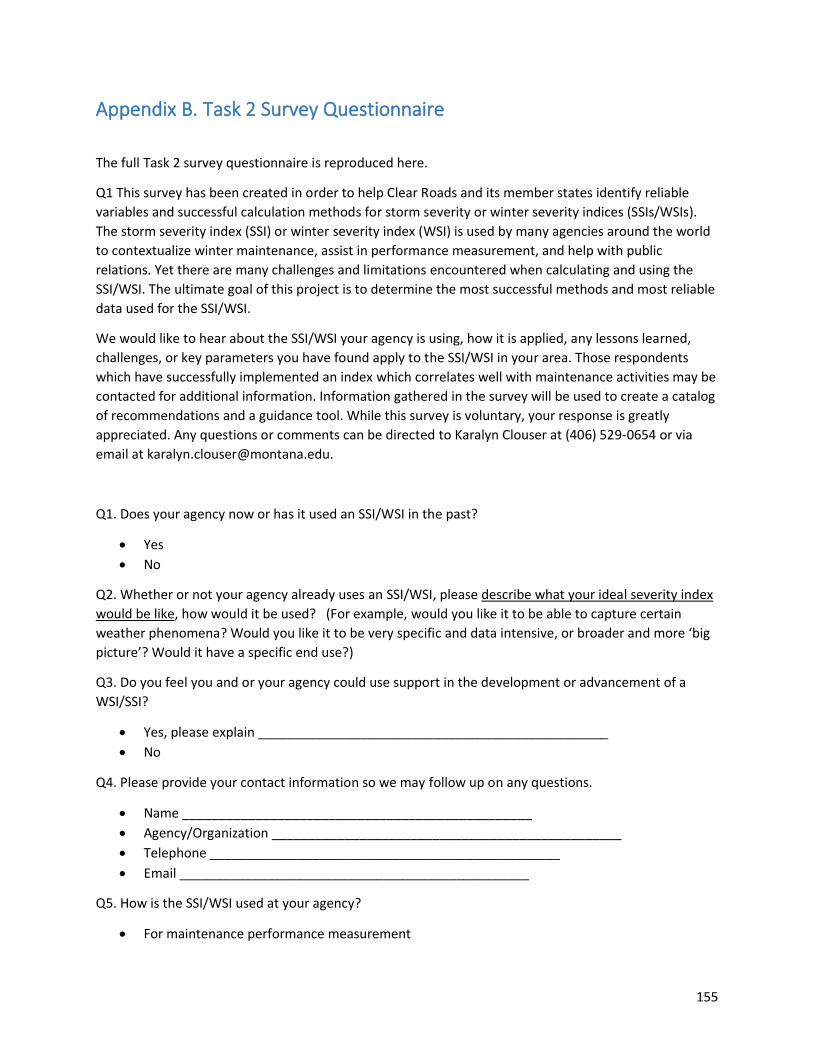
Appendix B. Task 2 Survey Questionnaire
The full Task 2 survey questionnaire is reproduced here.
Q1 This survey has been created in order to help Clear Roads and its member states identify reliable
variables and successful calculation methods for storm severity or winter severity indices (SSIs/WSIs).
The storm severity index (SSI) or winter severity index (WSI) is used by many agencies around the world
to contextualize winter maintenance, assist in performance measurement, and help with public
relations. Yet there are many challenges and limitations encountered when calculating and using the
SSI/WSI. The ultimate goal of this project is to determine the most successful methods and most reliable
data used for the SSI/WSI.
We would like to hear about the SSI/WSI your agency is using, how it is applied, any lessons learned,
challenges, or key parameters you have found apply to the SSI/WSI in your area. Those respondents
which have successfully implemented an index which correlates well with maintenance activities may be
contacted for additional information. Information gathered in the survey will be used to create a catalog
of recommendations and a guidance tool. While this survey is voluntary, your response is greatly
appreciated. Any questions or comments can be directed to Karalyn Clouser at (406) 529-0654 or via
email at [email protected].
Q1. Does your agency now or has it used an SSI/WSI in the past?
• Yes
• No
Q2. Whether or not your agency already uses an SSI/WSI, please describe what your ideal severity index
would be like, how would it be used? (For example, would you like it to be able to capture certain
weather phenomena? Would you like it to be very specific and data intensive, or broader and more ‘big
picture’? Would it have a specific end use?)
Q3. Do you feel you and or your agency could use support in the development or advancement of a
WSI/SSI?
• Yes, please explain ________________________________________________
• No
Q4. Please provide your contact information so we may follow up on any questions.
• Name ________________________________________________
• Agency/Organization ________________________________________________
• Telephone ________________________________________________
• Email ________________________________________________
Q5. How is the SSI/WSI used at your agency?
• For maintenance performance measurement

156
• For agency operations (please explain)
________________________________________________
• I am a researcher, and I developed a severity index for: (please explain - academic purposes, an
agency, etc.) ________________________________________________
• Other, please explain ________________________________________________
Q6. Generally speaking (we will go into specifics in the following questions), does the severity index you
use currently meet your needs? How or how not?
• Yes, please explain ________________________________________________
• No, please explain ________________________________________________
• Yes, but here are some things I like about it and some things I don't (please explain)
________________________________________________
Q7. Is there available literature—publication(s), an internal report, or documentation of procedures—
that describes the SSI/WSI you currently use? (If you would like to share the document now you may
email it to [email protected] or upload documents 100 MB or less on the next page.)
• Yes
• No
Q8. Available literature—publication(s), an internal report, or documentation of procedures—that
describes the SSI/WSI you currently use (upload using the button below for documents 100 MB or less)
Q9. If the SSI/WSI you use has been altered from the way it is described in the publication, or if you need
to add detail, please explain.
Q10. Which of the following variables are used in the SSI/WSI calculation?
• Air temperature
• Pavement temperature
• Dewpoint temperature
• Wet-bulb temperature
• Visibility
• Wind speed (maximum/gust, minimum, or average)
• Friction, grip
• Road surface condition
• Snow depth, precipitation
• Blowing snow
• Vertical temperature profile
• Freezing rain
• Ice presence
• Radiation or heat fluxes
• Traffic Variables
• Elevation
• Other, Additional Comments (please explain)

157
Q11. Please comment on the data sources you use to get this data. For example, is RWIS the sole source
of the data, or do you use multiple sources?
Q12. Please describe how the SSI/WSI is calculated—either by writing out the equation or describing it.
Q13. Is the SSI/WSI calculated statewide or on a smaller scale?
• Statewide
• Regionally, by Maintenance District
• Maintenance Shed or garage
• At as single point (For example, at each RWIS)
• Other, please explain or add additional comments
Q14. When is the WSI calculated?
• Real-time
• Post-storm
• Post-season
• Other, please explain or add additional comments
Q15. Do the variables and calculation you use work for every weather scenario you wish to capture?
Please discuss the ways in which it does and does not work for your agency’s purposes.
Q16. The following are questions about specific weather and climatic phenomena.
Q17. If applicable to your climate, have you been successful at capturing freezing rain in your WSI?
• Yes (please explain) ________________________________________________
• No (please explain) ________________________________________________
Q18. If applicable to your climate, have you been successful at capturing effects of very cold
temperatures (<15°F)?
• Yes (please explain) ________________________________________________
• No (please explain) ________________________________________________
Q19. Have you attempted to incorporate current pavement conditions (i.e., existing snow or ice on the
road) when a new storm arrives?
• Yes (please explain) ________________________________________________
• No (please explain) ________________________________________________
Q20. Have you successfully included a “duration” term (length of storm event) in your calculation?
• Yes (please explain) ________________________________________________
• No (please explain) ________________________________________________
Q21. Have you run into issues regarding differing climate zones across your state? If so, how have your
dealt with that? Please explain.
• Yes (please explain) ________________________________________________

158
• No (please explain) ________________________________________________
Q22. Are you able to capture traffic impacts in your agency’s SSI/WSI?
• Yes
• No, but my agency does NOT wish to be able to capture traffic impacts.
• No, and my agency does wish to be able to capture traffic impacts.
Q23. Please share any lessons you have learned throughout the development and/or use of the SSI/WSI
at your agency.
Q24. Whether or not your agency already uses an SSI/WSI, please describe what your ideal severity
index would be like, how would it be used? (For example, would you like it to be able to capture certain
weather phenomena? Would you like it to be very specific and data intensive, or broader and more ‘big
picture’? Would it have a specific end use?)
Q25. Do you feel you and or your agency could use support in the development or advancement of a
WSI/SSI?
• Yes, please explain ________________________________________________
• No
Q26. Please provide your contact information so we may follow up on any questions.
• Name ________________________________________________
• Agency/Organization ________________________________________________
• Telephone ________________________________________________
• Email ________________________________________________

159
Appendix C. Task 2 Survey Results
The survey was housed on Montana State University’s Qualtrics survey site and was active August 1 to
August 14, 2019. Forty-one (41) responses were received during this time. Of these, 19 responses
contained only one answered question—“No” was selected in answer to the question, “Does your
agency now use, or has it used an SSI/WSI?”—and then the survey was submitted. Thus, the remainder
were 22 substantive responses, meaning detailed answers were provided. Of the 22, four (4) were
duplicated from the same agency; thus, a total of 18 agencies actually supplied substantive responses.
Only the substantive responses are included in the analysis.
Responses came largely from state agencies, with one (1) local jurisdiction and one (1) research
organization responding. Responses were logged from the following 18 agencies:
• Arizona DOT
• Delaware DOT (2 responses)
• Iowa DOT
• Kansas DOT
• Massachusetts DOT
• Minnesota DOT
• Montana DOT
• New Hampshire DOT (2 responses)
• North Dakota DOT
• Ohio DOT
• Pennsylvania DOT (2 responses)
• South Dakota DOT
• Utah DOT (2 responses)
• Vermont Agency of Transportation
• West Virginia DOT
• Wisconsin DOT
• Town of Lexington, Massachusetts, Public Works
• National Center for Atmospheric Research
It should be noted that the response rate for this survey was lower than expected, particularly given the
wide national and international distribution of the call to respond. Suspected reasons for the low
response rate will be discussed in the Conclusions section.
Agencies without WSI
Of the 22 substantive responses, 5 said they did not currently have or use a WSI at their agency. When
asked to describe ways they would like to use their WSI if their agency did have one, the responses
included:
• Help to show long-term weather patterns;
• Use non-invasive pavement sensors for improved data input;

160
• Use in performance measurement of snow removal operations;
• Use in a predictive mode to plan what type of weather event the agency can expect; and
• Use in a broader, “big picture” manner first, and, if found useful, work to make it a more
precise, data-intensive product.
There were two ideas for how agencies without WSI would like to initiate a WSI program: (1) adopt a
product that is already developed that they can easily implement, and (2) build something specific to
their agency from scratch. Implicit in the responses is the need for other agencies or prior work to
provide assistance in development. This highlights the importance of agencies and research efforts (this
project included) to be open with their methods, results, successes and challenges. The discussion below
will highlight some opinions from agencies that do already use a WSI, showing that there are still ways in
which they would like to improve their methods. Again, learning from each other is an important way to
accomplish these goals.
Agencies with WSI
Of the 22 substantive responses, 13 said they currently do have or use a WSI. Of these, all but one was
state transportation departments; the other a research organization, the National Center for
Atmospheric Research (NCAR). Thus, for an operational perspective, the 12 agencies are discussed
herein. Most (11) reported that they use a WSI for maintenance performance measurement. Specified
reasons provided in addition to performance measurement include:
• Assessing environmental metrics,
• Tracking salt use and budgeting,
• Resource and expense justification,
• After action reviews,
• Seasonal summaries,
• Allocating funds post-season, and
• Public relations.
When asked if the WSI generally met the needs of the agency, six (6) out of 12 responded “Yes,” four (4)
responded “No,” and two (2) responded “Yes, but there are some things I like about it and some things I
don’t.” When asked to explain their selection, some of the “Yes” responses were that the agencies find
good correlation between performance and WSI, that storm-specific analyses can be done, that seasonal
analyses can be done to compare with prior seasons, and that the utility improved when the WSI
methodology switched to an objective (rather than subjective) data collection system. Even among the
“Yes” responses, there were concessions that the algorithm has faults, and only works as well as the
data that feeds it, yet still provides the agency with a useful tool.
The reasons given by agencies which reported that their WSI did not meet their needs included: (1) that
the WSI was developed by others and did not meet the specific nature of their state, (2) that it was
unable to capture icing or freezing rain, and (3) that the external body who initially supported the
agency’s WSI no longer does.
The agencies which stated that there were some things they liked and some things they didn’t like about
their WSI entered the following comments: they would like more sites at which to calculate the index,
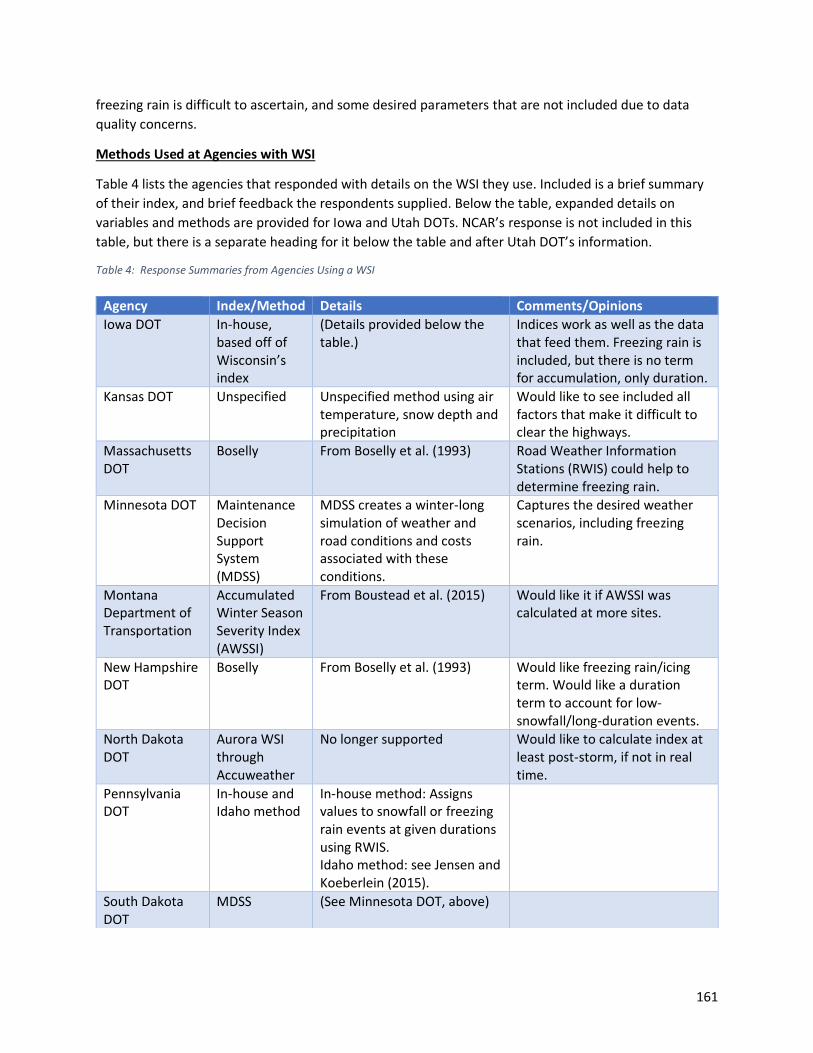
161
freezing rain is difficult to ascertain, and some desired parameters that are not included due to data
quality concerns.
Methods Used at Agencies with WSI
Table 4 lists the agencies that responded with details on the WSI they use. Included is a brief summary
of their index, and brief feedback the respondents supplied. Below the table, expanded details on
variables and methods are provided for Iowa and Utah DOTs. NCAR’s response is not included in this
table, but there is a separate heading for it below the table and after Utah DOT’s information.
Table 4: Response Summaries from Agencies Using a WSI
Agency Index/Method Details Comments/Opinions
Iowa DOT In-house, based off of Wisconsin’s index
(Details provided below the table.)
Indices work as well as the data that feed them. Freezing rain is included, but there is no term for accumulation, only duration.
Kansas DOT Unspecified Unspecified method using air temperature, snow depth and precipitation
Would like to see included all factors that make it difficult to clear the highways.
Massachusetts DOT
Boselly From Boselly et al. (1993) Road Weather Information Stations (RWIS) could help to determine freezing rain.
Minnesota DOT Maintenance Decision Support System (MDSS)
MDSS creates a winter-long simulation of weather and road conditions and costs associated with these conditions.
Captures the desired weather scenarios, including freezing rain.
Montana Department of Transportation
Accumulated Winter Season Severity Index (AWSSI)
From Boustead et al. (2015) Would like it if AWSSI was calculated at more sites.
New Hampshire DOT
Boselly From Boselly et al. (1993) Would like freezing rain/icing term. Would like a duration term to account for low-snowfall/long-duration events.
North Dakota DOT
Aurora WSI through Accuweather
No longer supported Would like to calculate index at least post-storm, if not in real time.
Pennsylvania DOT
In-house and Idaho method
In-house method: Assigns values to snowfall or freezing rain events at given durations using RWIS. Idaho method: see Jensen and Koeberlein (2015).
South Dakota DOT
MDSS (See Minnesota DOT, above)

162
Iowa DOT’s Index
Iowa DOT’s calculation is as follows:
Index 3 = 10 / 57.0 * (#Wet Snow events + #Dry Snow events) +
5.9 / 9.0 * #Freezing Rain events +
8.5 / 58.0 * snowfall in inches +
9.4 / 1125.0 * (hours of Wet Snow + Hours of Dry Snow +
Hours of Mixed Precip + Hours of Freezing Rain +
Hours of Blowing Snow + Hours of Sleet) –
0.25 * (wsind + mpind + frind + sind) +
0.5 * (dsind + bsind)
Where wsind, mpind, frind, sind, dsind, and bsind are defined as follows:
wsind = average of lowest temps during Wet Snow events – 29.6
mpind = average of lowest temps during Mixed Precip Events – 30.22
frind = average of lowest temps during Freezing Rain events – 26.42
sind = average of lowest temps during Sleet events – 29.52
dsind = 0.069*(average of lowest temps during Dry Snow events – 20)^2
bsind = 0.069*(average of lowest temps during Blowing Snow events – 20)^2
Utah DOT’s Index
Utah DOT calculates the Winter Road Weather Index (WRWI) and the Storm Intensity Index (SII). The
WRWI assigns pre-determined numerical values to the following categories:
1. Road condition value (using road condition or grip)
Utah DOT In-house (Details provided below the table.)
There are a few issues with the algorithm and data, but it overall works well for UDOT. Would be nice if it could be calculated at more places; hope to use connected vehicles/ mobile observations to help close data gaps in the future.
Vermont DOT Have trialed Idaho method and AWSSI, among others
Have found that indices developed by others fail to meet the specificities of Vermont.
Wisconsin DOT In-house Seasonal calculation including number of snow events, number of freezing rain events, total snow amount, total storm duration and special incidents from operator storm reports in each county.
No surface information. Recommends not using human-based information because of bias. Freezing rain may be overestimated using this method.

163
2. Snowfall rate value (using snowfall rate derived from visibility sensors)
3. Road temperature value (using road temperature data)
4. Blowing snow value (using wet-bulb temperature and wind gust)
5. Freezing rain value (using precipitation, wet-bulb temperature, and road temperature)
The data are obtained from RWIS, and the index is calculated at each RWIS.
The SII is an index used to better reflect maintenance performance. It removes the road condition
value from the WRWI. The SII feeds into UDOT’s Snow and Ice Performance Measure.
NCAR’s Survey Response
Dr. Curtis Walker at NCAR has worked with the Nebraska and Colorado DOTs in WSI development.
The Nebraska DOT WSI is described in Walker (2018). A brief synopsis is provided here.
Using ASOS observations, a categorical severity ranking was created, ranging from Category 1 (trace,
low impact storms, no winter maintenance operations activity) to Category 6 (high, significant
impact storms, maximum winter maintenance operations activity with possible suspensions
necessary due to safety concerns). A breakdown of the variables by category is shown below (Figure
35).
Figure 1: Variables and WSI categories and values developed for Nebraska DOT.
Weights for each variable were developed using expert opinion, and the final category was
calculated as the sum of each weighted variable category. The final NEWINS calculation is:
NEWINS can be computed statewide or district by district.
In his survey response, Dr. Walker provides the following feedback regarding the WSI he has
developed: “I like that it classifies and quantifies the accumulated impact of individual storms over
an entire winter season; however, there are parameters missing. These include road pavement
temperature due to concerns regarding data fidelity/quality. Further, freezing rain/sleet is not
164
presently considered due to difficulty in confirming ice accretion on roadway surfaces rather than
elevated trees/powerlines/ASOS equipment.”
The research team plans to follow-up with both Nebraska and Colorado DOTs to learn more about
the implementation of these indices.
Dr. Walker also included the following general advice: “These indices are best developed for
individual states. While some frameworks provide flexibility and are transferable to other areas they
may still need to be tuned or tailored to things like state DOT districts, regions, or other areas of
responsibility.”
It is worth noting that there was not a fully inclusive response to the survey. Agencies that did not
respond, but which are known to use a WSI, were contacted during Task 3 for details on their
methodology and data.
There was no notable trend found in spatial and temporal aspects of the methods used among the
agencies listed in Table 4. A range of spatial scales was reported over which WSIs are calculated: at the
RWIS, garage, county, district, or statewide levels. Those methods which are calculated using RWIS or
other weather station data—such as Utah DOT’s and the AWSSI (Boustead et al., 2015)—will usually be
considered valid at that spot, though the results will likely reflect onto the nearest shed or district.
Pennsylvania DOT’s in-house method calculates WSI at the county level using RWIS data, but assigns
representative RWIS stations to counties that do not have one within their borders.
Temporally, post-storm and post-season analyses are most common, but this also depends upon the
data source. Automated data sources (e.g., RWIS), provide the opportunity for calculating WSI in real
time. Survey responses reveal that real-time methods are viewed as desirable for real-time maintenance
performance feedback and operational decision making.
In terms of common variables, there are two that are used in nearly every index: air temperature and
snowfall (amount, duration, intensity, etc.). Road temperature was, for some respondents, not used
because of data fidelity concerns. Wind is used to describe the extent of blowing and drifting, but was
used less often, particularly for those indices based on operator reports. Utah DOT uses meteorological
principles to estimate weather conditions using wet-bulb temperature, which can be used in conjunction
with other variables to estimate precipitation type.
Special Weather Scenarios
The research team asked survey recipients to comment on their experiences capturing the following
weather scenarios in their indices: freezing rain, effects of extreme cold (i.e., <15°F), existing road
conditions prior to a storm, storm duration, and differences in climate across an agency’s jurisdiction.
Responses received for each are summarized in this section. Other weather scenarios found difficult to
represent with WSI, as mentioned by respondents, are blowing/drifting snow and identifying the
differing effects of warm snow versus cold snow.
Freezing Rain
Freezing rain is frequently listed as a weather concern which is not well represented in the WSI. One
responded noted that freezing rain is part of the index, but the intensity of the freezing rain is not well
captured, and so very light or very heavy ice events are treated equally. Those who have found success

165
have done so using the following data sources: human observation, precipitation type and road
temperature data together, precipitation with wet-bulb and road temperature data, or weather models.
Dr. Walker pointed the research team to an ice accretion method described by Sanders and Barjenbruch
(2016). The details of this research are described above in Appendix A, Table 1.
Extreme Cold
When seeking to capture the increased difficulty of snow and ice mitigation due to very cold
temperatures (i.e., <15°F), respondents noted that they have found success by assigning greater weight
to colder temperatures. One noted that the Boselly index, having three separate temperature terms,
captures the severity of very cold pretty well.
Pre-existing Road Conditions
Some agencies may wish to capture existing road conditions prior to a new weather event, as one storm
coming on the heels of another would stress agency resources, alter mitigation strategies, and initiate
the storm with an elevated severity score. Agencies using MDSS report success in using this data, since
road conditions feed into the road model. Many calculations only rely on atmospheric conditions and
lack a pavement component altogether. Often, this is because making the calculation more data
intensive is undesirable, or because road condition data from RWIS has quality issues.
Storm Duration
Duration is another desirable factor in assessing severity. Many calculations include a duration term,
adding severity points for longer storms. It can also be difficult to determine the end of one event and
the beginning of the next, and some respondents reported using a set hourly limit between precipitation
(e.g., a 4-hour break in precipitation would mark the end of the previous event). Blowing snow after
precipitation ceases effectively adds to the length of an event, and this has been considered in a few
indices.
Climatic Differences across Jurisdiction
Because Strong et al. (2005) developed different severity models for different climate zones—mountain,
valley and plains—the research team was curious to see whether agencies had found difficulty in using a
singular index across different climate zones across their jurisdictions, or whether they had put a Strong
et al. (2005) strategy to use. None reported using Strong et al.’s method or any specific calculation
method to differ between climate regions. Respondents noted that they simply view the index results
through different contexts, based on known differences in climate across their jurisdiction. That is, if
they can compare the index at a singular location with historical indices there to get a handle on the
relative severity, rather than comparing it to another location which may always score more or less
severe climatologically. Another noted strategy was to find the weather station in the most
representative location to provide the data. There was no notable correlation between agencies that
responded to this question and the complexity of their geography; that is, nearly all agencies must make
this consideration when assessing severity on a spatial scale.
Shared Lessons Learned
166
The survey asked respondents to share any lessons their agency has learned through the process of
seeking or developing a WSI. The following list summarizes the replies (lightly edited for contextual
clarity):
• The WSI does a good job of representing severity and has been a valuable tool for helping to
explain performance and cost. Many replies had this sort of sentiment.
• Due to the need for motorist safety, light winters do not always correlate to lower costs.
Sometimes a low snowfall storm costs as much as a high snowfall storm because of duration.
All storms regardless have an initial response cost.
• Our WSI does not always reflect how bad the winter is due to ice and freezing rain not being
accounted for.
• WSI needs to be able to capture individual storms, ideally in real time, but at least immediately
after a storm. WSIs that require winter to be over do not mean much; these indices need to be
gathered for several seasons before the numbers start to mean anything.
• Our algorithm is constantly being updated and refined each season. One problem that we have
encountered is that the pavement condition sensor only points at a 5-sq-ft section of roadway,
and if a snow drift comes across that section it reports that the road is snow-packed even
though the majority is not.
• Don't use self-reported data--too much opportunity for errors and biases to creep in.
• We cannot blindly use an SSI developed by another state due to the differences in the snow and
ice control plans and resources available.
• These indices are best developed for individual states. While some frameworks provide
flexibility and are transferable to other areas they may still need to be tuned or tailored to
account for different districts, different weather regimes, different data availability.
• Success has been found using different indices for specific parts of winter operations. That is,
different weather regimes have different impacts on an agency. For example, a cold blizzard
would have a larger impact on labor, equipment and traffic, but less so on salt for what a
severity score might imply.
• Our WSI did not take into account all of the factors that can make it difficult to clear the
highways. It needs to be a measure of the effort needed to meet a given level of service. It will
take a crew longer to reach level of service if the road is cold and the precipitation is freezing
rain compared to a road that is warm with a dry snow. We need to be able to quantify the
effects and the reason why one takes longer than the other.
• It is very difficult to get all to agree on what you really want to capture or the goals you want to
reach with an index. Talk early and often with all levels of staff to try to define what the goals
really are.
The Ideal WSI: Opinions on How to Get There
Survey recipients were asked to describe what their ideal severity index would be. A summary (not a
direct copy) is provided below. Note that the responses are specified to the sort of index these agencies
167
may already have or desire to have, but some of the ideals can be viewed as applicable to nearly any
agency’s goals.
• A weather event should be marked as a distinct event, and the event’s duration needs to be
considered. Since weather station data does not provide this directly, there has to be a way to
make this determination.
• We would like to better capture the intensity of an event. A few hours of intense precipitation
that trails off to a flurry is very different than one that snows steadily, even if they end up with
the same number of hours and the same snow total.
• We would like to capture ice and freezing rain along with everything we currently collect.
• We would like a WSI that accounts for blowing or drifting snow, surface temperature impact and
existing conditions at the start of an event (such as the transition between two event periods).
• We would like our WSI to capture all of the roadway, not just the area where the RWIS stations
are located. We are interested in the potential for connected vehicles to provide data between
RWIS in the future.
• Instrumentation reading errors cause problems with our index, and so, in an ideal index, all data
would be trustworthy.
• Ideally, the subjectivity would be removed from the data and data gathering process
• Our index works for us, though we realize there are things we could add to enhance it. Maybe
pavement temperature or even atmospheric temperature would enhance it, but we'd have to
study that.
• We currently do not use RWIS in our index and doing so would likely improve it.
• Having access to two different models would be ideal: one for determining the difficulties of the
winter weather (including freezing rain and ice), and one for measuring our performance (using
grip as an indicator), with a change for our expected level of service based on resources
available.
• We envision several indices accessed with a drop-down menu and including big-picture
methods, such as the NWS Winter Storm Severity Index and the AWSSI, to more microscale road
weather index methods.
• We would prioritize the following features in our ideal index:
o Uses the same weather variables
o Output is based on labor, materials and equipment
o Uses individual plow sections
o Not normalized – reflects costs as entered by DOT, can vary area to area and year to
year
o Objective – not influenced by agency response to events
o Flexible – can be used for varying time periods, day to day, month to month, year to
year, winter to date, region to region, etc.
o Scalable – results can be shown as statewide, maintenance area, sub-area, truck station
or plow route

168
o Relatively easy – e.g., if you want to compare costs of maintenance, it can become more
difficult as you have to use actual costs, differing level of service across areas, different
material costs in different parts of the state, etc.
o We would like to use it in the following ways:
Provides costing information to make business decisions
Compare against cost data from maintenance management systems and/or data
recorded using automated vehicle location systems; to see difference between
actual costs and theoretical costs
Efficiency indicator
Can run past winters’ data to show cost of new practices or products; what-if
scenarios
Can show cost of increasing or reducing level of service in similar weather
conditions
Can be used to develop and verify best practices
These respondents highlight some key points. The inclusion of non-weather terms that impact severity
(such as duration) is important. Including the nature of the weather—such as intensity (not just yes/no
precipitation) or associated wind—helps to improve the severity estimation, as well. Understanding the
environment in which the precipitation is falling—pre-existing road snow, cold or warm roads, etc.—is
also desired. Indeed, it is a simpler and (potentially) less error-prone calculation when only atmospheric
data is involved (i.e., excluding pavement data), and an agency can certainly benefit from performing
this sort of analysis; yet this methodology also neglects to account for the central nature of the road
weather severity analysis.
Some respondents have mentioned the benefits that would be gained from having access to multiple
indices which provide a range of severity assessments, from broad-scale to microscale, or from a traffic
view to a maintenance/cost view, and so on. Finally, human observation can provide critical information
that weather stations are often unable to; yet objective data sources were often viewed as preferable in
order to keep the information unbiased.
Ten (10) respondents replied that they could use support in the development or advancement of a WSI.
For those using pre-existing indices developed outside the agency, this often requires either working
directly with researchers or developing parallel tools or equations that better fit the agency’s needs.
Comments entered by respondents follow (edits performed to protect anonymity):
• We like the AWSSI and would like to have more sites.
• A number of critical projects are based on current WSI, so any change would need to be
evaluated and correlated by providing past WSI info to compare.
• Our agency is an MDSS pooled fund state. We are working with our contractor to include a WSI
tool and formula in MDSS in the near future. The new WSI will be based on the Clear Roads WSI.
• We are always looking to improve at our agency. This research will be valuable in that effort.
• We are excited to see the completed research on this topic that the research group is tackling.
169
• Research experience in developing indices for state DOTs; identified research funding for future
joint endeavors.
• It is always great to see what other agencies and organizations are doing.
One respondent offered the following advice in developing or modifying your WSI: Involve and engage
the right people from the beginning—upper management, maintenance decision makers and weather
experts (meteorologists). What’s needed to get started? Clearly define what your goals/objectives are.
International Severity Index Methods
One initial finding of this research is that, while WSI is a technique that is used internationally, it is used
at a greater occurrence and with greater variety in the United States compared to other countries.
When the research team failed to received responses to the survey from international agencies, the
team asked Rick Nelson (AASHTO’s SICOP coordinator) for assistance, and he contacted SICOP’s
European and Asian colleagues.
Direct responses were received from France and Finland. The research team also contacted Ministries of
Transportation in Alberta and Ontario, Canada; each agency was highlighted in the work done by
Matthews et al. (2017a, b). Norway was also contacted directly; a Norwegian representative responded
that the Norwegian Public Roads Administration has included developing a WSI in their 2018-2022
“Action Plan Winter Operations.” He reported that initial work has been done, but there is nothing to
report at present. Detailed information on Denmark’s WSI was found in the Snow and Ice Databook
2018. Germany also had a description of a WSI in the Snow and Ice Databook 2018, but it was not
detailed enough to include here, and information from Germany will be sought by the research team.
The following subsections describe information gathered on WSIs used in France, Finland, and Denmark.
The countries report using their indices to track long-term winter weather trends or evaluate usage of
salt compared to severity.
France
France has developed a severity index they call the Winter Viability Index (L'Index Viabilité Hivernale,
IHV). Its calculation begins by separating winter storms into a categorical system of classes. The steps
between classes are demarcated using parameters defined by set thresholds in minimum air
temperature and precipitation (accumulated over a day or night). The meteorological parameters used
to assign a class are:
• P0: minimum low temperature (Tn; less than 5°C, 41°F)
• P1: occurrence of snow (N>0)
• P2: nighttime precipitation (RRn; from 6 pm the day before to 6 am the day of) with a low
minimum temperature (less than 1°C, 33.8°F)
• P3: daytime precipitation (RRj; from 6 am to 6 pm) with a low maximum temperature (Tx; less
than 3°C, 37.4°F)
The weather variables are pulled from the weather station network shown in Figure 36.
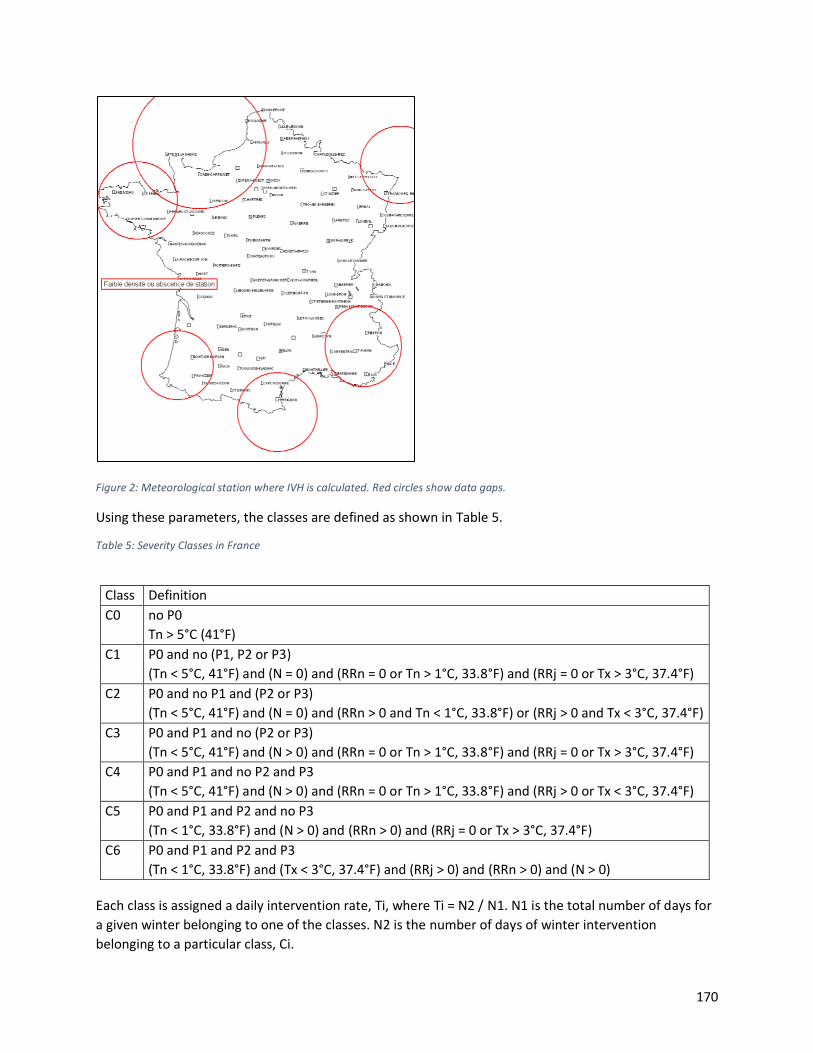
170
Figure 2: Meteorological station where IVH is calculated. Red circles show data gaps.
Using these parameters, the classes are defined as shown in Table 5.
Table 5: Severity Classes in France
Class Definition
C0 no P0
Tn > 5°C (41°F)
C1 P0 and no (P1, P2 or P3)
(Tn < 5°C, 41°F) and (N = 0) and (RRn = 0 or Tn > 1°C, 33.8°F) and (RRj = 0 or Tx > 3°C, 37.4°F)
C2 P0 and no P1 and (P2 or P3)
(Tn < 5°C, 41°F) and (N = 0) and (RRn > 0 and Tn < 1°C, 33.8°F) or (RRj > 0 and Tx < 3°C, 37.4°F)
C3 P0 and P1 and no (P2 or P3)
(Tn < 5°C, 41°F) and (N > 0) and (RRn = 0 or Tn > 1°C, 33.8°F) and (RRj = 0 or Tx > 3°C, 37.4°F)
C4 P0 and P1 and no P2 and P3
(Tn < 5°C, 41°F) and (N > 0) and (RRn = 0 or Tn > 1°C, 33.8°F) and (RRj > 0 or Tx < 3°C, 37.4°F)
C5 P0 and P1 and P2 and no P3
(Tn < 1°C, 33.8°F) and (N > 0) and (RRn > 0) and (RRj = 0 or Tx > 3°C, 37.4°F)
C6 P0 and P1 and P2 and P3
(Tn < 1°C, 33.8°F) and (Tx < 3°C, 37.4°F) and (RRj > 0) and (RRn > 0) and (N > 0)
Each class is assigned a daily intervention rate, Ti, where Ti = N2 / N1. N1 is the total number of days for
a given winter belonging to one of the classes. N2 is the number of days of winter intervention
belonging to a particular class, Ci.

171
The IHV is equal to the sum of the daily Ti over a given time period.
Figure 37 shows the average IHV calculated across the country from 2000 to 2010. The winter severity
pattern matches well the climatological pattern of France. White areas are where data gaps exist.
Figure 3: Average IVH over the decade 2000-2010 across France.
Finland
Finland has two products they use to evaluate the harshness of winter:
1. A spatial calculation viewed country-wide or at province level, monthly or seasonally (Figure 38,
Figure 39, Figure 40). Based on hourly data:
a. Average temperature
b. Accumulated snowfall
c. Number of times temperature drops below freezing
Data can be compared to longer period average values.
2. On days when exceptionally heavy snowfall has occurred, events are logged in a calendar view.
There are two different categories:
a. More than 10 cm (3.9 in) over four hours
b. More than 5 cm (2 in) over four hours with temperature of -2°C (28.4°F) and 10 minutes
maximum wind greater than 8 m/s (17.9 mph)

172
Figure 4: Interface showing January 2019 snowfall contours over Finland compared to the average. This particular analysis shows that southeast Finland received greater snowfall during that month versus the climatological average.
Figure 5: Interface showing the exceptional snowfall calendar product for February 2019 in Etelä-Pohjanmaa province.

173
Figure 6: Interface showing the same data from Figure 39 (exceptional snowfall, shown in pink), but in a map view and on a single day.
Denmark
The Danish Road Directorate uses an index to define the severity of a winter related to winter
maintenance. The index is:
𝑉𝑖 = ∑ 𝑉𝑑𝑎𝑦
1 𝑀𝑎𝑦
1 𝑂𝑐𝑡
𝑉𝑑𝑎𝑦 = 𝑎(10𝑏 + 0.1𝑐 + 7𝑓 + 18𝑔) + 0.3𝑎, where:
a = days with road temperature below +0.5°C (32.9°F).
b = number of times the road temperature is below 0°C (32°F) while the road temperature is
below the dew-point temperature for a minimum period of 3 hours and with an interval of at
least 12 hours.
c = number of times the road temperature drops below 0°C (32°F).
174
f: Within a day, if precipitation was measured while air temperature was below freezing in a
total time of minimum: 30 minutes, f = 1; 90 min, f = 3; 270 min, f = 9; 420 min, f = 12.
g = 1 if and only if the road temperature is below freezing and at least 3 hours of reporting have
shown precipitation.
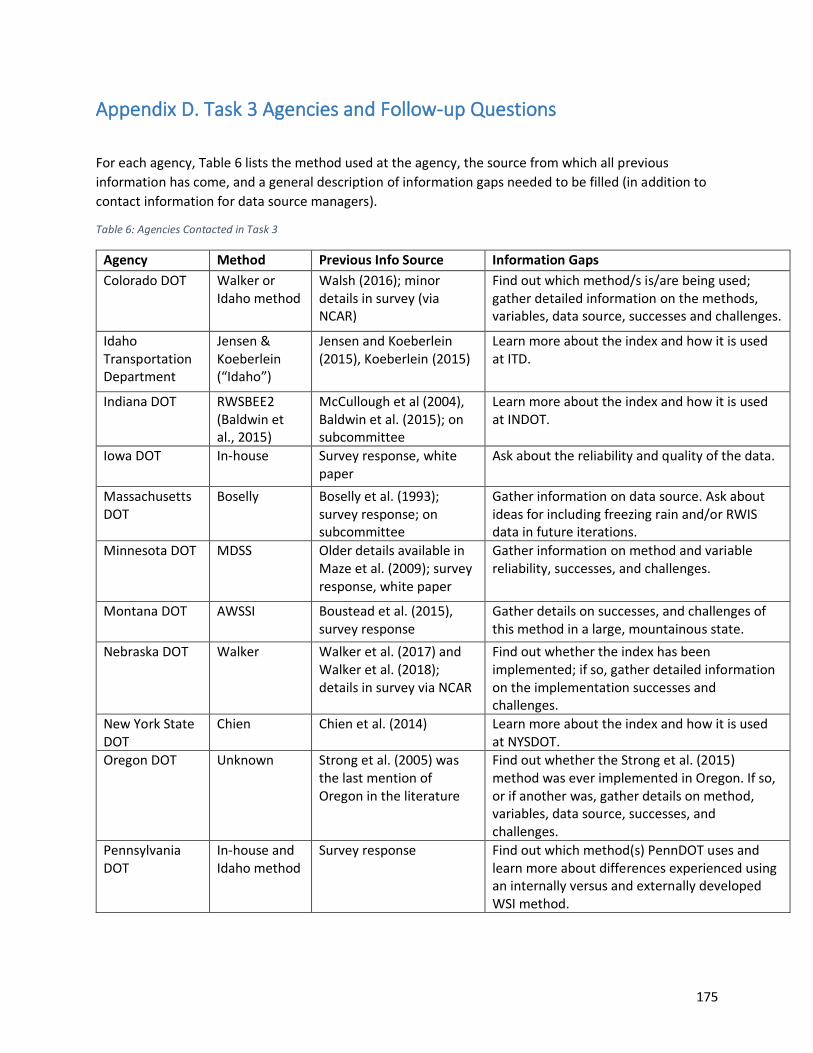
175
Appendix D. Task 3 Agencies and Follow-up Questions
For each agency, Table 6 lists the method used at the agency, the source from which all previous
information has come, and a general description of information gaps needed to be filled (in addition to
contact information for data source managers).
Table 6: Agencies Contacted in Task 3
Agency Method Previous Info Source Information Gaps
Colorado DOT Walker or Idaho method
Walsh (2016); minor details in survey (via NCAR)
Find out which method/s is/are being used; gather detailed information on the methods, variables, data source, successes and challenges.
Idaho Transportation Department
Jensen & Koeberlein (“Idaho”)
Jensen and Koeberlein (2015), Koeberlein (2015)
Learn more about the index and how it is used at ITD.
Indiana DOT RWSBEE2 (Baldwin et al., 2015)
McCullough et al (2004), Baldwin et al. (2015); on subcommittee
Learn more about the index and how it is used at INDOT.
Iowa DOT In-house Survey response, white paper
Ask about the reliability and quality of the data.
Massachusetts DOT
Boselly Boselly et al. (1993); survey response; on subcommittee
Gather information on data source. Ask about ideas for including freezing rain and/or RWIS data in future iterations.
Minnesota DOT MDSS Older details available in Maze et al. (2009); survey response, white paper
Gather information on method and variable reliability, successes, and challenges.
Montana DOT AWSSI Boustead et al. (2015), survey response
Gather details on successes, and challenges of this method in a large, mountainous state.
Nebraska DOT Walker Walker et al. (2017) and Walker et al. (2018); details in survey via NCAR
Find out whether the index has been implemented; if so, gather detailed information on the implementation successes and challenges.
New York State DOT
Chien Chien et al. (2014) Learn more about the index and how it is used at NYSDOT.
Oregon DOT Unknown Strong et al. (2005) was the last mention of Oregon in the literature
Find out whether the Strong et al. (2015) method was ever implemented in Oregon. If so, or if another was, gather details on method, variables, data source, successes, and challenges.
Pennsylvania DOT
In-house and Idaho method
Survey response Find out which method(s) PennDOT uses and learn more about differences experienced using an internally versus and externally developed WSI method.

176
Utah DOT In-house Farr and Sturges (2012), Williams et al. (2015); survey response, white paper
Gather information on data source and the practices UDOT employs in order to maintain high quality data (save for Task 4). Find out more about any plans UDOT has to use mobile data in their index.
Washington State DOT
"Frost Index" on subcommittee Gather information on method, variables, data source, successes, and challenges.
Alberta Ministry of Transportation
Matthews Matthews et al. (2017a) Find out whether the index has been implemented; if so, gather detailed information on the implementation successes and challenges.
Ontario Ministry of Transportation
Matthews Matthews et al. (2017b) Find out whether the index has been implemented; if so, gather detailed information on the implementation successes and challenges.
Germany, Federal Highway Research Institute
Unknown; insufficient details provided in references
Minor details in Badelt (2012), Snow and Ice Databook 2018
Gather information on method and variables used.
The research team developed a set of interview questions for the Task 3 agencies. The questions only
varied slightly depending on the degree of prior information the team had gathered during Tasks 1 and
2. The basic set of questions follows.
Overview questions
1. Are you currently using the WSI described in [REF]?
a. If yes, are there any changes from the way it is described?
b. If no, please provide details here or attach a publication that describes the
methodology.
2. How frequently is the WSI calculated (e.g., in real time, daily, post-storm, and/or post-season)?
3. Over what area is the WSI considered valid (e.g., at the RWIS/weather station, over a county or
district, and/or statewide)?
4. For what purpose is the WSI used at your agency?
5. What successes have you had with this method?
6. What challenges have you faced with this method?
Data source questions:
7. Is the source of the data [WHATEVER IT IS IN THE REF]?
OR (if not clarified in lit) What is the source of the data used in your WSI?
8. What entity is responsible for managing these data sources? Please provide contact info for the
relevant personnel who manage the devices (whether internal to your agency or external).
9. Are the data and devices managed and maintained sufficiently for their use in the WSI? What
practices are required to keep the data quality high?

177
Development questions
10. Where is the algorithm housed and who runs it and produces the results?
11. Were there certain groups within your agency or external to your agency that were recruited to
assist with building the WSI? Would you change who you brought to the table if you had to do it
again?
12. We’d like to understand how the data had to be processed to work with your WSI. Do you know
what programming methods were used to make the data readable by the WSI program? Were
there fixes that had to be done once the WSI was tested and implemented?
13. How has the core knowledge of the WSI been passed onto other agency employees? Have you
hosted internal workshops or trainings for key employees to be familiar with the WSI?
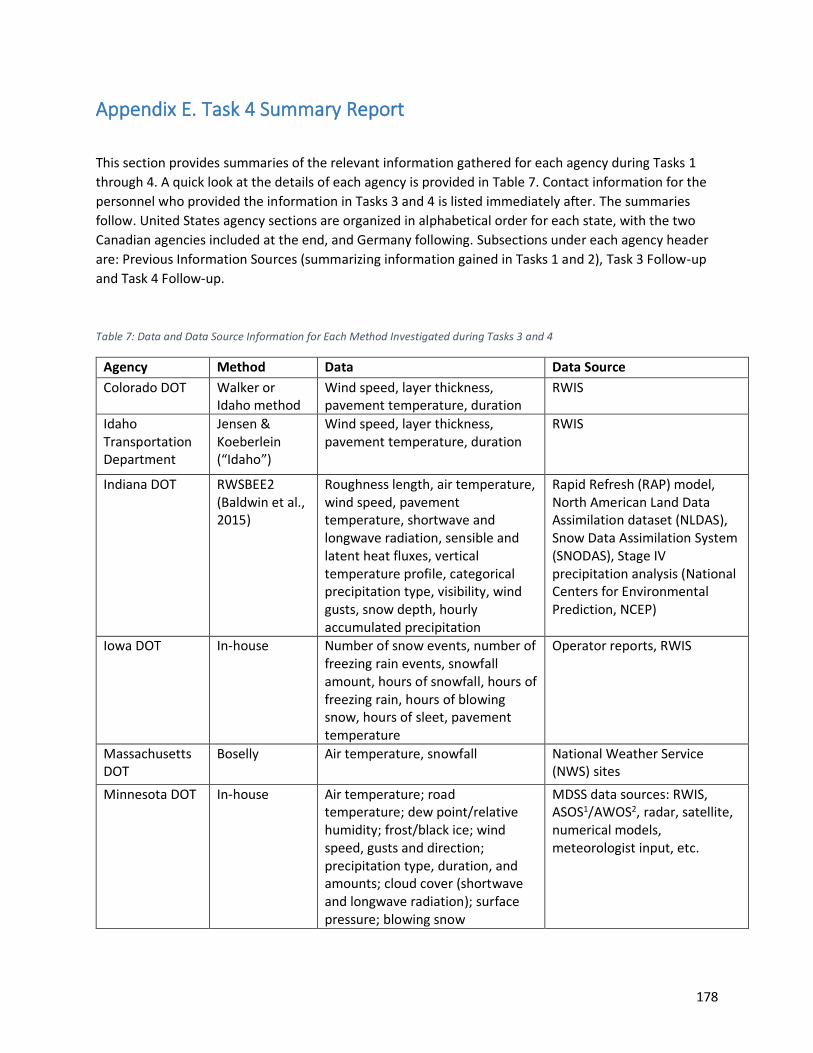
178
Appendix E. Task 4 Summary Report
This section provides summaries of the relevant information gathered for each agency during Tasks 1
through 4. A quick look at the details of each agency is provided in Table 7. Contact information for the
personnel who provided the information in Tasks 3 and 4 is listed immediately after. The summaries
follow. United States agency sections are organized in alphabetical order for each state, with the two
Canadian agencies included at the end, and Germany following. Subsections under each agency header
are: Previous Information Sources (summarizing information gained in Tasks 1 and 2), Task 3 Follow-up
and Task 4 Follow-up.
Table 7: Data and Data Source Information for Each Method Investigated during Tasks 3 and 4
Agency Method Data Data Source
Colorado DOT Walker or Idaho method
Wind speed, layer thickness, pavement temperature, duration
RWIS
Idaho Transportation Department
Jensen & Koeberlein (“Idaho”)
Wind speed, layer thickness, pavement temperature, duration
RWIS
Indiana DOT RWSBEE2 (Baldwin et al., 2015)
Roughness length, air temperature, wind speed, pavement temperature, shortwave and longwave radiation, sensible and latent heat fluxes, vertical temperature profile, categorical precipitation type, visibility, wind gusts, snow depth, hourly accumulated precipitation
Rapid Refresh (RAP) model, North American Land Data Assimilation dataset (NLDAS), Snow Data Assimilation System (SNODAS), Stage IV precipitation analysis (National Centers for Environmental Prediction, NCEP)
Iowa DOT In-house Number of snow events, number of freezing rain events, snowfall amount, hours of snowfall, hours of freezing rain, hours of blowing snow, hours of sleet, pavement temperature
Operator reports, RWIS
Massachusetts DOT
Boselly Air temperature, snowfall National Weather Service (NWS) sites
Minnesota DOT In-house Air temperature; road temperature; dew point/relative humidity; frost/black ice; wind speed, gusts and direction; precipitation type, duration, and amounts; cloud cover (shortwave and longwave radiation); surface pressure; blowing snow
MDSS data sources: RWIS, ASOS1/AWOS2, radar, satellite, numerical models, meteorologist input, etc.
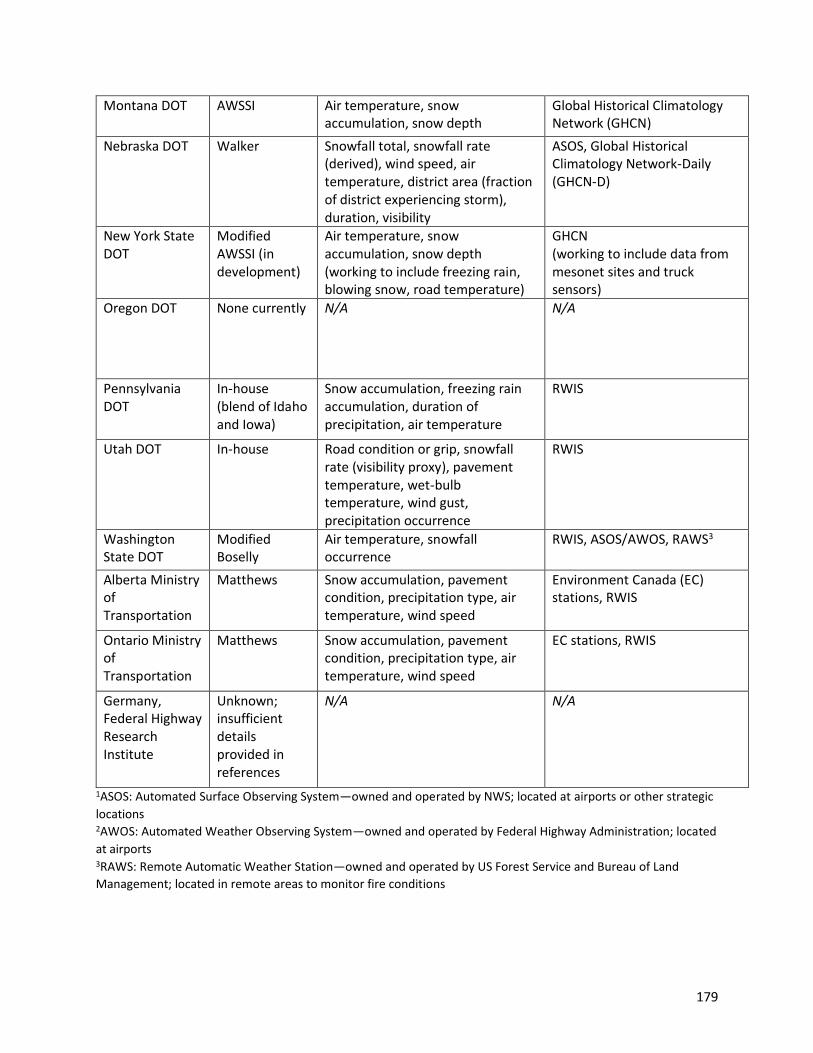
179
Montana DOT AWSSI Air temperature, snow accumulation, snow depth
Global Historical Climatology Network (GHCN)
Nebraska DOT Walker Snowfall total, snowfall rate (derived), wind speed, air temperature, district area (fraction of district experiencing storm), duration, visibility
ASOS, Global Historical Climatology Network-Daily (GHCN-D)
New York State DOT
Modified AWSSI (in development)
Air temperature, snow accumulation, snow depth (working to include freezing rain, blowing snow, road temperature)
GHCN (working to include data from mesonet sites and truck sensors)
Oregon DOT None currently N/A N/A
Pennsylvania DOT
In-house (blend of Idaho and Iowa)
Snow accumulation, freezing rain accumulation, duration of precipitation, air temperature
RWIS
Utah DOT In-house Road condition or grip, snowfall rate (visibility proxy), pavement temperature, wet-bulb temperature, wind gust, precipitation occurrence
RWIS
Washington State DOT
Modified Boselly
Air temperature, snowfall occurrence
RWIS, ASOS/AWOS, RAWS3
Alberta Ministry of Transportation
Matthews Snow accumulation, pavement condition, precipitation type, air temperature, wind speed
Environment Canada (EC) stations, RWIS
Ontario Ministry of Transportation
Matthews Snow accumulation, pavement condition, precipitation type, air temperature, wind speed
EC stations, RWIS
Germany, Federal Highway Research Institute
Unknown; insufficient details provided in references
N/A N/A
1ASOS: Automated Surface Observing System—owned and operated by NWS; located at airports or other strategic
locations 2AWOS: Automated Weather Observing System—owned and operated by Federal Highway Administration; located
at airports 3RAWS: Remote Automatic Weather Station—owned and operated by US Forest Service and Bureau of Land
Management; located in remote areas to monitor fire conditions

180
The personnel who were instrumental in the final rendition of the information are listed here, with
contact information of those who permitted its inclusion.
Alberta Ministry of Transportation
• Rhett Hardy – Highway Operations Technologist (780-427-5815, [email protected])
• Allan Bartman – Acting Director, Highway Operations (780-422-6431, [email protected])
• Beata Bielkiewicz – ITS Engineer
Idaho Transportation Department
• Steve Spoor – Equipment Fleet/Maintenance Services Program Manager
• Max Thieme – Winter Operations Program Specialist ([email protected], 208-334-
8560)
Indiana DOT
• Dr. Mike Baldwin – academic partner: Purdue University
Iowa DOT
• Tina Greenfield – RWIS Coordinator ([email protected], 515-233-7746)
Massachusetts DOT
• Mark Goldstein – Lead State Snow & Ice Engineer ([email protected])
• Bill Arcieri – consultant: Senior Water Quality Specialist, VHB
Minnesota DOT
• Jakin Koll – Road Weather Technology Regional Coordinator/Meteorologist
New York State DOT
• Joe Thompson – Snow & Ice Program Manager
• Ken Relation – Snow and Ice Assistant Program Manager
• Dr. Nick Bassill – Modeler and Meteorologist, SUNY Albany Center of Excellence in Atmospheric
and Environmental Prediction and Innovation and New York State Mesonet
Ontario Ministry of Transportation (MTO)
• Heather McClintock – formerly of MTO; currently Manager of ITS Solutions, Wood Consulting
Services
• Robert Mount – formerly Maintenance Design and Contract Standards Engineer
Oregon DOT
• Patti Caswell – Interim Maintenance Service Section Manager
• Ace Clark – District Manager, La Grande

181
Pennsylvania DOT
• Jason Norville – Winter Operations & Maintenance Materials Section Chief (717-787-7004,
• Vince Mazzocchi – AVL Program Manager (717-705-1439, [email protected])
• Jonathan Fleming – Maintenance Technical Leadership Division Chief
Utah DOT
• Jeff Williams – Weather Operations Program Manager ([email protected])
• Cody Oppermann – Weather Operations Program Specialist ([email protected])
Washington State DOT
• James Morin – Maintenance Operations Branch Manager
• Ken Rosenow – consultant: Director of Operations & Meteorologist, Weathernet/Narwhal
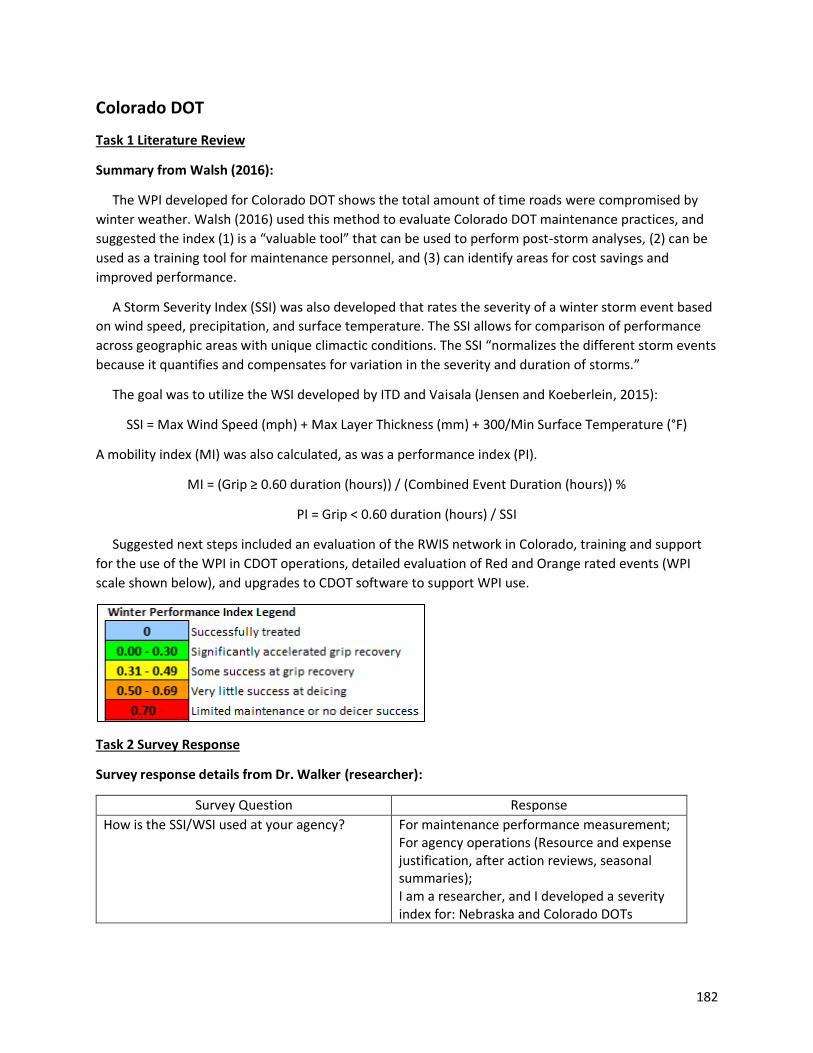
182
Colorado DOT
Task 1 Literature Review
Summary from Walsh (2016):
The WPI developed for Colorado DOT shows the total amount of time roads were compromised by
winter weather. Walsh (2016) used this method to evaluate Colorado DOT maintenance practices, and
suggested the index (1) is a “valuable tool” that can be used to perform post-storm analyses, (2) can be
used as a training tool for maintenance personnel, and (3) can identify areas for cost savings and
improved performance.
A Storm Severity Index (SSI) was also developed that rates the severity of a winter storm event based
on wind speed, precipitation, and surface temperature. The SSI allows for comparison of performance
across geographic areas with unique climactic conditions. The SSI “normalizes the different storm events
because it quantifies and compensates for variation in the severity and duration of storms.”
The goal was to utilize the WSI developed by ITD and Vaisala (Jensen and Koeberlein, 2015):
SSI = Max Wind Speed (mph) + Max Layer Thickness (mm) + 300/Min Surface Temperature (°F)
A mobility index (MI) was also calculated, as was a performance index (PI).
MI = (Grip ≥ 0.60 duration (hours)) / (Combined Event Duration (hours)) %
PI = Grip < 0.60 duration (hours) / SSI
Suggested next steps included an evaluation of the RWIS network in Colorado, training and support
for the use of the WPI in CDOT operations, detailed evaluation of Red and Orange rated events (WPI
scale shown below), and upgrades to CDOT software to support WPI use.
Task 2 Survey Response
Survey response details from Dr. Walker (researcher):
Survey Question Response
How is the SSI/WSI used at your agency? For maintenance performance measurement; For agency operations (Resource and expense justification, after action reviews, seasonal summaries); I am a researcher, and I developed a severity index for: Nebraska and Colorado DOTs

183
Generally speaking, does the severity index you use currently meet your needs? How or how not?
Yes, but here are some things I like about it and some things I don't: I like that it classifies and quantifies the accumulated impact of individual storms over an entire winter season; however, there are parameters missing. These include road pavement temperature due to concerns regarding data fidelity/quality. Further, freezing rain/sleet is not presently considered due to difficulty in confirming ice accretion on roadway surfaces rather than elevated trees / powerlines / ASOS equipment.
Do the variables and calculation you use work for every weather scenario you wish to capture?
They work for all snow-related events. They do not capture freezing rain events at this time.
If applicable to your climate, have you been successful at capturing freezing rain in your WSI?
No: Happy you asked this, freezing rain verification is challenging however I would direct you to the work of Barjenbruch and Sanders (2016) using an ice accretion/ASOS method
If applicable to your climate, have you been successful at capturing effects of very cold temperatures (°F)?
Yes: Each weather variable receives a weighted categorical assignment, air temperature being one of them
Have you attempted to incorporate current pavement conditions (i.e., existing snow or ice on the road) when a new storm arrives?
No: Difficulty in assessing pavement condition. Perhaps traffic camera data and/or a product like Harris Helios could inform this component
Have you successfully included a duration term (length of storm event) in your calculation?
Yes: Each weather variable receives a weighted categorical assignment, duration being one of them
Please share any lessons you have learned throughout the development and/or use of the SSI/WSI at your agency.
These indices are best developed for individual states. While some frameworks provide flexibility and are transferable to other areas they may still need to be tuned or tailored to things like state DOT districts, regions, or other areas of responsibility
Whether or not your agency already uses an SSI/WSI, please describe what your ideal severity index would be like, how would it be used? (For example, would you like it to be able to capture certain weather phenomena? Would you like it to be very specific and data intensive, or broader and more “big picture”? Would it have a specific end use?)
Both. I would envision several indices with multiple drop-down menus from the NWS Winter Storm Severity Index, to the AWSSI, to a more microscale road weather index

184
Task 3 Follow-up
See Task 3 Follow-up under Nebraska DOT.
Task 4 Follow-up
No additional comments were provided.

185
Idaho Transportation Department
Task 1 Literature Review
Summary from Jensen and Koeberlein (2015):
ITD developed the following Weather Performance Index (WPI), which rates the treatment
effectiveness to the storm (recovery time to safe grip).
WPI#1 = ice up time (hrs) / Storm Severity Index (WPI#2)
where ice up time is the duration of the event when the grip is below 0.60 for more than ½ hour, and
Storm Severity Index (WPI#2) = wind speed max (mph) + water equivalent layer max (mm)
+ 300/surface temp max (degrees F)
Index values of 10-80 usually are calculated for normal winter events. Calculated indices for storms
with severe cold and high winds can reach as high as 500.
This effort required a full RWIS overhaul statewide. ITD has a performance measure called RWIS
uptime that reports on the percent of time valid data is provided. Each foreman has at least one RWIS
site to use.
The Winter Performance Measures are automatically calculated and displayed on the Vaisala Winter
Performance Index Reports.
A cultural shift at ITD occurred with staff training and improvements in RWIS reliability, which
allowed for more structured storm responses driven by RWIS data and WPI calculations. Winter
Performance Measures are now used as a rating factor for annual employee performance reviews, with
pay increases linked to several factors including Winter Performance Measure results.
The Mobility metric, calculated using the WPIs, is used to establish statewide goals which are tracked
at the highway segment level. Training and other resources are provided to regions that need to
improve. From these efforts steady improvements have been observed over time. Since 2011 a 60%
improvement in mobility has been observed (measured as friction better than 0.6) during winter storms.
Additionally, more consistency between districts has resulted, with significant individual district mobility
improvements.
Summary from Koeberlein (2015):
Some weather events are exempt from the WPI scoring– for ITD this includes drifting and powder
snow events. Along these lines, the following weather events are modified in the WPI scoring –
hydroplaning, frost events leading into storms, drifting/powder snow events that adhere to the
roadway, fog that affects non-invasive sensor readings, and sensor errors.
Task 2 Survey Response
ITD did not submit a response to the Task 2 survey.
Task 3 Follow-up
The research team worked with Steve Spoor and Max Thieme to obtain the following information.

186
Overview questions:
1. Are you currently using the WSI described in Jensen and Koeberlein (2015)? Yes, as it is
described in the document attached.
a. If yes, are there any changes from the way it is described? No.
2. How frequently is the WSI calculated (e.g., in real time, daily, post-storm, and/or post-
season)? It is calculated for each identified storm event. A storm event starts when precipitation
is detected and the pavement temperature is below 32 degrees F. The storm event ends 2 hours
after precipitation is no longer detected on the pavement.
3. Over what area is the WSI considered valid (e.g., at the RWIS/weather station, over a county or
district, and/or statewide)? At each RWIS and the defined area of representation of the
RWIS. This could be anywhere from a mile in each direction or longer, depending upon the
topography.
4. For what purpose is the WSI used at your agency? To quantity our efforts at reducing ice across
a consistent scale.
5. What successes have you had with this method? Our performance metrics have improved each
year.
6. What challenges have you faced with this method? Time required to evaluate and to ensure
operations were evaluating the data to improve performance.
Data source questions:
7. What is the source of the data used in your WSI? RWIS data only.
8. What entity is responsible for managing these data sources? Please provide contact info for the
relevant personnel who manage the devices (whether internal to your agency or external). ITD
and Vaisala.
9. Are the data and devices managed and maintained sufficiently for their use in the WSI? What
practices are required to keep the data quality high? Yes.
Development questions:
10. Where is the algorithm housed and who runs it and produces the results? It is housed and
produced by Vaisala who provide the results via their Navigator website.
11. Were there certain groups within your agency or external to your agency that were recruited to
assist with building the WSI? Would you change who you brought to the table if you had to do it
again? Just Vaisala
12. We’d like to understand how the data had to be processed to work with your WSI. Do you know
what programming methods were used to make the data readable by the WSI program? Were
there fixes that had to be done once the WSI was tested and implemented? It was developed by
Vaisala using our formula.
13. How has the core knowledge of the WSI been passed onto other agency employees? Have you
hosted internal workshops or trainings for key employees to be familiar with the WSI? Yes.
Task 4 Follow-up
Notes from 10/2/2019 Follow-up Discussion with Steve Spoor and Max Thieme of ITD:
It took over 2 years to develop, test, and calibrate/validate the calculation method used by ITD.
The WSI has evolved over years. The original “basic” winter performance index (WPI) used - snow
fall, pavement temperature, layer thickness, and wind. (There is a caveat to their calculation method
187
for wind, such that if wind gusts are severe and/or wind speeds are sustained at high values within a
15 min. data collection cycle the WSI is thrown out for that data line, because the wind values throw
off the WSI too much. Otherwise wind does not really show much impact on the calculated WPI
(being used synonymously with WSI).)
The WPI has evolved and ITD now uses a more advanced calculation that looks at more data points.
ITD was able to modify the WPI because Vaisala automated the WPI calculation for them. This freed
up time and allowed them to tweak and play with the WPI to create the advanced calculation
method in house. Vaisala worked with ITD to incorporate their basic WPI into the data processing
they were already doing and reporting it along with all of the other data. This allowed the daily,
storm-by-storm WPI calculation to be automated which ITD feels led to success of the WPI use and
implementation. This also allowed ITD to have to time to modify their WPI to the more advanced
calculation method. ITD shared the advanced calculation with Vaisala, which is now automated and
reported by Vaisala.
Advanced calculation for WPI
ITD uses only RWIS data to calculate the WPI. Vaisala is the only provider for the 132 sites. Vaisala is
responsible for data. ITD has contractor, DTS that does calibration, maintenance, and testing. ITD
spends upwards of $100,000 for all sites and associated data and maintenance annually. ITD has
found their sensors require maintenance due to extreme conditions. Contractor fees include a
dispatch and travel time fee. The contractor is based in Boise so long travel times and fees occur.
Change the culture – ITDs old SSI system used pucks, and when they went down folks stopped using
the data. There was a lack of trust in the data, so no one used it. Then ITD started using Vaisala, the
improved quality and accuracy of the data really helped. ITD feel that when RWIS site are down it is
because folks aren’t looking or don’t care.
Max’s job is to check all sensors and cameras every day. Every site, every day! If a sensor is down,
they send an email to the contractor that day asking for a remote fix if possible. If a remote fix is not
possible then a service request is initiated that must be addressed within 72hrs. Max’s job title is
Winter Operations Program Specialist; keeping the RWIS sites up and running is a part of his job,
along with the analytics. His job metric includes keeping RWIS running 90% of the time. He sends
out monthly updates on the functional status of the RWIS network, to the ITD Scorecard on their
website, which is viewed by top brass and agency folks. These updates are most critical in winter.
Keeping the RWIS sites up and running became an agency goal not just part of his job.
How did they create the culture change? – The original WPI was created by one district engineer
when ITD had 68 RWIS sites. The district engineer felt strongly that what gets measured gets done.
He looked at data on his own, got buy in locally, notified top brass of what he was doing, and
worked on his own to validate the success of the WPI. Once this was all done, ITD adopted the WPI
as a statewide initiative. Then all other district engineers had to get on board. There is still some
push back from folks on this. This was not an overnight success story and has evolved over time.
They feel strongly that you need upper management buy-in to make it work.
What about buy-in from Maintenance – a couple years ago they did not have any buy-in from
maintenance in part because, a couple years ago maintenance did not trust the RWIS data. ITD

188
started to roll out a STORM 101, then 201, through 401 training programs to teach crews and
foreman how RWIS works, explaining what each value means in the data sets and how it is
measured, how salt application relates to the data, etc. They bring in pavement temperature pucks,
put them in freezer to make an icy surface, and then apply salt and look at the change in
readings/values being reported. Education was key to buy in. All of the developed training materials
were done in-house and have been shared with Clear Roads. (Team will follow up with Greg and CTC
to get copies of these and cross reference these materials in the final report).
Working with Vaisala: At first the WPI was calculated manually. (ITD defines a storm as when
precipitation starts/ends; because of this definition ITD gets thousands of storms year.) Vaisala
automated the calculation process for them. That was critical to the success of the program. ITD
feels strongly that you still need someone in-house checking the images and data to validate and
ground-truth it. Some events still trigger odd values – fog, sustained wind, really cold temps; here
you need to have a human come in and check the data and see how it is impacting the WPI. This is
critical for ITD because they rate shop performance based in part on WPI and they need to have
faith that it is accurately portraying their work and the conditions they responded too. This can be
time intensive, especially at first to look at all of the data. Now the advanced WPI method is
automated through Vaisala as well. ITD feels the partnership/benefit of working with Vaisala is well
worth the cost. Vaisala put their time and effort into adding WPI to their interface, and ITD can now
easier show the value as increased safety, mobility, savings from implementation of the WPI and
changes in winter operations. Any DOT can use the calculation tool if pay into Vaisala the system.
From a statewide management perspective, you need a statewide standard for all equipment; you
cannot hodgepodge the data; it is too convoluted.
189
Indiana DOT
Task 1 Literature Review
Summary from McCullough et al. (2004):
Predating the energy balance work reviewed below by Baldwin et al. (2015), the work by McCullough
et al. (2004) reviews the need for Indiana DOT to develop a weather severity index and the methods
developed and or used by various states at this time (Wisconsin, Washington State, the modified Hulme
(Hulme, 1982), and the SHRP Index). Based on the limitation in the identified weather severity index
calculation methods, one was developed for Indiana that incorporated weather data. Using National
Oceanic and Atmospheric Administration (NOAA) weather data, the following data were included:
• Frost day • Freezing rain • Drifting • Snow • Snow depth • Storm intensity • Average temperature
Input on important factors and how they were weighted in the equation was captured using winter
maintenance operators’ expert opinion. They validated and modified the WSI using lane-mile snow
removal costs. Additional multiple regression analysis (using SAS) was used to refine the weather
severity index allowing for WSI equations to be developed for four locations in the state as well as a
statewide WSI equation.
Identified potential uses of the WSI include:
• Verify snow and ice removal expenditures • Determine if new technologies, trainings, etc. are reducing costs • Resource allocation • Cost-benefit analysis for newer equipment, changes in funding regionally, etc.
Summary from Baldwin et al. (2015):
Baldwin et al. developed the Road Weather Severity Based on Environmental Energy (RWSBEE) index,
using the hourly rate of deposition of new snow/ice and the environmental energy required to melt it.
The final index then is the additional energy required to melt snow and ice (e.g., by maintenance
efforts), beyond the energy that is available from the environment. A modified index, RWSBEE2, was
developed to more accurately represent actual maintenance methods that use manual removal of snow
and ice, not only melting.
The analysis was done for the Indiana Department of Transportation (INDOT) using Maintenance
Decision Support System (MDSS) weather variables and an equation included in the MDSS reporting
tool. INDOT wanted to be able to (1) better evaluate performance, (2) assist with after-action review,
and (3) improve reaction to future weather events.
190
The authors used the following data:
• Roughness length (friction value for land cover) • 2-m air temperature • 10-m wind speed • Pavement surface temperature • Net surface shortwave and longwave radiation • Sensible and latent heat fluxes from North American Land Data Assimilation System (NLDAS) • Vertical temperature profile • Categorical precipitation type • Visibility • 10-m wind gusts • Snow depth • Hourly accumulated precipitation
The sources of these data are:
• Rapid Refresh (RAP) – an hourly, short-range weather prediction and data assimilation system
(http://rapidrefresh.noaa.gov, version 4 released June 2018):
1-hr temporal resolutions
1/8° spatial resolution
• North American Land Data Assimilation System (NLDAS) – a land-surface model dataset that
has built in quality controls and spatial and temporal consistency:
1-hr temporal resolutions
1/8° spatial resolution
• Snow Data Assimilation System (SNODAS) – provides a framework to integrate snow and ice
cover data from satellites and aircraft with surface observations and numerical weather
model estimates of snow and ice cover and depth (National Operational Hydrologic Remote
Sensing Center [NOHRSC]), http://nsidc.org/data/G02158)
Daily temporal resolution
1-km spatial resolution
• NCEP Stage IV Precipitation Analysis – uses NWS data from the 12 River Forecast Centers to
create an hourly mosaic of precipitation accumulation from water gauges and radar data; tied
to the RAP analysis method (http://www.emc.ncep.noaa.gov/mmb/ylin/pcpanl/stage4/):
1-, 6-, 24-hr temporal resolution aggregates
4-km spatial resolution
The following Table 8 matches the source to each variable.

191
Table 8: Variables used by Indiana DOT and the data sources.
Variable Source
Roughness length (m) NLDAS
2m air temperature (K) NLDAS
10m wind speed (m/s) NLDAS
Surface temperature (K) NLDAS Net surface shortwave and longwave radiation (W/m2) NLDAS
Sensible and latent heat fluxes (W/m2) NLDAS
Vertical temperature profile (K) RAP Categorical precipitation type (yes/no) RAP
Visibility (m) RAP
10m wind gusts (m/s) RAP Snow depth (m) SNODAS
Hourly accumulated precipitation (kg/m2) Stage IV
The Local Winter Storm Scale (LWSS; developed by Cerruti and Decker, 2011) was used to classify
winter storms on a scale from 0 (nuisance) to 6 (catastrophic), and weight various storm elements (e.g.,
maximum wind gust, snowfall, ice accumulation, and visibility).
Severity indices were computed for each INDOT district, sub-district, and unit for an entire season.
They were displayed in the document randomly, so as not to convey documented criticism of the
district, sub-district, or unit. The authors concluded that nearly seventy-five percent of the areas across
the state were within plus or minus five percent of the value (actual cost that year) when viewing costs
in terms of the RWSBEE instead of costs per weather hour. However, they acknowledge that the
approach could not account for maintenance costs (i.e. salt application).
Task 2 Survey Response
INDOT did not submit a response to the Task 2 survey.
Task 3 Follow-up
The research team worked with Mike Baldwin of Purdue to obtain the following information.
We have continued to generate the WSI data in real-time during the past winter seasons (same
methods as described in Baldwin et al 2015) and plan to continue that again this winter. We provide
the information to our colleagues in Civil Engineering at Purdue (Prof. Bullock, Joint Transportation
Research Program) who host a database, they have developed several web-based "tickers" which
INDOT staff use to access the database and display information on request.
1. Are you currently using the WSI described in Baldwin et al. (2015)?
We have continued to process the data to generate the WSI and share those data with INDOT via
a database hosted at Purdue (JTRP). I'm not aware of how the WSI is being used beyond that.
2. How frequently is the WSI calculated (e.g., in real time, daily, post-storm, and/or post-season)?
It is calculated hourly, in real time.

192
3. Over what area is the WSI considered valid (e.g., at the RWIS/weather station, over a county or district, and/or statewide)?
It is on a regularly spaced 1/8th deg lat/lon grid across the lower 48 U.S. states. So, the value
represents the areal-averaged conditions across a roughly 75 sq mile area. We use the same grid
as the "NLDAS" which is one of our sources of information:
https://ldas.gsfc.nasa.gov/nldas/specifications
4. For what purpose is the WSI used at your agency?
I am not aware of specific uses of the WSI, it was intended for performance assessment.
5. Are the sources of the data still: NOAA Rapid refresh, North American Land Data Assimilation System (NLDAS), Snow Data Assimilation System (SNODAS), National Weather Service (NWS) NCEP Stage IV Precipitation Analysis, Local Winter Storm Scale (LWSS; Cerruti and Decker (2011)?
No changes have been made to the data sources since the Baldwin et al. (2015) project report, besides regular/minor upgrades with the NOAA/NWS data processing/modeling systems (such as Rapid Refresh)
6. What entity is responsible for managing these data sources? Please provide contact info for the relevant personnel who manage the devices (whether internal to your agency or external).
I’m responsible for running the scripts/programs to process the data, generate the WSI, transfer
it to the JTRP database.
7. Where is the algorithm housed and who runs it and produces the results?
I do, on a Linux workstation at Purdue.
8. Were there certain groups within your agency or external to your agency that were recruited to assist with building the WSI? Would you change who you brought to the table if you had to do it again?
I worked with INDOT's snow & ice program manager when developing the WSI.
9. We’d like to understand how the data had to be processed to work with your WSI. Do you know what programming methods were used to make the data readable by the WSI program? Were there fixes that had to be done once the WSI was tested and implemented?
A variety of shell scripts and python programs are run to ingest and process the data. After the
project ended, I worked with Hashim Burki at INDOT to transfer those scripts/programs to
INDOT.
10. How has the core knowledge of the WSI been passed onto other agency employees? Have you hosted internal workshops or trainings for key employees to be familiar with the WSI?
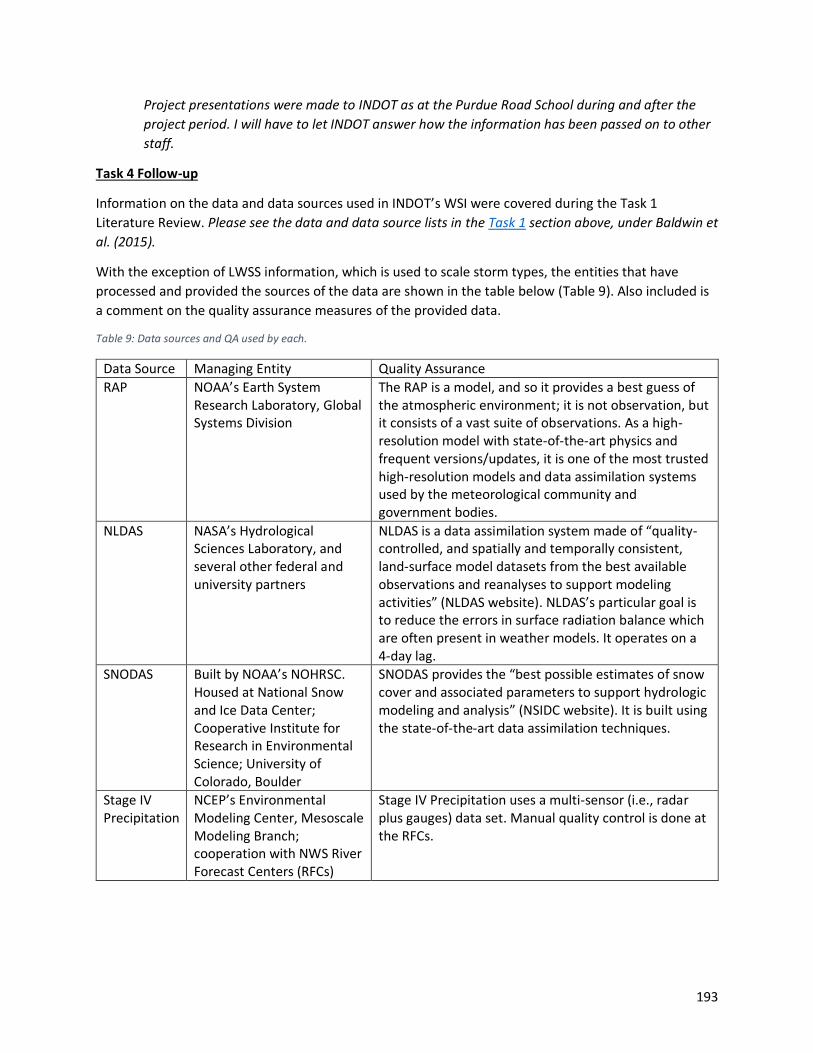
193
Project presentations were made to INDOT as at the Purdue Road School during and after the
project period. I will have to let INDOT answer how the information has been passed on to other
staff.
Task 4 Follow-up
Information on the data and data sources used in INDOT’s WSI were covered during the Task 1
Literature Review. Please see the data and data source lists in the Task 1 section above, under Baldwin et
al. (2015).
With the exception of LWSS information, which is used to scale storm types, the entities that have
processed and provided the sources of the data are shown in the table below (Table 9). Also included is
a comment on the quality assurance measures of the provided data.
Table 9: Data sources and QA used by each.
Data Source Managing Entity Quality Assurance
RAP NOAA’s Earth System Research Laboratory, Global Systems Division
The RAP is a model, and so it provides a best guess of the atmospheric environment; it is not observation, but it consists of a vast suite of observations. As a high-resolution model with state-of-the-art physics and frequent versions/updates, it is one of the most trusted high-resolution models and data assimilation systems used by the meteorological community and government bodies.
NLDAS NASA’s Hydrological Sciences Laboratory, and several other federal and university partners
NLDAS is a data assimilation system made of “quality-controlled, and spatially and temporally consistent, land-surface model datasets from the best available observations and reanalyses to support modeling activities” (NLDAS website). NLDAS’s particular goal is to reduce the errors in surface radiation balance which are often present in weather models. It operates on a 4-day lag.
SNODAS Built by NOAA’s NOHRSC. Housed at National Snow and Ice Data Center; Cooperative Institute for Research in Environmental Science; University of Colorado, Boulder
SNODAS provides the “best possible estimates of snow cover and associated parameters to support hydrologic modeling and analysis” (NSIDC website). It is built using the state-of-the-art data assimilation techniques.
Stage IV Precipitation
NCEP’s Environmental Modeling Center, Mesoscale Modeling Branch; cooperation with NWS River Forecast Centers (RFCs)
Stage IV Precipitation uses a multi-sensor (i.e., radar plus gauges) data set. Manual quality control is done at the RFCs.
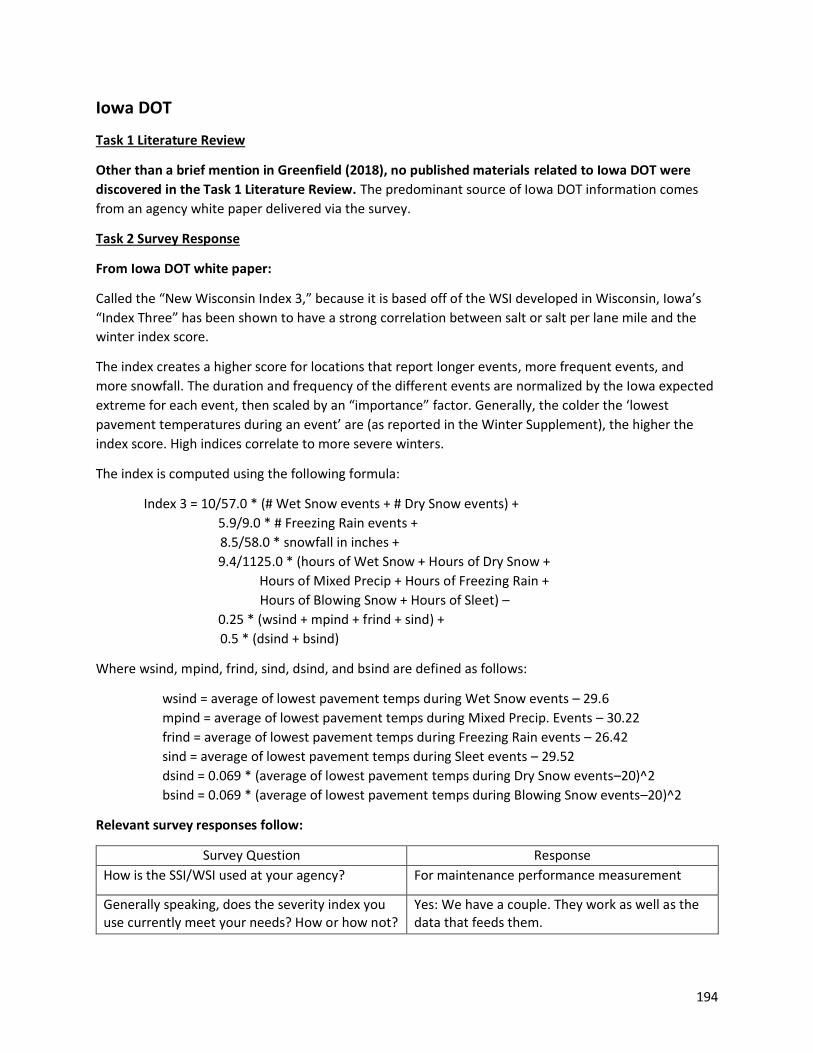
194
Iowa DOT
Task 1 Literature Review
Other than a brief mention in Greenfield (2018), no published materials related to Iowa DOT were
discovered in the Task 1 Literature Review. The predominant source of Iowa DOT information comes
from an agency white paper delivered via the survey.
Task 2 Survey Response
From Iowa DOT white paper:
Called the “New Wisconsin Index 3,” because it is based off of the WSI developed in Wisconsin, Iowa’s
“Index Three” has been shown to have a strong correlation between salt or salt per lane mile and the
winter index score.
The index creates a higher score for locations that report longer events, more frequent events, and
more snowfall. The duration and frequency of the different events are normalized by the Iowa expected
extreme for each event, then scaled by an “importance” factor. Generally, the colder the ‘lowest
pavement temperatures during an event’ are (as reported in the Winter Supplement), the higher the
index score. High indices correlate to more severe winters.
The index is computed using the following formula:
Index 3 = 10/57.0 * (# Wet Snow events + # Dry Snow events) +
5.9/9.0 * # Freezing Rain events +
8.5/58.0 * snowfall in inches +
9.4/1125.0 * (hours of Wet Snow + Hours of Dry Snow +
Hours of Mixed Precip + Hours of Freezing Rain +
Hours of Blowing Snow + Hours of Sleet) –
0.25 * (wsind + mpind + frind + sind) +
0.5 * (dsind + bsind)
Where wsind, mpind, frind, sind, dsind, and bsind are defined as follows:
wsind = average of lowest pavement temps during Wet Snow events – 29.6
mpind = average of lowest pavement temps during Mixed Precip. Events – 30.22
frind = average of lowest pavement temps during Freezing Rain events – 26.42
sind = average of lowest pavement temps during Sleet events – 29.52
dsind = 0.069 * (average of lowest pavement temps during Dry Snow events–20)^2
bsind = 0.069 * (average of lowest pavement temps during Blowing Snow events–20)^2
Relevant survey responses follow:
Survey Question Response
How is the SSI/WSI used at your agency? For maintenance performance measurement
Generally speaking, does the severity index you use currently meet your needs? How or how not?
Yes: We have a couple. They work as well as the data that feeds them.

195
If the SSI/WSI you use has been altered from the way it is described in the publication, or if you need to add detail, please explain.
Some [modifications] have been added to make sure it doesn't allow a negative value to be added to the yearly accumulation.
Do the variables and calculation you use work for every weather scenario you wish to capture? Please discuss the ways in which it does and does not work for your agency’s purposes.
It covers a lot, but we are limited by the data coming in. for example, our freezing rain info doesn't tell us whether it was just a little drizzle or an all-out ice storm. It's just 'freezing rain' so the index can't make different calculations for the different ranges of intensity.
If applicable to your climate, have you been successful at capturing freezing rain in your WSI?
Yes: It is reported by our crews in their daily logs
If applicable to your climate, have you been successful at capturing effects of very cold temperatures (°F)?
Yes: pavement temperature is a variable that acts differently depending on what type of storm is being reported.
Have you attempted to incorporate current pavement conditions (i.e., existing snow or ice on the road) when a new storm arrives?
No: While that other storm also counts in the index, there is no accommodation for how close those storms arrive. And anything that can be influenced by our maintenance effectiveness (like pavement condition) is not to be included since we need our index to score our performance and not be influenced by it.
Have you successfully included a duration term (length of storm event) in your calculation?
Yes: duration (in hours) is included
Have you run into issues regarding differing climate zones across your state? If so, how have your dealt with that? Please explain.
No: it is an index. It scores how easy or hard the winter was in each area as part of its normal operation. But what we can do is show how that score differs from their historical average index to show how 'relatively severe' it was for their region
Please share any lessons you have learned throughout the development and/or use of the SSI/WSI at your agency.
We have a couple indices for specific parts of our winter ops. The one I described the most was for our 'general severity' score that's well correlated with our [Labor, Equipment and Material dollars]. We have another one that is specific to salt use. We have another that can describe how weather impacts traffic. We like that because each issue is impacted slightly differently. I.e., a severely cold blizzard would certainly be a big hit to our labor, equipment hours and traffic flow, but not much of a hit to salt use since that's not the weapon of choice for that type of event.

196
Whether or not your agency already uses an SSI/WSI, please describe what your ideal severity index would be like, how would it be used?
Each would be better if they were able to capture more of the intensity of an event. A few hours of intense precipitation that trails off to a flurry is a very different beast than one that snows steadily, even if they end up with the same number of hours and the same snow total.
Task 3 Follow-up
A brief explanation of the index is as follows (from an Iowa DOT document):
The index creates a winter severity score for locations based on event duration, event frequency,
snowfall amount, and temperature. The duration and frequency of the different events are
normalized by the Iowa expected extreme for each event, then scaled by an “importance” factor.
Generally, the colder the pavement temperatures during an event (as reported in the Winter
Supplement), the higher the index score. High index scores correlate to more severe winters.
The index is computed using the following information:
• The number of:
Wet Snow events
Dry Snow events
Freezing Rain events
• Snowfall in inches
• The number of hours of:
Wet Snow
Dry Snow
Mixed Precipitation
Freezing Rain
Blowing Snow
Sleet
• The lowest pavement temperature observed during these precipitation events
The research team interviewed Tina Greenfield, Iowa DOT RWIS Coordinator. Her responses concerned
the "New Wisconsin Index 3" as described in the white paper.
Information from Tina Greenfield is summarized below.
The index relies heavily on frequency and duration of events. Per Tina: “Snowfall amount is a poor
predictor of how much we’ll spend. It has more to do with duration and frequency.”
The index is calculated as the data come in and is cumulative over the season. The Figure 41 below
shows the cumulative WSI values for each season since the 2008/2009 winter season. The severe storms
become evident as a steep slope in a single line.

197
Figure 7: Cumulative WSI over each winter season since 2008/2009. The y-axis shows the unitless WSI value, and the x-axis is dates over the winter season. Source: Iowa DOT.
1. What are some successes you have had with this index method?
a. Because the index has been computed for so many years now (14), it is starting to form a
good sample size for comparing seasons to seasons and months to months.
b. Upper management really values it.
c. Using human-reported storm values allows you to capture events that are missed by
automated sensors.
2. What challenges have you faced with it?
a. In the beginning, there were challenges, until it gained some context, and it was
explained more. You have to get a feel for it until it means something.
b. There are some issues when dealing with human-reported data. For example, start and
stop times for precipitation will be different across a garage’s area, and may be reported
differently per garage. Embellishment is also possible, and there have been certain
quality assurance measures taken to mitigate this.
3. When is the index calculated (e.g., daily, post-storm, seasonally, etc.)?
It is run daily, and these values accumulate over the season. Looking at the values
midseason will give a sense for how severe the winter has been thus far. One can also
compare values for a given month to those from another year (as in the figure above).
4. Over what area is the index valid (e.g., per district, per garage, etc.)?
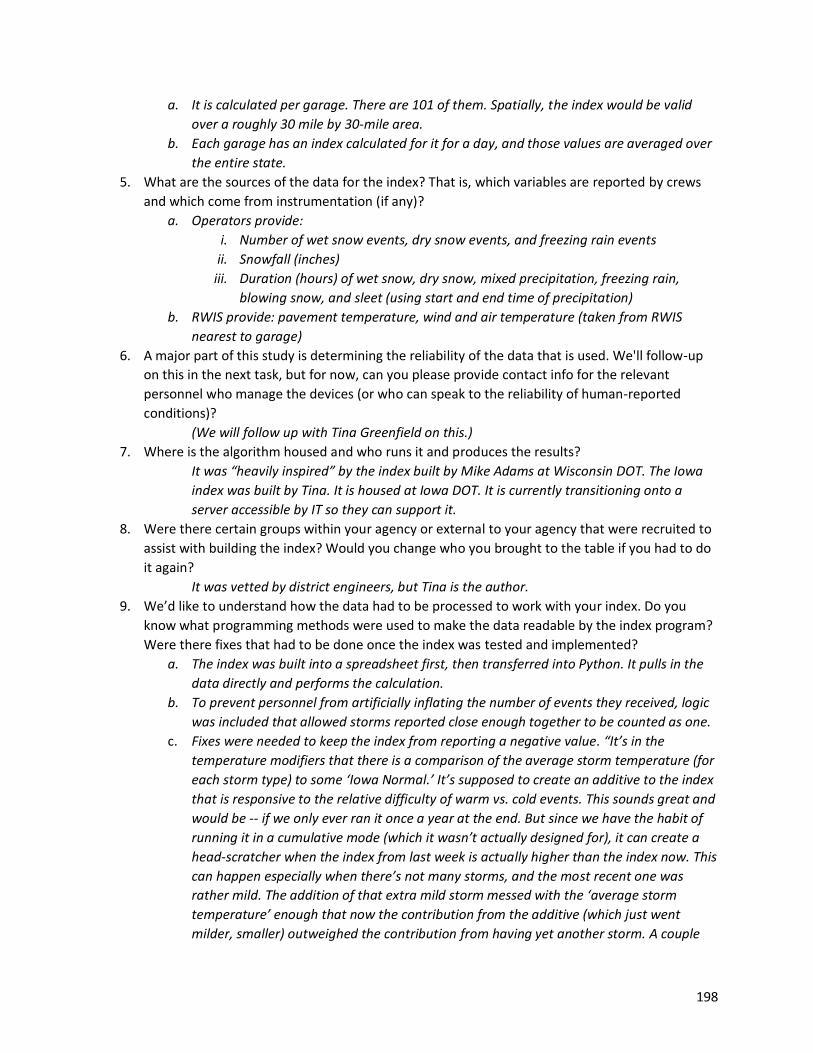
198
a. It is calculated per garage. There are 101 of them. Spatially, the index would be valid
over a roughly 30 mile by 30-mile area.
b. Each garage has an index calculated for it for a day, and those values are averaged over
the entire state.
5. What are the sources of the data for the index? That is, which variables are reported by crews
and which come from instrumentation (if any)?
a. Operators provide:
i. Number of wet snow events, dry snow events, and freezing rain events
ii. Snowfall (inches)
iii. Duration (hours) of wet snow, dry snow, mixed precipitation, freezing rain,
blowing snow, and sleet (using start and end time of precipitation)
b. RWIS provide: pavement temperature, wind and air temperature (taken from RWIS
nearest to garage)
6. A major part of this study is determining the reliability of the data that is used. We'll follow-up
on this in the next task, but for now, can you please provide contact info for the relevant
personnel who manage the devices (or who can speak to the reliability of human-reported
conditions)?
(We will follow up with Tina Greenfield on this.)
7. Where is the algorithm housed and who runs it and produces the results?
It was “heavily inspired” by the index built by Mike Adams at Wisconsin DOT. The Iowa
index was built by Tina. It is housed at Iowa DOT. It is currently transitioning onto a
server accessible by IT so they can support it.
8. Were there certain groups within your agency or external to your agency that were recruited to
assist with building the index? Would you change who you brought to the table if you had to do
it again?
It was vetted by district engineers, but Tina is the author.
9. We’d like to understand how the data had to be processed to work with your index. Do you
know what programming methods were used to make the data readable by the index program?
Were there fixes that had to be done once the index was tested and implemented?
a. The index was built into a spreadsheet first, then transferred into Python. It pulls in the
data directly and performs the calculation.
b. To prevent personnel from artificially inflating the number of events they received, logic
was included that allowed storms reported close enough together to be counted as one.
c. Fixes were needed to keep the index from reporting a negative value. “It’s in the
temperature modifiers that there is a comparison of the average storm temperature (for
each storm type) to some ‘Iowa Normal.’ It’s supposed to create an additive to the index
that is responsive to the relative difficulty of warm vs. cold events. This sounds great and
would be -- if we only ever ran it once a year at the end. But since we have the habit of
running it in a cumulative mode (which it wasn’t actually designed for), it can create a
head-scratcher when the index from last week is actually higher than the index now. This
can happen especially when there’s not many storms, and the most recent one was
rather mild. The addition of that extra mild storm messed with the ‘average storm
temperature’ enough that now the contribution from the additive (which just went
milder, smaller) outweighed the contribution from having yet another storm. A couple
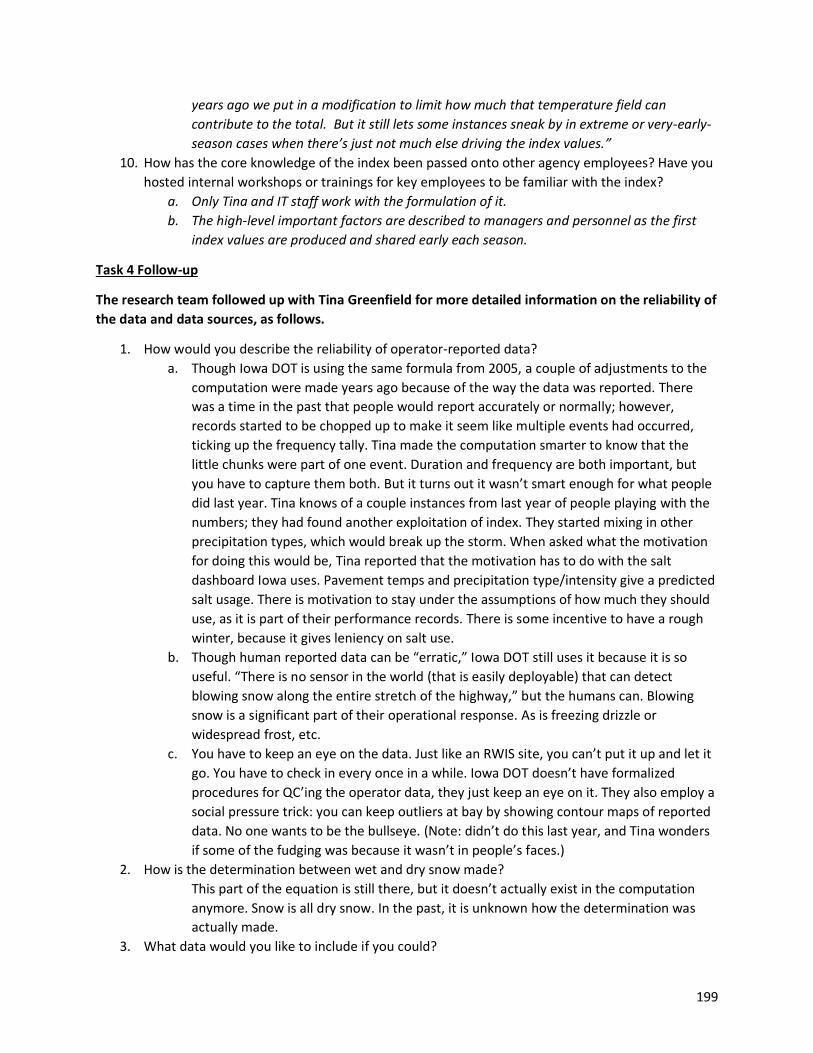
199
years ago we put in a modification to limit how much that temperature field can
contribute to the total. But it still lets some instances sneak by in extreme or very-early-
season cases when there’s just not much else driving the index values.”
10. How has the core knowledge of the index been passed onto other agency employees? Have you
hosted internal workshops or trainings for key employees to be familiar with the index?
a. Only Tina and IT staff work with the formulation of it.
b. The high-level important factors are described to managers and personnel as the first
index values are produced and shared early each season.
Task 4 Follow-up
The research team followed up with Tina Greenfield for more detailed information on the reliability of
the data and data sources, as follows.
1. How would you describe the reliability of operator-reported data?
a. Though Iowa DOT is using the same formula from 2005, a couple of adjustments to the
computation were made years ago because of the way the data was reported. There
was a time in the past that people would report accurately or normally; however,
records started to be chopped up to make it seem like multiple events had occurred,
ticking up the frequency tally. Tina made the computation smarter to know that the
little chunks were part of one event. Duration and frequency are both important, but
you have to capture them both. But it turns out it wasn’t smart enough for what people
did last year. Tina knows of a couple instances from last year of people playing with the
numbers; they had found another exploitation of index. They started mixing in other
precipitation types, which would break up the storm. When asked what the motivation
for doing this would be, Tina reported that the motivation has to do with the salt
dashboard Iowa uses. Pavement temps and precipitation type/intensity give a predicted
salt usage. There is motivation to stay under the assumptions of how much they should
use, as it is part of their performance records. There is some incentive to have a rough
winter, because it gives leniency on salt use.
b. Though human reported data can be “erratic,” Iowa DOT still uses it because it is so
useful. “There is no sensor in the world (that is easily deployable) that can detect
blowing snow along the entire stretch of the highway,” but the humans can. Blowing
snow is a significant part of their operational response. As is freezing drizzle or
widespread frost, etc.
c. You have to keep an eye on the data. Just like an RWIS site, you can’t put it up and let it
go. You have to check in every once in a while. Iowa DOT doesn’t have formalized
procedures for QC’ing the operator data, they just keep an eye on it. They also employ a
social pressure trick: you can keep outliers at bay by showing contour maps of reported
data. No one wants to be the bullseye. (Note: didn’t do this last year, and Tina wonders
if some of the fudging was because it wasn’t in people’s faces.)
2. How is the determination between wet and dry snow made?
This part of the equation is still there, but it doesn’t actually exist in the computation
anymore. Snow is all dry snow. In the past, it is unknown how the determination was
actually made.
3. What data would you like to include if you could?

200
Tina wishes they had a better handle on the snowfall rate throughout the course of the
storm. The response is different if it comes in super hard at the beginning, you can lose
the road, trying to melt it from the top down, which is more difficult. Versus, if there
was a steady rate the whole time. It’d probably be best if it’s incorporated into the salt-
use calculation. But would be useful if it could be in the severity index someday. But
reducing errors or fudging in the reported data is Tina’s priority right now.

201
Massachusetts DOT
Task 1 Literature Review
Massachusetts DOT uses the index described in Boselly et al. (1993). A summary of the publication
follows:
The Strategic Highway Research Program (SHRP) goal was to create a broadly applicable index with
“only a few general common parameters.” It is an index which was intended to be calculated over an
entire season.
The variables used in the SHRP index show in Table 10.
Table 10: Variables used in the SHRP index.
Temperature Index (TI)
TI = 0 if the minimum air temperature is above 32°F; TI = 1 if the maximum temperature is above freezing while the minimum temperature is below 32°F; and TI = 2 if the maximum temperature is at or below 32°F. The average daily value is used.
Snowfall (S) Mean daily values in millimeters (the number of days with snowfall was also considered but did not improve the index).
Number of Air Frosts (N)
Mean daily values of number of days with minimum air temperature at or below 32°F (0 ≤ N ≤ 1).
Temperature Range (R)
The value of mean monthly maximum air temperature minus mean monthly minimum temperature in °C.
The equation for the index is:
where a = -25.58, b = -35.68, c = -99.5, and d = 50.0. These terms account for temperature, snowfall, and
frost, respectively, and d is a corrective term. The coefficients were derived by assigning values to TI
(1.87), S (16.5) and N (1), which were deemed “critically significant” thresholds for maintenance cost.
Task 2 Survey Response
Relevant details from Massachusetts DOT white paper:
“The year to year variability in annual salt usage on a district and statewide basis. are highly correlated
to the winter severity index values for each of the years. In fact, based on the regression analysis of WSI
vs. annual salt usage, changes in WSI values from year to year can explain 95 percent of the year to year
variability in salt usage.
This WSI methodology is based on daily maximum and minimum temperatures and daily snowfall totals
for the period of November 1 to March 31. Data from October and April usually does not result in a
more representative WSI and will more than likely lower the WSI values due to the warmer daily
temperatures during this period. On occasion, however rare snow events or cold snaps will occur in this
time period. In these situations, adjustments may need to be made to include these events.

202
Calculation of the WSI value is typically done at the end of the season, when the entire winter seasons’
worth of data can be retrieved from an online weather source. Given the steps involved and the effort
required, calculation of the WSI is not a procedure that lends itself to being done multiple times over the
course of the season. Having said that, it may be worthwhile for planning and forecasting purposes to
perform a mid-season calculation of WSI, say, at the end of January, if time and available resources
permit.”
An example of how to calculate the WSI is given.
“Note: A monthly WSI value is calculated for each month (Nov-March) and then averaged over the
entire winter season. It is this average monthly WSI for the entire season that is used to compare against
annual salt usage.”
The white paper goes through the steps of exporting the weather data from the source into an Excel
spreadsheet. The data source used at MassDOT is WeatherSource™. There is a single weather station
that was selected to represent conditions in each of six districts. The weather station type was not
identified in this publication. “The WeatherSource™ Excel file will provide maximum daily temperature,
minimum daily temperature, mean daily temperature, and daily snow fall amounts (inches).”
“For each file, check to see if there is any missing data. Occasionally, temperature data may be missing
for one or two days. Fill in any missing temp data by interpolating data from the previous or following
day. Otherwise, the spreadsheet will treat missing data as 0°F, which will lead to an artificially low WSI
value. Also, check for missing snowfall data, especially when precipitation was recorded with cold
temperatures. If long stretches of data are missing, may need to backfill data will other data (i.e.,
Telvent data, district data, data from other nearby station). It is important to be as consistent as possible
with regard to data sources to minimize variability.”
Relevant survey responses follow:
Survey Question Response
How is the SSI/WSI used at your agency? For maintenance performance measurement
Generally speaking, does the severity index you use currently meet your needs? How or how not?
Yes, but here are some things I like about it and some things I don't: It neglects freezing rain due to the meteorological (non-RWIS) data set it utilizes to determine WSI
If the SSI/WSI you use has been altered from the way it is described in the publication, or if you need to add detail, please explain.
I don't believe it has been altered. In fact, I believe the methodology we've utilized for the better part of 2 decades is the Boselly, et al. 1993
Do the variables and calculation you use work for every weather scenario you wish to capture? Please discuss the ways in which it does and does not work for your agency’s purposes.
Freezing rain is neglected. I realize that we would need to change the data that we rely on from NWS stations in each District (MassDOT has 6 Districts) to RWIS locations that could report actual freezing rain. It is my understanding that since freezing rain is really just rain falling on frozen pavement, pavement temperature sensing is a necessary element of local freezing rain determination
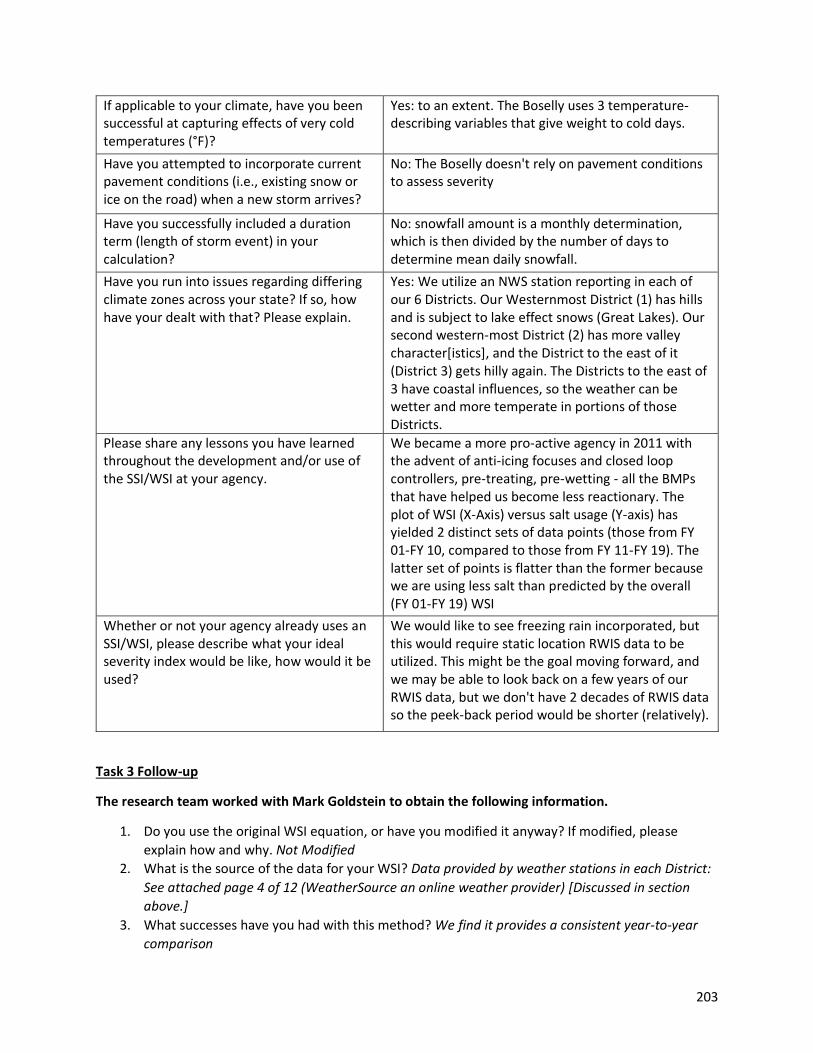
203
If applicable to your climate, have you been successful at capturing effects of very cold temperatures (°F)?
Yes: to an extent. The Boselly uses 3 temperature-describing variables that give weight to cold days.
Have you attempted to incorporate current pavement conditions (i.e., existing snow or ice on the road) when a new storm arrives?
No: The Boselly doesn't rely on pavement conditions to assess severity
Have you successfully included a duration term (length of storm event) in your calculation?
No: snowfall amount is a monthly determination, which is then divided by the number of days to determine mean daily snowfall.
Have you run into issues regarding differing climate zones across your state? If so, how have your dealt with that? Please explain.
Yes: We utilize an NWS station reporting in each of our 6 Districts. Our Westernmost District (1) has hills and is subject to lake effect snows (Great Lakes). Our second western-most District (2) has more valley character[istics], and the District to the east of it (District 3) gets hilly again. The Districts to the east of 3 have coastal influences, so the weather can be wetter and more temperate in portions of those Districts.
Please share any lessons you have learned throughout the development and/or use of the SSI/WSI at your agency.
We became a more pro-active agency in 2011 with the advent of anti-icing focuses and closed loop controllers, pre-treating, pre-wetting - all the BMPs that have helped us become less reactionary. The plot of WSI (X-Axis) versus salt usage (Y-axis) has yielded 2 distinct sets of data points (those from FY 01-FY 10, compared to those from FY 11-FY 19). The latter set of points is flatter than the former because we are using less salt than predicted by the overall (FY 01-FY 19) WSI
Whether or not your agency already uses an SSI/WSI, please describe what your ideal severity index would be like, how would it be used?
We would like to see freezing rain incorporated, but this would require static location RWIS data to be utilized. This might be the goal moving forward, and we may be able to look back on a few years of our RWIS data, but we don't have 2 decades of RWIS data so the peek-back period would be shorter (relatively).
Task 3 Follow-up
The research team worked with Mark Goldstein to obtain the following information.
1. Do you use the original WSI equation, or have you modified it anyway? If modified, please
explain how and why. Not Modified
2. What is the source of the data for your WSI? Data provided by weather stations in each District:
See attached page 4 of 12 (WeatherSource an online weather provider) [Discussed in section
above.]
3. What successes have you had with this method? We find it provides a consistent year-to-year
comparison

204
4. What challenges have you faced with this method? It doesn’t account for freezing rain
5. What entity is responsible for managing these data sources? Please provide contact info for the
relevant personnel who manage the devices (whether internal to your agency or external). A
MassDOT Environmental Services consultant, VHB
6. Are the data and devices managed and maintained sufficiently for their use in the WSI? What
practices are required to keep the data quality high? These are not MassDOT-Owned
observation stations.
7. Where is the algorithm housed and who runs it and produces the results? A MassDOT
Environmental Services consultant, VHB
8. Were there certain groups within your agency or external to your agency that were recruited to
assist with building the WSI? Would you change who you brought to the table if you had to do it
again? We use the Boselly WSI released in ’93. We simply feed a winter’s compiled data into the
unaltered Boselly
9. We’d like to understand how the data had to be processed to work with your WSI. Do you know
what programming methods were used to make the data readable by the WSI program? Were
there fixes that had to be done once the WSI was tested and implemented? I cannot specifically
speak to this. Please see the attached methodology
10. How has the core knowledge of the WSI been passed onto other agency employees? Have you
hosted internal workshops or trainings for key employees to be familiar with the WSI? We
compare WSI (X-axis) to salt usage on both District and Statewide levels (Figure 43). The same
weather data (parameters) has been available since we began looking at WSI vs salt usage. We
share the information with our internal Operations and Maintenance Staff as well as contracted
snowfighting forces that distribute our salt on the roadways. We try to personalize contractors’
involvement because their buy-in is essential to an efficient program. Since 2011 we have been
utilizing modern best management practices (BMPs) such as prewetting of salt, pretreating of
roadways and use of closed loop controllers. If we look at the dark data points (2001-2010)
versus the red data points below (2011-2019), we can see that the line of best fit that would be
established by the former data set (y=-1.4829x+12.857) has a steeper slope than a regression
derived solely from the 2011-19 data points would. If you imagine a line of best fit through the
red points, it is obviously flatter than the line as drawn, which depicts the regression for all 19
years (equation below). Of course, efficient practices can only do so much to flatten the slope of
the line, because a flat line would imply that there is no relationship between a winter’s severity
and the amount of salt used that year.
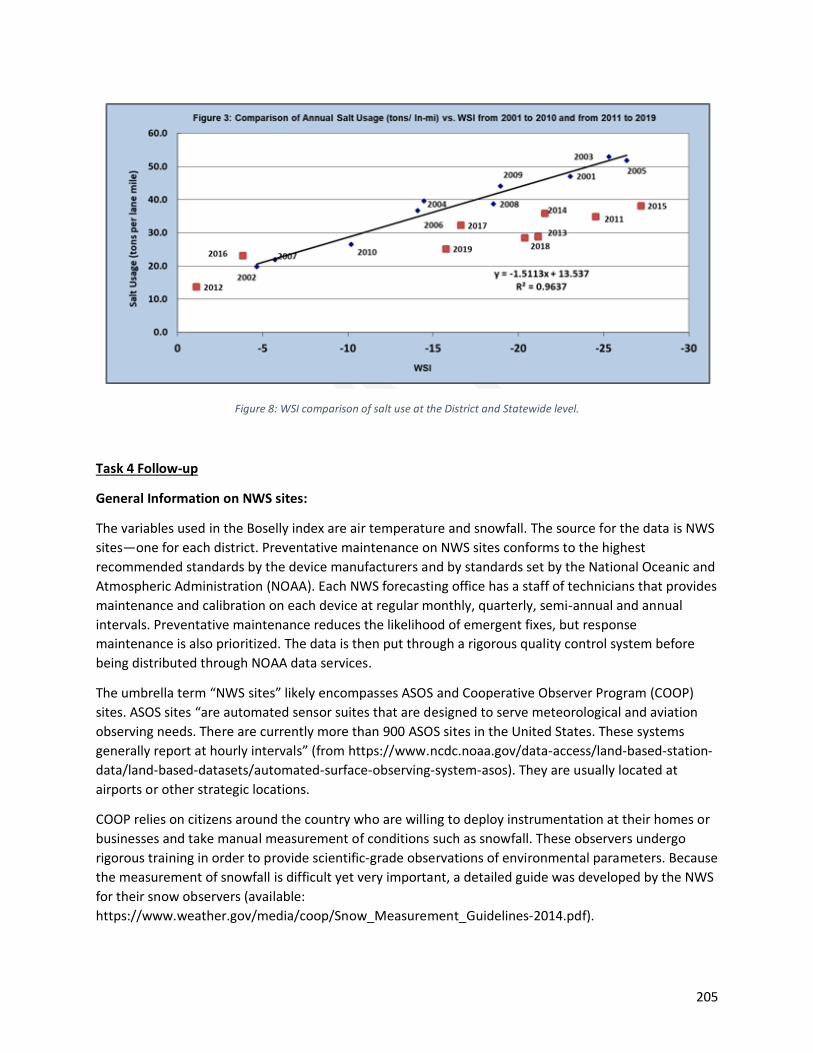
205
Figure 8: WSI comparison of salt use at the District and Statewide level.
Task 4 Follow-up
General Information on NWS sites:
The variables used in the Boselly index are air temperature and snowfall. The source for the data is NWS
sites—one for each district. Preventative maintenance on NWS sites conforms to the highest
recommended standards by the device manufacturers and by standards set by the National Oceanic and
Atmospheric Administration (NOAA). Each NWS forecasting office has a staff of technicians that provides
maintenance and calibration on each device at regular monthly, quarterly, semi-annual and annual
intervals. Preventative maintenance reduces the likelihood of emergent fixes, but response
maintenance is also prioritized. The data is then put through a rigorous quality control system before
being distributed through NOAA data services.
The umbrella term “NWS sites” likely encompasses ASOS and Cooperative Observer Program (COOP)
sites. ASOS sites “are automated sensor suites that are designed to serve meteorological and aviation
observing needs. There are currently more than 900 ASOS sites in the United States. These systems
generally report at hourly intervals” (from https://www.ncdc.noaa.gov/data-access/land-based-station-
data/land-based-datasets/automated-surface-observing-system-asos). They are usually located at
airports or other strategic locations.
COOP relies on citizens around the country who are willing to deploy instrumentation at their homes or
businesses and take manual measurement of conditions such as snowfall. These observers undergo
rigorous training in order to provide scientific-grade observations of environmental parameters. Because
the measurement of snowfall is difficult yet very important, a detailed guide was developed by the NWS
for their snow observers (available:
https://www.weather.gov/media/coop/Snow_Measurement_Guidelines-2014.pdf).

206
Further insight into COOP’s manual snow observation methods come from Lisa Verzella, Observations
Program Leader, NWS Salt Lake City:
The Coop program has over 100 sites across our entire forecast area, a majority of them using volunteer
observers who take manual SWE, 24-hr snowfall and accumulated snow depth measurements every day.
While manual measurements in these mostly rural areas can be a bit of an art, given sometimes extreme
wind and location variations, many of the records are decades long with consistent observers and
equipment placement.
Coop observers measure snowfall with a ruler (in tenths) from a 2'x2' white-coated plywood snow board,
located in a semi-sheltered area near their home/institution. Snow depth measurements are an average
of several measurements taken in a representative area in the yard/station vicinity, rounded to the
nearest inch. These measurements are submitted either daily by computer or monthly via a paper form.
Outside of the Coop program, NWS works with a network of private/public individuals who submit
manual observations, including ski areas, members of the public who set up a snow board/camera
system, and social media users who send reports to us during events. I'm not sure how many of these
sites are owned by NWS, if any, so I would say a majority of NWS-owned snow-measuring sites are
manual and associated with the Coop program.
Bill Arcieri (MassDOT contractor, VHB) provided the following information on the database from
which the snowfall data is pulled:
We no longer use Weather Source. We did a few years back, but they changed their business model and
product line, so we now get the daily weather data from the Northeast Regional Climate Center through
their online NOWdata retrieval platform. We retrieve data from six stations throughout Mass that are
representative of each of the maintenance districts. I retrieve the data manually by selecting the station,
dates and measurements and just need daily min and max temps and snowfall and cut and paste into an
excel spreadsheet that has the WSI formula embedded. NRCC does not charge a fee for using the
NOWdata site; if you wanted a longer history or had a special request, I believe they would charge a fee.
The daily snowfall data is generally pretty consistent for the stations in the larger urban areas such as
Boston, Worcester, or if the NWS has more of a presence in maintaining the station.
I believe the snowfall data is measured via instrumentation especially in the larger stations, but in some
of the more rural areas like western Mass, the availability of snowfall data can be less reliable and
sometimes there are number of days with missing data; in some cases we may need to supplement the
data from another nearest station. Again, not sure if the missing data is due to instrumentation or
human reporting error. The reliability seems to have gotten worse over the last 5 years.
But nonetheless we were able to establish a good 10 years-worth of data to develop a baseline period
correlating annual salt use to the annual WSI value with a correlation coefficient value (R-square) that
range from 0.91 to 0.96 for the various stations/districts. We then use this correlation to compare the
WSI-adjusted salt use data during more recent years to assess how various efficiency measures have
affected and hopefully reduced salt use compared to the baseline or pre-implementation period.
As said in earlier emails, our WSI method does not factor in freezing rain events but I don’t think this
really diminishes the value of using the WSI to explain variability in annual salt use. As noted, we have

207
had strong correlations between WSI vs. salt use except in milder winters where [freezing] rain events
may be more prevalent. It would certainly help to factor it in, but it doesn’t seem like many weather
stations record freezing rain events especially the smaller stations in more rural areas. It would be a
challenge to obtain freezing rain data across the state that was recorded using consistent methods. We
would also need to obtain the freezing rain data retroactively to adjust our 10 years of baseline data
where we correlated WSI with annual salt use prior to the implementation of various efficiency
measures.

208
Minnesota DOT
Task 1 Literature Review
From Maze et al. (2009):
This work estimated the relationship between winter maintenance performance and weather
condition data. This project was the first attempt to determine a relationship between weather data and
winter maintenance performance in Minnesota. To assign value to performance variables they took road
classifications and the time to achieve the prescribed LOS, for example 3 hours to achieve bare
pavement on super commuter routes. Then, if it took 4 hours to achieve bare pavement (4hr to reach
bare pavement divided by 3hr bare pavement goal or 4/3 = 1.33) performance index that can now be
used in the severity index calculation. The overall calculation method used was a mixed linear
retrospective model, i.e., using past data. Weather related variables used included snow, maximum and
minimum temperatures, location of the road segment, and time. Another variable identified by
practitioners to be of importance was the direction of the road segment (north-south or east-west),
which was built into the equation. Roads trending N-S trending were assigned a 1, and E-W trending
roads were assigned a 0. Average daily traffic was also included.
A combination of RWIS and NWS weather sources were used. A full list of variables used is provided
in Table 11.
Table 11: RWIS and NWS weather sources used by Maze et al. (2009).
Index Variable Variable Definition Type of Variable Variable
District Geographic location Classification Districti Storm of season 1,2,….,7 Classification Stormj
Volume (ADT) Avg volume on road per 1000 Continuous Volumeijk
Performance relative to goal (LOS)
Actual bare lane time versus goal Continuous Yijk
Route Orientation E-W or N-S Integer Variable EWijk
Snow quantities Amount of snow at nearest NWS site Continuous Snowijk
Wind speed Max wind speed at nearest NWS site Continuous Windijk
Max Temp Max temp record by nearest NWS site Continuous Tmaxijk
Min Temp Min temp record by nearest NWS site Continuous Tminijk
The report provides details on how the equation/model was derived and tested and provides the
equation for the model used. The work found that it is possible to use measurable weather data to
estimate differences in winter maintenance performance across routes, districts, and sub-districts based
on storm severity. They also found that the analysis can be done within a day or two of each storm, so
that performance can be modified during the season.
Task 2 Survey Response
Directly from MnDOT white paper:
The long-standing approach to winter severity has been met over the years with mixed acceptance.
Some of the reasons of this were that it only looked at 4 variables (number of snow events, number of
freezing rain events, snow accumulation amount and storm duration). Many Districts complained that

209
other variables like wind/blowing snow were not accounted for which causes some areas of the state to
look like they had a less severe winter than reality as blowing snow is a huge factor in winter
maintenance in many areas of the state.
There was a need for a new approach that was more road-centric and also considered additional
variables to better represent the severity of the winter across the whole state.
The following weather parameters are used in this new severity index:
• air temperature
• road temperature
• dew point / relative humidity
• frost/black ice
• wind speed, gusts and direction
• precipitation type, duration, and amounts (broken into liquid, ice, and snow buckets)
• cloud cover, and its impacts on solar (shortwave) and infrared (longwave) radiation
• surface pressure
• blowing snow
MDSS uses data from surface weather observations at Airports and RWIS stations, radar, satellite,
numerical models, meteorologist inputs and other resources to piece together the picture of what has
happened weather-wise. It's safe to say that pretty much everything that is important in the weather as
it impacts roads is considered in the process, from temperatures and winds to precipitation, radiation,
and blowing snow.
Given the weather data, MDSS uses the road condition model, MDSS' treatment logic and the
maintenance parameters provided to MDSS from MnDOT about each road such as the chemical(s)
available, application rates, roads given level of service (LOS), etc. to determine when the roads were
likely to have required maintenance. MDSS also determines the nature of what those specific
treatments might have been given the weather and road conditions being addressed. This results in a
winter-long simulation of road conditions, and individual maintenance actions assigned to treat adverse
road conditions as detected. This results in variables that we can assign costs to, such as the number of
maintenance runs, and pounds of salt, that can then be used (along with the assigned costs) to derive a
total winter maintenance cost for a given stretch of road.
By keeping all the costs the same (salt/sand, labor, truck costs, etc.) and using the rural commuter
surrogate routes spread evenly across the state, this allows us to just look at how the weather affects
this index, and therefore how severe the weather was at any given surrogate site in the State.
Relevant survey responses follow:
Survey Question Response
How is the SSI/WSI used at your agency? Displayed in public report at end of each winter.
Generally speaking, does the severity index you use currently meet your needs? How or how not?
Yes: Meets our basic need for displaying how severe a winter was compared to previous winter.

210
Do the variables and calculation you use work for every weather scenario you wish to capture? Please discuss the ways in which it does and does not work for your agency’s purposes.
We believe it works for every weather scenario we wish to capture as it includes all the weather variables that affect the roads.
If applicable to your climate, have you been successful at capturing freezing rain in your WSI?
Yes: We capture liquid precipitation as well as road temperatures, so we capture freezing rain in this way.
If applicable to your climate, have you been successful at capturing effects of very cold temperatures (°F)?
Yes: We capture road temps as well as air temps, so we get the very cold events as well.
Have you attempted to incorporate current pavement conditions (i.e., existing snow or ice on the road) when a new storm arrives?
Yes: Through our Maintenance Decision Support System (MDSS) we capture, to the best of our ability, the current pavement conditions at all times.
Have you successfully included a duration term (length of storm event) in your calculation?
Yes: We capture hours of precipitation as well as hours of blowing snow which covers storm events. If there is a break in these conditions for more than 6 hours, then it is a new event.
Have you run into issues regarding differing climate zones across your state? If so, how have your dealt with that? Please explain.
No: We used to when we didn't take into consideration blowing snow, but now with our MDSS system we are able to capture blowing snow and use this in our index.
Please share any lessons you have learned throughout the development and/or use of the SSI/WSI at your agency.
It is very difficult to get all to agree on what you really want to capture or the goals you want to reach with an index. Talk early and often with all levels of staff to try to define what the goals really are.
Whether or not your agency already uses an SSI/WSI, please describe what your ideal severity index would be like, how would it be used?
Winter Maintenance Response Index Features : • Uses same weather variables • Output is based on Labor, Materials and Equipment • Uses individual plow sections • Not normalized reflects costs as entered by DOT, can vary area/area and year/year • Objective not influenced by agency response to events • Flexible can be used for varying time periods, day/day, month/month, year/year, winter to date, region to region • Scalable results can be shown as statewide, maintenance area, subarea, truck station or plow route Uses : • Provides costing information to make business

211
decisions • Compare against cost data from maintenance management systems and/or data recorded using Automated Vehicle Location systems • See difference between actual costs and theoretical costs • Efficiency indicator • Can run past winters data to show cost of new practices or products • What if scenarios • Can show cost of increasing or reducing level of service in similar weather conditions • Can be used to develop and verify best practices What's Needed to Get Started: • Clearly define what your goals/objectives are. • Do you just want to compare weather severity? • Relatively easy • Do you want to compare costs of maintenance? • More difficult as you have to use actual costs, differing level of service across areas, etc. • Salt might cost $40/ton in south and $115/ton in the north • Might have weaker winter in an area that ends up costing more because of the higher level of service needed. • Involve and engage the right people from the beginning • Upper Management • Maintenance Decision Makers • Weather Experts (Meteorologists) • MDSS system (way to take subjectivity out of data and data gathering process)
Task 3 Follow-up
Jakin Koll of MnDOT supplied the information below during a phone interview on September 18,
2019.
1. We read the white paper describing the WSI methodology MnDOT uses with MDSS. Maze et al.
(2009) described a relationship between maintenance performance and weather in Minnesota,
and we are wondering if you are using any of that methodology, or solely MDSS?
MnDOT did use a basic index once that was based on field-reported number of snow events,
number of freezing rain events, accumulation and duration, but because blowing snow was a
major concern that was not being captured by this method, a more inclusive method was sought.

212
The rest of these questions are in regard to MnDOT's use of MDSS as described in the white paper.
2. Please briefly list some successes you have had with this index method.
It meets the basic need for displaying how severe a winter was compared to previous winters.
MnDOT believes it works for every weather scenario they wish to capture, as it includes all the
weather variables that affect the roads. They are able to capture blowing snow now, which they
weren’t able to with our last method.
3. What challenges have you faced with it?
Jakin reports that MnDOT might be on the cusp of a big change on the index, given that they
now have some new tools, including an upgraded RWIS network. The current index only uses 7 or
8 airport stations (ASOS) and their assigned surrogate routes, but the desire is to add all 850
routes and calculate WSI using RWIS data. They are also on the path toward automating the
calculation.
4. When is the index calculated (e.g., daily, post-storm, seasonally, etc.)?
The index is calculated over a winter to view the season as a whole.
5. Over what area is the index valid (e.g., per district, per garage, etc.)?
It is calculated by district and statewide.
6. Please provide a clarified explanation of how the index is calculated.
Surrogate (representative) routes were assigned to airport weather stations across the state.
When MDSS is run over the whole winter, it comes up with the recommended cost per lane mile
for the particular LOS on each of those routes. If the costs and LOS are kept the same, the only
thing that varies is the weather, and so, using MDSS, they can see how severe the weather was,
in the context of treatment.
7. Are the data and devices managed and maintained sufficiently for their use in the index? What
practices are required to keep the data quality high?
The method uses airport stations because RWIS precipitation reports weren’t sufficient a few
years ago. However, since MnDOT has upgraded their whole RWIS network and the data are
more robust, they are ready to explore using RWIS data for the index.
8. Where is the algorithm housed and who runs it and produces the results?
MnDOT’s contractor (Iteris) helped set up MDSS. MnDOT now runs MDSS and performs the
calculations.
9. Were there certain groups within your agency or external to your agency that were recruited to
assist with building the index? Would you change who you brought to the table if you had to do
it again?
(See above.)
213
10. How has the core knowledge of the index been passed onto other agency employees? Have you
hosted internal workshops or trainings for key employees to be familiar with the index?
Running the index is mostly Jakin’s job, yet the middle and upper management have a stake in
analyzing and communicating the results.
Task 4 Follow-up
The research team conducted a second phone interview with Jakin Koll on October 28, 2019.
1. What upgrades have you done to the RWIS network that will allow them to be more trustworthy
for WSI?
a. MnDOT has made many updates to the RWIS system. They are installing around 60 new
sites, which will bring the total number of RWIS sites close to 160. This is in order to
optimize the network and fill in gaps. Great to have for areas with more diverse land
use/terrain.
b. Instrumentation upgrades: Precipitation sensors which give them rate and amount, road
temp and road condition, and non-invasive friction.
c. They still use ASOS in conjunction with radar and RWIS, etc. MDSS does this. Weather
model analysis used for hour 1.
2. What do you do to keep the reliability of the data high?
a. In-house maintenance—road weather technology team. Managed by a couple positions
in MnDOT. Radio technicians do the work. Vendor sometimes has to step in.
b. Place a high priority on keeping them working, especially the really important ones.
Culturally, there is a lot of support for them. Lots of use of RWIS by the field crews and
counties, too.
c. Some automated QC with Iteris.
d. Jakin reported pretty smooth going with RWIS sites being up and functioning most of
the time.
3. What data would you like to include if you could?
a. It would be helpful to have a response index. Right now, our calculation keeps
everything the same across the state, but—yes, weather is different, but so is the
response. There are 5 LOSs, differing bare lane time requirements, different traffic
demand, etc. We can use MDSS recommendations: it can program LOS needs into
MDSS, and it makes those recommendations.
b. It is “tunnel vision” to only equate amount of snow to cost or resource use. These things
are driven by freezing rain, temperatures, winds, number of events, etc.

214
Montana DOT
Task 1 Literature Review
Montana DOT uses the Accumulated Winter Season Severity Index (AWSSI), described in Boustead et
al. (2015). A summary of this publication follows:
Boustead et al. (2015) developed a method to estimate snowfall where snow data was unavailable or
unreliable by using a proxy that combines temperature and precipitation. Ultimately the data and proxy
values were used to calculate accumulated WSIs. The method is called the Accumulated Winter Season
Severity Index (AWSSI). Data used include daily maximum, minimum, and average temperature,
precipitation, snowfall, and snow-depth data from the Applied Climate Information System (ACIS)
database.
This paper includes a discussion of how winter was defined. For this effort winter onset occurs when:
4) The daily maximum temperature is ≤ 32 °F,
5) Daily snowfall ≥ 0.1 in., or
6) It is December 1st.
The end of winter was defined as occurring when:
4) The daily maximum temperature ≤ 32 °F no longer occurs,
5) Daily snowfall ≥ 0.1 in. is no longer observed, or
6) It is March 1st.
To calculate the WSI, points were assigned for various parameters (see Figure 43), from which summary
categories were created. In order to make the severity values more understandable in a statistical
context:
• W-1: Mild; min to 20th percentile
• W-2: Moderate; 21st to 40th percentile
• W-3: Average; 41st to 60th percentile
• W-4: Severe; 61st to 80th percentile
• W-5: Extreme; 81st percentile to max

215
Limitations to the AWSSI resulting from its reliance on climatological records (which can be limited in
detail and coverage), as reported by the authors are:
• No points for freezing rain explicitly
• No points for mixed precipitation explicitly
• No wind or wind-based phenomena are included.
• It would not work well in a climate which experiences persistent snowpack or maximum
temperatures below freezing all winter.
The precipitation-based AWSSI (pAWSSI) was introduced as a slight modification to the AWSSI, to better
represent heavy-precipitation events and milder climates. It requires a calculation algorithm to convert
precipitation data to a snowfall proxy, or a representation of the character of snowfall and wintry
precipitation through the season, using daily temperature data. The authors also showed how AWSSI
can be used to review severity trends in a climatological context.
Task 2 Survey Response
Relevant survey responses follow:
Survey Question Response
How is the SSI/WSI used at your agency? For maintenance performance measurement
Generally speaking, does the severity index you use currently meet your needs? How or how not?
Yes, but here are some things I like about it and some things I don't: I would like more sites
Which of the following variables are used in the SSI/WSI calculation?
Air temperature, Snow depth, Precipitation, Other, Additional Comments: MDT uses the indices found at: https://mrcc.illinois.edu/research/awssi/indexAwssi.jsp#info
Figure 9: Summary of variables and associated points in the AWSSI method.

216
Please comment on the data sources you use to get this data. For example, is RWIS the sole source of the data, or do you use multiple sources?
https://mrcc.illinois.edu/research/awssi/indexAwssi.jsp#info
Please describe how the SSI/WSI is calculated, either by writing out the equation or describing it.
see web site https://mrcc.illinois.edu/research/awssi/indexAwssi.jsp#info
Is the SSI/WSI calculated statewide or on a smaller scale?
Regionally, by Maintenance District, Other: where there are sites
When is the WSI calculated? Real-time
Please share any lessons you have learned throughout the development and/or use of the SSI/WSI at your agency.
This has been a good tool for comparing season averages of work units, material usage and normalizing with AWSSI
Do you feel you and or your agency could use support in the development or advancement of a WSI/SSI?
Yes: We like the AWSSI and would like to have more sites
Task 3 Follow-up
The following paragraph describes the data source in more detail. The data comes from the Applied
Climate Information System (ACIS), which is composed of Global Historical Climate Network (GHCN)
sites. The GHCN is an “integrated database of climate summaries from land surface stations across the
globe that have been subjected to a common suite of quality assurance reviews,” according to the GHCN
information page of NOAA’s National Centers for Environmental Information
(https://www.ncdc.noaa.gov/data-access/land-based-station-data/land-based-datasets/global-
historical-climatology-network-ghcn). From this network, Boustead et al. gathered the sites that had the
most complete records. Boustead et al. (2015) state that “winter seasons with missing snow or
temperature data were excluded if the missing data were estimated to contribute 5.0% or more of the
total AWSSI for that season.” Other quality checks were put into place to ensure the sites chosen had
complete datasets. The remaining sites are shown in the figure below. There are 5 sites spread across
the state of Montana (Figure 44).
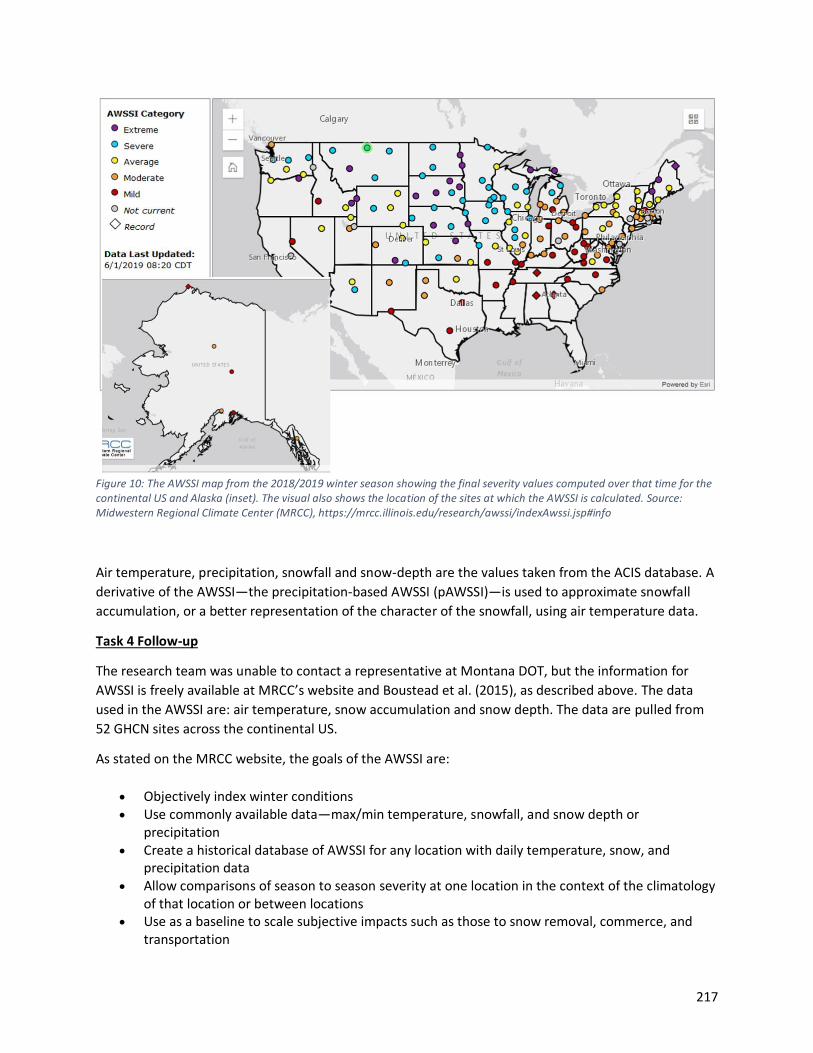
217
Figure 10: The AWSSI map from the 2018/2019 winter season showing the final severity values computed over that time for the continental US and Alaska (inset). The visual also shows the location of the sites at which the AWSSI is calculated. Source: Midwestern Regional Climate Center (MRCC), https://mrcc.illinois.edu/research/awssi/indexAwssi.jsp#info
Air temperature, precipitation, snowfall and snow-depth are the values taken from the ACIS database. A
derivative of the AWSSI—the precipitation-based AWSSI (pAWSSI)—is used to approximate snowfall
accumulation, or a better representation of the character of the snowfall, using air temperature data.
Task 4 Follow-up
The research team was unable to contact a representative at Montana DOT, but the information for
AWSSI is freely available at MRCC’s website and Boustead et al. (2015), as described above. The data
used in the AWSSI are: air temperature, snow accumulation and snow depth. The data are pulled from
52 GHCN sites across the continental US.
As stated on the MRCC website, the goals of the AWSSI are:
• Objectively index winter conditions • Use commonly available data—max/min temperature, snowfall, and snow depth or
precipitation • Create a historical database of AWSSI for any location with daily temperature, snow, and
precipitation data • Allow comparisons of season to season severity at one location in the context of the climatology
of that location or between locations • Use as a baseline to scale subjective impacts such as those to snow removal, commerce, and
transportation
218
• Apply to multiple users and their needs
Thus, AWSSI’s scale is broad. [See the New York DOT section below for details on how additional
weather stations are being included as a supplement to AWSSI.]
Other limitations listed on the website are:
• Does not include wind (e.g. wind chill, blowing snow) • Does not include mixed precipitation or freezing rain explicitly (a precipitation‐only version of
AWSSI may help address impacts of these events) • Thresholds have been set with impacts in mind and are subject to adjustment in the future as
analysis continues.
Blowing snow and freezing rain are frequently cited as critical weather information for severity
calculations.
219
Nebraska DOT
Task 1 Literature Review
Summary from Walker et al. (2017):
This conference presentation provided a summary of the winter severity index, called NeWINS,
developed for the State of Nebraska. NeWINS is unique in that it calculates varying levels of complexity
of atmospheric conditions. NeWINS is also simple and easy to use. The project included a literature
review and rigorous data collection to create a ten-year database, including the following storm types –
light snow, moderate snow, heavy snow, and air and road surface temperatures, and wind conditions.
Data was captured from the High Plains Regional Climate Centers Automated Weather Data Network
(AWDN), the National Centers for Environmental Information (NCEI), and the Meteorological
Assimilation Data Ingest System (MADIS).
The NeWINS is designed to provide data at the district level across the state. Testing of system was
conducted in 2016-2017 winter season.
Summary from Walker et al. (2018):
Walker et al. (2018) developed the Nebraska Winter Severity Index (NEWINS) for the Nebraska DOT. This
technical paper follows from the presentation by Walker et al. (2017). Weather variables included were:
snowfall total, snowfall rate (derived), wind speed, air temperature, district area (fraction of district
experiencing storm), duration, and visibility. Road temperature and freezing rain data were not included
in the development of the NEWINS despite their desirability, due to their lack of reliability and
availability over the study period.
Atmospheric data came from ASOS stations, and snowfall observations were obtained from Global
Historical Climatology Network-Daily (GHCN-D) sites within 9 miles of an ASOS station. The GHCN-D sites
include data from the Community Collaborative Rain, Hail and Snow (CoCoRaHS) network, the Nebraska
Rainfall Assessment and Information Network (NeRAIN), and the NWS Cooperative Observer (COOP)
network. Most GHCN-D sites record once-daily, 24-hour snowfall amounts measured at about the same
time, but there can be some temporal variability. Quality control was performed on stations, and a few
were removed for erroneous or incomplete datasets.
The index was computed for a single storm event, defined by an hourly ASOS station observing frozen
precipitation.
A categorical severity ranking was created, ranging from Category 1 (trace, low impact storms, no winter
maintenance operations activity) to Category 6 (high, significant impact storms, maximum winter
maintenance operations activity with possible suspensions necessary due to safety concerns). A
breakdown of the variables by category is shown below in Figure 45.

220
Figure 11: A breakdown of variables and categories developed for Nebraska DOT.
Weights for each variable were developed using expert opinion, and the final category was calculated
as the sum of each weighted variable category. The final NEWINS calculation is:
NEWINS can be computed statewide or district by district.
Task 2 Survey Response
Survey responses from Dr. Curtis Walker (researcher):
How is the SSI/WSI used at your agency? For maintenance performance measurement; I am a researcher, and I developed a severity index for: Nebraska and Colorado DOTs
Generally speaking, does the severity index you use currently meet your needs? How or how not?
Yes, but here are some things I like about it and some things I don't: I like that it classifies and quantifies the accumulated impact of individual storms over an entire winter season; however, there are parameters missing. These include road pavement temperature due to concerns regarding data fidelity/quality. Further, freezing rain/sleet is not presently considered due to difficulty in confirming ice accretion on roadway surfaces rather than elevated trees / powerlines / ASOS equipment.
Do the variables and calculation you use work for every weather scenario you wish to capture? Please discuss the ways in which it does and does not work for your agency’s purposes.
They work for all snow-related events. They do not capture freezing rain events at this time.

221
If applicable to your climate, have you been successful at capturing freezing rain in your WSI?
No: Happy you asked this, freezing rain verification is challenging however I would direct you to the work of Barjenbruch and Sanders (2016) using an ice accretion/ASOS method
If applicable to your climate, have you been successful at capturing effects of very cold temperatures (°F)?
Yes: Each weather variable receives a weighted categorical assignment, air temperature being one of them
Have you attempted to incorporate current pavement conditions (i.e., existing snow or ice on the road) when a new storm arrives?
No: Difficulty in assessing pavement condition. Perhaps traffic camera data and/or a product like Harris Helios could inform this component
Have you successfully included a duration term (length of storm event) in your calculation?
Yes: Each weather variable receives a weighted categorical assignment, duration being one of them
Please share any lessons you have learned throughout the development and/or use of the SSI/WSI at your agency.
These indices are best developed for individual states. While some frameworks provide flexibility and are transferable to other areas they may still need to be tuned or tailored to things like state DOT districts, regions, or other areas of responsibility
Whether or not your agency already uses an SSI/WSI, please describe what your ideal severity index would be like, how would it be used? (For example, would you like it to be able to capture certain weather phenomena? Would you like it to be very specific and data intensive, or broader and more “big picture”? Would it have a specific end use?)
Both. I would envision several indices with multiple drop-down menus from the NWS Winter Storm Severity Index, to the AWSSI, to a more microscale road weather index
Task 3 Follow-up
The research team conducted a phone interview on 10/3/2019 with Dr. Curtis Walker to obtain the
following information.
• Please elaborate on the survey response where he stated the pavement temp data was of poor
quality.
o Response: Curtis did the work for Nebraska at a time when they were between RWIS
contractors, this in part and relying on older data from stations that were not being
maintained well led to the decision to not use pavement temperature data because it
was not consistent. Pavement condition or pavement temperature is important but is
not included in the Nebraska model. This could be reevaluated now that a new RWIS
contractor is in place. The WSI was designed as a meteorological model, to make it a
transportation specific model, adding in pavement condition will be key.

222
o Curtis works for CDOT one day a week at NCAR - Colorado DOT has a similar issue, in the
list of DOT priorities it does appear they are maintaining these sites to the level they
need to be for research purposes.
• You a have a lot of experience in establishing and deploying WSIs, what advice would you give a
state that is interested in developing one?
o Having individuals that represent all sectors of the DOT at the table for the development
and deployment of WSI is critical—e.g., an engineer, meteorologist, etc. You want to
have everyone at the table. Think of WSI development as an iterative process. Once a
WSI is developed it will evolve; you apply it to MDSS, apply safety and cost data, etc.
You need to have a person at the table the represents/relates to all the potential data
sources and uses.
o Have a clear vision of what the state wants to do with the WSI? (Use to justify funding,
big picture seasonal analysis, etc.).
o Knowing what data is available that you want to go into the WSI: # of snow days, total
snow fall, hours of precipitation? All of these questions can be relevant.
o Knowing what the quality of data is that is available? How the data reported?
• From your perspective were any variables surprising in terms of their significance or lack of
significance and why?
o Visibility from local ASOS or RWIS is different from visibility from a car driving down the
road. It was the least numerically weighted variable in the equation, but it was the
number one reason Winter Maintenance Operations were suspended, due to poor
visibility and safety. If he had to do it again, he’d try to figure out how to get the
visibility importance/factor accurately incorporated.
o From a qualitative framework extreme poor visibility is reflected. Averaging visibility
over space and time became an issue. For larger events you could see it in the data, due
to a bigger signal, but for smaller events it was not captured.
• Training and Implementation of the WSI
o He was involved in the implementation and training for the Nebraska DOT staff. Now
that is really only the state meteorologist. Down the road, long term they may need to
train more folks. Curtis did not conduct trainings at the maintenance shed level. The
DOT meteorologist would do training for personnel as needed and they present WSI
findings at the annual meeting.
• How would you assess freezing rain/sleet?
o Categorical assignment – light glaze = 1, ¼ in= 6, etc. Could come up with thresholds.
o Or the instant you have freezing rain treat it as a severe condition. Freezing rain/ice is a
wild card to deal with because it is not just the event itself that is the issue, is the
secondary ice, falling branches, car accidents, etc. that make it so severe.
o With freezing rain do you really need to know how much of it you have or can it be a
yes/no condition. If yes = extreme, if no= then all other conditions come in to play.
Immediately make freezing rain a worst-case scenario. Not sure if this is the best way to
handle it.
• What are some lessons learned from the development of the Nebraska WSI?
o Nebraska and Curtis were really adamant about looking at all the research. What he
found was that for many WSIs the final output numbers were meaningless compared to

223
others, and they wanted to create a WSI index that was replicable. Which they feel they
did in Nebraska. Now he is working to apply this to the WSI in Colorado and other
states.
o The final WSI values need to define what various ranges in values mean. For example, it
was not clear what makes a 62 different from 75? What does each category mean?
o In hindsight, developing a WSI is a lot more complicated and convoluted of process that
originally thought. But he feels they had a good team put together, connecting more
with others who have developed WSIs, get their feedback, getting a sense of the
process.
o Vaisala and Colin Walsh, friction-based index for Colorado and Idaho was developed but
is it being used in Colorado? [We look into this further in our discussion with CDOT.]
When he works with Colorado, he uses the WSI developed for Nebraska, but
CDOT says that they use the Clear Road method in MDSS. But Curtis does not
use that index, so it really depends who you ask.
o Is it worthwhile to team with a private provider to provide WSI?
o Wisconsin [and others] releases an annual report with their winter severity.
o In Nebraska the WSI seems to be run ad hoc, Curtis still helps to get and process the
data, and run the WSI. The time is in pulling the data down, not in running the code.
o Need to build in how the WSI will be translated into implementation and training at the
maintenance level.
Task 4 Follow-up
The WSI developed by Curtis Walker uses atmospheric data, not road weather data. Weather variables
include: snowfall total, snowfall rate (derived†), wind speed, air temperature, district area (fraction of
district experiencing storm), duration, and visibility. Road temperature and freezing rain data were not
included in the development of the NEWINS despite their desirability, due to their lack of reliability and
availability over the study period.*
†Snowfall rate is derived by snowfall total divided by duration of event. According to Curtis Walker, “an
important limitation of this approach is that it misses the peak intensity snowfall (whether due to
banding or other atmospheric dynamics). With that said, this approach is also extremely sensitive to
snow squalls (short duration, high intensity, quick accumulations) that are also likely associated with
even more travel hazards and incidents though it's possible these could also be overrepresented as well.
The ability to assess instantaneous snowfall rate (and subsequent impacts) would be a valuable future
avenue.”
*According to Curtis Walker, he did the work for Nebraska at a time when they were between RWIS
contractors. That, in part, plus relying on older data from stations that were not being maintained well
led to the decision to not use pavement temperature data because it was not consistent. Pavement
condition or pavement temperature is important and is missing from the Nebraska model. This could be
reevaluated now that a new RWIS contract is in place. The WSI was designed as a meteorological model,
to make it a transportation specific model, adding in pavement condition will be key.
Atmospheric data came from ASOS stations, and snowfall observations were obtained from GHCN-D
sites within 9 miles of an ASOS station. The GHCN-D sites include data from CoCoRaHS, NeRAIN, and the
NWS COOP network. The GHCN datasets are complete and trusted sources for climatological

224
information within the meteorological community. CoCoRaHS is a nonprofit program (sponsored by
NOAA, National Science Foundation, and others) composed of volunteer precipitation observers around
the country. The program requires training and education. Precipitation type and totals are recorded by
volunteers daily. NeRAIN is a similar program to CoCoRaHS, but on a state-wide scale. See Task 4 Follow-
up in the Massachusetts DOT section for quality assurance information on COOP snowfall measurement.
Curtis also performed quality control on the data, and a few stations were removed for erroneous or
incomplete datasets.
225
New York State DOT
Task 1 Literature Review
Summary from Chien et al. (2014):
Chien et al. use the index developed by Mewes (2011) in this work done for New York State DOT. The
index includes a term for freezing rain. In order to acquire freezing rain data, Meteorological Terminal
Aviation Routine (METAR) reports (human observations that are logged at airports) and the North
American Model (NAM*) were used. The variables and weights assigned to them were altered slightly
from Mewes’ index after gathering the opinions of NYSDOT staff.
Task 2 Survey Response
NYSDOT did not submit a response to the Task 2 survey.
Task 3 Follow-up
The responses gathered during Task 3 (from Joe Thompson and Dr. Nick Bassill) follow.
Joe Thompson: We’re working with some very talented people at the University at Albany who are
managing 120+ Mesonet stations.
I’ve used the RAWSSI (pAWSSI) model for the stations in NYS and Burlington, VT for analysis this past
year. My hope is to extend this to the Mesonet stations in the future.
Dr. Bassill: I'm excited to use NYS Mesonet data for purposes like this - with a possible goal of eventually
forecasting these storm-scale indices for potential improved storm preparation, and a baseline goal of a
more/better granular understanding of severity for NY based on the density of available weather data.
Task 4 Follow-up
The research team interviewed Joe Thompson (NYSDOT Snow & Ice Program Manager), Dr. Nick
Bassill (Modeler and Meteorologist, SUNY Albany Center of Excellence in Atmospheric and
Environmental Prediction and Innovation and New York State Mesonet), and Ken Relation (NYSDOT
Snow and Ice Assistant Program Manager) on 10/18/2019.
1. Are you currently using the AWSSI]?
AWSSI (Accumulated Weather Season Severity Index,
https://mrcc.illinois.edu/research/awssi/indexAwssi.jsp) is being used. Just Joe is using it himself
now. The goal is to have as close to real time WSI reported as is feasible, but not until after they
get a good/better model. The WSI model is not good enough to do what Joe wants. Joe would
like to have dashboards reporting for all levels in the state to show good/bad performers,
highlight training needs, LOS considerations, etc. AWSSI is good for the WSI for now but is based
on limited data. Currently there are 11 AWSSI sites usable or in NY that feed into the current
WSI (see Figure 46). With the addition of the mesonet data they feel it will be better.

226
Figure 12: showing data from the existing 11 AWSSI sites that are usable by NYSDOT for their WSI calculation.
Figure 13: Map of NY showing mesonet sites.
NYS has made a significant investment in the mesonet to make their data source more robust.
The idea for mesonet came about after Hurricane Irene and was then funded after Hurricane
Sandy. Installation began in 2016 $30M, half of this went instruments. Mesonet sensors include

227
- temp x2, wind speed, solar rad., camera, soil temp x3, snow depth, atmospheric pressure, etc.
for all sites. There are 120 Mesonet stations. Joe is looking to have data sources closer to each
beat. A crew goes out and services all sites. This is a very high-quality sensor network and data
set (Figure 47). These sites were chosen to provide meteorological data for large scale storm
events like hurricanes using the meteorological classification system, and were not chosen
based on data needs for winter maintenance operations (e.g., no pavement surface
temperature data, and these sites are usually bad for snow data collection). But because of the
locations, they have an excellent ability to show snow drifting in the state. They are able to do
this because they capture drifting snow data with cameras, snow depth, wind, etc.
Using the mesonet data, they are able to generate maps of all parameters; the figure below
shows an example map (Figure 48).
Figure 14: Map of NY topography and mesonet sites as an example map that can be made using the mesonet network/data.
Nick wants to work on being smarter about map creation. For example, right now they are good
at capture drifting snow, but because that can skew snow depth/snow accumulation reported,
they want to work on removing drifting snow from the snow accumulation variable to show the
high variability of snow depth.
Nick and Joe are still working out how to best incorporate the AWSSI and mesonet data into the
WSI.
They have discovered a potential proxy measurement for freezing rain using the mesonet data.
Each mesonet site has two wind sensors (sonic and propeller). They have found that the
propeller sensor will freeze up in freezing rain and the sonic wind sensor will still report. Thus,
they can report freezing rain using this proxy condition. This method still needs to be studied
and developed before it is used, however.
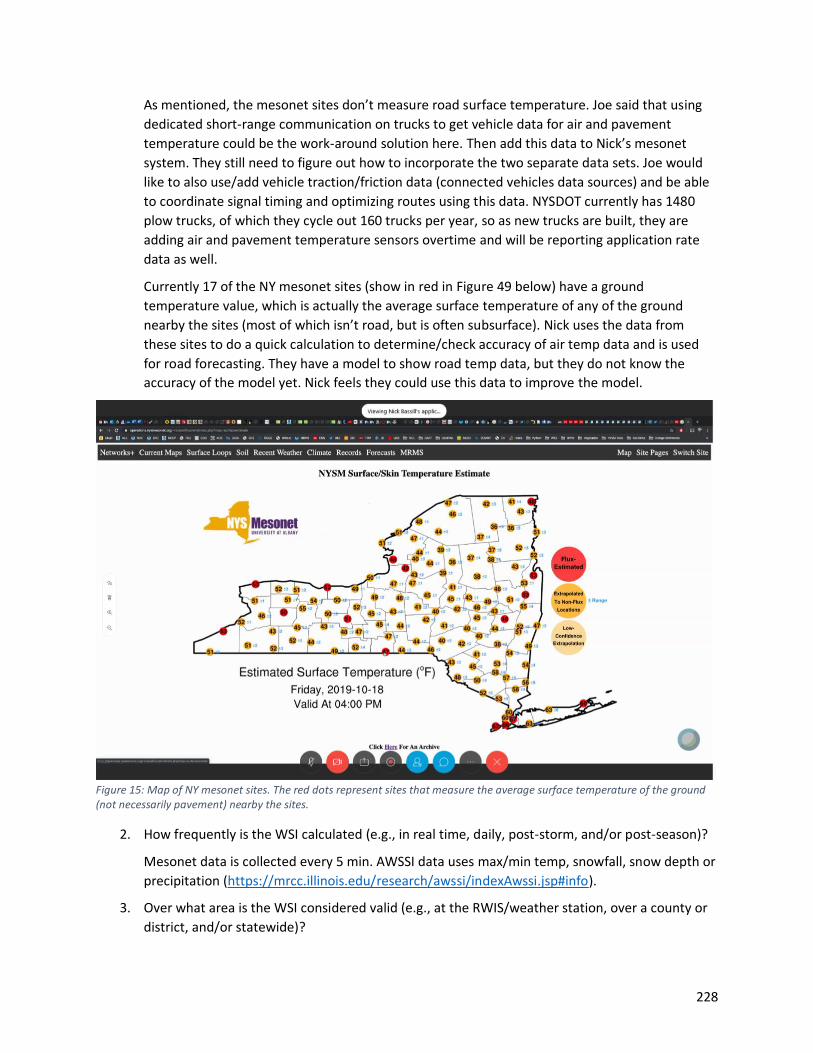
228
As mentioned, the mesonet sites don’t measure road surface temperature. Joe said that using
dedicated short-range communication on trucks to get vehicle data for air and pavement
temperature could be the work-around solution here. Then add this data to Nick’s mesonet
system. They still need to figure out how to incorporate the two separate data sets. Joe would
like to also use/add vehicle traction/friction data (connected vehicles data sources) and be able
to coordinate signal timing and optimizing routes using this data. NYSDOT currently has 1480
plow trucks, of which they cycle out 160 trucks per year, so as new trucks are built, they are
adding air and pavement temperature sensors overtime and will be reporting application rate
data as well.
Currently 17 of the NY mesonet sites (show in red in Figure 49 below) have a ground
temperature value, which is actually the average surface temperature of any of the ground
nearby the sites (most of which isn’t road, but is often subsurface). Nick uses the data from
these sites to do a quick calculation to determine/check accuracy of air temp data and is used
for road forecasting. They have a model to show road temp data, but they do not know the
accuracy of the model yet. Nick feels they could use this data to improve the model.
Figure 15: Map of NY mesonet sites. The red dots represent sites that measure the average surface temperature of the ground (not necessarily pavement) nearby the sites.
2. How frequently is the WSI calculated (e.g., in real time, daily, post-storm, and/or post-season)?
Mesonet data is collected every 5 min. AWSSI data uses max/min temp, snowfall, snow depth or
precipitation (https://mrcc.illinois.edu/research/awssi/indexAwssi.jsp#info).
3. Over what area is the WSI considered valid (e.g., at the RWIS/weather station, over a county or
district, and/or statewide)?

229
Only 11 AWSSI stations and apply over the whole state. Joe shared WSI analysis with all sheds
and they feel like it is accurate.
4. For what purpose is the WSI used at your agency?
Currently used for high-level analysis. Moving forward Joe is looking at having a performance
metric applied using the WSI that is calculated, such as: how quickly do the roads return to
normal after an event? He would like a dashboard of all data for comparisons.
5. What successes and challenges have you had with this method?
Benefits of high-level view of WSI using AWSSI: have a measure of how much product used and
LOS which is good, but they want to take it to the next level.
They have heavy prolonged lake effect snow and trying to capture the variable condition across
the state is a challenge with AWSSI.
Nick shared the Risk Assessment Dashboard (Figure 50). This will provide likelihood and
potential expectation of weather risks (wind, snow, any conditions in a certain time). This
forecast component is done by University of Albany and it is separate from Nick’s work
managing the mesonet system and data, but they are using the mesonet data. If Risk
Assessment forecast is off, as new data comes in it will recalculate, maps are made every hour
and therefore risk assessment is recalculated each hour with new data. This project is just
starting. (Use mesonet data to make more granular indices – storm severity index and forecast
data to be able to say, “tomorrows storm will a level 7”, for example. This is a next steps
research idea that is not funding yet.) It is scaled by time and location.
Figure 16: Mesonet data showing forecasted weather risk assessment that is updated hourly based on actual data.
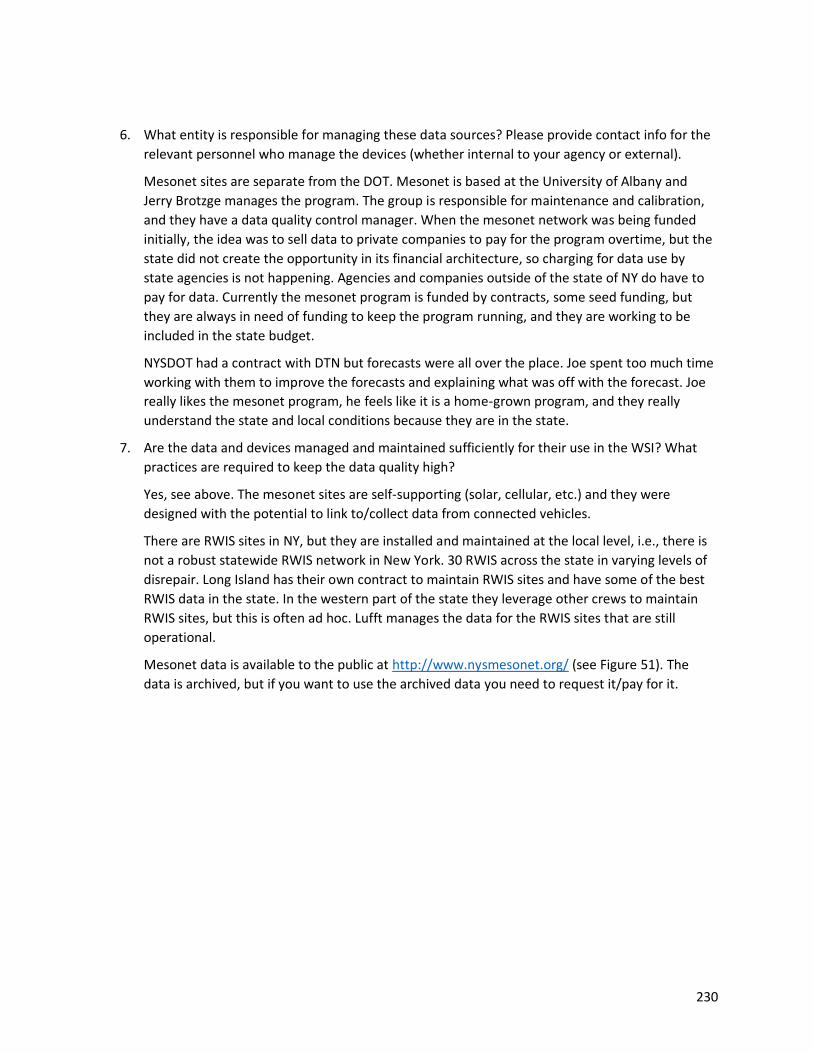
230
6. What entity is responsible for managing these data sources? Please provide contact info for the
relevant personnel who manage the devices (whether internal to your agency or external).
Mesonet sites are separate from the DOT. Mesonet is based at the University of Albany and
Jerry Brotzge manages the program. The group is responsible for maintenance and calibration,
and they have a data quality control manager. When the mesonet network was being funded
initially, the idea was to sell data to private companies to pay for the program overtime, but the
state did not create the opportunity in its financial architecture, so charging for data use by
state agencies is not happening. Agencies and companies outside of the state of NY do have to
pay for data. Currently the mesonet program is funded by contracts, some seed funding, but
they are always in need of funding to keep the program running, and they are working to be
included in the state budget.
NYSDOT had a contract with DTN but forecasts were all over the place. Joe spent too much time
working with them to improve the forecasts and explaining what was off with the forecast. Joe
really likes the mesonet program, he feels like it is a home-grown program, and they really
understand the state and local conditions because they are in the state.
7. Are the data and devices managed and maintained sufficiently for their use in the WSI? What
practices are required to keep the data quality high?
Yes, see above. The mesonet sites are self-supporting (solar, cellular, etc.) and they were
designed with the potential to link to/collect data from connected vehicles.
There are RWIS sites in NY, but they are installed and maintained at the local level, i.e., there is
not a robust statewide RWIS network in New York. 30 RWIS across the state in varying levels of
disrepair. Long Island has their own contract to maintain RWIS sites and have some of the best
RWIS data in the state. In the western part of the state they leverage other crews to maintain
RWIS sites, but this is often ad hoc. Lufft manages the data for the RWIS sites that are still
operational.
Mesonet data is available to the public at http://www.nysmesonet.org/ (see Figure 51). The
data is archived, but if you want to use the archived data you need to request it/pay for it.

231
Figure 17: Mesonet public website to access real-time data.
They are looking into using connected vehicle data, but do not yet have the roadside
infrastructure to do this at this time.
8. Where is the algorithm housed and who runs it and produces the results?
Use the AWSSI tool (but want to add in freezing rain (RWSI))
9. Were there certain groups within your agency or external to your agency that were recruited to
assist with building the WSI? Would you change who you brought to the table if you had to do it
again?
Joe works with Nick directly, and with WTI/MSU, Clear Roads, Narwhal Group, and EDC FHWA
programs. Basically, Joe is working to make it happen.
10. We’d like to understand how the data had to be processed to work with your WSI. Do you know
what programming methods were used to make the data readable by the WSI program? Were
there fixes that had to be done once the WSI was tested and implemented?
Joe runs the WSI calculation in excel. Joe is working with Ken at NYSDOT and presents data at
the Snow and Ice University at two spots in the state each year. This is to help show folks to look
at things smarter, optimizing routes, staffing.
11. How has the core knowledge of the WSI been passed onto other agency employees? Have you
hosted internal workshops or trainings for key employees to be familiar with the WSI?

232
Nick is just starting their (Univ of Albany and the mesonet program) relationship with the
NYSDOT and want to use the Dashboard to springboard their relationship. Background in
meteorology and doing work on snow drifting and freezing rain.
Future research ideas – NSF funding for project looking at GIS analysis of beat sensitivity.
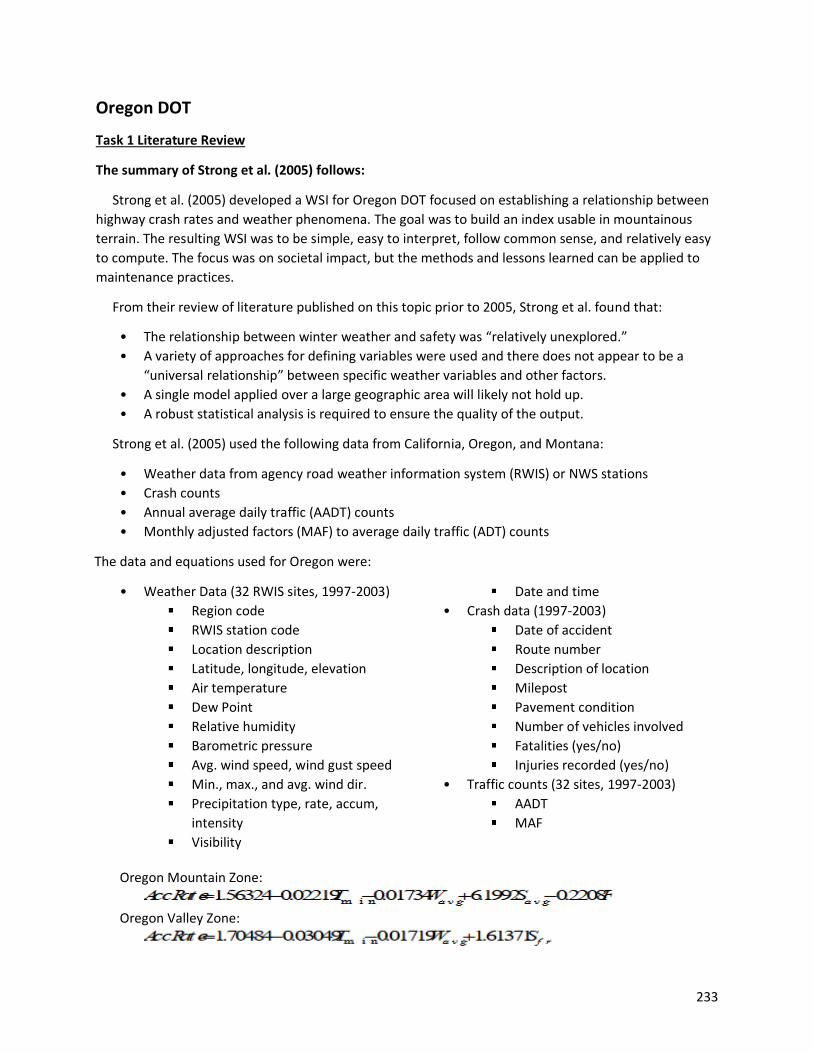
233
Oregon DOT
Task 1 Literature Review
The summary of Strong et al. (2005) follows:
Strong et al. (2005) developed a WSI for Oregon DOT focused on establishing a relationship between
highway crash rates and weather phenomena. The goal was to build an index usable in mountainous
terrain. The resulting WSI was to be simple, easy to interpret, follow common sense, and relatively easy
to compute. The focus was on societal impact, but the methods and lessons learned can be applied to
maintenance practices.
From their review of literature published on this topic prior to 2005, Strong et al. found that:
• The relationship between winter weather and safety was “relatively unexplored.”
• A variety of approaches for defining variables were used and there does not appear to be a
“universal relationship” between specific weather variables and other factors.
• A single model applied over a large geographic area will likely not hold up.
• A robust statistical analysis is required to ensure the quality of the output.
Strong et al. (2005) used the following data from California, Oregon, and Montana:
• Weather data from agency road weather information system (RWIS) or NWS stations
• Crash counts
• Annual average daily traffic (AADT) counts
• Monthly adjusted factors (MAF) to average daily traffic (ADT) counts
The data and equations used for Oregon were:
• Weather Data (32 RWIS sites, 1997-2003)
Region code
RWIS station code
Location description
Latitude, longitude, elevation
Air temperature
Dew Point
Relative humidity
Barometric pressure
Avg. wind speed, wind gust speed
Min., max., and avg. wind dir.
Precipitation type, rate, accum,
intensity
Visibility
Date and time
• Crash data (1997-2003)
Date of accident
Route number
Description of location
Milepost
Pavement condition
Number of vehicles involved
Fatalities (yes/no)
Injuries recorded (yes/no)
• Traffic counts (32 sites, 1997-2003)
AADT
MAF
Oregon Mountain Zone:
Oregon Valley Zone:

234
Oregon Plains Zone:
Assumptions made in the data processing were that weather data can only be extrapolated out 5
miles from each RWIS location, and crash data can only be used if it occurred within the 5-mile radius of
the RWIS site. Locations with very high and very low traffic counts were removed because crashes in
these locations can distort the crash rate (AADT>60,000 vehicles per day and AADT<800 vehicles per
day). New variables were calculated to create a consistent data set with the data collected by the state.
Weather station locations were classified by climactic zone: (1) mountains, (2) valleys, (3) plains. Sites
with high crash rates related to road condition and geometry were removed.
In processing the data, a normal distribution was used to model the crash data, and monthly average
crash rates were used as crashes per month per 1,000 daily vehicles on the road to account for AADT.
The cube root transformation of the response was adopted in the analysis of the data. Missing data
presented a problem.
For each statewide data set, the models were tailored and run separately each month for each zone
(1,2,3) and statewide, and found that crash rates are more attributed to weather in Oregon and
Montana than in California. It is also important to note that for California NWS data was used, whereas
RWIS was used for Oregon and Montana. The use of one set of MAF was a deficiency in the dataset and
may have caused significant bias in the models. Different weather variables had different levels of
significance in each state, such that black ice was well correlated with crash rates in California but was
not the case in Montana.
Takeaways from Strong et al. (2005):
• The models used between climactic regions, even between maintenance shops, may vary.
• Key weather variables used in the models may vary between climactic regions and maintenance
shops.
The recommended method would be to test various models on all data sets to define which models
works best where and calibrate the weather index to be intuitive.
Task 2 Survey Response
Oregon DOT did not submit a response to the Task 2 survey.
Task 3 Follow-up
The research team received the following email response from Patti Caswell.
1. Are you currently using a WSI? No.
a. If yes, please provide details or documentation here, including: method, equation,
variables, and data source.
b. If no*, why not? Is one desired? Yes, we’ve been talking a lot about it. Since Eastern
Oregon has new corridor management operational devices that warn travelers of
inclement weather or road conditions, they are looking into some sort of severity index
and are getting help from our internal ITS folks. I’m not sure how [far] along they might

235
be. If you want to follow up directly with them—you might contact Ace Clark at
[email protected] or xxx-xxx-xxxx.
We have also played around with the AWSSI developed by Clear Roads, but it has limited
data points. [Only two AWSSI sites in Oregon and located on the northern edge of the
state the borders Washington.]
Task 4 Follow-up
10/17/2019 Phone Discussion; Ace Clark, District Manager from maintenance area based in La Grande,
Oregon.
Oregon DOT is currently not using a WSI, but Ace Clark is thinking of using this data source to
develop one. It has potential to have finer resolution due to the size and consistency of the data set.
Not using Strong (2005), but some folks in the state may be. There is not a statewide mandate to
use any WSI tool/reporting program.
Ace will send the Standard Operation guidance
For Ace, using a tool like WSI started by looking at where to put resources around the state, new
hires, etc.
Currently the state requires each crew to report weather conditions 4+ times a day. It is not perfect
data but comparable over time and has great resolution.
Crew report data source: crew reporting stations, each station gives weather conditions (based on
list of options (codes), report a road surface condition, and air temperature (from mobile truck
data)) (see screen shots below for data fields). This information is shared through the Oregon DOT
TripCheck -ODOT website (https://www.tripcheck.com/). Because it is shared, it is ground-truthed
by the public.
Ace is thinking that this data set could be used for a WSI, looking at road and weather condition:
• Frequency
• Duration
• And then assign point values to each road condition or weather variable/factor
The Crew Reporting System has data saved as far back as the 2015-2016 season. ODOT IT developed
the system architecture to house the crew reporting data (Figure 52, Figure 53). Ace now needs to
work out how to capture data from the program, and how to use it in a WSI.
Ace feels that ideally you would mix all in data sources (RWIS, NWS, crew reporting, etc.) to build an
SSI/WSI.

236
Figure 18: Crew reporting system used by Oregon DOT.
Figure 19: Worker field report used by Oregon DOT.

237
Pennsylvania DOT
Task 1 Literature Review
No published materials related to Pennsylvania DOT were discovered in the Task 1 Literature Review.
The predominant source of PennDOT information comes from an agency white paper delivered via the
survey. PennDOT’s white paper does mention use of the Idaho method described in Jensen and
Koeberlein (2015) and Koeberlein (2015), which are summarized in the Idaho section above.
Task 2 Survey Response
From Pennsylvania DOT white paper:
The PennDOT white paper describes two index methods: (1) a WSI built in-house, and (2) the Idaho
index (see Jensen and Koeberlein, 2015, and Koeberlein, 2015). The in-house version is described here.
The winter season is defined as October 1 – May 1. A summary report is produced monthly and includes
WSI and maintenance cost data. The WSI is calculated in each county.
Data used for the WSI come from RWIS. For counties with multiple RWIS, a specific PennDOT stockpile is
assigned an RWIS. If a county only has a single RWIS, that site represents conditions in the entire county.
For counties with no RWIS, PennDOT uses a representative site nearby.
Winter precipitation is defined as snow (at any temperature) or freezing rain (non-snow liquid
precipitation measured when air temperature is ≤32°F). The following text describes the recording
process:
The duration and accumulation of winter precipitation shall be recorded. Measure duration to the
nearest quarter-hour; snow and freezing rain durations are to be measured and recorded separately.
Measure accumulation to the nearest tenth inch for snow, and measure freezing rain accumulation to
the nearest hundredth inch, within the requirements of the Condition Sensor Performance
Specifications. Record the accumulation and durations for each RWIS device.
Snow and freezing rain accumulations and durations shall not be combined. Snow accumulations are
reported as depth of snow in inches. Freezing rain accumulations are reported as depth of freezing rain
in inches. Duration is reported as hours of snow accumulation rounded to the nearest tenth, and hours
of freezing rain accumulation.
For Counties with no RWIS device, report winter precipitation data from the assigned RWIS device. For
Counties with a single RWIS device, report winter precipitation data for that County’s device. For
Counties with multiple devices, calculate a County Average using all devices within the County, also
report stockpile data using the assigned RWIS device. The following winter precipitation data shall be
included on the Monthly Summary Report:
• Event Total Snow Accumulation, Freezing Rain Accumulation, Snow Duration, Freezing Rain
Duration
Per RWIS Device, Stockpile, County or County Average
• Calendar Day Total Snow Accumulation, Freezing Rain Accumulation, Snow Duration, Freezing
Rain Duration
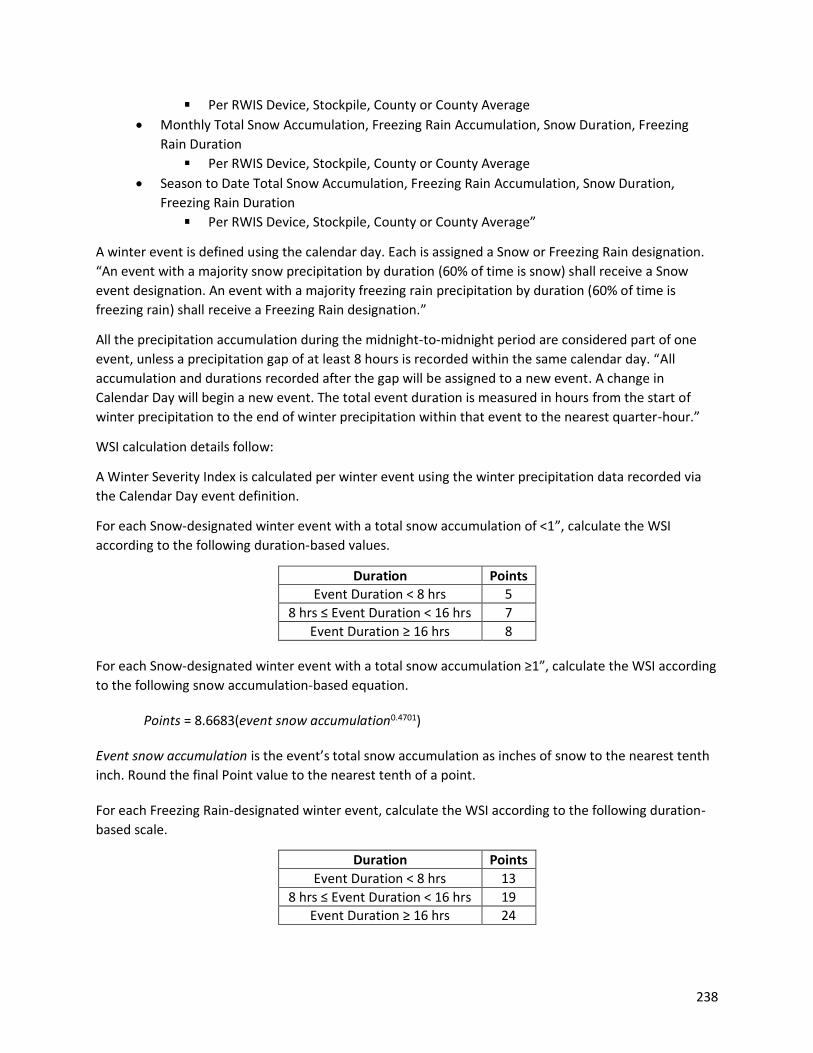
238
Per RWIS Device, Stockpile, County or County Average
• Monthly Total Snow Accumulation, Freezing Rain Accumulation, Snow Duration, Freezing
Rain Duration
Per RWIS Device, Stockpile, County or County Average
• Season to Date Total Snow Accumulation, Freezing Rain Accumulation, Snow Duration,
Freezing Rain Duration
Per RWIS Device, Stockpile, County or County Average”
A winter event is defined using the calendar day. Each is assigned a Snow or Freezing Rain designation.
“An event with a majority snow precipitation by duration (60% of time is snow) shall receive a Snow
event designation. An event with a majority freezing rain precipitation by duration (60% of time is
freezing rain) shall receive a Freezing Rain designation.”
All the precipitation accumulation during the midnight-to-midnight period are considered part of one
event, unless a precipitation gap of at least 8 hours is recorded within the same calendar day. “All
accumulation and durations recorded after the gap will be assigned to a new event. A change in
Calendar Day will begin a new event. The total event duration is measured in hours from the start of
winter precipitation to the end of winter precipitation within that event to the nearest quarter-hour.”
WSI calculation details follow:
A Winter Severity Index is calculated per winter event using the winter precipitation data recorded via
the Calendar Day event definition.
For each Snow-designated winter event with a total snow accumulation of <1”, calculate the WSI
according to the following duration-based values.
Duration Points Event Duration < 8 hrs 5
8 hrs ≤ Event Duration < 16 hrs 7
Event Duration ≥ 16 hrs 8
For each Snow-designated winter event with a total snow accumulation ≥1”, calculate the WSI according
to the following snow accumulation-based equation.
Points = 8.6683(event snow accumulation0.4701)
Event snow accumulation is the event’s total snow accumulation as inches of snow to the nearest tenth
inch. Round the final Point value to the nearest tenth of a point.
For each Freezing Rain-designated winter event, calculate the WSI according to the following duration-
based scale.
Duration Points
Event Duration < 8 hrs 13
8 hrs ≤ Event Duration < 16 hrs 19 Event Duration ≥ 16 hrs 24

239
Event WSI, daily total WSI, monthly total WSI, and season-to-date WSI are recorded in monthly
summaries.
Additional data is collected, but is not currently used in PennDOT’s WSI, including: rain accumulation, air
temperature, ground temperature, wind speed, and humidity.
Relevant survey responses follow:
Survey Question Response
How is the SSI/WSI used at your agency? For maintenance performance measurement
Generally speaking, does the severity index you use currently meet your needs? How or how not?
Yes: It is a measurement of the severity of a winter weather event in a midnight-to-midnight period.
If applicable to your climate, have you been successful at capturing freezing rain in your WSI?
Yes: WSI calculation for freezing rain events is different than snow events. An event is determined to be snow or freezing rain depending which type of precipitation occurred 60% or more of the time.
If applicable to your climate, have you been successful at capturing effects of very cold temperatures (°F)?
Yes: Surface temperatures are captured. Grip level is also calculated, which would capture icy conditions on the surface if it occurred due to low temperatures.
Have you attempted to incorporate current pavement conditions (i.e., existing snow or ice on the road) when a new storm arrives?
No: WSI is calculated solely on precipitation factors.
Have you successfully included a duration term (length of storm event) in your calculation?
Yes: Storm duration is captured with WSI data.
Please share any lessons you have learned throughout the development and/or use of the SSI/WSI at your agency.
WSI is consistent with apparent observations of winter conditions. WSI is higher in the area we would normally expect, and lower in the areas where winter weather is less prevalent.
Whether or not your agency already uses an SSI/WSI, please describe what your ideal severity index would be like, how would it be used?
The current WSI does not account for blowing or drifting snow, surface temperature impact and existing conditions at the start of an event (such as the transition between two event periods).
Task 3 Follow-up
The research team contacted Jonathan Fleming (PennDOT) to obtain the following information
(emailed response, 10/8/82019).
Attached is a project a summer Meteorology intern from Millersville University provided associating
winter severity to salt costs and how she derived the information [summarized below]. The second
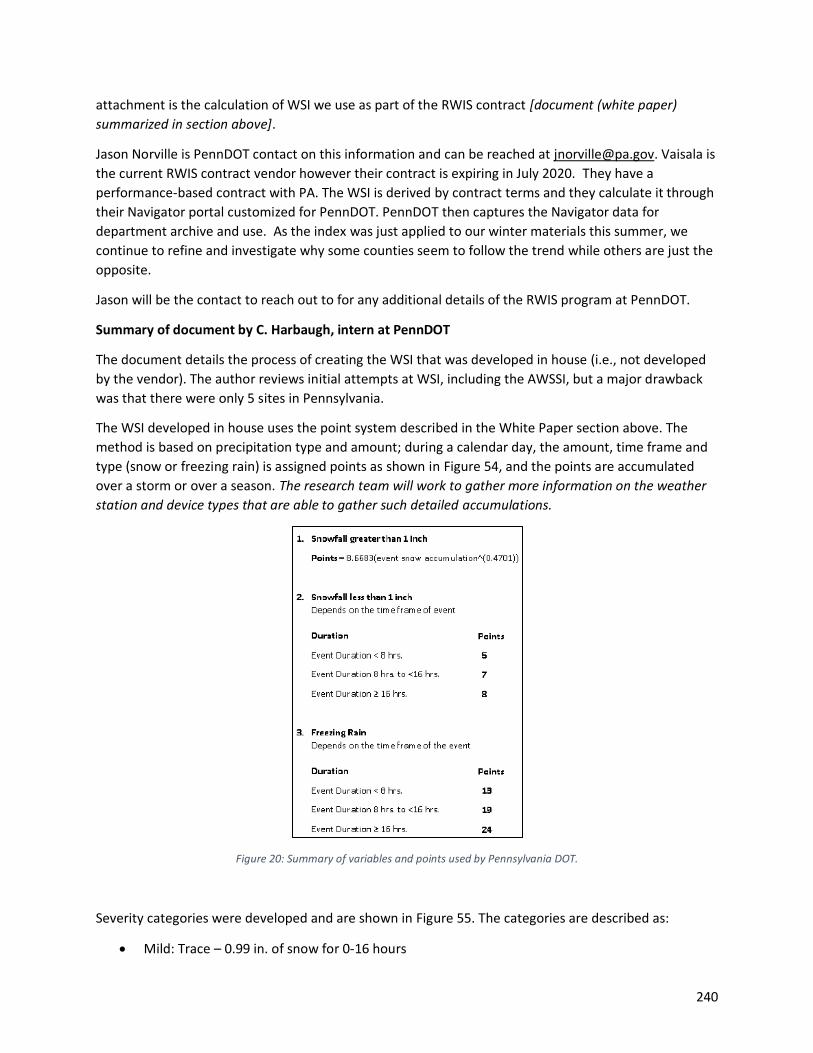
240
attachment is the calculation of WSI we use as part of the RWIS contract [document (white paper)
summarized in section above].
Jason Norville is PennDOT contact on this information and can be reached at [email protected]. Vaisala is
the current RWIS contract vendor however their contract is expiring in July 2020. They have a
performance-based contract with PA. The WSI is derived by contract terms and they calculate it through
their Navigator portal customized for PennDOT. PennDOT then captures the Navigator data for
department archive and use. As the index was just applied to our winter materials this summer, we
continue to refine and investigate why some counties seem to follow the trend while others are just the
opposite.
Jason will be the contact to reach out to for any additional details of the RWIS program at PennDOT.
Summary of document by C. Harbaugh, intern at PennDOT
The document details the process of creating the WSI that was developed in house (i.e., not developed
by the vendor). The author reviews initial attempts at WSI, including the AWSSI, but a major drawback
was that there were only 5 sites in Pennsylvania.
The WSI developed in house uses the point system described in the White Paper section above. The
method is based on precipitation type and amount; during a calendar day, the amount, time frame and
type (snow or freezing rain) is assigned points as shown in Figure 54, and the points are accumulated
over a storm or over a season. The research team will work to gather more information on the weather
station and device types that are able to gather such detailed accumulations.
Figure 20: Summary of variables and points used by Pennsylvania DOT.
Severity categories were developed and are shown in Figure 55. The categories are described as:
• Mild: Trace – 0.99 in. of snow for 0-16 hours
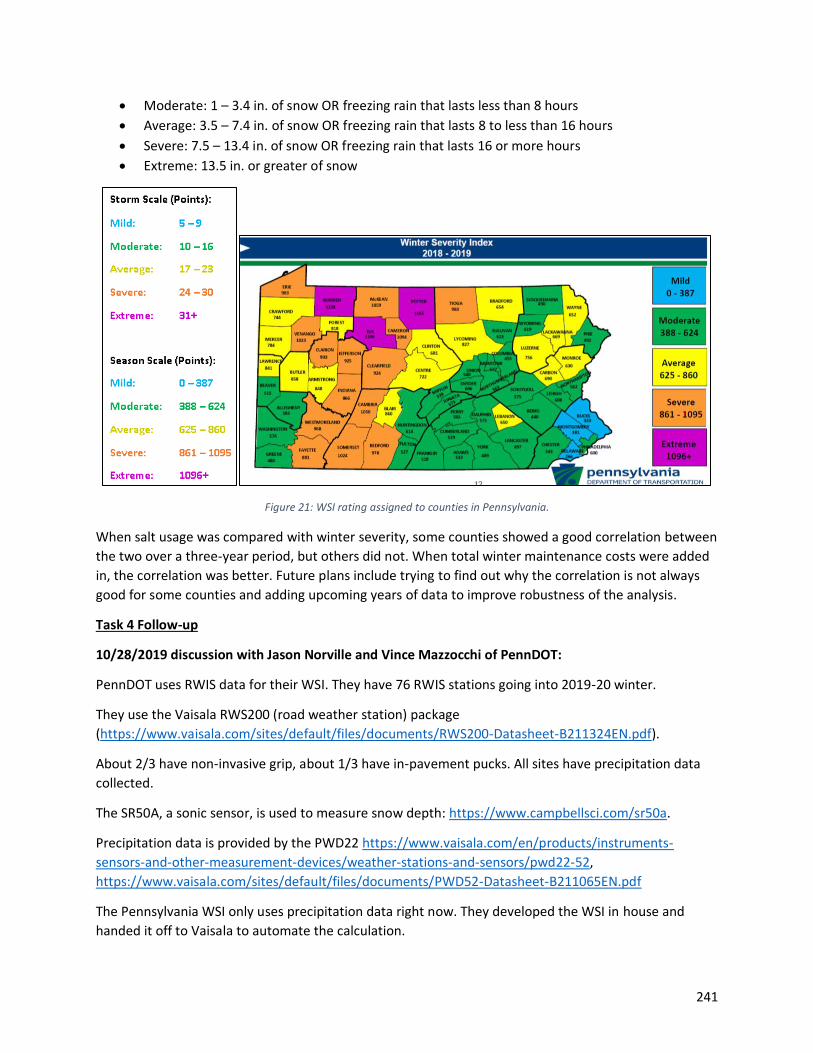
241
• Moderate: 1 – 3.4 in. of snow OR freezing rain that lasts less than 8 hours
• Average: 3.5 – 7.4 in. of snow OR freezing rain that lasts 8 to less than 16 hours
• Severe: 7.5 – 13.4 in. of snow OR freezing rain that lasts 16 or more hours
• Extreme: 13.5 in. or greater of snow
Figure 21: WSI rating assigned to counties in Pennsylvania.
When salt usage was compared with winter severity, some counties showed a good correlation between
the two over a three-year period, but others did not. When total winter maintenance costs were added
in, the correlation was better. Future plans include trying to find out why the correlation is not always
good for some counties and adding upcoming years of data to improve robustness of the analysis.
Task 4 Follow-up
10/28/2019 discussion with Jason Norville and Vince Mazzocchi of PennDOT:
PennDOT uses RWIS data for their WSI. They have 76 RWIS stations going into 2019-20 winter.
They use the Vaisala RWS200 (road weather station) package
(https://www.vaisala.com/sites/default/files/documents/RWS200-Datasheet-B211324EN.pdf).
About 2/3 have non-invasive grip, about 1/3 have in-pavement pucks. All sites have precipitation data
collected.
The SR50A, a sonic sensor, is used to measure snow depth: https://www.campbellsci.com/sr50a.
Precipitation data is provided by the PWD22 https://www.vaisala.com/en/products/instruments-
sensors-and-other-measurement-devices/weather-stations-and-sensors/pwd22-52,
https://www.vaisala.com/sites/default/files/documents/PWD52-Datasheet-B211065EN.pdf
The Pennsylvania WSI only uses precipitation data right now. They developed the WSI in house and
handed it off to Vaisala to automate the calculation.

242
Vince manages the RWIS. Pennsylvania monitors RWIS functionality through the vendor as uptime
functionality. Vaisala has a performance-based contract. RWIS repair also done by Vaisala, but Vaisala
has a group they have subcontracted with to do maintenance. Pennsylvania likes the concept of the
vendor monitoring and responding to sensor failures, they are still working out the kinks in terms of
practical application.
They feel very confident that the precipitation data is fairly accurate, a good representation. On average
it is accurate.
Overall, the Pennsylvania WSI is a blend of Idaho and Iowa, but mostly Iowa based.
Research team asked: You show WSI calculated for each district/county. How much data feeds into each
of these? What is the minimum number of RWIS sites/weather stations per county? The max?
PennDOT answer: To calculate WSI by county they associate WSI by RWIS site and similar conditions.
The WSI is not calculated based on robust data for each county at this time. They had a summer
meteorology intern and will work with her through the winter (from Millersville Univ.). They are also
working with Professor to improve the WSI by incorporating additional variables, such as temperature,
etc.
Research team: How did they get an intern? They have had an internship program for a while now, but
this last year they specifically requested someone from a meteorology program at a University. To find
the right person, they put the word out with contacts at Penn State, Millersville Univ., etc.
PennDOT: Wisconsin, Utah, Iowa – have meteorologist on staff working with winter staff, but Penn does
not.
At this point in time they have about 80-90% of RWIS network coverage in the state. This is determined
by using a 15 miles radius around each RWIS to gauge coverage. Then where gaps occur are trying to fill
in or in areas with special conditions/issues; like the NW corner of the state, where lake effect issues
occur and there is poor radar coverage.
Management of WSI data – Currently Pennsylvania uses the calculated WSI at a high level, by county by
season. They are working with the meteorologist to try and get the WSI calculation per event, but there
is lag in the data. The data they need for the analysis is entered with payroll data and so is only
processed every two weeks. This creates up to a week delay, so they cannot calculate WSI real time, but
they see that this can be improved.
They are working to develop a correlation between salt use and weather severity. At this time, they are
still building up the historical data because they only have three years of data saved. Historical data is
limited because they were not saving data prior to this and have switched recently to working with
Vaisala. Now with the Vaisala partnership they are saving data and it is good quality data. Data is now
saved in Weather Environment and MADIS (https://madis.ncep.noaa.gov/).
Their analysis thus far has shown, in some cases, that severity and salt use track almost perfectly or as
expected. The end result of this is that they believe they may be able to identify situations where the
“expected” material use does not align and this would be the trigger for further review or investigation.

243
Pennsylvania likes how the WSI calculation is automated by Vaisala, but they can only get the WSI
through a report. Pennsylvania also pulls the data and WSI and uses the information internally.
Pennsylvania plays with the numbers and applies WSI to salt use and lane-mile data.
Frequency of running WSI – Pennsylvania runs the WSI calculation on an ad hoc basis, running it when
they have time. They are working with the intern to reduce the time when the data is available so they
can run the WSI for each storm. Managers in Pennsylvania can use/run the WSI anytime. Currently, they
are working to build history with data and confidence in the WSI tool. Right now, it does not ingest
material use, only get a severity number. Then, one needs to correlate it with the amount of material
used on the roads.
Thoughts for other states/newcomers to WSI calculations:
• Hard to say because every state is different.
• Make sure you have the right instrumentation in place. Pennsylvania spec’ed out the right
equipment, but the vendor installed the wrong equipment. The vendor had to go out a fix the
equipment and they lost some data during that time. The WSI needs to match the data that’s
available.
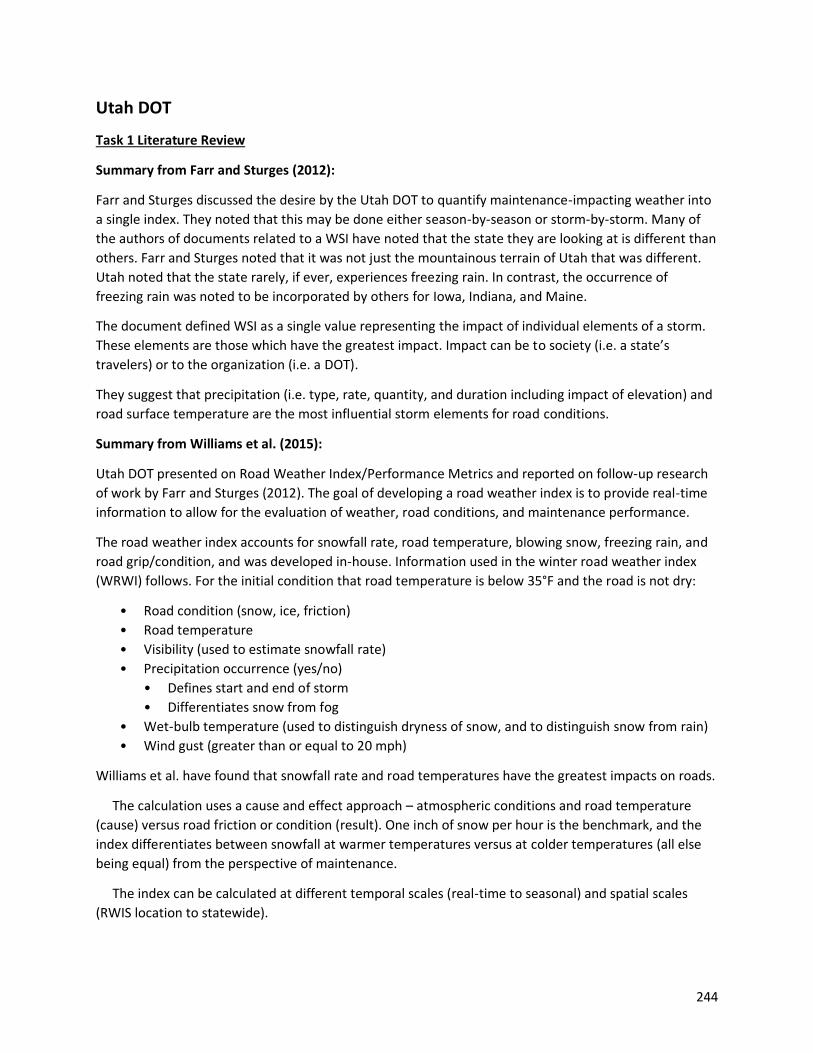
244
Utah DOT
Task 1 Literature Review
Summary from Farr and Sturges (2012):
Farr and Sturges discussed the desire by the Utah DOT to quantify maintenance-impacting weather into
a single index. They noted that this may be done either season-by-season or storm-by-storm. Many of
the authors of documents related to a WSI have noted that the state they are looking at is different than
others. Farr and Sturges noted that it was not just the mountainous terrain of Utah that was different.
Utah noted that the state rarely, if ever, experiences freezing rain. In contrast, the occurrence of
freezing rain was noted to be incorporated by others for Iowa, Indiana, and Maine.
The document defined WSI as a single value representing the impact of individual elements of a storm.
These elements are those which have the greatest impact. Impact can be to society (i.e. a state’s
travelers) or to the organization (i.e. a DOT).
They suggest that precipitation (i.e. type, rate, quantity, and duration including impact of elevation) and
road surface temperature are the most influential storm elements for road conditions.
Summary from Williams et al. (2015):
Utah DOT presented on Road Weather Index/Performance Metrics and reported on follow-up research
of work by Farr and Sturges (2012). The goal of developing a road weather index is to provide real-time
information to allow for the evaluation of weather, road conditions, and maintenance performance.
The road weather index accounts for snowfall rate, road temperature, blowing snow, freezing rain, and
road grip/condition, and was developed in-house. Information used in the winter road weather index
(WRWI) follows. For the initial condition that road temperature is below 35°F and the road is not dry:
• Road condition (snow, ice, friction)
• Road temperature
• Visibility (used to estimate snowfall rate)
• Precipitation occurrence (yes/no)
• Defines start and end of storm
• Differentiates snow from fog
• Wet-bulb temperature (used to distinguish dryness of snow, and to distinguish snow from rain)
• Wind gust (greater than or equal to 20 mph)
Williams et al. have found that snowfall rate and road temperatures have the greatest impacts on roads.
The calculation uses a cause and effect approach – atmospheric conditions and road temperature
(cause) versus road friction or condition (result). One inch of snow per hour is the benchmark, and the
index differentiates between snowfall at warmer temperatures versus at colder temperatures (all else
being equal) from the perspective of maintenance.
The index can be calculated at different temporal scales (real-time to seasonal) and spatial scales
(RWIS location to statewide).
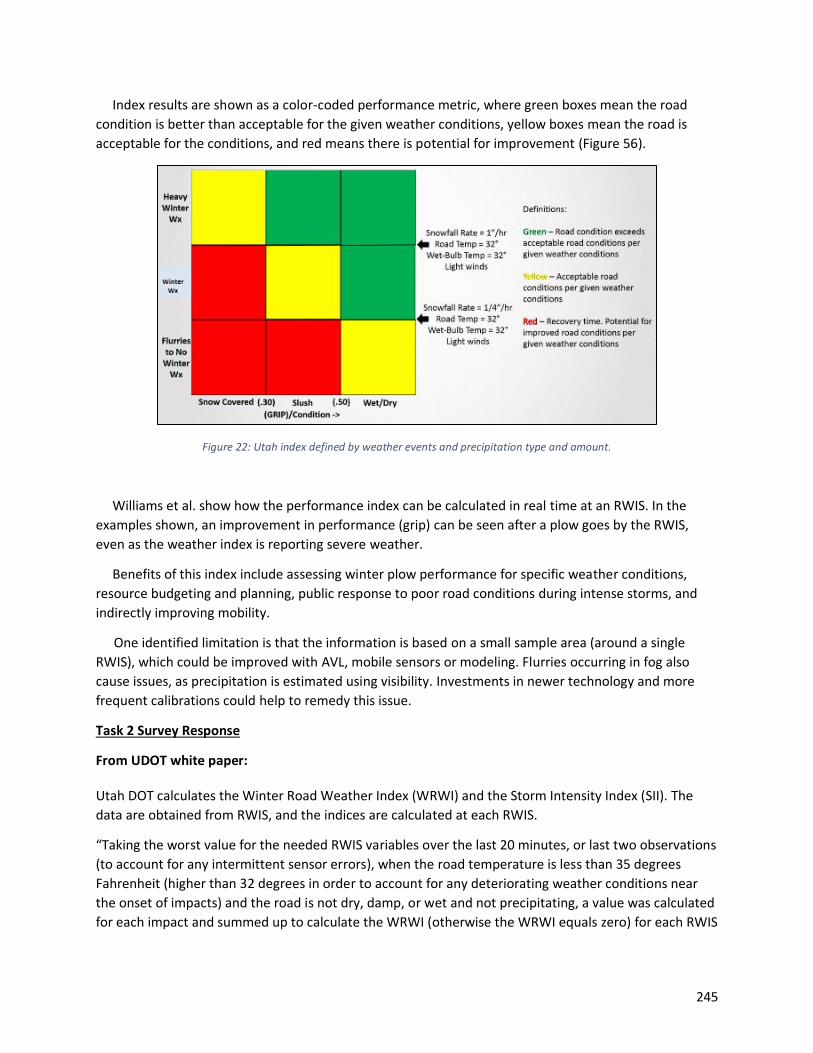
245
Index results are shown as a color-coded performance metric, where green boxes mean the road
condition is better than acceptable for the given weather conditions, yellow boxes mean the road is
acceptable for the conditions, and red means there is potential for improvement (Figure 56).
Figure 22: Utah index defined by weather events and precipitation type and amount.
Williams et al. show how the performance index can be calculated in real time at an RWIS. In the
examples shown, an improvement in performance (grip) can be seen after a plow goes by the RWIS,
even as the weather index is reporting severe weather.
Benefits of this index include assessing winter plow performance for specific weather conditions,
resource budgeting and planning, public response to poor road conditions during intense storms, and
indirectly improving mobility.
One identified limitation is that the information is based on a small sample area (around a single
RWIS), which could be improved with AVL, mobile sensors or modeling. Flurries occurring in fog also
cause issues, as precipitation is estimated using visibility. Investments in newer technology and more
frequent calibrations could help to remedy this issue.
Task 2 Survey Response
From UDOT white paper:
Utah DOT calculates the Winter Road Weather Index (WRWI) and the Storm Intensity Index (SII). The
data are obtained from RWIS, and the indices are calculated at each RWIS.
“Taking the worst value for the needed RWIS variables over the last 20 minutes, or last two observations
(to account for any intermittent sensor errors), when the road temperature is less than 35 degrees
Fahrenheit (higher than 32 degrees in order to account for any deteriorating weather conditions near
the onset of impacts) and the road is not dry, damp, or wet and not precipitating, a value was calculated
for each impact and summed up to calculate the WRWI (otherwise the WRWI equals zero) for each RWIS
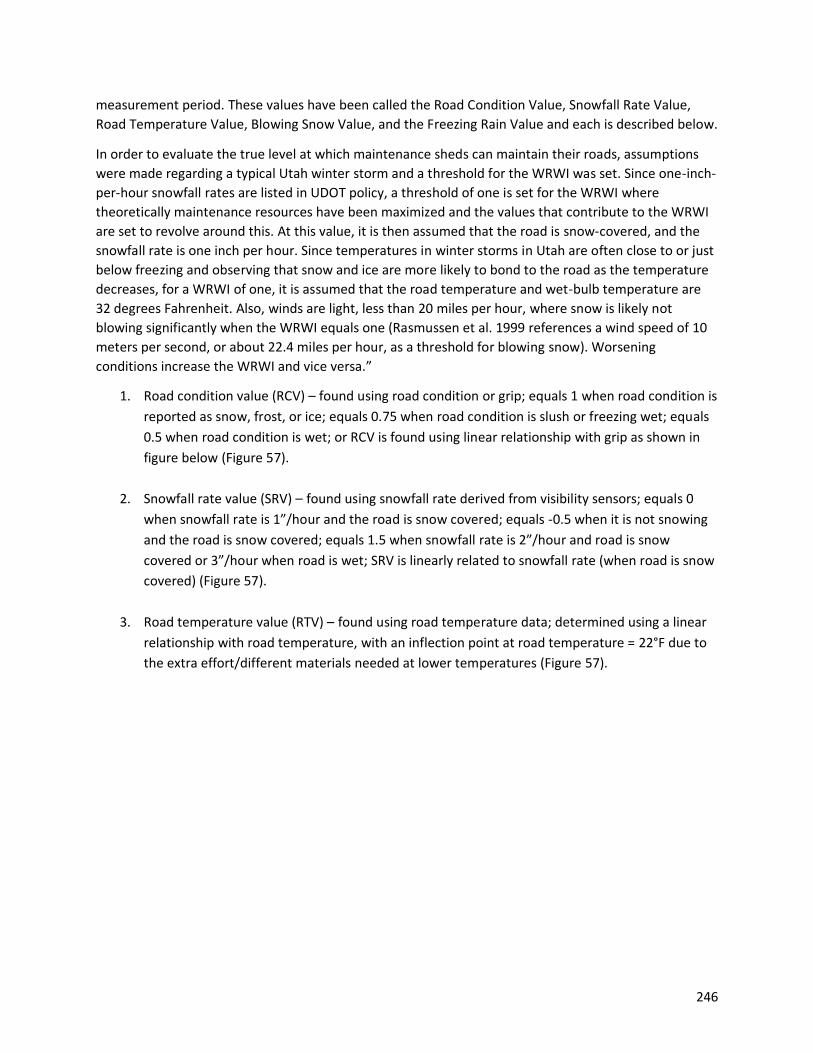
246
measurement period. These values have been called the Road Condition Value, Snowfall Rate Value,
Road Temperature Value, Blowing Snow Value, and the Freezing Rain Value and each is described below.
In order to evaluate the true level at which maintenance sheds can maintain their roads, assumptions
were made regarding a typical Utah winter storm and a threshold for the WRWI was set. Since one-inch-
per-hour snowfall rates are listed in UDOT policy, a threshold of one is set for the WRWI where
theoretically maintenance resources have been maximized and the values that contribute to the WRWI
are set to revolve around this. At this value, it is then assumed that the road is snow-covered, and the
snowfall rate is one inch per hour. Since temperatures in winter storms in Utah are often close to or just
below freezing and observing that snow and ice are more likely to bond to the road as the temperature
decreases, for a WRWI of one, it is assumed that the road temperature and wet-bulb temperature are
32 degrees Fahrenheit. Also, winds are light, less than 20 miles per hour, where snow is likely not
blowing significantly when the WRWI equals one (Rasmussen et al. 1999 references a wind speed of 10
meters per second, or about 22.4 miles per hour, as a threshold for blowing snow). Worsening
conditions increase the WRWI and vice versa.”
1. Road condition value (RCV) – found using road condition or grip; equals 1 when road condition is
reported as snow, frost, or ice; equals 0.75 when road condition is slush or freezing wet; equals
0.5 when road condition is wet; or RCV is found using linear relationship with grip as shown in
figure below (Figure 57).
2. Snowfall rate value (SRV) – found using snowfall rate derived from visibility sensors; equals 0
when snowfall rate is 1”/hour and the road is snow covered; equals -0.5 when it is not snowing
and the road is snow covered; equals 1.5 when snowfall rate is 2”/hour and road is snow
covered or 3”/hour when road is wet; SRV is linearly related to snowfall rate (when road is snow
covered) (Figure 57).
3. Road temperature value (RTV) – found using road temperature data; determined using a linear
relationship with road temperature, with an inflection point at road temperature = 22°F due to
the extra effort/different materials needed at lower temperatures (Figure 57).

247
4. Blowing snow value (BSV) – found using wet-bulb temperature* and wind gust; determined
using the relationships shown in the figure below, with an inflection point at wet-bulb
temperature = 20°F due to an assumed change from “wet” snow to “dry” snow at that point
(Figure 58).
Figure 23: (top left) RCV, (top right) SRV, (bottom) RTV developed by Utah DOT.
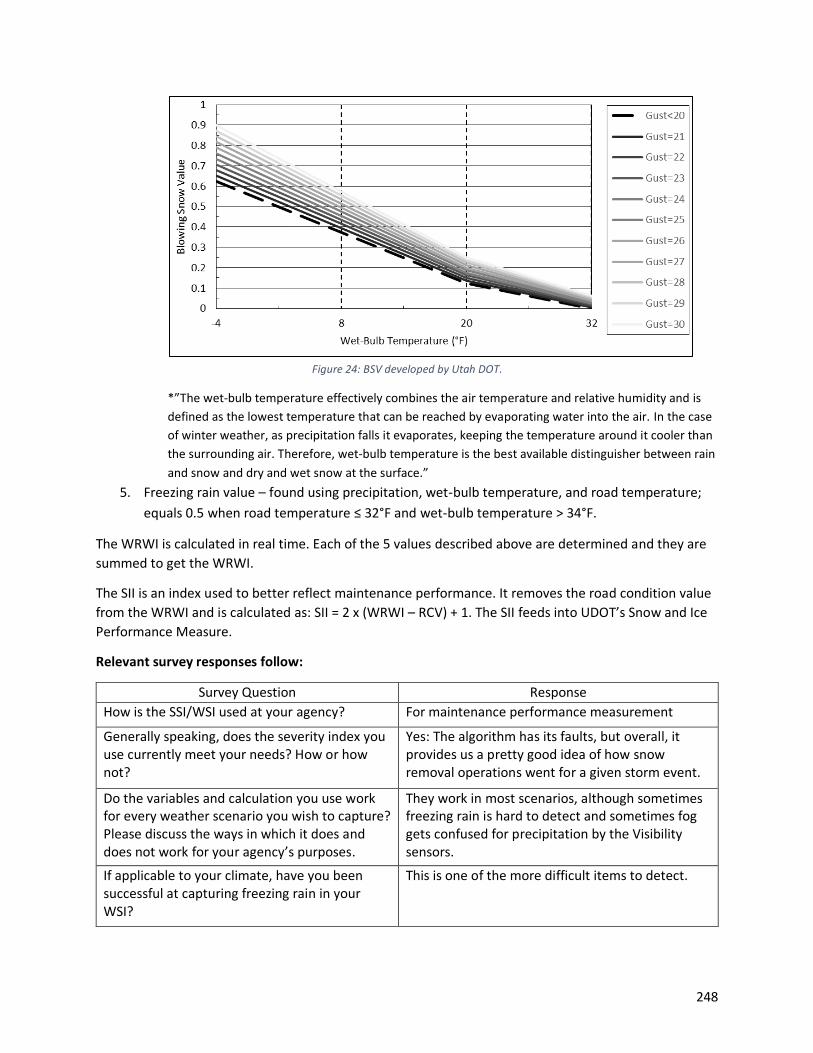
248
Figure 24: BSV developed by Utah DOT.
*”The wet-bulb temperature effectively combines the air temperature and relative humidity and is
defined as the lowest temperature that can be reached by evaporating water into the air. In the case
of winter weather, as precipitation falls it evaporates, keeping the temperature around it cooler than
the surrounding air. Therefore, wet-bulb temperature is the best available distinguisher between rain
and snow and dry and wet snow at the surface.”
5. Freezing rain value – found using precipitation, wet-bulb temperature, and road temperature;
equals 0.5 when road temperature ≤ 32°F and wet-bulb temperature > 34°F.
The WRWI is calculated in real time. Each of the 5 values described above are determined and they are
summed to get the WRWI.
The SII is an index used to better reflect maintenance performance. It removes the road condition value
from the WRWI and is calculated as: SII = 2 x (WRWI – RCV) + 1. The SII feeds into UDOT’s Snow and Ice
Performance Measure.
Relevant survey responses follow:
Survey Question Response
How is the SSI/WSI used at your agency? For maintenance performance measurement
Generally speaking, does the severity index you use currently meet your needs? How or how not?
Yes: The algorithm has its faults, but overall, it provides us a pretty good idea of how snow removal operations went for a given storm event.
Do the variables and calculation you use work for every weather scenario you wish to capture? Please discuss the ways in which it does and does not work for your agency’s purposes.
They work in most scenarios, although sometimes freezing rain is hard to detect and sometimes fog gets confused for precipitation by the Visibility sensors.
If applicable to your climate, have you been successful at capturing freezing rain in your WSI?
This is one of the more difficult items to detect.

249
If applicable to your climate, have you been successful at capturing effects of very cold temperatures (°F)?
Yes: Our algorithm does pretty good at very low temps.
Have you attempted to incorporate current pavement conditions (i.e., existing snow or ice on the road) when a new storm arrives?
No: We have our roads cleared by the time that the next storm hits.
Have you successfully included a duration term (length of storm event) in your calculation?
Yes: Every storm is manually marked for "Start" and "End" which gives Duration.
Please share any lessons you have learned throughout the development and/or use of the SSI/WSI at your agency.
Our algorithm is constantly being updated and refined each season. We are on season 4 this coming winter. One problem that we have encountered is that the pavement condition sensor only points at a 5 sq ft section of roadway and if a snow drift comes across that section it reports that the road is snow-packed even though the majority isn't. Cody Oppermann of the UDOT Traffic Operations Center (TOC) wrote the algorithm and I urge you to reach out to him to get more information on how it works. [Contact info hidden.]
Whether or not your agency already uses an SSI/WSI, please describe what your ideal severity index would be like, how would it be used?
We would like our SSI/WSI to capture all of the roadway, not just the area where the RWIS stations are located. We don't want to put RWIS stations every 1 mile, so we are going to have to look at using connected/autonomous vehicles to gather this data in the form of a data download at the RWIS stations as they pass by. We would like to be able to capture freezing rain better and to stop having fog confused as precipitation.
Task 3 Follow-up
UDOT’s Cody Oppermann and Jeff Williams provided answers to the Task 3 follow-up questions.
1. Regarding the WRWI, just to clarify, is it simply equal to the sum of RCV, SRV, RTV, BSV, and Freezing
Rain Value?
Correct, the Winter Road Weather Index (WRWI) is the sum of the Road Condition Value (RCV),
Snowfall Rate Value (SRV), Road Temperature Value (RTV), Blowing Snow Value (BSV), and Freezing
Rain Value (FRV), each with their own calculation methods. The “Snow and Ice Performance
Measure” (SIPM) is the current metric of use. It takes the road condition value from the Vaisala road
sensors and the “grip” from the IceSight road sensors and compares it to the “Storm Intensity Index
(SII)”, which is calculated as such:
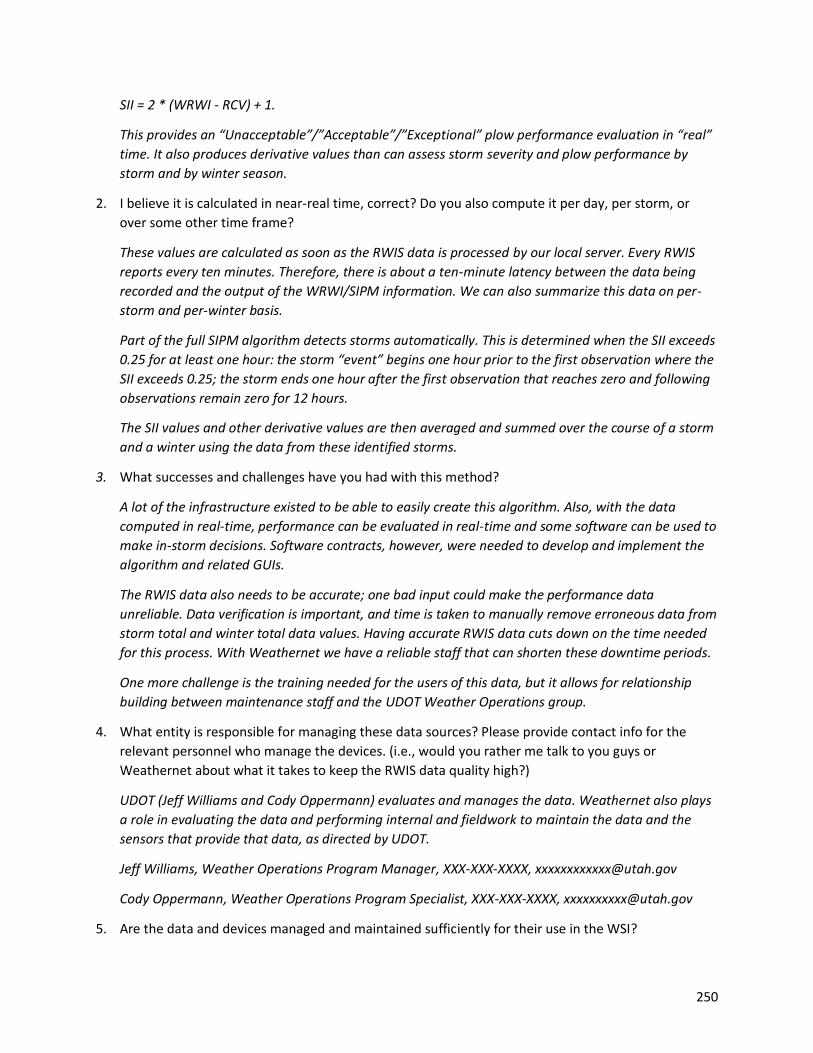
250
SII = 2 * (WRWI - RCV) + 1.
This provides an “Unacceptable”/”Acceptable”/”Exceptional” plow performance evaluation in “real”
time. It also produces derivative values than can assess storm severity and plow performance by
storm and by winter season.
2. I believe it is calculated in near-real time, correct? Do you also compute it per day, per storm, or
over some other time frame?
These values are calculated as soon as the RWIS data is processed by our local server. Every RWIS
reports every ten minutes. Therefore, there is about a ten-minute latency between the data being
recorded and the output of the WRWI/SIPM information. We can also summarize this data on per-
storm and per-winter basis.
Part of the full SIPM algorithm detects storms automatically. This is determined when the SII exceeds
0.25 for at least one hour: the storm “event” begins one hour prior to the first observation where the
SII exceeds 0.25; the storm ends one hour after the first observation that reaches zero and following
observations remain zero for 12 hours.
The SII values and other derivative values are then averaged and summed over the course of a storm
and a winter using the data from these identified storms.
3. What successes and challenges have you had with this method?
A lot of the infrastructure existed to be able to easily create this algorithm. Also, with the data
computed in real-time, performance can be evaluated in real-time and some software can be used to
make in-storm decisions. Software contracts, however, were needed to develop and implement the
algorithm and related GUIs.
The RWIS data also needs to be accurate; one bad input could make the performance data
unreliable. Data verification is important, and time is taken to manually remove erroneous data from
storm total and winter total data values. Having accurate RWIS data cuts down on the time needed
for this process. With Weathernet we have a reliable staff that can shorten these downtime periods.
One more challenge is the training needed for the users of this data, but it allows for relationship
building between maintenance staff and the UDOT Weather Operations group.
4. What entity is responsible for managing these data sources? Please provide contact info for the
relevant personnel who manage the devices. (i.e., would you rather me talk to you guys or
Weathernet about what it takes to keep the RWIS data quality high?)
UDOT (Jeff Williams and Cody Oppermann) evaluates and manages the data. Weathernet also plays
a role in evaluating the data and performing internal and fieldwork to maintain the data and the
sensors that provide that data, as directed by UDOT.
Jeff Williams, Weather Operations Program Manager, XXX-XXX-XXXX, [email protected]
Cody Oppermann, Weather Operations Program Specialist, XXX-XXX-XXXX, [email protected]
5. Are the data and devices managed and maintained sufficiently for their use in the WSI?

251
Since many variables feed into the calculation of these indices, all sensors that calculate it need to be
working appropriately. This can impact storm total and winter total values via automated methods if
only one sensor is not working correctly. However, readily available data shows for the current year-
to-date, UDOT/Weathernet has continuously kept at least 94% of all tracked RWIS devices online.
The majority of the RWIS that are compatible with the SIPM have maintained appropriate up-time
for the automated storm and winter value totals to be useful.
6. Where is the algorithm housed and who runs it and produces the results?
The algorithm is run on a server housed at the UDOT Traffic Operations Center. UDOT Weather
Operations, the Utah Department of Technology Services, and Narwhal are responsible for the
upkeep of the server and algorithm and the software/GUIs that interface with it.
7. Were there certain groups within your agency or external to your agency that were recruited to
assist with building the WSI? Would you change who you brought to the table if you had to do it
again?
Weathernet provided input through the development of the algorithm. As a current forecast provider
for UDOT, Weathernet has the knowledge of what is expected with UDOT and the SIPM. Narwhal
implemented the algorithm and integrated the RWIS data into it. With Weathernet as a subsidiary of
Narwhal, the Narwhal software developers additionally had an intimate knowledge of what UDOT
was trying to achieve with the development of this algorithm. The algorithm, however, could easily
be implemented and run elsewhere, as long as there is a similar RWIS data structure and
maintenance level.
8. We’d like to understand how the data had to be processed to work with your WSI. Do you know
what programming methods were used to make the data readable by the WSI program? Were there
fixes that had to be done once the WSI was tested and implemented? (For example, Ryan noted that
fog sometimes counts erroneously as precipitation. Is there any way you've attempted to address
that in the algorithm?)
In terms of the RWIS data, most variables that feed into the SIPM are just the raw data from the
sensors. The exception being the snowfall rate, which is estimated via visibility and the presence of
precipitation. This estimation is performed by the RWIS’s Campbell Scientific datalogger program
and not via the SIPM algorithm’s own calculations. This presence of precipitation check detects most
fog events, but on the relatively rare occasion when there is light snowfall concurrent with foggy
conditions, the snowfall rate will be over-estimated. The visibility sensor is what also provides this
precipitation identification, but also provides the variable “particle count”, which detects the number
of particles that have passed through the sensor during the course of a minute. This value was
initially used to “cap” snowfall rates to 2” per hour during foggy events when particle count values
were low. The accuracy of this value has been determined to be largely suspect, however, so most
sites snowfall rates are only capped at 5” per hour regardless of particle count. Other data from the
visibility sensor could be used, but as of this writing has not been investigated. If snowfall rates are
so erroneous as to impact the SIPM, this data is flagged and not counted towards storm total and
winter total values.
The server stores the data into a database that can be read by the SIPM algorithm.

252
Very cold conditions could be further evaluated to determine the accuracy of plow performance as in
some instances it gave an “unacceptable” evaluation. It could be argued that the road could not be
improved well enough to get the road condition to an acceptable range in these cases. To date,
however, no changes have been made to the SIPM algorithm since its implementation.
9. How has the core knowledge of the WSI been passed onto other agency employees? Have you
hosted internal workshops or trainings for key employees to be familiar with the WSI?
The SIPM has been largely presented to maintenance employees from the Shed Supervisor up to at
least District Engineers, as well as employees of UDOT Central Maintenance. Within the last couple
of years, UDOT Region 2 staff, particularly District and Maintenance Engineers, have been making
the largest concentrated effort using SIPM data to evaluate staffing and resource decisions. Results
from these efforts, however, have not been formally identified by UDOT Weather Operations as of
this writing. Region 2 has been providing funding for additional RWIS sites for the last two years and
Region 1 will be providing funds for additional RWIS sites for the first time in Fiscal Year 2020.
Exposure has also been given to other employees of UDOT as its information has been presented at
Regional Snow Schools, Area Supervisors Conferences, and the UDOT Conference.
Task 4 Follow-up
Jeff Williams and Cody Oppermann provided responses via email on 10/25/2019 and 10/28/2019.
1. Can you tell me more about the RWIS upgrades UDOT had to do to gather the data needed for
the WSI?
We needed to procure more road sensors (in our case, non-invasive) and pole
installations if the RWIS tower was too far from the road. Additionally, all of the sites
needed visibility sensors if they did not have one. In some cases, this required additional
solar power and solar poles and larger arrays were installed.
2. Can you please provide requirements for preventative maintenance and response maintenance
for Weathernet?
Currently, Weathernet is required to complete preventative maintenance on all SIPM-
compatible sites annually, in the late summer/early fall. If possible, during the winter
months, they are then expected to respond to any RWIS instrumentation that is
preventing the SIPM from being calculated within two weeks of a work order being
created. This level of maintenance has allowed us to have at least 93% of all of our RWIS
instruments online at any time over the last year.
3. Is there anything else (data sources, data, etc.) you wish you could include?
Assuming you are referring to data that could be added to the SIPM, we are comfortable
with the data we have currently. Better snowfall rate data would be beneficial, but we
like the variables and data sources we use from the RWIS. The best way to fill in gaps for
the SIPM in the future we feel would be using CV data, addressed in question 4.
4. A related question: are there any realistic expectations that mobile observations will be able to
be used to fill in gaps between RWIS for the WSI?
a. No, we will not be deploying mobile observations. We tried once. We quickly learned
that it would take too many resources to maintain those instruments. [Jeff] always felt
that CV data would be a better solution. We will be diving into CV road weather world
later this winter.

253
b. We want to see what future connected vehicle data can provide, but we anticipate that
data could be used in some way to determine performance between RWIS stations.
254
Washington State DOT
Task 1 Literature Review
No published materials describing WSI efforts at WSDOT are available.
Task 2 Survey Response
WSDOT did not submit a response to the Task 2 survey.
Task 3 Follow-up
The information below was supplied by James Morin (WSDOT) and Ken Rosenow (contractor,
Weathernet).
WSDOT uses the Boselly index. Dr. Cliff Mass at the University of Washington refined the calculation and
removed the precipitation term, because the data were unavailable or unreliable, and built the
algorithm to calculate the index. The remaining formula was called the Frost Index (FI) and is:
,
where
Temperature Index (TI): TI = 0 if the minimum air temperature is above 32°F; TI = 1 if the
maximum air temperature is above 32°F while the minimum air temperature is at or below 32°F;
and TI = 2 if the maximum air temperature is at or below 32°F.
Number of air frosts (N): mean daily values of number of days with minimum air temperature at
or below 32°F (0 < N < 1);
Temperature Range (R): the value of mean monthly maximum air temperature minus mean
monthly minimum air temperature in °C.
Data were initially pulled from METAR (METeorological Aerodome Reports, available at airports). In
more recent years, RAWS (Remote Automatic Weather Stations, deployed by various land management
agencies in remote areas) and RWIS were added. With the addition of more sites, the precipitation term
was added back in to create the winter index (WI), as in Boselly et al. (1993):
,
where S is snowfall. (In the Boselly method, S is the daily snowfall accumulation in millimeters.)
However, given the difficulties of measuring snow accumulation at automated sites, the most reliable
data was a binary snow occurrence value. Thus, S = 1 if snow was observed and S = 0 if snow was not
observed.
With the precipitation term removed, the index is highly dependent on air temperature. Thus, it cannot
account for a dry cold versus a moist cold.
The data are pulled from MesoWest (https://mesowest.utah.edu/).
FI = -25.58√TI - 99.5 √ N/(R+10) + 50FI = -25.58√TI - 99.5 √ N/(R+10) + 50
255
The index is calculated at weather stations and averaged over an area. It is a daily calculation.
Task 4 Follow-up
The data used for the Frost Index is simply air temperature. For the Winter Index, a binary snowfall
occurrence value is used; yes=1 and no=0.
The data are gathered by RWIS, METAR (ASOS/AWOS), and RAWS. The data is accessed for the FI and WI
from the MesoWest/SynopticLabs database (https://synopticlabs.org).
According to WSDOT’s consultant, Weathernet:
“For the Frost index, it uses all 3 types of sites basically on any site that is available for the time
period. Since all it is looking for is high/low temp on a day, its most likely reliable as there is some
filters applied to get rid of suspect data.
For the WI, only METAR sites are used as they are the only ones that give a precipitation type. I
would say that data is much more suspect as the automated observing sites are a lot less reliable on
precipitation type so a lot more room for error, but really it’s just looking for if snow fell or not, not
any sort of accumulation.”
No additional feedback was provided.

256
Alberta Ministry of Transportation
Task 1 Literature Review
Summary of Matthews et al. (2017a):
Matthews et al. (2017a) developed a WSI for the province of Alberta. The team recommended using
RWIS data in conjunction with Environment Canada (EC) weather station networks to improve the
amount, quality, and types of data. The EC network has good quality data, but there are fewer stations
in northern Canada, and they do not report road surface conditions. The RWIS data has a lower level of
quality control, with only few RWIS stations having historic rainfall and snow depth data.
The following weather conditions (“triggers”) were used for the development of the WSI:
• Three different categories of snowfall differentiated by snowfall amount (EC data)
• Two sets of conditions associated with icing (pavement ice warnings and rain with low
temperatures; EC precipitation data, RWIS ice warnings)
• Series of cold days (where treatment may occur because bare pavement has not been achieved,
RWIS temperature data)
• Blowing snow (RWIS wind data, EC snowfall data)
The index also adds in a shoulder season adjustment factor which reduces the severity scores when the
average mean temperature remains above freezing for an extended period (RWIS temperature data).
The index calculates a point value for each day. The points can then be aggregated weekly, monthly,
and seasonally. These daily and aggregated scores have been found to be easily interpreted because
they are directly tied to distinct weather conditions and events.
The team built flexibility into the system, by allowing a location to tailor the number and type of
weather triggers that best fit local conditions and practices. An optimization routine was built that
defines appropriate threshold values for each trigger and daily scores that reflect the severity of the
weather from a maintenance perspective. The optimization approach was offered as a contrary
approach to expert opinion or physical process approaches that have guided WSI developments in past
studies. The following flowchart (Figure 59: Flowchart showing the approach used by Matthews et al.
(2017a). in Matthews et al., 2017a) illustrates their approach.
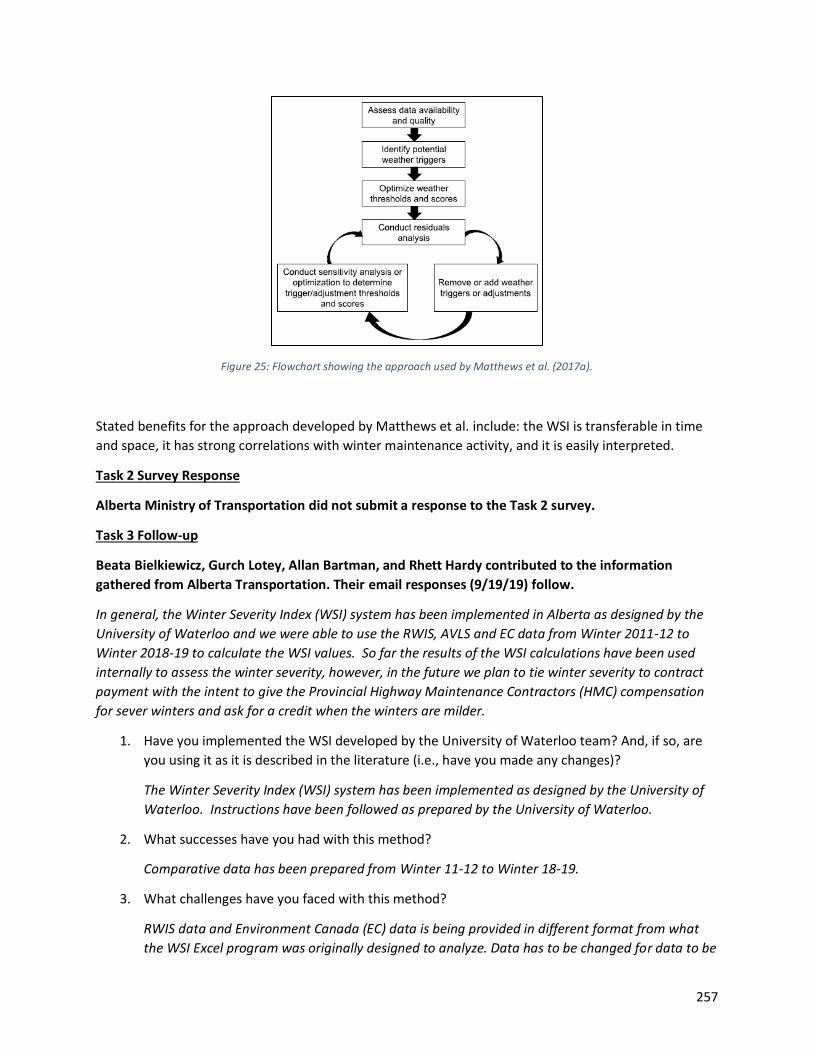
257
Figure 25: Flowchart showing the approach used by Matthews et al. (2017a).
Stated benefits for the approach developed by Matthews et al. include: the WSI is transferable in time
and space, it has strong correlations with winter maintenance activity, and it is easily interpreted.
Task 2 Survey Response
Alberta Ministry of Transportation did not submit a response to the Task 2 survey.
Task 3 Follow-up
Beata Bielkiewicz, Gurch Lotey, Allan Bartman, and Rhett Hardy contributed to the information
gathered from Alberta Transportation. Their email responses (9/19/19) follow.
In general, the Winter Severity Index (WSI) system has been implemented in Alberta as designed by the
University of Waterloo and we were able to use the RWIS, AVLS and EC data from Winter 2011-12 to
Winter 2018-19 to calculate the WSI values. So far the results of the WSI calculations have been used
internally to assess the winter severity, however, in the future we plan to tie winter severity to contract
payment with the intent to give the Provincial Highway Maintenance Contractors (HMC) compensation
for sever winters and ask for a credit when the winters are milder.
1. Have you implemented the WSI developed by the University of Waterloo team? And, if so, are
you using it as it is described in the literature (i.e., have you made any changes)?
The Winter Severity Index (WSI) system has been implemented as designed by the University of
Waterloo. Instructions have been followed as prepared by the University of Waterloo.
2. What successes have you had with this method?
Comparative data has been prepared from Winter 11-12 to Winter 18-19.
3. What challenges have you faced with this method?
RWIS data and Environment Canada (EC) data is being provided in different format from what
the WSI Excel program was originally designed to analyze. Data has to be changed for data to be

258
analyzed by WSI Excel program. Microsoft Excel with VBA (Visual Basic for Applications) was
used to create the WSI program. Microsoft releases new versions Excel which raises the question
of will all the functions of Excel work with the WSI program provided by the University of
Waterloo. WSI numbers have been requested by Alberta Transportation staff in a live, up to
minute format. The WSI program provided by the University of Waterloo is unable to fulfill that
request.
4. Is the source of the data Environment Canada stations and RWIS, as described in the literature?
The WSI program designed and provided by the University of Waterloo uses Environment Canada
data, Alberta Transportation RWIS data and Truck hours data provided by Automatic Vehicle
Locate System (AVLS) system.
5. Is the data of high enough quality for the purposes of the WSI? Is there a particular contact you
work with for issues with EC or RWIS data?
EC data and RWIS data are good quality after data is formatted to match analysis requirements
of WSI Excel program.
6. Where is the algorithm housed, and who runs it and produces the results?
So far, all calculations were done in-house but we will be asking the RWIS contractor to do the
calculations for us.
7. How are the results used (e.g., performance measurement, public relations, etc.,)?
Results of WSI have been made available for Alberta Transportation staff to review. In the future
we plan to tie winter severity to Contract payment but are a ways off from that yet – the intent
being that we would pay a bit more for a severe winter or receive a credit for a light winter –
helps to box in the risk for Contractors when pricing.
6. We'd like to understand how the data had to be processed to work with the WSI. Do you know
what programming methods were used to make the data readable by the program?
Priority numbers were created for weather systems in consultation with Alberta Transportation
staff. Microsoft Excel programming with VBA was used to create the WSI program.
7. Were any fixes done to the algorithm or data processing after the WSI was implemented? None.
8. How has the core knowledge of the WSI been passed onto other agency employees?
The WSI program, instructions, and results have been provided to Alberta Transportation staff
and to Wood Environment Infrastructure Services for analysis via email, share services.
Task 4 Follow-up
An explanation of Environment Canada:
Environment Canada (weather.gc.ca) is the weather research, forecasting and observing body in Canada
that functions in a similar manner to the NWS in the US. They also own and operate weather stations
that are deployed around the country at strategic locations. Their weather stations undergo similar

259
maintenance procedures as those owned by the NWS. Thus, the data from EC sites are of the highest
quality.
Alberta Transportation RWIS maintenance provisions:
Maintenance provisions from a 2017 RWIS RFP, section 6.7:
“Routine” maintenance refers to any required manufacturer and/or industry best-practice procedures
employed to maintain the hardware in reasonable state of repair and to prevent any early onset of
equipment deterioration. This type of maintenance is usually scheduled once or twice a year throughout
the life of a piece of equipment.
“Emergency” maintenance refers to non-routine unscheduled repairs to fix a piece of equipment that
may have failed suddenly or unexpectedly throughout the course of the Contract. This normally requires
the [RWIS Service Provider (RSP)] to provide troubleshooting services to determine what has failed and
why, and to have adequate but not excessive inventory of spare parts. Knowing the manufacturer’s
[mean time to failure], previous in-service experience with the various components, and keeping track of
routine maintenance records, will help the RSP to predict the frequency of such repairs. It is expected
that the RSP shall be able to reasonably perform such emergence maintenance in a timely manner and
within the price structure of this Contract.
Maintenance activities shall include routine and emergency maintenance of all [RWIS environmental
sensing stations (ESS)] including:
1. All sensing equipment with all mounting hardware and cables, pavement and sub-surface
sensors, [remote processing unit (RPU)], conduits, sealant, [power distribution cabinet (PDC)],
tower, base, equipment configuration and calibration, and firmware updates;
2. All [road-side equipment], antenna, cabling and conduit where applicable;
3. All camera equipment including housing, mounting hardware and cables, calibration, and
updates to the configuration and firmware;
4. Telecommunications equipment including modem configuration and any subsequent updates to
the configuration and firmware;
5. Electrical installation including PDC;
6. Maintaining the logbook for each ESS (available on site in the RPU cabinet) with a record of all
maintenance activities;
7. General site maintenance around the tower including the concrete pad; and,
8. For the two ESS sites (one on Highway 40 and one on Highway 41) that are operating on solar-
charging battery power, the RSP shall also be responsible for the routine and emergency
maintenance of the solar-powered battery system.
9. The ESS site on Highway 41 also has special maintenance requirements due to its location in the
sage-grouse habitat area which is protected by the Federal Emergency Protection Order,
presently enforced by Alberta Environment and Parks, Fish and Wildlife Management Division.
Maintenance and/or any repair/construction activities should only be conducted between September 15
and November 30 of each year. For emergency maintenance, the work may be permitted outside of the
above period, but not during the late evening or early morning hours (1.5 hrs before sunset to 1.5 hrs
after sunrise) especially during the breeding season of April/May.

260
Should any of the station components become obsolete during the Contract term and require
replacement or repair, the RSP shall demonstrate to the Department that the manufacturer support for
the particular component is no longer available and that the same replacement part cannot longer be
obtained. Then, subject to the Department’s approval, the RSP may:
1. Replace the failed component with an equivalent component, whenever possible…
2. Replace the failed component with an upgraded component which may exceed the applicable
equipment and manufacture requirements…
Per Beata Bielkiewicz, Alberta Transportation:
[The maintenance provisions] are not that detailed because the entire contract is structured to motivate
the contractor to maintain high level of service through the data delivery requirements - i.e. the contract
requires the contractor to maintain data delivery at a minimum of 95%.
Clarification about the RWIS ice warning data:
Per Lindsay Matthews, lead author of Matthews et al. (2017a,b), on 10/25/19: The ice warning variable
for each [Area Maintenance Contract (AMC)] was calculated in three steps. First, for each RWIS station,
the total number of readings was calculated for each of the 19 pavement surface conditions*. Then the
five ice warning readings: “Black ice warning”, “Ice warning”, “Ice watch”, “Snow/ice warning”, and
“Snow/ice watch” were counted to obtain the daily total number of ice warning readings. Lastly, the ice
warnings were normalized as a percentage. For each station the ice warning variable is the ratio of the
total number of ice warning readings to the total number of pavement surface condition readings. The
ice warning variable for each AMC is obtained as the average ice warning variable across the RWIS
stations in the AMC area.
*The other 14 RWIS pavement surface conditions not included in the Ice warning variable are:
absorption, chemical wet, chemically wet, damp, dew, dry, frost, other, slush, snow warning, snow
watch, trace moisture, wet, wet below freezing.
Regarding the quality control procedures and processing required for EC data:
Per Lindsay Matthews: I do not have a lot of insight into their quality control measures other than to say
they are considered very high quality for the ‘primary’ stations. The quality at the more remote stations
is high… but there are missing values that are the bigger issue. We usually got around this through gap
filling with other nearby stations. The challenge in Canada is that our geographic area is so large that our
network of roads and met stations is relatively sparse in some areas… then we also have very large
metropolitan areas with a dense highways network and dense instrumentation.
Environment Canada data [is] very easy to work with. You can use python/R (rclimatica) to scrape the
data and process it or an amateur can download the excel files on a station by station basis.
Regarding processing required for RWIS data:
Lindsay Matthews states that RWIS data is difficult to work with. She goes on to say: That said – I think
this depends highly on the DOT or road authority’s pre-processing/storage/management of the data. We
were working with raw data (10-20 second readings) from a large network of stations that had not been
well archived. You could write a dissertation on the need for improved data management for the

261
DOT… However, in Ontario, the RWIS provider is now mandated to process the data and calculate WSI
scores for the province so now that it is automated it is not much of an issue. Much of this new change
came about after our struggles with the data.
Another related note – if there is any desire to move this work towards ‘climate services’ or future
projections of winter severity then using RWIS data are problematic because those variables aren’t
included in climate projections.
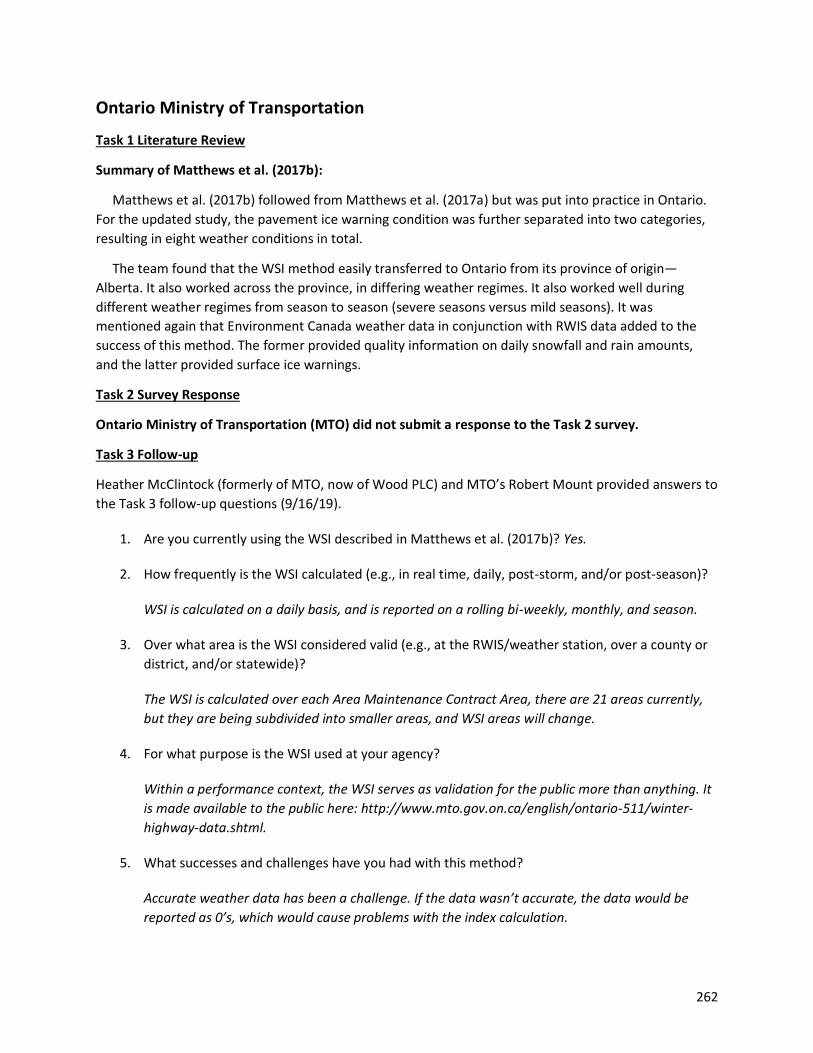
262
Ontario Ministry of Transportation
Task 1 Literature Review
Summary of Matthews et al. (2017b):
Matthews et al. (2017b) followed from Matthews et al. (2017a) but was put into practice in Ontario.
For the updated study, the pavement ice warning condition was further separated into two categories,
resulting in eight weather conditions in total.
The team found that the WSI method easily transferred to Ontario from its province of origin—
Alberta. It also worked across the province, in differing weather regimes. It also worked well during
different weather regimes from season to season (severe seasons versus mild seasons). It was
mentioned again that Environment Canada weather data in conjunction with RWIS data added to the
success of this method. The former provided quality information on daily snowfall and rain amounts,
and the latter provided surface ice warnings.
Task 2 Survey Response
Ontario Ministry of Transportation (MTO) did not submit a response to the Task 2 survey.
Task 3 Follow-up
Heather McClintock (formerly of MTO, now of Wood PLC) and MTO’s Robert Mount provided answers to
the Task 3 follow-up questions (9/16/19).
1. Are you currently using the WSI described in Matthews et al. (2017b)? Yes.
2. How frequently is the WSI calculated (e.g., in real time, daily, post-storm, and/or post-season)?
WSI is calculated on a daily basis, and is reported on a rolling bi-weekly, monthly, and season.
3. Over what area is the WSI considered valid (e.g., at the RWIS/weather station, over a county or
district, and/or statewide)?
The WSI is calculated over each Area Maintenance Contract Area, there are 21 areas currently,
but they are being subdivided into smaller areas, and WSI areas will change.
4. For what purpose is the WSI used at your agency?
Within a performance context, the WSI serves as validation for the public more than anything. It
is made available to the public here: http://www.mto.gov.on.ca/english/ontario-511/winter-
highway-data.shtml.
5. What successes and challenges have you had with this method?
Accurate weather data has been a challenge. If the data wasn’t accurate, the data would be
reported as 0’s, which would cause problems with the index calculation.

263
The first two variables (snowfall and pavement ice warnings) were driving the calculation, so the
latter variables have never been included. The question going forward is whether to continue to
collect the other variables or not.
When the index results were given to regional maintenance engineers, they couldn’t determine
how right it seemed. There was, as of yet, no context for its values.
EC data ended up being used almost exclusively because it had snow accumulation.
6. Is the source of the data EC stations and RWIS?
7. What entity is responsible for managing these data sources? Please provide contact info for the
relevant personnel who manage the devices (whether internal to your agency or external).
No contact information for EC personnel. Our RWIS service provider makes the contact with EC
and can be obtained if necessary. Suggestion to contact Jean Andrey at Waterloo for EC contact.
WSI calculation includes both RWIS and EC data. Our service provider for RWIS is Wood, and the
MTO contact related to RWIS is James Brouwer, but Robert Mount is also involved.
8. Are the data and devices managed and maintained sufficiently for their use in the WSI? What
practices are required to keep the data quality high?
9. Where is the algorithm housed and who runs it and produces the results?
It is housed within our RWIS program, which is contracted. It is the same program that produces
our forecasts and performs the data management.
Task 4 Follow-up
Per Robert Mount, MTO, 10/29/19:
Annual maintenance is completed by the RWIS Service Provider (in our case it is a sub to the consultant)
thorough review and checks on calibration (and many other things) to ensure everything is reading
accurately and the system is working well (an appendix in the contract with the Service Provider). They
complete this throughout the summer and are required to be complete all stations 15 days before the
winter season (site specific).
Allowable down times:
• Critical repairs are 4 days in the southern Ontario, and 7 days in the northern Ontario.
• Non-critical repairs are 15 days.
See Task 4 Follow-up in the Alberta Transportation section above for information from Lindsay
Matthews on the RWIS ice warning data, the quality control procedures and processing required for EC
data, and the processing required for RWIS data’s inclusion into the WSI.

264
Germany
Task 1 Literature Review
Minor details were obtained from the two sources discussed herein.
Badelt (2012):
The abstract describes the work as developing a better method to estimate and evaluate how much salt
will be needed and used in the future by looking at daily weather data from the German National
Meteorological Service. The data was used to derive when slippery road conditions occurred from snow,
ice, and frost, and to relate these conditions to deicer application rate.
Snow and Ice Databook 2018:
“The Federal Highway Research Institute actually makes research to define a winter index in order to
find a correlation between winter severity and salt consumption necessary for snow and ice control, and
to prove the effectiveness of pre-wetted salt technology. This index is also important to calculate the
storage amount of salt needed for strong winter periods for each region. The Investigations show that
most relevant for salt consumption is the amount and frequency of snowfall in the snowy regions. In
regions with less snow there is a relevant factor the number of temperature changings around 0°C.”
Task 2 Survey Response
No German representative submitted a response to the Task 2 survey.
Task 3 Follow-up
The research team has made multiple attempts to contact representatives from Germany without
success. Because the German method appears to be similar to methods used in other European
countries, and these are detailed in the Task 2 documentation, the research team will suspend attempts
to follow-up with Germany.

265
Appendix F. Maryland Method
Detailed information on this method may be found in Fay et al. (2020).
Summary/Equation
The following equation can be used to predict the severe weather index for a storm:
SWI# = 113.7(WET_PRECIP)-2.233(DAY)+0.02414(STORM_DURATION)-1.620(DEC)-3.058(JAN)-
17.25(NO_PRECIP_RATIO)-1.331(CALM)-3.408(NORTH)-3.183(METRO)-5.938(WESTMD)-
5.912(USHORE)+10.22
Where:
• SWI is Severe Weather Index
• WET_PRECIP is the accumulation of liquid precipitation
• DAY represents a time of day indicator
• STORM_DURATION is reported in minutes
• DEC and JAN are used as seasonal indicator variables
• NO_PRECIP_RATIO is an indicator for no precipitation occurring
• CALM is an indicator variable for light or no wind
• NORTH, METRO, WESTMD, USHORE are indicator variables for climate zones
Variables
• Precipitation accumulation (liquid)
• Precipitation occurrence
• Wind speed
• Storm duration
• Time of day indicator
• Location indicator
• Seasonal indicator
Data Sources
RWIS
Agency
Maryland DOT State Highway Administration

266
Appendix G. Iowa Method Modifications
Iowa DOT has been running their index since 2005. Listed here are modifications made to Iowa DOT’s
Weather Index over time, according to Tina Greenfield (personal communication, 4 February 2020).
1. Sometime in the past we used to report ‘wet snow’ and ‘dry snow’ in our crew logs.
Eventually we decided that was too subjective and we should just report ‘snow’ as a storm
type. The original index treated dry and wet snow slightly differently. We now allow ‘snow’
to follow into the index following the ‘wet snow’ route, effectively dropping the ‘dry snow’
from the computation simply because it never comes through our records anymore.
2. Fixes were needed to keep the index from reporting a negative value. It’s in the temperature
modifiers that there is a comparison of the average storm temperature (for each storm type)
to some ‘Iowa Normal.’ It’s supposed to create an additive to the index that is responsive to
the relative difficulty of warm vs. cold events. This sounds great and would be -- if we only
ever ran it once a year at the end. But since we have the habit of running it in a cumulative
mode (which it wasn’t actually designed for), it can create a head-scratcher when the index
from last week is actually higher than the index now. This can happen especially when
there’s not many storms, and the most recent one was rather mild. The addition of that extra
mild storm messed with the ‘average storm temperature’ enough that now the contribution
from the additive (which just went milder, smaller) outweighed the contribution from having
yet another storm. A couple years ago we put in a modification to limit how much that
temperature field can contribute to the total. But it still lets some instances sneak by in
extreme or very-early-season cases when there’s just not much else driving the index values.
3. We had to re-jig how it counts ‘storm events’ because folks got into the habit of reporting
their data in fragments. It used to be that we stated a start time and a stop time. Then
people decided that they needed to break the storm into 2-hour chunks. So that a storm
from noon to 7 PM would be reported noon-2, 2-4, 4-6, and then 6-7. This was unexpected
that people would report like this. But they did. So, we had to make it smart enough to
know that it was one continual event, instead of 4 short ones. Frequency and duration go
into the index so it does make a big difference.
4. We very recently tweaked it again, to make it even smarter about concurrent and
fragmented storms.
Otherwise, it’s pretty much the same index that we released some 14 years ago. It could
certainly be better, but consistency is good too.
Prior to its release into duty, there were lots of versions, tweaks, reruns, more tweaks, but that
was all part of development.

267
Appendix H. Matthews Method Weather Triggers
Here, details are provided for the weather triggers developed during the study period described in
Matthews et al. (2017a). The reader is encouraged to review Matthews et al. (2017a and 2017b) for
more information on how the scoring was developed.
WSI Component Definition of WSI Component
Snowfall component Low amount of snow (0.4–1.9 cm, or approx. 0.2–0.74 in) Moderate amount of snow (1.91–4.9 cm, or approx. 0.75 – 1.9 in) High amount of snow (>4.91 cm, or approx. 1.9 in)
Surface ice warning component <0.4 mm (approx. 0.02 in) daily snowfall and at least 20% of road surface ice warnings
Rainfall with low temperatures Daily snowfall, <0.4 mm (approx. 0.02 in) Conditions for ice warnings not met Conditions for series of cold days not met Daily rainfall, ≥0.4 mm (approx. 0.02 in) Minimum temperature, <0°C (32°F)
Series of cold days Daily precipitation, <0.4 mm (approx. 0.02 in) Conditions for ice warnings not met Maximum temperature in previous 3 days, < − 18°C (approx. 0°F)
Blowing snow Daily precipitation, <0.4 mm (approx. 0.02 in) Conditions for ice warnings not met Conditions for series of cold days not met Conditions for rainfall with low temperatures not met Wind speeds, ≥20 km/h (approx. 12 mph) Snowfall accumulations of previous 3 days, ≥5 cm (approx. 2 in)
Figure 26: Weather triggers defined by Matthews et al. (2017a,b).

268
Appendix I. Utah Method Derivation
Here, the derivation of each term in the Utah equation is explained.
From Oppermann and Williams (2018):
Utah DOT calculates the Winter Road Weather Index (WRWI) and the Storm Intensity Index (SII). The
data are obtained from RWIS, and the indices are calculated at each RWIS.
“Taking the worst value for the needed RWIS variables over the last 20 minutes, or last two observations
(to account for any intermittent sensor errors), when the road temperature is less than 35 degrees
Fahrenheit (higher than 32 degrees in order to account for any deteriorating weather conditions near
the onset of impacts) and the road is not dry, damp, or wet and not precipitating, a value was calculated
for each impact and summed up to calculate the WRWI (otherwise the WRWI equals zero) for each RWIS
measurement period. These values have been called the Road Condition Value, Snowfall Rate Value,
Road Temperature Value, Blowing Snow Value, and the Freezing Rain Value and each is described below.
In order to evaluate the true level at which maintenance sheds can maintain their roads, assumptions
were made regarding a typical Utah winter storm and a threshold for the WRWI was set. Since one-inch-
per-hour snowfall rates are listed in UDOT policy, a threshold of one is set for the WRWI where
theoretically maintenance resources have been maximized and the values that contribute to the WRWI
are set to revolve around this. At this value, it is then assumed that the road is snow covered and the
snowfall rate is one inch per hour. Since temperatures in winter storms in Utah are often close to or just
below freezing and observing that snow and ice are more likely to bond to the road as the temperature
decreases, for a WRWI of one, it is assumed that the road temperature and wet-bulb temperature are
32 degrees Fahrenheit. Also, winds are light, less than 20 miles per hour, where snow is likely not
blowing significantly when the WRWI equals one (Rasmussen et al. 1999 references a wind speed of 10
meters per second, or about 22.4 miles per hour, as a threshold for blowing snow). Worsening
conditions increase the WRWI and vice versa.”
6. Road condition value (RCV) – found using road condition or grip; equals 1 when road condition is
reported as snow, frost, or ice; equals 0.75 when road condition is slush or freezing wet; equals
0.5 when road condition is wet; or RCV is found using linear relationship with grip as shown in
Figure 61
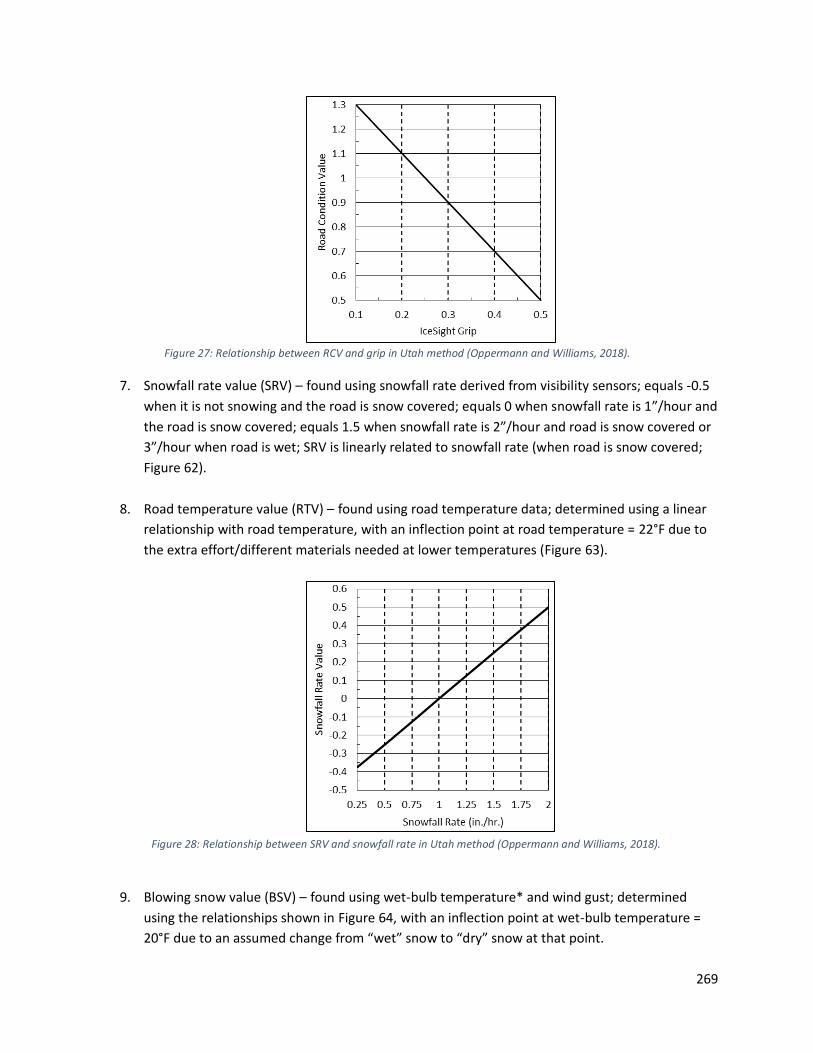
269
7. Snowfall rate value (SRV) – found using snowfall rate derived from visibility sensors; equals -0.5
when it is not snowing and the road is snow covered; equals 0 when snowfall rate is 1”/hour and
the road is snow covered; equals 1.5 when snowfall rate is 2”/hour and road is snow covered or
3”/hour when road is wet; SRV is linearly related to snowfall rate (when road is snow covered;
Figure 62).
8. Road temperature value (RTV) – found using road temperature data; determined using a linear
relationship with road temperature, with an inflection point at road temperature = 22°F due to
the extra effort/different materials needed at lower temperatures (Figure 63).
9. Blowing snow value (BSV) – found using wet-bulb temperature* and wind gust; determined
using the relationships shown in Figure 64, with an inflection point at wet-bulb temperature =
20°F due to an assumed change from “wet” snow to “dry” snow at that point.
Figure 27: Relationship between RCV and grip in Utah method (Oppermann and Williams, 2018).
Figure 28: Relationship between SRV and snowfall rate in Utah method (Oppermann and Williams, 2018).

270
*”The wet-bulb temperature effectively combines the air temperature and relative humidity and
is defined as the lowest temperature that can be reached by evaporating water into the air. In
the case of winter weather, as precipitation falls it evaporates, keeping the temperature around
it cooler than the surrounding air. Therefore, wet-bulb temperature is the best available
distinguisher between rain and snow and dry and wet snow at the surface.”
10. Freezing rain value – found using precipitation, wet-bulb temperature, and road temperature;
equals 0.5 when road temperature ≤ 32°F and wet-bulb temperature > 34°F.
Figure 30: Relationship between BSV, wet-bulb temperature, and wind gust in Utah method (Oppermann and Williams, 2018).
The WRWI is calculated in real time. Each of the 5 values described above are determined and they are
summed to get the WRWI.
Figure 29: Relationship between RTV and road temperature in Utah method (Oppermann and Williams, 2018).

271
The SII is an index used to better reflect maintenance performance. It removes the road condition value
from the WRWI and is calculated as: SII = 2 x (WRWI – RCV) + 1. The SII feeds into UDOT’s Snow and Ice
Performance Measure.