Cleantech MoneyTree Report: Q4 2013 - PwC's Accelerator · Cleantech MoneyTree TM ... Cleantech...
4
Cleantech received $418 million in 38 venture deals in the fourth quarter of 2013. Funding dollars increased 47 percent quarter-over-quarter, while deal volume decreased 12 percent over the same period. January 2014 Cleantech MoneyTree TM Report: Q4 2013 Based on the MoneyTree TM Report from PricewaterhouseCoopers and the National Venture Capital Association based on data from Thomson Reuters
Transcript of Cleantech MoneyTree Report: Q4 2013 - PwC's Accelerator · Cleantech MoneyTree TM ... Cleantech...
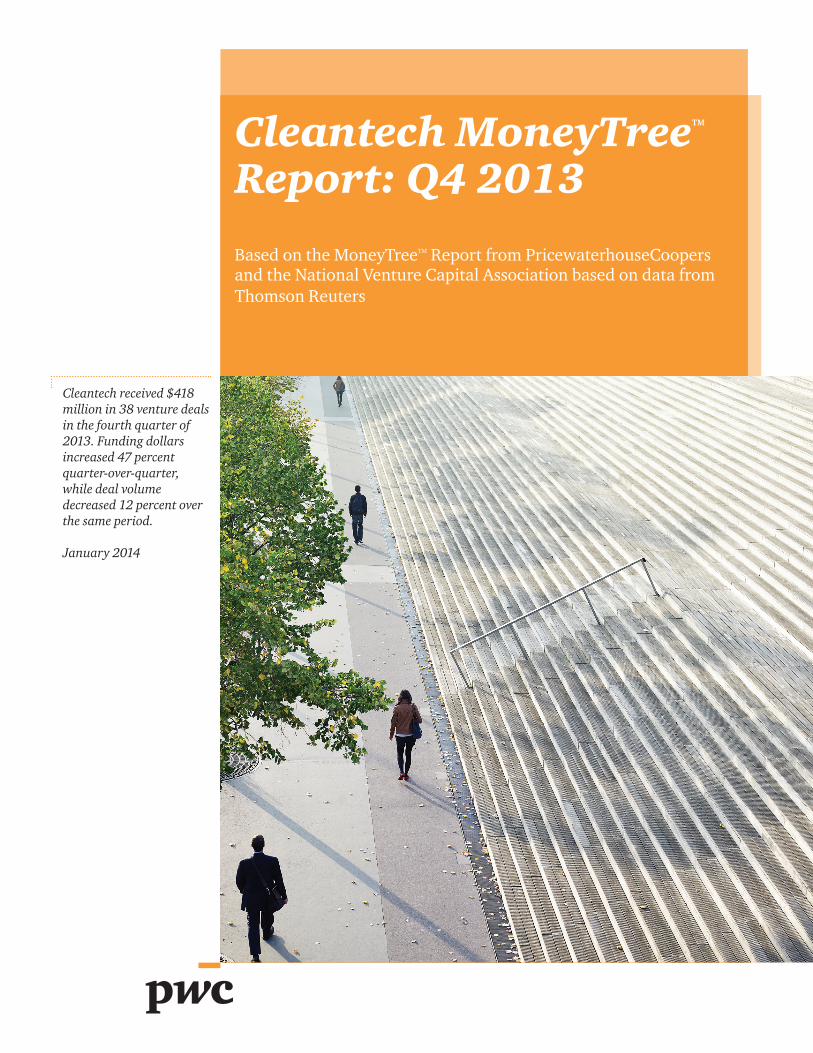
Cleantech received $418 million in 38 venture deals in the fourth quarter of 2013. Funding dollars increased 47 percent quarter-over-quarter, while deal volume decreased 12 percent over the same period.
January 2014
Cleantech MoneyTreeTM Report: Q4 2013
Based on the MoneyTreeTM Report from PricewaterhouseCoopers and the National Venture Capital Association based on data from Thomson Reuters
Cleantech
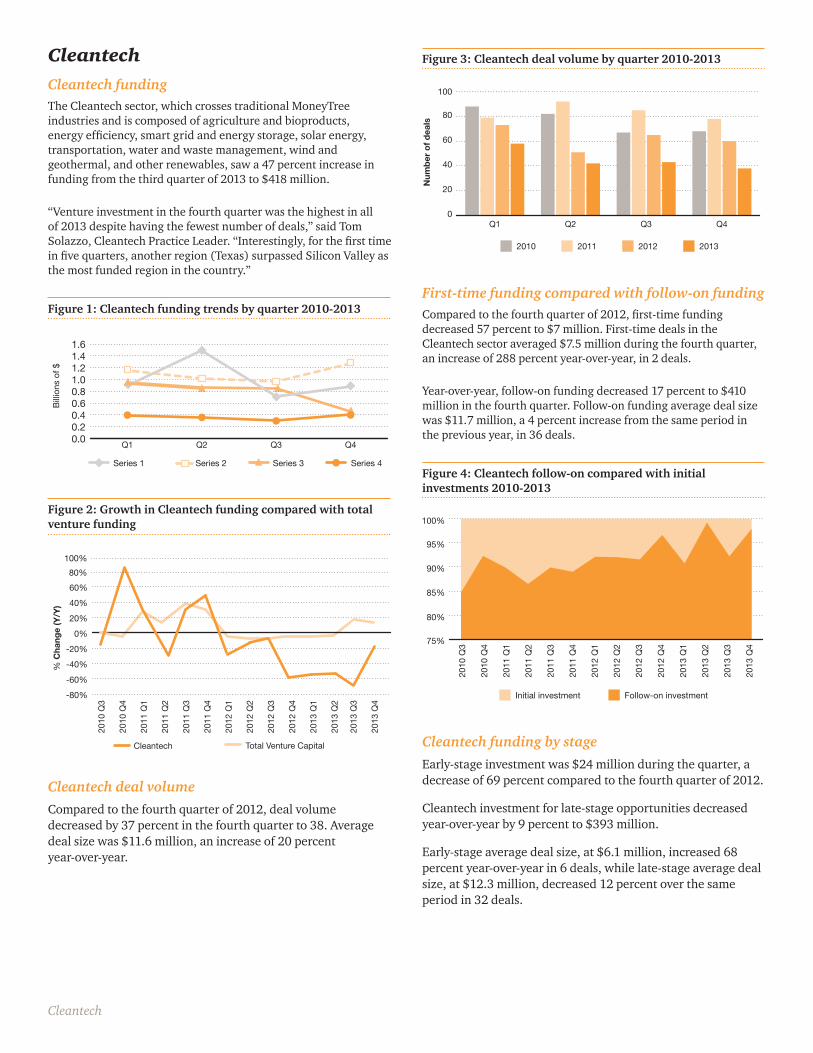
CleantechCleantech fundingThe Cleantech sector, which crosses traditional MoneyTree industries and is composed of agriculture and bioproducts, energy efficiency, smart grid and energy storage, solar energy, transportation, water and waste management, wind and geothermal, and other renewables, saw a 47 percent increase in funding from the third quarter of 2013 to $418 million.
“Venture investment in the fourth quarter was the highest in all of 2013 despite having the fewest number of deals,” said Tom Solazzo, Cleantech Practice Leader. “Interestingly, for the first time in five quarters, another region (Texas) surpassed Silicon Valley as the most funded region in the country.”
Figure 1: Cleantech funding trends by quarter 2010-2013
Series 1 Series 3 Series 4Series 2
Billio
ns o
f $
0.00.20.40.60.81.01.21.41.6
Q4Q3Q2Q1
Figure 2: Growth in Cleantech funding compared with total venture funding
-80%
-60%
-40%
-20%
0%
20%
40%
60%
Total Venture CapitalCleantech
% C
hang
e (Y
/Y)
2013
Q2
2013
Q1
2012
Q4
2012
Q3
2012
Q2
2012
Q1
2011
Q4
2011
Q3
2011
Q2
2011
Q1
2010
Q4
2010
Q3
2013
Q4
2013
Q3
80%100%
Cleantech deal volume
Compared to the fourth quarter of 2012, deal volume decreased by 37 percent in the fourth quarter to 38. Average deal size was $11.6 million, an increase of 20 percent year-over-year.
Figure 3: Cleantech deal volume by quarter 2010-2013
2010 2011 2012 2013
Num
ber
of
dea
ls
0
20
40
60
80
100
Q4Q3Q2Q1
First-time funding compared with follow-on fundingCompared to the fourth quarter of 2012, first-time funding decreased 57 percent to $7 million. First-time deals in the Cleantech sector averaged $7.5 million during the fourth quarter, an increase of 288 percent year-over-year, in 2 deals.
Year-over-year, follow-on funding decreased 17 percent to $410 million in the fourth quarter. Follow-on funding average deal size was $11.7 million, a 4 percent increase from the same period in the previous year, in 36 deals.
Figure 4: Cleantech follow-on compared with initial investments 2010-2013
75%
80%
85%
90%
95%
100%
Follow-on investmentInitial investment
2013
Q4
2013
Q3
2013
Q2
2013
Q1
2012
Q4
2012
Q3
2012
Q2
2012
Q1
2011
Q4
2011
Q3
2011
Q2
2010
Q4
2010
Q3
2011
Q1
Cleantech funding by stage
Early-stage investment was $24 million during the quarter, a decrease of 69 percent compared to the fourth quarter of 2012.
Cleantech investment for late-stage opportunities decreased year-over-year by 9 percent to $393 million.
Early-stage average deal size, at $6.1 million, increased 68 percent year-over-year in 6 deals, while late-stage average deal size, at $12.3 million, decreased 12 percent over the same period in 32 deals.
PwC
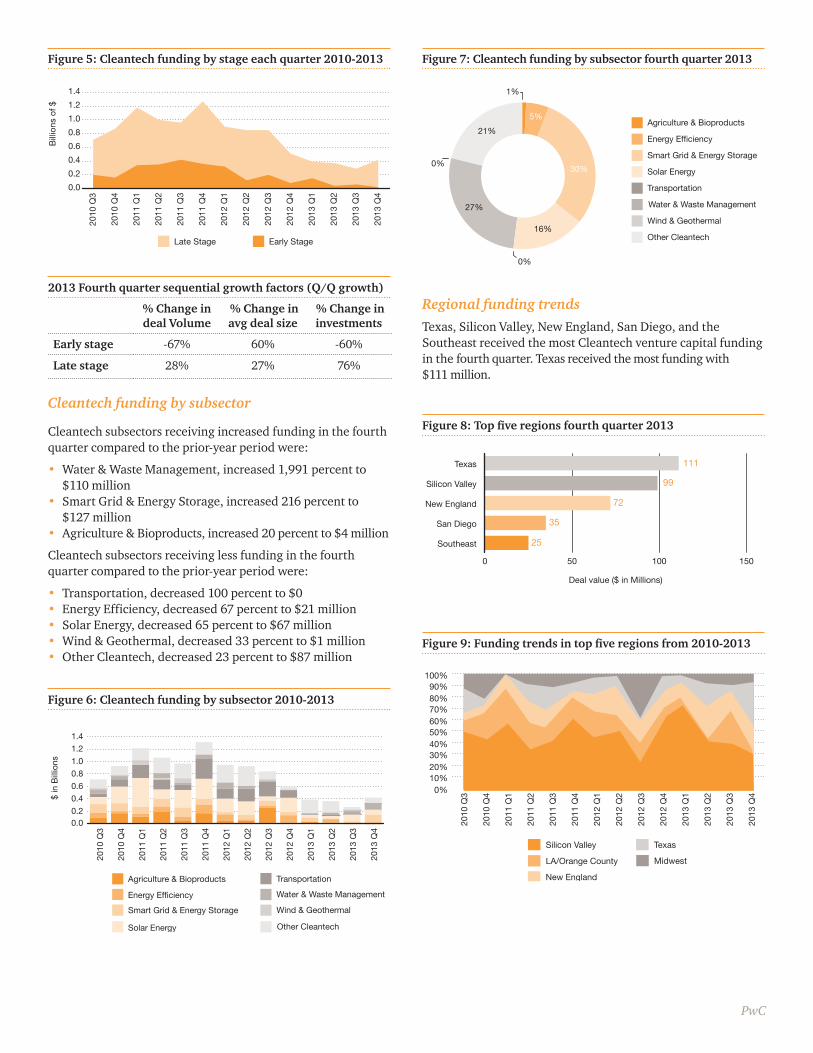
Figure 5: Cleantech funding by stage each quarter 2010-2013
Late Stage Early Stage
Bill
ions
of $
0.0
0.2
0.4
0.6
0.8
1.0
1.2
1.4
1.61.8
2013
Q4
2013
Q3
2013
Q2
2013
Q1
2012
Q4
2012
Q3
2012
Q2
2012
Q1
2011
Q4
2011
Q3
2011
Q2
2011
Q1
2010
Q4
2010
Q3
2013 Fourth quarter sequential growth factors (Q/Q growth)
% Change in deal Volume
% Change in avg deal size
% Change in investments
Early stage -67% 60% -60%
Late stage 28% 27% 76%
Cleantech funding by subsector
Cleantech subsectors receiving increased funding in the fourth quarter compared to the prior-year period were:
• Water & Waste Management, increased 1,991 percent to $110 million
• Smart Grid & Energy Storage, increased 216 percent to $127 million
• Agriculture & Bioproducts, increased 20 percent to $4 million
Cleantech subsectors receiving less funding in the fourth quarter compared to the prior-year period were:
• Transportation, decreased 100 percent to $0• Energy Efficiency, decreased 67 percent to $21 million• Solar Energy, decreased 65 percent to $67 million• Wind & Geothermal, decreased 33 percent to $1 million• Other Cleantech, decreased 23 percent to $87 million
Figure 6: Cleantech funding by subsector 2010-2013
0.00.2
0.4
0.6
0.8
1.0
1.2
1.4
Wind & Geothermal
Other Cleantech
Water & Waste Management
Transportation
Energy Efficiency
Smart Grid & Energy Storage
Solar Energy
Agriculture & Bioproducts
$ in
Bill
ions
2013
Q4
2013
Q3
2013
Q2
2013
Q1
2012
Q4
2012
Q3
2012
Q2
2012
Q1
2011
Q4
2011
Q3
2010
Q4
2010
Q3
2011
Q2
2011
Q1
Figure 7: Cleantech funding by subsector fourth quarter 2013
Solar Energy
Transportation
Wind & Geothermal
Other Cleantech
Water & Waste Management
Smart Grid & Energy Storage
Energy Efficiency
Agriculture & Bioproducts
30%
16%
27%
21%5%
0%
0%
1%
Regional funding trends
Texas, Silicon Valley, New England, San Diego, and the Southeast received the most Cleantech venture capital funding in the fourth quarter. Texas received the most funding with $111 million.
Figure 8: Top five regions fourth quarter 2013
0 50 100 150
Southeast
San Diego
New England
Silicon Valley
Texas
Deal value ($ in Millions)
111
99
35
25
72
Figure 9: Funding trends in top five regions from 2010-2013
0%10%20%30%40%50%60%70%80%90%
100%
LA/Orange County
Silicon Valley
New England
Texas
Midwest
2013
Q4
2013
Q3
2013
Q2
2013
Q1
2012
Q4
2012
Q3
2012
Q2
2012
Q1
2011
Q4
2011
Q3
2011
Q2
2011
Q1
2010
Q4
2010
Q3
© 2014 PricewaterhouseCoopers LLP. All rights reserved. “PricewaterhouseCoopers” refers to PricewaterhouseCoopers LLP, a Delaware limited liability partnership, or, as the context requires, the PricewaterhouseCoopers global network or other member firms of the network, each of which is a separate and independent legal entity. This document is for general information purposes only, and should not be used as a substitute for consultation with professional advisors. PM-14-0253
About PwC’s Cleantech Practice
PwC’s Cleantech Practice provides services and advice in assurance, tax, transactions, market entry, and business performance improvement to companies across the cleantech sector and the breadth of industries it impacts. Our broad network of industry sector specialists combines a detailed knowledge of government policy and regulation with strong private enterprise experience, providing us with an in-depth understanding of key industry issues around strategy, operations, regulations, risk, technology, and finance. As the service provider of choice for emerging and established cleantech companies as well as organizations and utilities, we can help you to develop, commercialize, deploy, and maintain go-to-market strategies for your products and services across the cleantech ecosystem.
Contacts
Tom SolazzoUS Cleantech Practice Leader (949) 437 5342 [email protected]
Brian Carey US Cleantech Advisory Leader (408) 817 7807 [email protected]
Keith ParsonsUS Cleantech Assurance Leader(720) 931 [email protected]
Matt HaskinsUS Cleantech Tax Leader (202) 414 1570 [email protected]
Debi GerstelUS Cleantech Practice Chief of Staff(408) 817 [email protected]
www.pwc.com/cleantech
www.pwcmoneytree.com
PwC Research&Analytics