Clean Water Act Section 319(h) Nonpoint Source … QAPP 13-07 Cover Sheet 10/15/14 Page 1 of 93 ....
93
TSSWCB QAPP 13-07 Cover Sheet 10/15/14 Page 1 of 93 Clean Water Act Section 319(h) Nonpoint Source Pollution Control Program Investigation into Contributions of Nitrate-Nitrogen to Plum Creek, Geronimo Creek and the Underlying Leona Aquifer TSSWCB Project 13-07 Revision 0 Quality Assurance Project Plan Texas State Soil and Water Conservation Board Prepared by Guadalupe-Blanco River Authority Effective Period: September 1, 2014 – September 30, 2016 with annual revisions required Questions concerning this quality assurance project plan should be directed to: Mike Urrutia Director of Water Quality Services Guadalupe-Blanco River Authority 933 E. Court St. Seguin, Texas 78155 (830) 379-5822 [email protected]
Transcript of Clean Water Act Section 319(h) Nonpoint Source … QAPP 13-07 Cover Sheet 10/15/14 Page 1 of 93 ....

TSSWCB QAPP 13-07 Cover Sheet
10/15/14 Page 1 of 93
Clean Water Act Section 319(h) Nonpoint Source Pollution Control Program
Investigation into Contributions of Nitrate-Nitrogen to Plum Creek, Geronimo Creek and the Underlying Leona Aquifer
TSSWCB Project 13-07
Revision 0
Quality Assurance Project Plan
Texas State Soil and Water Conservation Board
Prepared by
Guadalupe-Blanco River Authority
Effective Period: September 1, 2014 – September 30, 2016 with annual revisions required
Questions concerning this quality assurance project plan should be directed to:
Mike Urrutia Director of Water Quality Services Guadalupe-Blanco River Authority
933 E. Court St. Seguin, Texas 78155
(830) 379-5822 [email protected]

TSSWCB QAPP 13-07 Cover Sheet
10/15/14 Page 2 of 93
This page intentionally left blank

TSSWCB QAPP 13-07 Section A1
10/15/14 Page 3 of 93
A1 APPROVAL PAGE Investigation into Contributions of Nitrate-Nitrogen to Plum Creek, Geronimo Creek and the Underlying Leona Aquifer United States Environmental Protection Agency (EPA), Region VI Name: Curry Jones Title: EPA Chief; State/Tribal Programs Section Signature: ____________________________________ Date: ____________________ Name: Henry Brewer Title: EPA Texas Nonpoint Source Project Officer Signature: ____________________________________ Date: ____________________ Texas State Soil and Water Conservation Board (TSSWCB) Name: Jana Lloyd Title: TSSWCB Project Manager (PM) Signature: ____________________________________ Date: ____________________ Name: Mitch Conine Title: TSSWCB Quality Assurance Officer (QAO) Signature: ____________________________________ Date: ____________________ Guadalupe-Blanco River Authority (GBRA) Name: Mike Urrutia Title: Project Manager Signature: ____________________________________ Date: ____________________

TSSWCB QAPP 13-07 Section A1
10/15/14 Page 4 of 93
United States Geological Survey (USGS) Name: J. Mark Null Title: Chief, South Texas Program Office Signature: __________________________________ Date: ____________________ Name: Rebecca Lambert Title: Hydrologist, South Texas Program Office Signature: ___________________________________ Date: ___________________ Name: Dave Reppert Title: Acting Chief, USGS National Water Quality Laboratory Signature: __________________________________ Date: ____________________ Name: Tyler B. Coplen Title: Director, USGS Reston Stable Isotope Laboratory Signature: __________________________________ Date: ____________________ The GBRA will secure written documentation from each sub-tier project participant (e.g., subcontractors, other units of government, laboratories) stating the organization’s awareness of and commitment to requirements contained in this QAPP and any amendments or added appendices of this QAPP. The GBRA will maintain this documentation as part of the project’s QA records, and will be available for review. (See sample letter in Appendix 1 of this document.)

TSSWCB QAPP 13-07 Section A2
10/15/14 Page 5 of 93
A2 TABLE OF CONTENTS Section A1: Approval Page ..............................................................................................................3 Section A2: Table of Contents .........................................................................................................5 List of Acronyms .............................................................................................................................7 Section A3: Distribution List ...........................................................................................................9 Section A4: Project/Task Organization .........................................................................................11 Section A5: Problem Definition/Background ................................................................................16 Section A6: Project/Task Description ............................................................................................20 Section A7: Quality Objectives And Criteria For Data Quality ....................................................22 Section A8: Special Training/Certification ....................................................................................28 Section A9: Documents and Records ............................................................................................29 Section B1: Sampling Process Design ...........................................................................................31 Section B2: Sampling Methods .....................................................................................................33 Section B3: Sample Handling and Custody ...................................................................................38 Section B4: Analytical Methods ....................................................................................................40 Section B5: Quality Control...........................................................................................................42 Section B6: Instrument/Equipment Testing, Inspection, and Maintenance ...................................47 Section B7: Instrument Calibration and Frequency .......................................................................48 Section B8: Inspection/Acceptance of Supplies and Consumables ...............................................49 Section B9: Non-direct Measurements ..........................................................................................50 Section B10: Data Management ....................................................................................................51 Section C1: Assessments and Response Actions ...........................................................................56 Section C2: Reports to Management .............................................................................................57 Section D1: Data Review, Verification, and Validation ................................................................58 Section D2: Verification and Validation Methods.........................................................................59 Section D3: Reconciliation with User Requirements ....................................................................61 Section E1: References ..................................................................................................................62 Appendix 1 Example Letter to Document Adherence to the QAPP Appendix 2 Sampling Process Design and Monitoring Schedule Appendix 3 USGS protocol for collecting water-quality samples (National Field Manual) Appendix 4 USGS Water Discipline Quality Management Plan for Environmental Projects
(2010). (Prepared for USEPA, Region VI). Appendix 5 USGS TWSC Quality-Assurance Plan for Water-Quality Activities in the Texas
Water Science Center (2009) Appendix 6 Data Summary Report Appendix 7 USGS Protocol – Discharge Measurements at Gaging Locations Appendix 8 GBRA Field Data Sheet Appendix 9 USGS Surface-water Quality Field Form Appendix 10 USGS Water-Quality Field Form Appendix 11 GBRA Chain of Custody Form Appendix 12 USGS Chain of Custody Form for NWQL Appendix 13 USGS Chain of Custody Form for RSIL Appendix 14 USGS geospatial requirements/use in reports

TSSWCB QAPP 13-07 Section A2
10/15/14 Page 6 of 93
List of Tables Table A6.1 QAPP Milestones ........................................................................................................21 Table A7.1 Measurement Performance Specifications ..................................................................23 Table A9.1 Project Documents and Records .................................................................................29 Table B2.1 Sample Storage, Preservation and Handling Requirements ........................................33 Table C1.1 Assessments and Response Requirements. .................................................................56 Table D2.1 Data Review Tasks .....................................................................................................60 List of Figures Figure A4.1 Project Organization Chart – Lines of Communication ........................................... 15 Figure A5.1 Plum Creek Watershed and Sampling Locations ..................................................... 18 Figure A5.2 Geronimo Creek Watershed and Sampling Locations ............................................. 19

TSSWCB QAPP 13-07 List of Acronyms
10/15/14 Page 7 of 93
List of Acronyms/Abbreviations ASR USGS Analytical Services Request (ASR) form AWRL Ambient Water Reporting Limit BMP Best Management Practice CAR Corrective Action Report cfs cubic feet per second cm centimeter COC Chain of Custody CR County Road CRP Clean Rivers Program CWA Clean Water Act DO Dissolved Oxygen DOC Demonstration of Capability DQO Data Quality Objective EPA U.S. Environmental Protection Agency FA Filtered acidified FCC Filtered, chilled FNU Formazin Nephelometric Units FU Filtered, unacidified GBRA Guadalupe-Blanco River Authority GCWP Geronimo and Alligator Creeks Watershed Partnership GW Groundwater H Hydrogen L Liter LC Lab code LCS Laboratory Control Standard LOD Limit of Detection LOQ Limit of Quantitation mg milligrams mg/L milligrams per liter N Nitrogen NA Not Applicable NCR Nonconformance Report NELAC National Environmental Laboratory Accreditation Conference NFM National Field Manual NRCS U.S. Department of Agriculture Natural Resources Conservation Service NWIS U.S. Geological Survey National Water Information System database NWQL U.S. Geological Survey National Water Quality Laboratory, Denver, CO O Oxygen P Phosphorus PCWP Plum Creek Watershed Partnership PM Project Manager PRE Precipitation QA Quality Assurance QASM Quality Assurance System Manual

TSSWCB QAPP 13-07 List of Acronyms
10/15/14 Page 8 of 93
QAO Quality Assurance Officer QAPP Quality Assurance Project Plan QC Quality Control RL Reporting Limit RPD Relative Percent Difference RSIL U.S. Geological Survey Reston Stable Isotope Laboratory, Reston, VA RU Raw, unacidified SA Sample Amount (reference concentration) SM Standard Methods SOP Standard Operating Procedure SPR Spring SR Sample Result STPO U.S. Geological Survey South Texas Program Office, San Antonio, TX SW Surface water SWQMIS Surface Water Quality Monitoring Information System TCEQ Texas Commission on Environmental Quality TSS Total Suspended Solids TSSWCB Texas State Soil and Water Conservation Board TSWQS Texas Surface Water Quality Standards TWQI Texas Water Quality Inventory TWRI USGS Techniques of Water Resources Investigations TWSC Texas Water Science Center USGS U.S. Geological Survey WCA Unfiltered, chilled, acidified WPP Watershed Protection Plan WQMP Water Quality Management Plan WW Wastewater

TSSWCB QAPP 13-07 Section A3
10/15/14 Page 9 of 93
A3 DISTRIBUTION LIST Organizations, and individuals within, that will receive copies of the approved QAPP and any subsequent revisions include: EPA 1445 Ross Avenue, Suite 1200 Dallas, TX 75202-2733 Name: Henry Brewer Title: Texas Nonpoint Source Project Officer, Water Quality Protection Division TSSWCB P.O. Box 658 Temple, TX 76503 Name: Jana Lloyd Title: TSSWCB PM Name: Mitch Conine Title: TSSWCB QAO GBRA 933 East Court Street Seguin, TX 78155 Name: Mike Urrutia Title: GBRA Project Manager/Data Manager Name: Lee Gudgell Title: Water Quality Technician USGS-STPO 5563 DeZavala Rd, Suite 290 San Antonio, TX 78249 Name: J. Mark Null Title: Chief, South Texas Program Office Name: Rebecca Lambert Title: Hydrologist, South Texas Program Office USGS-NWQL P.O. Box 25585 Denver, CO 80225-0585
TSSWCB QAPP 13-07 Section A3
10/15/14 Page 10 of 93
Name: Dave Reppert Title: Acting Chief, USGS National Water Quality Laboratory Name: Doug Stevenson Title: QAO, USGS National Water Quality Laboratory USGS-RSIL 431 National Center Reston, VA 20192 Name: Tyler B. Coplen, Ph.D. Title: Director, USGS Reston Stable Isotope Laboratory Name: Haiping Qi, Ph.D. Title: QAO, USGS Reston Stable Isotope Laboratory The GBRA will provide copies of this QAPP and any amendments or appendices of this QAPP to each person on this list and to each sub-tier project participant, e.g., subcontractors, other units of government, laboratories. The GBRA will document distribution of the QAPP and any amendments and appendices, maintain this documentation as part of the project’s QA records, and will be available for review.

TSSWCB QAPP 13-07 Section A4
10/15/14 Page 11 of 93
A4 PROJECT/TASK ORGANIZATION The following is a list of individuals and organizations participating in the project with their specific roles and responsibilities:
EPA
Henry Brewer, EPA Project Officer
Responsible for managing the project for the EPA. Reviews project progress and reviews and approves QAPP and QAPP amendments.
TSSWCB
Jana Lloyd, TSSWCB PM
Responsible for ensuring that the project delivers data of known quality, quantity, and type on schedule to achieve project objectives. Provides the primary point of contact between the GBRA and the TSSWCB. Tracks and reviews deliverables to ensure that tasks in the workplan are completed as specified in the contract. Responsible for verifying that the QAPP is followed by the GBRA. Notifies the TSSWCB QAO of significant project nonconformances and corrective actions taken as documented in quarterly progress reports from GBRA Project Manager.
Mitch Conine, TSSWCB QAO
Reviews and approves QAPP and any amendments or revisions and ensures distribution of approved/revised QAPPs to TSSWCB participants. Assists the TSSWCB Project Manager on QA-related issues. Coordinates reviews and approvals of QAPPs and amendments or revisions. Conveys QA problems to appropriate TSSWCB management. Monitors implementation of corrective actions. Coordinates and conducts audits.
GBRA
Mike Urrutia, Project Manager/Quality Assurance Officer/Data Manager
Responsible for implementing the monitoring requirements in the contract and the QAPP. Responsible for writing and maintaining records of the QAPP and its distribution, including appendices and amendments. Responsible for maintaining written records of sub-tier commitment to requirements specified in this QAPP. Coordinates project planning activities and work of project partners. Manager is responsible for ensuring that field data are properly reviewed and verified. Prepares the electronic data deliverables for submission to the TCEQ Data Management and Analysis team, and serves as primary contact with the TCEQ Data Management and Analysis team w/r/t data management/data delivery issues. Ensures that the subcontractors are qualified to perform the contracted work. Maintains quality-assured data on GBRA Internet sites. Ensures TSSWCB project manager and/or QAO are notified of deficiencies and nonconformances, and that issues are resolved. Responsible for validating that data collected are acceptable for reporting to the TCEQ SWQMIS.
TSSWCB QAPP 13-07 Section A4
10/15/14 Page 12 of 93
Lee Gudgell, Water Quality Technician
Responsible for coordinating sampling events, calibrating equipment and making field measurements of flow and field parameters, and assisting the USGS in the collection of water-quality samples. Maintains records of field data collection and observations. Responsible for uploading data to the TCEQ SWQMIS test site for identification data errors prior to the data transmittal to TCEQ Data Management and Analysis Team.
USGS – South Texas Program Office (STPO)
J. Mark Null, Project Manager:
Responsible for managing and directing the South Texas Program Office, including all water-quality collection activities and ensuring that all aspects of the QAPP are understood and followed by Texas Water Science Center (TWSC) personnel. This is accomplished by his direct involvement or through clearly stated delegation of his responsibility to other appropriate personnel in the TWSC. Responsible for ensuring that the project delivers data of known quality and quantity on schedule to achieve project objectives. Tracks and reviews deliverables to ensure that tasks in the work plan are completed as specified. Provides final resolution of any conflicts or disputes related to the project and for reviewing and ensuring all funding, budgeting, accounting, and expenditures associated with the project.
Rebecca Lambert, Field/Data manager:
Responsible for ensuring that USGS project tasks and other requirements in the contract are executed on time and as defined by the grant work plan; assessing the quality of work by participants; submitting accurate and timely deliverables to the GBRA and TSSWCB Project and Program Managers; and coordinating attendance at conference calls, meetings, and related project activities.
Responsible for coordinating and supervising field sampling activities including sample collection of water-quality samples and quality assurance samples. Responsible for ensuring that field personnel have adequate training and a thorough knowledge of standard operating procedures (SOPs) specific to the analysis or task performed and/or supervised. Responsible for ensuring field-related project tasks and other requirements in the contract are executed on time and in accordance with the QA/QC requirements as defined by the contract work plan and in the QAPP. Ensures that USGS field staff follow the TWSC Surface-Water Quality-Assurance Plan (TWSC-QAPP) and the USGS National Field Manual (USGS-NFM) for the collection and analysis of any data associated with the project. The TWSC-QAPP documents the standards, policies, and procedures used in activities related to the collection, processing, storage, analysis, presentation, and publication of hydrologic data.
Responsible for the checking, reviewing, and finalizing of project data sets. The Field/Data manager may, at his/her discretion, delegate that duty to a senior hydrologic technician with final review and approval by the Field Manager/Data Manager. Ensures that this project is producing data of a known quality and that Project Managers and/or QA Specialists are notified of any deficiencies and nonconformance, and that all issues associated with the project are resolved.
TSSWCB QAPP 13-07 Section A4
10/15/14 Page 13 of 93
Responsible for the transfer of quality-assured water-quality data to the USGS South Texas Program office from the USGS laboratories. Responsible for coordinating with the GBRA project manager and the TSSWCB QAO to resolve QA-related issues including notification of deficiencies and nonconformances. Responsible for validating that data collected are acceptable for reporting in the final report.
Field Staff, Hydrologic Technicians:
The field staff involved in the Plum Creek Isotope Study will consist of teams of two trained hydrologic technicians that will provide the personnel necessary to complete the project tasks. The field staff assigned to the survey will have been trained and have prior experience in collecting water-quality data at other surface-water and groundwater sites in Texas. The field staff will collect hydrologic data following the guidelines outlined in the TWSC-QAPP and the USGS-NFM. Field staff will collect samples to be analyzed for a selected set of inorganic constituents, nutrients, and environmental isotopes.
USGS - National Water Quality Laboratory (NWQL)
Dave Reppert, Acting Laboratory Chief
Responsible for overall performance, administration, overall quality control and quality assurance and reporting analyses performed by the USGS-NWQL. Responsible for the overall supervision of the laboratory that is accomplished by his direct involvement or through clearly stated delegation of his responsibility to other appropriate personnel in the NWQL. The laboratory chief supervises laboratory personnel, equipment purchases, maintenance of the QA manual for laboratory operations, and supervision of the lab safety program. The laboratory chief also ensures that lab personnel are properly trained and that training records are maintained.
Doug Stevenson, QAO
Responsible for coordinating and implementing the laboratory QA program, and for maintaining the laboratory QAPP and monitoring its implementation. Also responsible for identifying, receiving, and maintaining project QA records. The QAO, or their designated representative, notifies the USGS-STPO Field and/or Project Manager of particular circumstances that may adversely affect the quality of data. Coordinates and monitors deficiencies, nonconformances, and corrective action. Coordinates the research and review of technical QA material and data related to water-quality monitoring system design and analytical techniques.
Laboratory Analyst/Technician
Performs laboratory analyses for inorganic constituents, trace elements, and nutrients as listed in Table A7.1. Any laboratory technician (physical science technician or chemist) involved in sample analysis activities is required to have a current demonstration of capability (DOC) on file for any procedure that he/she will be performing. A DOC affirms that the technician is capable of executing the analytical procedure and producing quality sample analysis results. Laboratory technicians also perform sample custodial duties, receipt of samples, and ensure that all chain of custody (COC) requirements are met when samples are received.
TSSWCB QAPP 13-07 Section A4
10/15/14 Page 14 of 93
USGS – Reston Stable Isotope Laboratory (RSIL)
Tyler Coplen, Director
Responsible for overall performance, administration, overall quality control and quality assurance, and reporting analyses performed by the USGS-RSIL. Responsible for overall supervision of the laboratory that is accomplished by his direct involvement or through clearly stated delegation of his responsibility to other appropriate personnel in the RSIL. The director supervises laboratory personnel, equipment purchases, maintenance of the QA manual for laboratory operations, and supervision of the lab safety program. He also ensures that lab personnel are properly trained and that training records are maintained.
Haiping Qi, QAO
Responsible for the quality assurance of reported analyses performed by the USGS-RSIL. Notifies Field/Data manager of any particular circumstances that may adversely affect the quality of the data. Supervises laboratory, purchasing of equipment, maintain QA manual for laboratory operations, and supervision of lab safety program. Responsible for the coordination and implementation of the laboratory QA program for the USGS-RSIL. Responsible for maintaining the laboratory QAPP and monitoring its implementation. Ensures that lab staff have proper training, training records are maintained, and have a thorough knowledge of the QAPP and related SOPs.
Also responsible for identifying, receiving, and maintaining project QA records. Reviews, validates, and verifies analyses before results are uploaded and transferred to the USGS STPO and the NWIS database. The QAO or their designated representative notifies the USGS-STPO Field and/or Project Manager of any particular circumstances that may adversely affect the quality of data. Coordinates and monitors deficiencies, nonconformances, and corrective action. Coordinates the research and review of technical QA material and data related to water quality monitoring system design and analytical techniques.
Jennifer Lorenz, Lab Analyst/Biologist, USGS-RSIL
Performs sample custodial duties, receipt of samples, and ensures that all chain of custody requirements are met when samples are received. Assists in review, validation, and verification of analytical results before results are uploaded and transferred to the USGS STOP and the NWIS database.

TSSWCB QAPP 13-07 Section A4
10/15/14 Page 15 of 93
Figure A4.1 Project Organizational Chart* – Lines of Communication
* See Project/Task Organization in this section for a description of each position’s responsibilities.
Henry Brewer EPA Region 6
Texas Project Officer (214) 665-8146
Jana Lloyd TSSWCB PM
(254) 773-2250 x224 [email protected]
Mike Urrutia GBRA Project Manager
(830) 379-5822 [email protected]
Rebecca Lambert USGS-South Texas Field/Data Manager
(210) 691-9218 [email protected]
Lee Gudgell Water Quality Technician
(830) 379-5822 [email protected]
Mitch Conine TSSWCB QAO (254) 773-2250
J. Mark Null USGS-South Texas
Project Manager (210) 691-9262
USGS National Water Quality Laboratory
Dave Reppert Acting Chief/Lab Director
(303) 236-3548 [email protected]
USGS Reston Stable Isotope Laboratory
Tyler Coplen Laboratory Supervisor/Director
(703) 648-5862 [email protected]
USGS National Water Quality Laboratory
Doug Stevenson Chief, Quality Assurance
(303) 236-3762 [email protected]
USGS Reston Stable Isotope Laboratory
Quality Assurance Officer Haiping Qi
(703) 648-5862 [email protected]
USGS Reston Stable Isotope Laboratory
Jennifer Lorenz Laboratory Technician
(703) 648-5859 [email protected]
TSSWCB QAPP 13-07 Section A5
10/15/14 Page 16 of 93
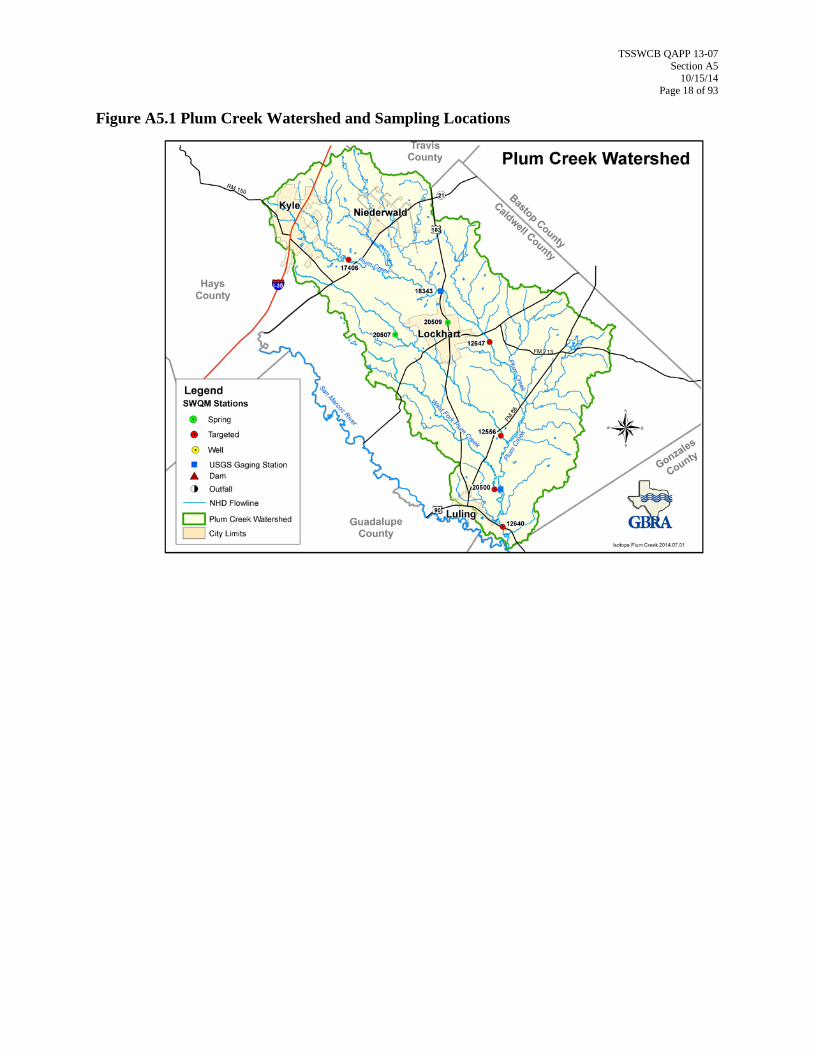
A5 PROBLEM DEFINITION/BACKGROUND Plum Creek originates in Hays County north of Kyle and runs south through Caldwell County, passing Lockhart and Luling, and eventually joins the San Marcos River at their confluence north of Gonzales County. Plum Creek is 52 miles in length and has a drainage area of 389 mi2. According to the 2012 Texas Integrated Report and 303(d) List (Texas Commission on Environmental Quality, 2012), all three assessment units of Plum Creek that make up the classified stream segment exhibit nutrient enrichment concerns for ammonia, nitrate+nitrite nitrogen and total phosphorus. The mean concentration of nitrate nitrogen for Assessment Unit (AU) 1810_01 for samples collected from December 2001 through November 2008 is 3.07 milligrams per liter (mg/L), with 25 out of 82 samples exceeding the screening concentration. The mean concentration of nitrate nitrogen for AU 1810_02 is 8.89 mg/L, with 24 out of 27 samples exceeding the screening concentration; and the mean concentration for AU 1810_03 is 9.5 mg/L, with 50 of 82 samples exceeding the screening concentration.
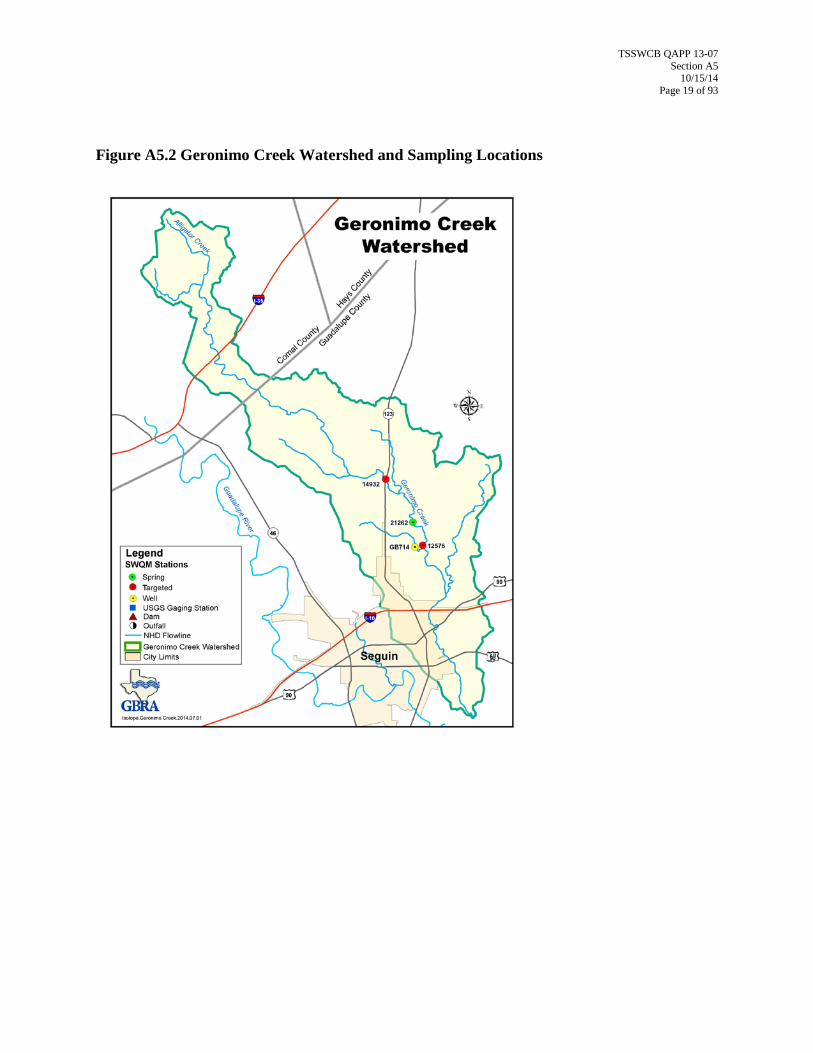
Geronimo Creek and its tributary Alligator Creek are located in Comal and Guadalupe Counties. The almost 70-square-mile watershed lies within the larger Guadalupe River Basin. The headwaters of Alligator Creek begin in southeastern Comal County, just above Interstate 35. The majority of the Alligator Creek watershed lies within the extra-territorial jurisdiction (ETJ) of New Braunfels, while the majority of the Geronimo Creek watershed is almost entirely within the ETJ of Seguin. The majority of Alligator Creek is intermittent with pools during much of the year, until just above its confluence with Geronimo Creek, where it receives spring flow. Geronimo Creek rises approximately one mile east of Clear Springs in northwestern Guadalupe County and runs southeast for 17 miles to its confluence with the Guadalupe River, three miles southeast of Seguin. Geronimo Creek is a perennial stream, receiving flows from Alligator Creek, Baer Creek, an unnamed tributary, and numerous springs along its length. The GBRA has been sampling Geronimo Creek since 1996. The mean concentration for nitrate-nitrogen during that period is 11.0 mg/L, greatly exceeding the assessment screening concentration of 1.95 mg/L and exceeding the EPA drinking water standard of 10.0 mg/L. The only point source of nutrients to the creek is the Geronimo Creek Wastewater Treatment Facility (WWTF) that is owned and operated by the City of Seguin and is within three-quarter mile of the confluence with the Guadalupe River, downstream of the historical monitoring locations. Hence, excess contributions of the nutrient loads are most likely from nonpoint sources. The land use in the area is primarily agricultural. The 44,152-acre watershed is made up of 45.5% cropland, including managed pasture, 31.6% rangeland, 9.8% forest and 11.5% developed land.
TSSWCB and Texas AgriLife Extension Service (Extension) established the Plum Creek Watershed Partnership (PCWP) in April 2006. The PCWP Steering Committee completed the Plum Creek WPP in February 2008 and was accepted by EPA in July 2009. Information about the PCWP, including the WPP, WPP Update, and implementation activities, is available at http://plumcreek.tamu.edu/. Sources of pollutants identified in the Plum Creek WPP include urban storm water runoff, pet waste, failing or inadequate on-site sewage facilities (septic systems), wastewater treatment facilities, livestock, wildlife, invasive species (feral hogs), and oil and gas production. The WPP Update notes that since the completion of the plan and implementation has begun, the watershed has seen significant changes, including severe drought, construction of State Highway 130 and subsequent commercial and residential growth, all of

TSSWCB QAPP 13-07 Section A5
10/15/14 Page 17 of 93
which have altered the land use and management of many areas in the watershed, affecting the implementation of some Best Management Practices (BMPs) (Extension, 2012).
TSSWCB, GBRA and Extension established the Geronimo and Alligator Creeks Watershed Partnership in 2008. The Geronimo Creek Partnership completed the WPP in August 2012 and was accepted by EPA in September 2012. The report states that the chemical quality of the water from wells in the area varies greatly. It goes on to say:
“Water from the alluvium and the Leona formation contains elevated nitrates. Nitrate concentrations vary by location within the watershed and by depth of the well. It is not uncommon to have nitrate-nitrogen concentrations at or above the primary drinking water standard of 10 mg/L. Further exploration of the hydraulic connection between these groundwater sources and the water in the creeks may help explain the elevated nitrate-nitrogen levels in the creeks. The draft report goes on to say that while LDC [Load Duration Curve] analysis indicated that nitrate-nitrogen levels exceed the screening criterion across all flow ranges, a review of area water well data in the Texas Water Development Board Groundwater Database revealed evidence of historically elevated nitrate-nitrogen concentrations (2 mg/L to over 40 mg/L) which pre-date the first use of inorganic fertilizers in the late 1940s. For example, one well drilled in the Alligator Creek watershed in 1943 yielded a nitrate concentration of 21.6 mg/L. Water testing data from the same time period for several other wells located in the Leona Formation and in immediately adjacent watersheds showed nitrate-nitrogen concentrations ranging from 10.8 to 21.7 mg/L. These data suggest that “natural”, non-anthropogenic sources of nitrate-nitrogen are impacting in-stream levels of this pollutant. More intensive sampling and study would be required to accurately allocate the contribution of nitrates from groundwater. Another important observation is that the loading which might be expected from fertilizer and waste products during runoff conditions is not demonstrated by a noticeable increase in nitrate-nitrogen concentrations in the stream when compared to levels measured during ambient flows. The Steering Committee determined that together, these factors suggest that activities in the watershed are having little impact on in-stream nitrate-nitrogen concentrations.”
Water-quality monitoring is being conducted by GBRA at three sites on Plum Creek through resources dedicated by the TCEQ CRP. Through TSSWCB project 10-07, Surface Water Quality Monitoring and Additional Data Collection Activities to Support the Implementation of the Plum Creek Watershed Protection Plan, GBRA is conducting intensive targeted monitoring on tributaries, springs, wastewater effluent, urban storm water runoff, and other main stem in-stream sites. GBRA is conducting water-quality monitoring at one site on Geronimo Creek through resources provided by TCEQ CRP. In addition to the CRP monitoring, GBRA resumed comprehensive water quality monitoring in 2012 in the Geronimo and Alligator Creeks watersheds under TSSWCB project 11-06, Water Quality Monitoring in the Geronimo Creek Watershed and Facilitation of the Geronimo Creek and Alligator Creeks Watershed Partnership, and will be used to assess projects identified in the WPP as they are implemented. The purpose of this QAPP is to clearly delineate GBRA and USGS QA policy, management structure, and procedures that will be used to implement the QA requirements necessary to verify and validate the water-quality data collected for this project. Figure A5.1 and A5.2 are maps of the project watersheds.
TSSWCB QAPP 13-07 Section A5
10/15/14 Page 18 of 93
Figure A5.1 Plum Creek Watershed and Sampling Locations
TSSWCB QAPP 13-07 Section A5
10/15/14 Page 19 of 93
Figure A5.2 Geronimo Creek Watershed and Sampling Locations

TSSWCB QAPP 13-07 Section A6
10/15/14 Page 20 of 93
A6 PROJECT/TASK DESCRIPTION
Since monitoring of Plum Creek and Geronimo Creek began in the late 1990’s, water-quality samples collected from these creeks have shown elevated concentrations of nitrate-nitrogen. Currently (2014), the state stream water-quality standards are not numeric for nutrients, so concentrations exceeding the screening concentration of 1.95 mg/L nitrate-nitrogen have been used to designate a stream as having a concern for nitrate-nitrogen. The possible sources of the nutrient concern are numerous. Plum Creek is effluent-dominated, fed by springs that originate from rocks in the Leona Formation, and known to have elevated concentrations of nitrate-nitrogen. Geronimo Creek also is fed by springs from that same aquifer. Stakeholders in both watersheds have long suspected fertilizer use as the source of the nitrates in the Leona Formation, but elevated concentrations of nitrates have been measured in samples collected from the Leona Aquifer long before commercial inorganic fertilizers came into use. Other possible sources may include septic systems, organic fertilizers, nitrifying plants, and atmospheric deposition.
The TCEQ has begun to develop numeric water quality standards for nitrate-nitrogen. At the end of that process, the standards established by TCEQ and the EPA could move Plum Creek and Geronimo Creek from a designation of “concern for nutrients” to the 303(d) List of impaired waterbodies. The Plum Creek and Geronimo Creek Watershed Partnerships have not waited for “impaired waterbody” status to start working on best management practices (BMPs) that could reduce sources of nitrates. In order to help direct efforts and funding toward the most likely or most influential source(s) of nitrate, this project will look to isotopic signatures of nitrogen and oxygen in the nitrates. The ratios of the isotopes of nitrogen and oxygen in nitrate often can be useful in determining sources of nitrates in groundwater and surface water. Isotopic ratios are expressed as the ratio of the heavier isotope to the lighter isotope relative to a standard in parts per thousand (U.S. Geological Survey, 2011).
A total of 11 sites in the Plum Creek (7) and the Geronimo Creek (4) watersheds will be sampled for field parameters, flow/water level, major ions, selected nutrient species including nitrate-nitrogen, and selected nitrogen, oxygen, and hydrogen isotopes including 15N/14N (δ15N) and 18O/16O (δ18O) of nitrate and δ18O and δD of water isotopes approximately quarterly (four times) during the project period. GBRA and USGS will collect surface-water quality samples from five sites in the Plum Creek watershed and from two sites in the Geronimo Creek watershed. If there is insufficient flow at the primary sites to collect the water-quality samples at the time that each synoptic is being conducted, samples will be collected from the alternate sites.
Water-quality samples will be collected over a range in hydrologic conditions (wet and dry conditions). Groundwater-quality samples will be collected from two sites - one site in each watershed. Springflow samples also will be collected from two sites – one site in each watershed. To help characterize possible sources of nitrates to the watersheds, samples of precipitation (rainfall) and wastewater also will be collected to define the end member concentrations of the water chemistry and the isotopes. Up to an additional four (4) precipitation samples and four (4) wastewater samples will be collected during the sampling period for the project. A total of 44 environmental samples will be collected from the surface water, groundwater, and spring sites during the project. Up to eight (8) additional precipitation and wastewater samples will be collected to define the end member concentrations of the water chemistry, and six (6) quality-assurance samples will be collected during the course of the
TSSWCB QAPP 13-07 Section A6
10/15/14 Page 21 of 93
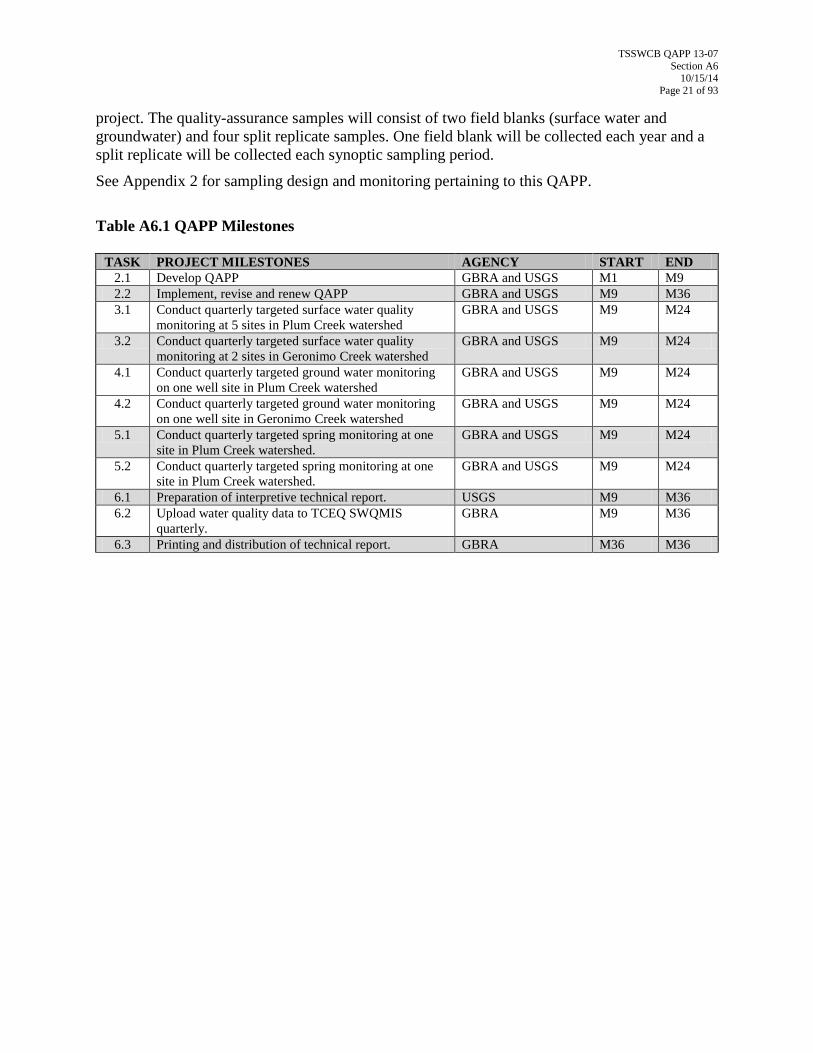
project. The quality-assurance samples will consist of two field blanks (surface water and groundwater) and four split replicate samples. One field blank will be collected each year and a split replicate will be collected each synoptic sampling period.
See Appendix 2 for sampling design and monitoring pertaining to this QAPP.
Table A6.1 QAPP Milestones
TASK PROJECT MILESTONES AGENCY START END 2.1 Develop QAPP GBRA and USGS M1 M9 2.2 Implement, revise and renew QAPP GBRA and USGS M9 M36 3.1 Conduct quarterly targeted surface water quality
monitoring at 5 sites in Plum Creek watershed GBRA and USGS M9 M24
3.2 Conduct quarterly targeted surface water quality monitoring at 2 sites in Geronimo Creek watershed
GBRA and USGS M9 M24
4.1 Conduct quarterly targeted ground water monitoring on one well site in Plum Creek watershed
GBRA and USGS M9 M24
4.2 Conduct quarterly targeted ground water monitoring on one well site in Geronimo Creek watershed
GBRA and USGS M9 M24
5.1 Conduct quarterly targeted spring monitoring at one site in Plum Creek watershed.
GBRA and USGS M9 M24
5.2 Conduct quarterly targeted spring monitoring at one site in Plum Creek watershed.
GBRA and USGS M9 M24
6.1 Preparation of interpretive technical report. USGS M9 M36 6.2 Upload water quality data to TCEQ SWQMIS
quarterly. GBRA M9 M36
6.3 Printing and distribution of technical report. GBRA M36 M36

TSSWCB QAPP 13-07 Section A8
10/15/14 Page 22 of 93
A7 QUALITY OBJECTIVES AND CRITERIA FOR DATA QUALITY
Systematic watershed monitoring, is described in the TCEQW SWQM Procedures Manual, vol. 1 as sampling that is planned for a short duration (1 to 2 years) and designed to screen waters that would not normally be included in the routine monitoring program, monitor at sites to check the water quality status, and investigate areas of potential concern.
GBRA and USGS will conduct targeted water-quality monitoring at five surface-water sites, one groundwater site, and one springflow site in the Plum Creek watershed. GBRA and USGS also will conduct approximately quarterly targeted water-quality monitoring at two surface-water sites, one groundwater site, and one springflow site in the Geronimo Creek watershed. The water-quality synoptics will occur approximately quarterly over a 12-month period, for a total of 4 synoptics. Water-quality samples will be collected over a range in hydrologic conditions (wet and dry) during the period. Alternate sites have been identified in the Plum Creek watershed if there is insufficient flow to sample at the primary sites. Additional samples also will be collected from one precipitation site and four wastewater effluent sites in the Plum Creek watershed during the study period. Sampling is planned to extend over a 12 month period once the QAPP has been approved. Four (4) synoptic samplings will be conducted during the study. Water-quality samples will be collected approximately once a quarter as conditions permit, over a range in hydrologic conditions including baseflow and higher flow after runoff events. “Higher flow conditions” are defined when a rainfall event occurs that is substantial enough to generate runoff. In the Plum Creek watershed, four surface-water quality samples will be collected from each site for a total of 20 samples. The primary sites include the three routine sampling locations in the Clean Rivers Program (17406, 12640, and 12647). The other two sites are routine sites in the TSSWCB CWA Section 319(h) project 10-07, “Surface Water Quality Monitoring and Additional Data Collection Activities to Support the Implementation of the Plum Creek Watershed Protection Plan” (12556, 20500).
Four surface-water quality samples will be collected from each of two sites in the Geronimo Creek watershed for a total of eight samples. The sites will be the two historical sampling locations in the Clean Rivers Program (14932 and 12576). If extreme hydrologic conditions exist throughout the first year so that water-quality samples cannot be collected as scheduled because of drought or extended flooding, the USGS will initiate discussions with the GBRA and the TSSWCB to determine whether or not to extend the period of time allowed to collect the needed samples or assess if enough data have been collected to meet the study objectives. Two ground-water quality and two springflow quality samples will be collected, one of each type from each watershed for a total of eight samples each.
Four precipitation samples and four wastewater samples will be collected to characterize the chemical concentrations of potential end-member sources of nitrates to the watersheds. The precipitation samples will be collected using a portable precipitation collector setup that will be deployed at the Lockhart Water Plant prior to a precipitation event. The proposed site for the collection of the precipitation samples is on the grounds of the Lockhart water plant where there is a secured area for the collector to be deployed during an event. The collector will be deployed a distance away from the water plant and away from the influence of trees, etc., but inside the fence to maintain security for the sampler and to help reduce the possibility of contamination

TSSWCB QAPP 13-07 Section A8
10/15/14 Page 23 of 93
from point sources. When the storm event has concluded, the precipitation sample will be put on ice and transported to the USGS office laboratory in San Antonio for processing. By collecting precipitation samples, the quality of atmospheric deposition can be characterized and information provided on one of the inputs to the nitrogen budget in the watershed. The timing of collection of the samples will be based on precipitation events in the watershed and may not coincide with the timing of the collection of the remaining samples. The wastewater samples will be collected from the outfalls of permitted wastewater discharge sites in the Plum Creek watershed. The samples will be collected from the following wastewater treatment plants: 1) City of Kyle, 2) City of Buda, 3) City of Luling, and 4) City of Lockhart no. 2. The four effluent samples will be collected during one of the periods when the other surface-water, groundwater, and spring samples are being collected. The wastewater treatment plants will only be sampled once during the course of the study.
Flow, groundwater levels, and field parameters will be collected by GBRA. The USGS will collect water-quality samples that will be analyzed for select nutrient species, nitrogen isotopes, and major ions. The nutrient and major ion samples will be analyzed at the USGS’s National Water Quality Laboratory (NWQL) in Denver, Colorado, and the nitrogen, oxygen, and deuterium isotope samples will be analyzed at the USGS’s Reston Stable Isotope Laboratory (RSIL) in Reston, Virginia. Field parameters will include pH, temperature, specific conductance, dissolved oxygen, and turbidity. Conventional parameters will include nutrient species, major ions, and nitrate-nitrogen isotopes (δ15N nitrogen, δ18O oxygen, and δD hydrogen). Flow parameters will be collected at surface-water sites by gage, electric, mechanical or Doppler means, and will include severity. Groundwater levels will be made by a tapedown using a steel tape or an electric tape (E-Line).
The measurement performance specifications to support the project objectives for a minimum data set are specified in Table A7.1 and in the text following.
Table A7.1 Measurement Performance Specifications
PARAMETER UNITS MATRIX METHOD PARA-METER CODE
2
AWRL3
LOQ4 LOQ
CHECK STD
%Rec
PRECISION (RPD of
LCS/LCS dup)
BIAS (%Rec. of LCS)
Lab
Field Parameters pH units water SM 4500-H+ B. &
TCEQ SOP, V1 00400 NA1 NA NA NA NA Field
DO mg/L water SM 4500-O G. & TCEQ SOP, V1
00300 NA1 NA NA NA NA Field
Conductivity umhos/cm water SM 2510 & TCEQ SOP, V1
00094 NA1 NA NA NA NA Field
Temperature oC water SM 2550 & TCEQ SOP, V1
00010 NA1 NA NA NA NA Field
Turbidity-Field FNU water USGS TWRI 9-A6.7
636802 NA NA NA NA NA Field
Flow cfs water TCEQ SOP, V1 00061 NA1 NA NA NA NA Field Days since precipitation event
days other TCEQ SOP, V1 72053 NA1 NA NA NA NA Field

TSSWCB QAPP 13-07 Section A8
10/15/14 Page 24 of 93
PARAMETER UNITS MATRIX METHOD PARA-
METER CODE
2
AWRL3
LOQ4 LOQ
CHECK STD
%Rec
PRECISION (RPD of
LCS/LCS dup)
BIAS (%Rec. of LCS)
Lab
Flow measurement method
1-gage 2-electric
3-mechanical 4-weir/flume
5-doppler
water TCEQ SOP, V1 89835 NA1 NA NA NA NA Field
Flow severity 1-no flow 2-low
3-normal 4-flood 5-high 6-dry
water TCEQ SOP, V1 01351 NA1 NA NA NA NA Field
Flow Estimate Cubic feet per second
(ft3/s)
water TCEQ SOP, V1 74069 NA1 NA NA NA NA Field
Depth to water Ft water USGS T&M 1-A1 72019 NA NA NA NA NA Field
Conventional and Isotopic Parameters pH, unfiltered, lab
units water USGS I-2587-89 00403 NA 0.1 NA NA NA NWQL
Specific conductance, unfiltered, lab
µS/cm water USGS I-2781-85 00095 NA 5 NA NA NA NWQL
Alkalinity, filtered, field
mg/L water USGS TWRI 9-A6.6
39086 20 1 NA NA NA Field
Bicarbonate, filtered, field
mg/L water USGS TWRI 9-A6.6
00453 NA 1 NA NA NA Field
Carbonate, filtered, field
mg/L water USGS TWRI 9-A6.6
00452 NA 1 NA NA NA Field
Hydroxide, filtered, field
mg/L water USGS TWRI 9-A6.6
71834 NA 1 NA NA NA Field
Hardness mg/L water Algorithm 00900 5 NA NA 20 80-120 NWQL Dissolved solids, filtered
mg/L water USGS I-1750-89 70300 10 20 NA 20 80-120 NWQL
Boron, filtered µg/L water USGS I-1472-95 01020 NA 2 70-130 20 80-120 NWQL Bromide, filtered mg/L water USGS I-2057-85 71870 NA 0.03 70-130 20 80-120 NWQL Calcium, filtered mg/L water USGS I-1427-87 00915 NA 0.022 70-130 20 80-120 NWQL Magnesium, filtered
mg/L water USGS I-1427-87 00925 NA 0.011 70-130 20 80-120 NWQL
Potassium, filtered
mg/L water USGS 3120 00935 NA 0.03 70-130 20 80-120 NWQL
Sodium, filtered mg/L water USGS I-1427-87 00930 NA 0.06 70-130 20 80-120 NWQL Silica, filtered mg/L water USGS I-1427-87 00955 NA 0.018 70-130 20 80-120 NWQL Chloride, filtered mg/L water USGS I-2057-85 00940 5 0.02 70-130 20 80-120 NWQL Fluoride, filtered mg/L water USGS I-2057-85 00950 NA 0.01 70-130 20 80-120 NWQL Strontium, filtered
µg/L water USGS I-1427-87 01080 NA 0.02 70-130 20 80-120 NWQL
Sulfate, filtered mg/L water USGS I-2057-85 00945 5 0.02 70-130 20 80-120 NWQL Ammonia, filtered
mg/L water USGS I-2525-89, USGS I-2522-90
00608 NA 0.010 70-130 20 80-120 NWQL
Total Kjeldahl Nitrogen (TKN), unfiltered
mg/L water USGS I-4515-91 00625 0.2 0.07 70-130 20 80-120 NWQL
Nitrite, filtered mg/L water USGS I-2540-89, USGS I-2542-90,
00613 NA 0.0010 70-130 20 80-120 NWQL

TSSWCB QAPP 13-07 Section A8
10/15/14 Page 25 of 93
PARAMETER UNITS MATRIX METHOD PARA-
METER CODE
2
AWRL3
LOQ4 LOQ
CHECK STD
%Rec
PRECISION (RPD of
LCS/LCS dup)
BIAS (%Rec. of LCS)
Lab
Nitrate + nitrite , filtered
mg/L water NWQL I-2548-11 00631 NA 0.01 70-130 20 80-120 NWQL
Phosphorus, filtered
mg/L water NWQL I-2650-03 00666 NA 0.010 70-130 20 80-120 NWQL
Orthophosphate, as P, filtered
mg/L water USGS I-2606-89, USGS I-2601-90
00671 0.04 0.004 70-130 20 80-120 NWQL
Phosphorus, unfiltered
mg/L water USGS I-4650-03 00665 0.06 0.010 70-130 20 80-120 NWQL
15N/14N of NO3 per mil water RSIL LC-2900 826902 NA NA NA NA NA RSIL
18O/16O of NO3 per mil water RSIL LC-2900 630412 NA NA NA NA NA RSIL
18O/16O of water per mil water RSIL LC-489 826992 NA NA NA NA NA RSIL 2H/1H of water per mil water RSIL LC-1574 820822 NA NA NA NA NA RSIL
1 Reporting to be consistent with TCEQ SWQM guidance where possible and based on measurement capability. 2 USGS parameter code listed for specific analysis. Not all parameter codes will match TSWQS. Parameter codes that are unique to USGS and not found in
the TCEQ parameter code master list will be deleted before uploading to SWQMIS, but will be reported as part of the final report. 3 AWRLs listed for parameters on the TCEQ AWRL master list available at http://www.tceq.texas.gov/waterquality/clean-rivers/qa/index.html. 4 The Limit of Quantification (LOQ) is equivalent to the USGS’s Reporting Limit (RL). Values provided for the LOQ are the NWQL RLs for a specific
constituent measured using the listed analytical methods.
References for Table A7.1: American Public Health Association (APHA), American Water Works Association (AWWA), and Water Environment Federation
(WEF), “Standard Methods for the Examination of Water and Wastewater,” 20th Edition, 1998 American Public Health Association (APHA), American Water Works Association (AWWA), and Water Environment Federation
(WEF), 1998, Standard methods for the examination of water and wastewater (20th edition), 3120, p. 3-37 to 3-43. (Method ID: USGS 3120)
Coplen, T.B., Qi, Haiping, Révész, Kinga, Casciotti, Karne, and Hannon, J.E., 2012, Determination of the δ15N and δ18O of nitrate in water; RSIL lab code 2900, chap. 17 of Stable isotope-ratio methods, sec. C of Révész, Kinga, and Coplen, T.B., eds., Methods of the Reston Stable Isotope Laboratory (slightly revised from version 1.0 released in 2007): U.S. Geological Survey Techniques and Methods, book 10, 35 p., available only at http://pubs.usgs.gov/tm/2006/tm10c17/. (Supercedes version 1.0 released in 2007.)
Cunningham, W.L., and Schalk, C.W., 2011, Groundwater technical procedures of the U.S. Geological Survey: U.S. Geological Survey Techniques and Methods 1-A1, 151 p. (Method: USGS T&M 1-A1). Also available online at http://pubs.usgs.gov/tm/1a1.
Fishman, M.J., ed., 1993, Methods of analysis by the U.S. Geological Survey National Water Quality Laboratory – Determination of inorganic and organic constituents in water and fluvial sediments: U.S. Geological Survey Open-File Report 93-125, 217 p. (Method ID: I-1472-87, I-2525-89, I-2522-90, I-2601-90, I-2606-89)
Fishman, M.J., and Friedman, L.C., 1989, Methods for determination of inorganic substances in water and fluvial sediments: U.S. Geological Survey Techniques of Water-Resources Investigations, book 5, chap. A1, 545 p. (Method ID: I-2587-89, I-2781-85, I-1750-89, I-2057-85, I-1630-85)
Patton, C.J., and Kryskalla, J.R., 2003, Methods of analysis by the U.S. Geological Survey National Water Quality Laboratory: Evaluation of alkaline persulfate digestion as an alternative to Kjeldahl digestion for determination of total and dissolved nitrogen and phosphorus in water: Water-Resources Investigations Report 03-4174, 33 p. (Method ID: I-4650-03; I-2650-03)
Patton, C.J., and Kryskalla, J.R., 2011, Colorimetric determination of nitrate plus nitrite in water by enzymatic reduction, automated discrete analyzer methods: U.S. Geological Survey Techniques and Methods, book 5, chap. B8. (Method ID: I-2548-11)
Patton, C.J., and Truitt, E.P., 2000, Methods of analysis by the U.S. Geological Survey National Water Quality Laboratory – Determination of ammonium plu organic nitrogen by a Kjeldahl digestion method and an automated photometric finish that includes digest cleanup by gas diffusion: U.S. Geological Survey Open-File Report 00-170, 31 p. (Method ID: I-4515-91)
Révész, Kinga, and Coplen, T.B., 2008, Determination of the δ(2H/1H) of water: RSIL lab code 1574, chap. C1 of Révész, Kinga, and Coplen, T.B., eds., Methods of the Reston Stable Isotope Laboratory: U.S. Geological Survey Techniques and Methods 10-C1, 27 p.
Révész, Kinga, and Coplen, T.B., 2008, Determination of the δ(18O/16O) of water: RSIL lab code 489, chap. C2 of Révész, Kinga, and Coplen, T.B., eds., Methods of the Reston Stable Isotope Laboratory: U.S. Geological Survey Techniques and Methods 10-C2, 28 p.
Rounds, S.A., 2006, Alkalinity and acid neutralizing capacity (version 3.0), in National field manual for the collection of water-quality data, Wilde, F.D. and Radtke, D.B., eds., U.S. Geological Survey Techniques of Water-Resources Investigations, Book 9, Chapter A6, Section 6.6, 53 p. (Also available at http://water.usgs.gov/owq/FieldManual/Chapter6/section6.6/.)
Struzeski, T.M., DeGiacomo, W.J., and Zayhowski, E.J., 1996, Methods of analysis by the U.S. Geological Survey National Water Quality Laboratory – Determination of dissolved aluminum and boron in water by inductively coupled plasma-atomic emission spectrometry: U.S. Geological Survey Open-File Report 96-149, 17 p. (Method ID: I-1472-95)
TCEQ SOP, V1 - TCEQ SWQM Procedures, Volume 1: Physical and Chemical Monitoring Methods for Water, Sediment, and Tissue, August 2012 or subsequent editions (RG-415)
United States Environmental Protection Agency (USEPA) “Methods for Chemical Analysis of Water and Wastes,” Manual #EPA-600/4-79-020.

TSSWCB QAPP 13-07 Section A8
10/15/14 Page 26 of 93
U.S. Geological Survey, 2010, Quality Assurance Plan for Groundwater Activities: Available at http://tx.cr.usgs.gov/GWQAP.20120222.
Accessed on April 11, 2014. (Method ID: USGS T&M 1-A1). U.S. Geological Survey, 2012, National Field Manual, Chapter A6. Field Measurements, Section 6.6. Alkalinity and Acid Neutralizing
Capacity: U.S. Geological Survey Techniques of Water Resources Investigations (TWRI), Book 9, Chapter A6, Section 6.6. (Method ID: USGS TWRI 9-A6.6).
U.S. Geological Survey, 2012, National Field Manual, Chapter A6. Field Measurements, Section 6.7. Turbidity: U.S. Geological Survey Techniques of Water Resources Investigations (TWRI), Book 9, Chapter A6, Section 6.7. (Method ID: USGS TWRI 9-A6.7).
Ambient Water Reporting Limits (AWRLs)
The Ambient Water Reporting Limit (AWRL) establishes the reporting specification at or below which data for a parameter must be reported to be compared with freshwater screening criteria. The AWRLs specified in Table A7.1 are the program-defined reporting specifications for each analyte and yield data acceptable for TCEQ. Because the project is collecting water-quality data under targeted conditions the data will be submitted to TCEQ, but will not be used in water-quality assessments. The data is being collected to establish the origin of a recognized nutrient concern or degradation of the water body. The Limit of Quantification (LOQ) (formerly known as the reporting limit) is the minimum level, concentration, or quantity of a target variable (e.g., target analyte) that can be reported with a specified degree of confidence. The following requirements must be met to report results to the TSSWCB:
• The laboratory’s LOQ for each analyte must be at or less than the AWRL as a matter of routine practice
• The laboratory must demonstrate its ability to quantitate at its LOQ for each analyte by running an LOQ check standard for each batch of samples analyzed.
Laboratory Measurement QC Requirements and Acceptability Criteria are provided in Section B5.
Precision
Precision is the degree to which a set of observations or measurements of the same property, obtained under similar conditions, conform to themselves. It is a measure of agreement among replicate measurements of the same property, under prescribed similar conditions, and is an indication of random error.
Field split replicates are used to assess the variability of sample handling, preservation, and storage, as well as the analytical process, and are prepared by splitting samples in the field. Control limits for field split replicates are defined in Section B5.
Laboratory precision is assessed by comparing replicate analyses of laboratory control samples in the sample matrix (e.g. deionized water, sand, commercially available tissue). Precision results are compared against measurement performance specifications and used during evaluation of analytical performance. Program-defined measurement performance specifications for precision are defined in Table A7.1.
Bias

TSSWCB QAPP 13-07 Section A8
10/15/14 Page 27 of 93
Bias is a statistical measurement of correctness and includes multiple components of systematic error. A measurement is considered unbiased when the value reported does not differ from the true value. Bias is determined through the analysis of laboratory control samples and LOQ check standards prepared with verified and known amounts of all target analytes in the sample matrix (e.g. deionized water) and by calculating percent recovery. Results are compared against measurement performance specifications and used during evaluation of analytical performance. Program-defined measurement performance specifications for LCSs are specified in Table A7.1.
Representativeness
Site selection, the appropriate sampling regime, the sampling of all pertinent media according to USGS SOPs (Appendixes 2-5), and use of only approved analytical methods will assure that the measurement data represents the conditions at the monitoring sites.
Data collection for targeted sampling will be toward both ambient conditions and those conditions that are influenced by storm events. Spring flow will be collected spatially, seasonally and under varying meteorological conditions. Sampling of wells and wastewater treatment plants will be conducted once per quarter, without regard to specific meteorological conditions. Rainfall samples will be collected under varying meteorological conditions. Representativeness will be measured with the completion of sample collection in accordance with the approved QAPP.
Comparability
Confidence in the comparability of targeted data sets for this project is based on the commitment of project staff to use only approved sampling and analysis methods and QA/QC protocols in accordance with quality system requirements and as described in this QAPP and in USGS SOPs. Comparability is also guaranteed by reporting data in standard units, by using accepted rules for rounding figures, and by reporting data in a standard format as specified in Section B10.
Completeness
The completeness of the data is basically a relationship of how much of the data is available for use compared to the total potential data. Ideally, 100% of the data should be available. However, the possibility of unavailable data due to accidents, insufficient sample volume, broken or lost samples, etc. is to be expected. Therefore, it will be a general goal of the project that 90% data completion is achieved.
TSSWCB QAPP 13-07 Section A8
10/15/14 Page 28 of 93
A8 SPECIAL TRAINING/CERTIFICATION
New GBRA field personnel receive training in proper sampling and field analysis. Before actual sampling or field analysis occurs, they demonstrate to the GBRA QAO (or designee) their ability to properly calibrate field equipment and perform field sampling and analysis procedures. Field personnel training is documented and retained in the personnel file and are available during a monitoring systems audit.
New USGS field personnel receive training in proper water-quality sampling methods described in Appendix 3. Before actual sampling or field analysis occurs, they demonstrate to the QAO (or designee) their ability to properly calibrate field equipment and perform field sampling and analysis procedures. Field personnel training is documented and retained in the personnel file and are available during a monitoring systems audit.

TSSWCB QAPP 13-07 Section A9
10/15/14 Page 29 of 93
A9 DOCUMENTS AND RECORDS
The documents and records that describe, specify, report, or certify GBRA activities are listed. These reports may or may not be kept in paper form since the reports can be regenerated from the lab database at any time. If kept, the paper form is kept for a minimum of one year and then scanned into the GBRA ITRAX for permanent record.
The GBRA laboratory database is housed on the laboratory computer and is backed up on the network server nightly. A back up copy of the network server files, including ITRAX, is made every Monday and that copy is stored off-site at a protected location. The GBRA network administrator is responsible for the servers and back up generation.
The documents and records that describe, specify, report, or certify USGS activities are listed. These reports may or may not be kept in paper form since the reports can be regenerated from the USGS NWIS database at any time. If kept, the paper form is kept for a minimum of one year and scanned for permanent record (Appendixes 4-5). Table A9.1 Project Documents and Records
Document/Record Location Retention (yrs) Format QAPPs, amendments and appendices TSSWCB/GBRA/USGS One Year/
Indefinitely Paper/ Electronic
QAPP distribution documentation GBRA/USGS One Year/ Indefinitely
Paper/ Electronic
QAPP commitment letters GBRA/USGS One Year/ Indefinitely
Paper/ Electronic
Field notebooks or data sheets GBRA/USGS One Year/ Indefinitely
Paper/ Electronic
Field staff training records GBRA/USGS One Year/ Indefinitely
Paper/ Electronic
Field equipment calibration/maintenance logs
GBRA/USGS One Year/ Indefinitely
Paper/ Electronic
COC records GBRA/USGS One Year/ Indefinitely
Paper/ Electronic
Field SOPs GBRA/USGS One Year/ Indefinitely
Paper/ Electronic
Corrective Action Documentation GBRA/USGS One Year/ Indefinitely
Paper/ Electronic
The TSSWCB may elect to take possession of records or receive copies of the records at the conclusion of the specified retention period.
Laboratory Test Reports
Analytical results from the USGS’s NWQL and RSIL laboratories will be clearly and accurately documented in the test results reports. The requirements for reporting data and the procedures will be provided and include:
* title of report and unique identifiers on each page * name and address of the laboratory

TSSWCB QAPP 13-07 Section A9
10/15/14 Page 30 of 93
* name and address of the client * clear identification of the sample(s) analyzed * date and time of sample receipt * date and time of collection * sample depth (as applicable) * identification of method used * identification of samples that did not meet QA requirements and why (i.e., holding times
exceeded) * sample results * units of measurement * sample matrix * dry weight or wet weight (as applicable) * project-specific QC results including field split results (as applicable); equipment, trip,
and field blank results (as applicable); and LOQ and LOD confirmation (% recovery) (as applicable);
* narrative information on QC failures or deviations from requirements that may affect the quality of results or is necessary for verification and validation of data.
Electronic Data
Selected data will be submitted electronically to TCEQ’s Data Management and Analysis Team for upload to SWQMIS. A completed Data Summary (Appendix 6), as described in the most recent version of TCEQ SWQM Data Management Reference Guide, will be submitted with each data submittal.
Amendments to the QAPP
Revisions to the QAPP may be necessary to address incorrectly documented information or to reflect changes in project organization, tasks, schedules, objectives, and methods. Requests for amendments will be directed from the GBRA Project Manager to the TSSWCB Project Manager electronically. Amendments are effective immediately upon approval by the GBRA Project Manager, the USGS Project Manager, the GBRA and USGS QAOs, the TSSWCB Project Manager, and the TSSWCB QAO. They will be incorporated into the QAPP by way of attachment and distributed to personnel on the distribution list by the GBRA Project Manager.

TSSWCB QAPP 13-07 Section B1
10/15/14 Page 31 of 93
B1 SAMPLING PROCESS DESIGN
The sample design is based on the intent of this project as recommended by the USGS and the PCWP Steering Committee. Both Plum Creek and Geronimo Creek exhibit nutrient enrichment concerns for nitrate+nitrite nitrogen. To help direct efforts and funding toward the most likely or most influential source(s) of nitrate, this project will look to isotopic signatures of nitrogen and oxygen in the nitrates. The ratios of the isotopes of nitrogen and oxygen in nitrate often are useful for determining sources of nitrates in groundwater and surface water. Isotopic ratios are expressed as the ratio of the heavier isotope to the lighter isotope relative to a standard in parts per thousand (USGS, 2011).
GBRA and USGS will conduct quarterly targeted surface water quality monitoring at 5 sites in the Plum Creek watershed and at 2 sites in the Geronimo Creek watershed over a range in hydrologic conditions (wet and dry conditions), collecting field, flow and conventional parameter groups. Sites for targeted monitoring were selected to represent spatial, seasonal and meteorological conditions throughout the Plum Creek and Geronimo Creek watersheds and in the Leona Aquifer. Sample collection will occur approximately every quarter and over a range in hydrologic conditions. The surface water will be sampled for major ions, selected nutrient species including nitrate-nitrogen, and (15N/14N) and oxygen (18O/16O) isotopes four times during the project period.
GBRA and USGS will conduct quarterly targeted groundwater quality monitoring at one well site in the Plum Creek watershed and one well site in the Geronimo Creek watershed, collecting field and conventional parameter groups. The ground water will be sampled for major ions, selected nutrient species including nitrate-nitrogen, and (15N/14N) and oxygen (18O/16O) isotopes four times during the project period.
GBRA and USGS will conduct quarterly targeted spring quality monitoring at one site in the Plum Creek watershed and one site in the Geronimo Creek watershed, collecting field and conventional parameter groups. The springs will be sampled for major ions, selected nutrient species including nitrate-nitrogen, and (15N/14N) and oxygen (18O/16O) isotopes four times during the project period. The data will be collected at a location that is in the closest proximity to the headwaters of each spring and with enough depth to collect a representative sample. Care will be given to sample above stream features such as riffles that could influence water quality after the spring emerges from the ground. Flow will be measured manually or estimated at each spring.
A total of 44 environmental samples and six (6) quality-assurance samples will be collected. The quality-assurance samples will consist of 2 field blanks and 4 split replicate samples.
The area has been known to experience scattered showers, i.e., afternoon heat-related showers of short duration that may cause some portions of the watershed to be under wet weather conditions while others are not. Targeted monitoring sites will be visited when the overall watershed is under the specific weather conditions, dry or wet. There may be times, during dry weather conditions, when there is no water in the stream in the subwatersheds. Those visits will be documented but no stream data will be collected. During wet weather conditions, the safety of the sampling crew will not be compromised in case of lightning or flooding. If there is an instance where a sampling site is inaccessible because of weather conditions or flooding, “no sample due to inaccessibility” will be documented in the field notebook.

TSSWCB QAPP 13-07 Section B1
10/15/14 Page 32 of 93
See Appendix 2 for sampling process design information and monitoring tables associated with data collected under this QAPP.

TSSWCB QAPP 13-07 Section B2
10/15/14 Page 33 of 93
B2 SAMPLING METHODS
Field Sampling Procedures
Field parameters will be collected by GBRA and measured according to procedures documented in the TCEQ Surface Water Quality Monitoring Procedures Volume 1: Physical and Chemical Monitoring Methods for Water, Sediment, and Tissue (RG-415), or the most recent version with any interim changes posted to the Surface Water Quality Monitoring Procedures website (http://www.tceq.texas.gov/waterquality/monitoring/swqm_procedures.html). Updates shall be incorporated into program procedures, QAPP, SOPs, etc., within 60 days of any final published version. All following references to “TCEQ Surface Water Quality Monitoring Procedures,” “TCEQ Surface Water Quality Monitoring Procedures as amended,” “SWQM Procedures,” “SWQM Procedures Manual,” “TCEQ Surface Water Quality Monitoring Procedures Volume 1 (RG-415),” refer to this section and are used interchangeably. USGS check measurements of streamflow discharge measurements will be made using the methods discussed in the USGS’s Discharge Measurements at Gaging Stations (Appendix 7) (Turnipseed and Sauer, 2010), Additional aspects outlined in Section B below reflect specific requirements for sampling under this project and/or provide additional clarification.
Water-quality field samples and associated water-quality field parameters such as alkalinity will be collected by the USGS according to procedures documented in the USGS National Field Manual for the Collection of Water-Quality Data Techniques of Water-Resources Investigations Book 9 available online at http://pubs.water.usgs.gov/trwi9A/ (U.S. Geological Survey, variously dated) (Appendix 3), the USGS’s Quality Management Plan for Environmental Projects (U.S. Geological Survey, 2010) (Appendix 4), and the USGS’s Quality Assurance Plan for Water-Quality Activities in the Texas Water Science Center (U.S. Geological Survey, 2009) (Appendix 5).
Table B2.1 Sample Storage, Preservation and Handling Requirements
Parameter Matrix Container Preservation* Sample Volume
Holding Time
pH, lab Water Polyethylene bottle
Unfiltered, unacidified 250 or 500 mL
30 days
Specific conductance, lab
Water Polyethylene bottle (RU)
Unfiltered, unacidified 250 or 500 mL
30 days
Alkalinity, field Water Polyethylene bottle (FU)
Filter through 0.45-µm filter; chill; maintain at 4 °C ± 2 °C
250 mL Process immediately
Total dissolved solids Water Polyethylene bottle (FU)
Filter through 0.45-µm filter 250 mL 180 days
Boron Water Polyethylene bottle, acid-rinsed (FA)
Filter through 0.45-µm filter; acidify to pH < 2 with 2 mL Ultrex HNO3 (nitric acid)
125 or 250 mL
180 days
Bromide Water Clear polyethylene bottle (FU)
Filter through 0.45-µm filter 250 or 500 mL
180 days
Calcium Water Polyethylene bottle, acid-rinsed (FA)
Filter through 0.45-µm filter; acidify to pH < 2 with 2 mL Ultrex HNO3 (nitric acid)
125 or 250 mL
180 days

TSSWCB QAPP 13-07 Section B2
10/15/14 Page 34 of 93
Magnesium Water Polyethylene
bottle, acid-rinsed (FA)
Filter through 0.45-µm filter; acidify to pH < 2 with 2 mL Ultrex HNO3 (nitric acid)
125 or 250 mL
180 days
Potassium Water Polyethylene bottle, acid-rinsed (FA)
Filter through 0.45-µm filter; acidify to pH < 2 with 2 mL Ultrex HNO3 (nitric acid)
125 or 250 mL
180 days
Sodium Water Polyethylene bottle, acid-rinsed (FA)
Filter through 0.45-µm filter; acidify to pH < 2 with 2 mL Ultrex HNO3 (nitric acid)
125 or 250 mL
180 days
Silica Water Polyethylene bottle, acid-rinsed (FA)
Filter through 0.45-µm filter; acidify to pH < 2 with 2 mL Ultrex HNO3 (nitric acid)
125 or 250 mL
30 days
Chloride Water Polyethylene bottle (FU)
Filter through 0.45-µm filter 250 or 500 mL
180 days
Fluoride Water Polyethylene bottle (FU)
Filter through 0.45-µm filter 250 or 500 mL
180 days
Sulfate Water Polyethylene bottle (FU)
Filter through 0.45-µm filter 250 or 500 mL
180 days
Strontium Water Polyethylene bottle, acid-rinsed (FA)
Filter through 0.45-µm filter; acidify to pH < 2 with 2 mL Ultrex HNO3 (nitric acid)
125 or 250 mL
180 days
Nitrogen, ammonia as N
Water Brown polyethylene bottle (FCC)
Filter through 0.45-µm filter; chill; maintain at 4 °C ± 2 °C
125 mL 30 days
Nitrogen, ammonia + organic nitrogen
Water Polyethylene bottle (WCA)
Unfiltered, acidify to pH < 2 with 1 mL 4.5 N sulfuric acid; chill; maintain at 4 °C ± 2 °C
125 mL 30 days
Nitrogen, nitrite Water Brown polyethylene bottle (FCC)
Filter through 0.45-µm filter; chill; maintain at 4 °C ± 2 °C
125 mL 30 days
Nitrogen, nitrite + nitrate
Water Brown polyethylene bottle (FCC)
Filter through 0.45-µm filter; chill; maintain at 4 °C ± 2 °C
125 mL 30 days
Phosphorus, total dissolved
Water Brown polyethylene bottle (FCC)
Filter through 0.45-µm filter; chill; maintain at 4 °C ± 2 °C
125 mL 30 days
Orthophosphate as P Water Brown polyethylene bottle (FCC)
Filter through 0.45-µm filter; chill; maintain at 4 °C ± 2 °C
125 mL 30 days
Phosphorus, total Water Polyethylene bottle (WCA)
Unfiltered; acidify to pH < 2 with 1 mL 4.5 N sulfuric acid; chill; maintain at 4 °C ± 2 °C
125 mL 30 days
15N/14N of nitrate Water Amber polyethylene bottle with
Polyseal cap
Filter first through 0.45-µm filter and then second through a 0.2-µm syringe filter; Add reagent-grade
NaOH pellets to achieve a pH greater than 10, but not higher than
11.95.
125 mL 120 days
18O/16O of nitrate Water Amber polyethylene bottle with
Polyseal cap
Filter first through 0.45-µm filter and then second through a 0.2-µm syringe filter; Add reagent-grade
NaOH pellets to achieve a pH greater than 10, but not higher than
11.95.
125 mL 120 days
18O/16O of water Water Glass bottle with Polyseal
cap
Unfiltered; Fill bottle and cap with Polyseal camp
60 mL 180 days
2H/1H of water Water Glass bottle with Polyseal
cap
Unfiltered; Fill bottle and cap with Polyseal camp
60 mL 180 days

TSSWCB QAPP 13-07 Section B2
10/15/14 Page 35 of 93
* Preservation occurs within 15 minutes of sample collection or within 15 minutes of the creation of the composite of rainfall sampling
Sample Containers
Samples are collected in either polyethylene or glass bottles, depending on the analysis type (Table B2.1). Samples are cleaned and prepped following the guidelines listed in the USGS’s National Field Manual (Appendix 3). Samples analyzed for major ions, nutrients, selected trace elements, δ15N of nitrate, and δ18O of nitrate are collected in polyethylene bottles that are cleaned with the following procedure: 1) Containers are rinsed with deionized water in the laboratory, and 2) then triple rinsed with environmental sample water prior to filling the bottle. Capsule filters are rinsed with deionized water in the laboratory and then also rinsed with the environmental sample prior to collecting a filtered sample. Care is taken to ensure that the capsule filter is completely purged of deionized water so that sample results are not diluted. Environmental isotope samples for δ18O and δD are collected in glass bottles and do not require pre-rinsing. Samples are preserved according to preservation requirements listed in Table B2.1.
Processes to Prevent Contamination
Procedures outlined in the USGS’s National Field Manual (Appendix 3) and the USGS’s Quality-Assurance Plan for Water-Quality Activities in the Texas Water Science Center (Appendix 5) document the necessary steps to prevent contamination of the samples. Field blank QC samples (identified in Section B5) are collected to verify that contamination has not occurred.
Documentation of Field Sampling Activities
Field parameters are documented on GBRA field data sheets as presented in Appendix 8 and water-quality sample information are documented on USGS field forms presented in Appendixes 9 and 10. The following will be recorded for all visits:
• Station identification • Sampling date • Location • Sampling depth (if applicable) • Sampling time • Sample collector’s name/signature • Values for all field parameters, including flow and flow severity (SW and SPR sites) and
depth to water (GW sites). • Detailed observational data, including:
o water appearance o weather o biological activity o unusual odors o pertinent observations related to water quality or stream uses (i.e., exceptionally poor
water quality conditions/standards not met; stream uses such as swimming, boating, fishing, irrigation pumps)
TSSWCB QAPP 13-07 Section B2
10/15/14 Page 36 of 93
o watershed or instream activities (i.e., bridge construction, livestock watering
upstream) • missing parameters (i.e., when a scheduled parameter or group of parameters is not
collected)
The following appendixes contain descriptions and documentation of GBRA and USGS field and water-quality sample collection and report preparation:
Appendix 2 – Sample Process Design and Monitoring Schedule Appendix 3 – USGS Protocol for collecting water-quality samples (National Field Manual) Appendix 4 – USGS Water Discipline Quality Management Plan for Environmental Projects Appendix 5 – USGS TWSC Quality-Assurance Plan for Water-quality Activities in the Texas
Water Science Center Appendix 6 – Data Summary Report Appendix 7 – USGS Protocol for Discharge Measurements at Gaging Locations Appendix 8 – GBRA field data sheet Appendix 9 – USGS Surface-water quality field form Appendix 10 – USGS Groundwater-quality field form Appendix 11 – GBRA Chain of Custody Form Appendix 12 – USGS Chain of Custody Form for NWQL Appendix 13 – USGS Chain of Custody Form for RSIL Appendix 14 – USGS Geospatial Requirements/Use in Reports
Recording Data
For the purposes of this section and subsequent sections, all field and laboratory personnel will follow the basic rules for recording information as documented below:
• Legible writing in indelible ink with no modifications, write-overs or cross-outs; • Correction of errors with a single line followed by an initial and date; • Close-out on incomplete pages with an initialed and dated diagonal line.
Deficiencies, Nonconformances, and Corrective Action Related to GBRA Field Sampling Requirements
Deficiencies are defined as unauthorized deviations from procedures documented in the QAPP or other applicable documents. Nonconformances are deficiencies that affect data quantity and/or quality and render the data unacceptable or indeterminate. Deficiencies related to sampling method requirements include, but are not limited to, such things as sample container, volume, and preservation variations, improper/inadequate storage temperature, holding-time exceedances, and sample site adjustments.
Deficiencies are documented in logbooks, field data sheets, etc., by field or laboratory staff and reported to the cognizant field or laboratory supervisor who will in turn notify the GBRA Project Manager/QAO of the potential nonconformance. The GBRA Project Manager/QAO will initiate a Nonconformance Report (NCR) to document the deficiency.

TSSWCB QAPP 13-07 Section B2
10/15/14 Page 37 of 93
The GBRA Project Manager/QAO (and other affected individuals/organizations), will determine if the deficiency constitutes a nonconformance. If the GBRA Project Manager/QAO determines that the activity or item in question does not affect the data quality and therefore is not a valid nonconformance, the NCR will be completed accordingly and the NCR closed. If a nonconformance does exist, the GBRA Project Manager/QAO, will determine the disposition of the nonconforming activity or item and necessary corrective action(s); results will be documented by the GBRA Project Manager/QAO by completion of a CAR.
CARs document: root cause(s); impact(s); specific corrective action(s) to address the deficiency; action(s) to prevent recurrence; individual(s) responsible for each action; the timetable for completion of each action; and the means by which completion of each corrective action will be documented. CARs will be included with quarterly progress reports. In addition, significant conditions (i.e., situations which, if uncorrected, could have a serious effect on safety or on the validity or integrity of data) will be reported to the TSSWCB immediately both verbally and in writing.
Deficiencies, Nonconformances and Corrective Action Related to USGS Water Quality Sampling Requirements
Deficiencies are defined as unauthorized deviations from procedures documented in the QAPP or other applicable documents. Nonconformances are deficiencies which affect data quantity and/or quality and render the data unacceptable or indeterminate. Deficiencies related to sampling methods requirements include, but are not limited to, such things as sample container, volume, and preservation variations, improper/inadequate storage temperature, holding-time exceedances, and sample site adjustments.
Deficiencies are documented in logbooks, field data sheets, etc. by field staff and reported to the cognizant field supervisor who will notify the USGS Project Manager/QAO. The USGS Project Manager will notify the GBRA Project Manager of the potential nonconformance. The GBRA Project Manager/QAO will initiate a Nonconformance Report (NCR) to document the deficiency.
The USGS Project Manager, in consultation with the GBRA Project Manager/QAO (and other affected individuals/organizations), will determine if the deficiency constitutes a nonconformance. If it is determined the activity or item in question does not affect data quality and therefore is not a valid nonconformance, the NCR will be completed accordingly and the NCR closed. If it is determined a nonconformance does exist, the USGS Project Manager, in consultation with GBRA Project Manager/QAO, will determine the disposition of the nonconforming activity or item and necessary corrective action(s); results will be documented by the USGS Project Manager by completion of a Corrective Action Report.
Corrective Action Reports (CARs) document: root cause(s); impact(s); specific corrective action(s) to address the deficiency; action(s) to prevent recurrence; individual(s) responsible for each action; the timetable for completion of each action; and the means by which completion of each corrective action will be documented. CARs will be included with quarterly progress reports. In addition, significant conditions (i.e., situations which, if uncorrected, could have a serious effect on safety or on the validity or integrity of data) will be reported to the TSSWCB immediately both verbally and in writing.
TSSWCB QAPP 13-07 Section B3
10/15/14 Page 38 of 93
B3 SAMPLE HANDLING AND CUSTODY
Sample Tracking
Proper sample handling and custody procedures ensure the custody and integrity of samples beginning at the time of sample collection and continuing through transport, sample receipt, preparation, and analysis.
A sample is in custody if it is in actual physical possession or in a secured area that is restricted to authorized personnel. The USGS COC form is a record that documents the possession of the samples from the time of collection to receipt in the specified laboratory. The following information concerning the sample is recorded on the USGS COC forms for the NWQL and the RSIL (See Appendixes 12 and 13).
• Date and time of collection • Site identification name and number • Sampler’s name • Sample matrix • Sample type • Number of containers and respective volumes • Preservative used or if the sample was filtered • Analyses required • Custody transfer signatures and dates and time of transfer • Bill of lading (if applicable) • Laboratory Schedule(s) to be performed
Sample Labeling
Samples from the field are identified by waterproof labels affixed to the container or marked with an indelible marker. Label information includes:
• Site identification name and number • Date and time of collection of sample • Sample type • Amount and type of preservative added, if applicable • Designation of “field-filtered” as applicable • Laboratory Schedule(s) to be performed
Sample Handling
After collection of samples are complete, sample containers are immediately stored on ice in an ice chest prior to shipping to the USGS’s National Water Quality Laboratory or the USGS’s Reston Stable Isotope Laboratory. Samples will be shipped with appropriate USGS COC forms and Analytical Service Request (ASR) forms. Ice chests will remain in the possession of the USGS field technician, in the locked vehicle, or secured area that is restricted to authorized personnel until shipped to the labs. After receipt at the USGS labs, the samples are stored in the

TSSWCB QAPP 13-07 Section B3
10/15/14 Page 39 of 93
refrigeration unit or given to the analyst for immediate analysis. Only authorized laboratory personnel will handle samples received by each laboratory.
Deficiencies, Nonconformances and Corrective Action Related to Chain of Custody (COC)
Deficiencies are defined as unauthorized deviations from procedures documented in the QAPP or other applicable documents. Nonconformances are deficiencies which affect data quantity and/or quality and render the data unacceptable or indeterminate. Deficiencies related to the USGS COC include, but are not limited to, delays in transfer, resulting in holding time violations; incomplete documentation, including signatures; possible tampering of samples; broken or spilled samples, etc.
Deficiencies are documented in logbooks, field data sheets, etc. by field or laboratory staff and reported to the appropriate field or laboratory supervisor who will notify the USGS Project Manager. The USGS Project Manager will also notify the USGS QAO of the potential nonconformance. The USGS QAO will initiate a NCR to document the deficiency.
The USGS Project Manager, in consultation with USGS QAO, will determine if the deficiency constitutes a nonconformance. If it is determined the activity or item in question does not affect data quality and therefore is not a valid nonconformance, the NCR will be completed accordingly and the NCR closed. If it is determined a nonconformance does exist, the USGS Project Manager in consultation with the USGS QAO will determine the disposition of the nonconforming activity or item and necessary corrective action(s); results will be documented by the USGS QAO by completion of a CAR.
CARs document: root cause(s); impact(s); specific corrective action(s) to address the deficiency; action(s) to prevent recurrence; individual(s) responsible for each action; the timetable for completion of each action; and the means by which completion of each corrective action will be documented. CARs will be included with quarterly progress reports. In addition, significant conditions (i.e., situations which, if uncorrected, could have a serious effect on safety or on the validity or integrity of data) will be reported to the GBRA Project Manager/QAO, who in turn will notify TSSWCB Project Manager immediately both verbally and in writing.

TSSWCB QAPP 13-07 Section B4
10/15/14 Page 40 of 93
B4 ANALYTICAL METHODS
The analytical methods, associated matrices, and performing laboratories are listed in Table A7.1. The authority for analysis methodologies under this project is derived from the TSWQS (Texas Administrative Code §§307.1 - 307.10) in that data generally are generated for comparison to those standards and/or criteria. The standards state that “Procedures for laboratory analysis must be in accordance with the most recently published edition of the book entitled Standard Methods for the Examination of Water and Wastewater, the TCEQ Texas Surface Water Quality Monitoring Procedures as amended, 40 CFR Part 136, or other reliable procedures acceptable to the commission, and in accordance with Chapter 25 of this title.” Laboratories collecting data under this QAPP are compliant with the TNI standards, at a minimum, where applicable (Appendix 4). Copies of laboratory QASMs and SOPs are available for review by the TSSWCB to confirm that methods are compliant with TNI standards, and where applicable (Appendix 4).
Standards Traceability
All standards used in the field and laboratory are traceable to certified reference materials. Standards preparation is fully documented and maintained in a standards log book. Each documentation includes information concerning the standard identification, starting materials, including concentration, amount used and lot number; date prepared, expiration date and preparer’s initials/signature. The reagent bottle is labeled in a way that will trace the reagent back to preparation. Table A7.1 lists the methods to be used for field and laboratory analyses.
Deficiencies, Nonconformances and Corrective Action Related to Analytical Methods
Deficiencies are defined as unauthorized deviations from procedures documented in the QAPP or other applicable documents. Nonconformances are deficiencies which affect quantity and/or quality and render the data unacceptable or indeterminate. Deficiencies related to field and laboratory measurement systems include, but are not limited to, instrument malfunctions, blank contamination, QC sample failures, etc.
Deficiencies are documented in logbooks, field data sheets, etc. by field or laboratory staff and reported to the cognizant field or laboratory supervisor who will notify the USGS Project Manager. The USGS Project Manager will notify the USGS QAO of the potential nonconformance. The USGS QAO will initiate a NCR to document the deficiency.
The USGS Project Manager, in consultation with USGS QAO (and other affected individuals/organizations), will determine if the deficiency constitutes a nonconformance. If it is determined the activity or item in question does not affect data quality and therefore is not a valid nonconformance, the NCR will be completed accordingly and the NCR closed. If it is determined a nonconformance does exist, the USGS Project Manager, in consultation with the USGS QAO, will determine the disposition of the nonconforming activity or item and necessary corrective action(s); results will be documented by the USGS QAO by completion of a CAR.
CARs document: root cause(s); impact(s); specific corrective action(s) to address the deficiency; action(s) to prevent recurrence; individual(s) responsible for each action; the timetable for

TSSWCB QAPP 13-07 Section B4
10/15/14 Page 41 of 93
completion of each action; and, the means by which completion of each corrective action will be documented. CARs will be included with quarterly progress reports. In addition, significant conditions (i.e., situations which, if uncorrected, could have a serious effect on safety or on the validity or integrity of data) will be reported to GBRA Project Manager/QAO and the TSSWCB Project Manager immediately both verbally and in writing.
TSSWCB QAPP 13-07 Section B5
10/15/14 Page 42 of 93
B5 QUALITY CONTROL
Sampling Quality Control Requirements and Acceptability Criteria
The minimum Field QC Requirements are outlined in the TCEQ SWQM Procedures, Volume 1: Physical and Chemical Monitoring Methods for Water, Sediment, and Tissue (RG-415) and the USGS’s National Field Manual (Appendix 3) and Quality Assurance Plan for Water-Quality Activities in the Texas Water Science Center (Appendix 5). Specific requirements are outlined below. Field QC sample results are submitted separately from the laboratory data report (see Section A9).
Field blanks
USGS field blanks are water samples collected to assess the potential contamination associated with field collection or from field sources such as airborne materials, containers, or preservatives. A field blank is prepared and processed in the field according to the appropriate lab schedule by filling a clean container with inorganic or organic blank water, filtering if needed, and appropriate preservative as required. The frequency requirement for field blanks water samples is specified in Appendix 2 – Sample Process Design and Monitoring Schedule.
The analysis of field blanks should yield values lower than the LOQ. When target analyte concentrations are high, blank values should be lower than 5% of the lowest value of the batch. Field blanks are associated with batches of field samples. In the event of a field blank failure for one or more target analytes, all applicable data associated with the field batch will be qualified as not meeting project QC requirements, and these qualified data will not be reported to the TCEQ SWQMIS. These data include all samples collected on that day during that sample run and should not be confused with the laboratory analytical batch.
Field Split Replicates
A USGS field split replicate is a single sample subdivided by field staff immediately following collection and submitted to the laboratory as two separately identified samples according to procedures specified in the USGS’s National Field Manual (Appendix 3) (U.S. Geological Survey, variously dated). Split replicate samples are preserved, handled, shipped, and analyzed identically and are used to assess the variability in all of these processes. Field split replicates apply to conventional and isotopic samples only and are collected on an approximately 10% basis, or one per batch, whichever is more frequent. The frequency requirement for field split replicates is specified in Appendix 2 – Sample Process Design and Monitoring Schedule.
The precision of field split replicate results is calculated by RPD using the following equation:
RPD = (X1-X2)/((X1+X2)/2)) * 100%
A 30% RPD criteria will be used to screen field split results as a possible indicator of excessive variability in the sample handling and analytical system. If it is determined that elevated quantities of an analyte (i.e., > RL) were measured and analytical variability can be eliminated as a factor, then variability in field split results will primarily be used as a trigger for discussion with field staff to ensure samples are being handled in the field correctly. Some individual

TSSWCB QAPP 13-07 Section B5
10/15/14 Page 43 of 93
sample results may be invalidated based on the examination of all extenuating information. The information derived from field splits is generally considered to be event specific and would not normally be used to determine the validity of an entire batch; however, some batches of samples may be invalidated depending on the situation. Professional judgment during data validation will be relied upon to interpret the results and take appropriate action. The qualification (i.e., invalidation) of data will be documented on the Data Summary. Deficiencies will be addressed as specified in this section under Deficiencies, Nonconformances, and Correction Action related to QC.
Laboratory Measurement Quality Control Requirements and Acceptability Criteria
Method Specific QC requirements
QC samples, other than those specified later in this section, are run (i.e., sample duplicates, surrogates, internal standards, continuing calibration samples, interference check samples, positive control, negative control, and media blank) as specified in the methods. The requirements for these samples, their acceptance criteria or instructions for establishing criteria, and corrective actions are method-specific.
Detailed laboratory QC requirements and corrective action procedures are contained within the individual laboratory QASMs. The minimum requirements that all participants abide by are stated below.
Limit of Quantitation (LOQ)
The laboratory will analyze a calibration standard (if applicable) at the LOQ on each day the project samples are analyzed. Calibrations including the standard at the LOQ will meet the calibration requirements of the analytical method or corrective action will be implemented.
LOQ Check Standard
An LOQ check standard consists of a sample matrix (e.g., deionized water, sand, commercially available tissue) free from the analytes of interest spiked with verified known amounts of analytes or a material containing known and verified amounts of analytes. It is used to establish intra-laboratory bias to assess the performance of the measurement system at the lower limits of analysis. The LOQ check standard is spiked into the sample matrix at a level less than or near the LOQ for each analyte for each batch of samples that are run.
The LOQ check standard is carried through the complete preparation and analytical process. LOQ check standards are run at a rate of one per analytical batch. A batch is defined as samples that are analyzed together with the same method and personnel, using the same lots of reagents, not to exceed the analysis of 20 environmental samples.
The percent recovery of the LOQ check standard is calculated using the following equation in which %R is percent recovery, SR is the sample result, and SA is the reference concentration for the check standard:
%R = SR/SA * 100

TSSWCB QAPP 13-07 Section B5
10/15/14 Page 44 of 93
Measurement performance specifications are used to determine the acceptability of LOQ Check Standard analyses as specified in Table A7.1.
Laboratory Control Standard (LCS)
A LCS consists of a sample matrix (e.g., deionized water) free from the analytes of interest spiked with verified known amounts of analyte. The LCS is spiked into the sample matrix at a level less than or equal to the mid-point of the calibration curve for each analyte. In cases of test methods with very long lists of analytes, LCSs are prepared with all the target analytes and not just a representative number.
The LCS is carried through the complete preparation and analytical process. The LCS is used to document the bias of the analytical process. LCSs are run at a rate of one per batch. A batch is defined as a set of environmental samples that are prepared and/or analyzed together within the same process using the same lot of reagents.
Results of LCSs are calculated by percent recovery (%R), which is defined as 100 times the measured concentration, divided by the true concentration of the spiked sample.
The following formula is used to calculate percent recovery, where %R is percent recovery; SR is the measured result; and SA is the true result:
%R = SR/SA * 100
Performance limits and control charts are used to determine the acceptability of LCS analyses. Project control limits are specified in Table A7.1.
Laboratory Duplicates
A laboratory duplicate is prepared in the laboratory by splitting aliquots of an LCS. Both samples are carried through the entire preparation and analytical process. LCS duplicates are used to assess precision and are performed at a rate of one per batch. A batch is defined as a set of environmental samples that are prepared and/or analyzed together within the same process using the same lot of reagents.
For most parameters, precision is calculated by the RPD of LCS duplicate results as defined by 100 times the difference (range) of each duplicate set, divided by the average value (mean) of the set. For duplicate results, X1 and X2, the RPD is calculated from the following equation:
RPD = (X1 - X2)/{(X1 + X2)/2} * 100
Performance limits and control charts are used to determine the acceptability of duplicate analyses. Project control limits are specified in Table A7.1.
Matrix spike (MS)
Matrix spikes are prepared by adding a known mass of target analyte to a specified amount of matrix sample for which an independent estimate of target analyte concentration is available.
TSSWCB QAPP 13-07 Section B5
10/15/14 Page 45 of 93
Matrix spikes are used, for example, to determine the effect of the matrix on a method’s recovery efficiency.
Percent recovery of the known concentration of added analyte is used to assess accuracy of the analytical process. The spiking occurs prior to sample preparation and analysis. Spiked samples are routinely prepared and analyzed at a rate of 10% of samples processed, or one per batch whichever is greater. A batch is defined as samples that are analyzed together with the same method and personnel, using the same lots of reagents, not to exceed the analysis of 20 environmental samples. The information from these controls is sample/matrix specific and is not used to determine the validity of the entire batch. The MS is spiked at a level less than or equal to the midpoint of the calibration or analysis range for each analyte. Percent recovery (%R) is defined as 100 times the observed concentration, minus the sample concentration, divided by the true concentration of the spike.
The results from matrix spikes are primarily designed to assess the validity of analytical results in a given matrix and are expressed as percent recovery (%R). The laboratory shall document the calculation for %R. The percent recovery of the matrix spike is calculated using the following equation in which %R is percent recovery, SSR is the observed spiked sample concentration, SR is the sample result, and SA is the reference concentration of the spike added:
%R = (SSR – SR)/SA * 100
Measurement performance specifications for matrix spikes are not specified in this document.
The results are compared to the acceptance criteria as published in the mandated test method. Where there are no established criteria, the laboratory shall determine the internal criteria and document the method used to establish the limits. For matrix spike results outside established criteria, corrective action shall be documented or the data reported with appropriate data qualifying codes.
Method blank
A method blank is a sample of matrix similar to the batch of associated samples (when available) that is free from the analytes of interest and is processed simultaneously with and under the same conditions as the samples through all steps of the analytical procedures, and in which no target analytes or interferences are present at concentrations that impact the analytical results for sample analyses. The method blank is carried through the complete sample preparation and analytical procedure. The method blank is used to document contamination from the analytical process. The analysis of method blanks should yield values less than the LOQ. For very high-level analyses, the blank value should be less than 5% of the lowest value of the batch, or corrective action will be implemented.
Deficiencies, Nonconformances and Corrective Action Related to Quality Control
Deficiencies are defined as unauthorized deviations from procedures documented in the QAPP. Nonconformances are deficiencies which affect data quantity and/or quality and render the data unacceptable or indeterminate. Deficiencies related to QC include but are not limited to field and laboratory QC sample failures.

TSSWCB QAPP 13-07 Section B5
10/15/14 Page 46 of 93
Deficiencies are documented in logbooks, field data sheets, etc., by field or laboratory staff and reported to the cognizant field or laboratory supervisor who will notify the USGS Project Manager. The USGS Project Manager will notify the USGS QAO of the potential nonconformance. The USGS QAO will initiate a NCR to document the deficiency.
The USGS Project Manager, in consultation with USGS QAO (and other affected individuals/organizations), will determine if the deficiency constitutes a nonconformance. If it is determined the activity or item in question does not affect data quality and therefore is not a valid nonconformance, the NCR will be completed accordingly and the NCR closed. If it is determined a nonconformance does exist, the USGS Project Manager in consultation with the USGS QAO will determine the disposition of the nonconforming activity or item and necessary corrective action(s); results will be documented by the USGS QAO by completion of a CAR.
CARs document: root cause(s); impact(s); specific corrective action(s) to address the deficiency; action(s) to prevent recurrence; individual(s) responsible for each action; the timetable for completion of each action; and, the means by which completion of each corrective action will be documented. CARs will be included with quarterly progress reports. In addition, significant conditions (i.e., situations which, if uncorrected, could have a serious effect on safety or on the validity or integrity of data) will be reported to GBRA Project Manager/QAO and the TSSWCB Project Manager immediately both verbally and in writing.

TSSWCB QAPP 13-07 Section B6
10/15/14 Page 47 of 93
B6 INSTRUMENT/EQUIPMENT TESTING, INSPECTION, AND MAINTENANCE
All sampling equipment testing and maintenance requirements are detailed in the USGS’s Quality-Assurance Plan for Water-Quality Activities in the Texas Water Science Center (Appendix 5) (U.S. Geological Survey, 2009). Sampling equipment is inspected and tested upon receipt and is assured appropriate for use. Equipment records are kept on all field equipment and a supply of critical spare parts is maintained.
All laboratory tools, gauges, instrument, and equipment testing and maintenance requirements are contained within laboratory QASM(s).

TSSWCB QAPP 13-07 Section B7
10/15/14 Page 48 of 93
B7 INSTRUMENT CALIBRATION AND FREQUENCY
Field equipment calibration requirements are contained in the TCEQ SWQM Procedures, Volume 1: Physical and Chemical Monitoring Methods for Water, Sediment, and Tissue (RG-415). Post-calibration error limits and the disposition resulting from error are adhered to. Data not meeting post-error limit requirements invalidate associated data collected subsequent to the pre-calibration and are not submitted to the TCEQ SWQMIS.
Detailed laboratory calibrations are contained within the QASM(s).
Field equipment calibration methods and requirements for water-quality sampling are contained in the USGS’s Quality-Assurance Plan for Water-Quality Activities in the Texas Water Science Center (Appendix 5) (U.S. Geological Survey, 2009).

TSSWCB QAPP 13-07 Section B8
10/15/14 Page 49 of 93
B8 INSPECTION/ACCEPTANCE OF SUPPLIES AND CONSUMABLES
No special requirements for acceptance are specified for field sampling supplies and consumables. All field supplies and consumables are accepted upon inspection for breaches in shipping integrity.
All new batches of field and laboratory supplies and consumables received by the USGS laboratories are inspected upon receipt for damage, missing parts, expiration date, and storage and handling requirements. Chemicals, reagents, and standards are logged into an inventory database that documents grade, lot number, and manufacturer, dates received, opened, and emptied. All reagents shall meet ACS grade or equivalent where required. Acceptance criteria are detailed in organization’s SOPs and described in Appendix 5 (U.S. Geological Survey, 2009).
TSSWCB QAPP 13-07 Section B9
10/15/14 Page 50 of 93
B9 NON-DIRECT MEASUREMENTS
This QAPP does not include the use of routine data obtained from non-direct measurement sources.
TSSWCB QAPP 13-07 Section C1
10/15/14 Page 51 of 93
B10 DATA MANAGEMENT
Data Dictionary
Terminology and field descriptions are included in the November 2014 Data Management Reference Guide, or most recent version. A table outlining the entities that will be used when submitting data under this QAPP is included below for the purpose of verifying which entity codes are included in the QAPP.
Name of Monitoring Entity Tag Prefix Submitting Entity
Collecting Entity
Guadalupe-Blanco River Authority TX GB GB
US Geological Survey TX GB GS
GBRA Data Management Process
GBRA field technicians follow protocols to ensure that data collected for this project maintains its integrity and usefulness in determining possible sources of the nitrate-nitrogen in the surface water and ground water in the Plum Creek and Geronimo Creek watersheds. Field data collected at the time of the sampling event is logged on GBRA field data sheets by the GBRA water quality technician, along with notes on sampling conditions. The GBRA field sheet is the responsibility of the GBRA water quality technician and is transported to the GBRA laboratory. The GBRA sample custodian logs the sample in the GBRA Lab Samples Database. Each sample is assigned a separate and distinct sample number. The GBRA field data sheet can be found in Appendix 8.
The GBRA Regional Laboratory Director supervises the GBRA Regional laboratory and reviews the report that is generated when all analyses are complete. Again, the report is reviewed to see that all necessary information is included and that the DQOs have been met. When the report is complete, the lab director signs the report. If the GBRA lab director or QAO designee feel there has been an error or finds that information is missing, the report is returned to the water quality technician for review and tracking to correct the error and generate a corrected copy. The GBRA Project Manager/QAO reviews the data for reasonableness and if errors or anomalies are found the report is returned to the water quality technician for review and tracking to correct the error. After review for reasonableness the data is cross-checked to the field data sheets by the GBRA Project Manager/QAO/Data Manager. If at any time errors are identified, the laboratory and water quality databases are corrected.
If errors are identified, the GBRA Project Manager/QAO (and other affected individuals/organizations), will determine if the error constitutes a nonconformance. If it is determined a nonconformance does exist, the GBRA Project Manager/QAO will determine the disposition of the nonconforming activity or item and necessary corrective action(s); results will be documented by the GBRA Project Manager/QAO by completion of a CAR.
CARs document: root cause(s); impact(s); specific corrective action(s) to address the deficiency; action(s) to prevent recurrence; individual(s) responsible for each action; the timetable for
TSSWCB QAPP 13-07 Section C1
10/15/14 Page 52 of 93
completion of each action; and, the means by which completion of each corrective action will be documented. CARs will be included with data summary report that accompanies the data submittal. In addition, significant conditions (i.e., situations which, if uncorrected, could have a serious effect on safety or on the validity or integrity of data) will be reported to the TSSWCB Project Manager immediately both verbally and in writing.
The GBRA Project Manager/QAO/Data Manager is responsible for electronically transmitting the data to the TCEQ Data Management and Analysis Team for upload to SWQMIS. A completed Data Summary, as described in the most recent version of TCEQ SWQM Data Management Reference Guide, will be submitted with each data submittal. If errors are found after the TCEQ review, those errors are corrected by the GBRA Project Manager/QAO/Data Manager, logged in a data correction log and all participants are notified.
The following flow diagram outlines the path that data generated by GBRA personnel takes in the field tasks:

TSSWCB QAPP 13-07 Section C1
10/15/14 Page 53 of 93
Field data collected
Field data sheets
Lab database
QC review by GBRA Project Manager/QAO/Data Manager
Report generation
Data checked for reasonableness by GBRA Project
Manager/QAO/Data Manager
Data transferred to GBRA water quality databases
Data verification to field data sheets by GBRA Project
Manager/QAO/Data Manager
ASCII file format created; Tag no. assigned in
sequence
ASCII file (event and results) and data checklist sent to TCEQ SWQMIS
Manager
ASCII file (event and results) and data checklist sent to SWQMIS test site
to check for errors
TSSWCB QAPP 13-07 Section C1
10/15/14 Page 54 of 93
Data Errors and Loss
The GBRA Regional Laboratory Director supervises the GBRA Regional laboratory and reviews the report that is generated when all analyses are complete. The report is reviewed to see that all necessary information is included and that the DQOs have been met. When the report is complete, the lab director signs the report. If the GBRA lab director or QAO designee feel there has been an error or finds that information is missing, the report is returned to the analyst for review and tracking to correct the error and generate a corrected copy. The GBRA Project Manager/QAO reviews the data for reasonableness and if errors or anomalies are found the report is returned to the laboratory director for review and tracking to correct the error. After review for reasonableness the data is cross-checked to the analysis logs by the GBRA Project Manager/QAO. If at any time errors are identified, the laboratory and water quality databases are corrected. The GBRA Project Manager/QAO is responsible for electronically transmitting the data to the TCEQ Data Management and Analysis Team for upload to SWQMIS. A completed Data Summary, as described in the most recent version of TCEQ SWQM Data Management Reference Guide, will be submitted with each data submittal. If errors are found after the TCEQ review, those errors are corrected by the GBRA Project Manager/QAO, logged in a data correction log and all participants are notified.
To minimize the potential for data loss, the databases, both lab and server files are backed up nightly and copies of the files are stored off-site weekly. If the laboratory database or network server fails, the backup files can be accessed to restore operation or replace corrupted files.
Record Keeping and Data Storage
After data is collected and recorded on field data sheets by GBRA, the data sheets are filed for review and use later. These files are kept in paper form for a minimum of one year and then scanned into the GBRA ITRAX for permanent record.
The data reports that are generated are reviewed by the GBRA laboratory director and signed. They are then given to the GBRA Project Manager/QAO for verification. If an anomaly or error is found the report is marked and returned to the field technician for review, verification and correction, if necessary. These reports may or may not be kept in paper form since the reports can be regenerated from the lab database at any time. If kept, the paper form is kept for a minimum of one year.
The GBRA laboratory database is housed on the laboratory computer and is backed up on the network server nightly. A back up copy of the network server files is made every Monday and that copy is stored off-site at a protected location. The GBRA network administrator is responsible for the servers and back up generation.
After data is electronically submitted to the TCEQ SWQMIS, the file that has been created is kept on the network server permanently. The network server is backed up nightly.
The GBRA ITRAX is part of the network that is backed up each evening. The GBRA Records Manager is the custodian of these files.
TSSWCB QAPP 13-07 Section C1
10/15/14 Page 55 of 93
Data Handling, Hardware, and Software Requirements
The laboratory database is housed on a GBRA server and backed up each evening. The laboratory database uses Sequel 2000. The systems are operating in Windows 2010 and any additional software needed for word processing, spreadsheet or presentations uses Microsoft Office 2010.
Information Resource Management Requirements
Data will be managed in accordance with the TCEQ SWQM Data Management Reference Guide, GIS Policy (TCEQ OPP 8.11), GPS Policy (TCEQ OPP 8.12) and applicable GBRA information resource management policies. The personnel collecting data for this project do not create TCEQ certified locational data using Global Positioning System (GPS) equipment. GPS equipment may be used as a component of the information required by the Station Location (SLOC) request process, but the TCEQ staff is responsible for creating the certified locational data that will ultimately be entered into the TCEQ SWQMIS. Any information developed for this project using a Geographic Information System (GIS) will be used solely to meet deliverable requirements and will not be submitted to the TCEQ as a certified data set.
USGS Data Management Process

TSSWCB QAPP 13-07 Section C1
10/15/14 Page 56 of 93
USGS field technicians follow protocols to ensure that data collected for this project maintains its integrity and usefulness in determining possible sources of the nitrate-nitrogen in the surface water and ground water in the Plum Creek and Geronimo Creek watersheds. Field data collected at the time of the sampling event is logged onto USGS surface-water quality field forms (Appendix 9) or USGS groundwater-quality field forms (Appendix 10) by USGS water-quality field technicians along with notes on sampling conditions. The USGS field sheets are the responsibility of the USGS water-quality technicians and are transported to the USGS South Texas Program Office. The USGS sample custodian then logs each sample into the USGS’s NWIS database. Each water-quality sample is assigned a separate and distinct record number.
The USGS Data Management process is described in Appendix 4, USGS Quality Management Plan for Environmental Projects (U.S. Geological Survey, 2010) and Appendix 5, TWSC Quality-Assurance Plan for Water-quality Activities in Texas (U.S. Geological Survey, 2009). The flow chart below shows how data is handled by the USGS from sampling to data reporting: C1 ASSESSMENTS AND RESPONSE ACTIONS
Field data and water-quality samples collected and
processed
Field data sheets are filled out
Field data updated to the NWIS database
Data returned from the labs. Watlist report generated.
QC review by USGS Data Managers. Reruns requested,
if needed
Data approved by USGS QAO
Approved data sent to GBRA Project
Manager/Data Manager for submission to TCEQ
ASCII file format created; Tag no. assigned in
sequence
Water-quality samples are shipped to the appropriate lab
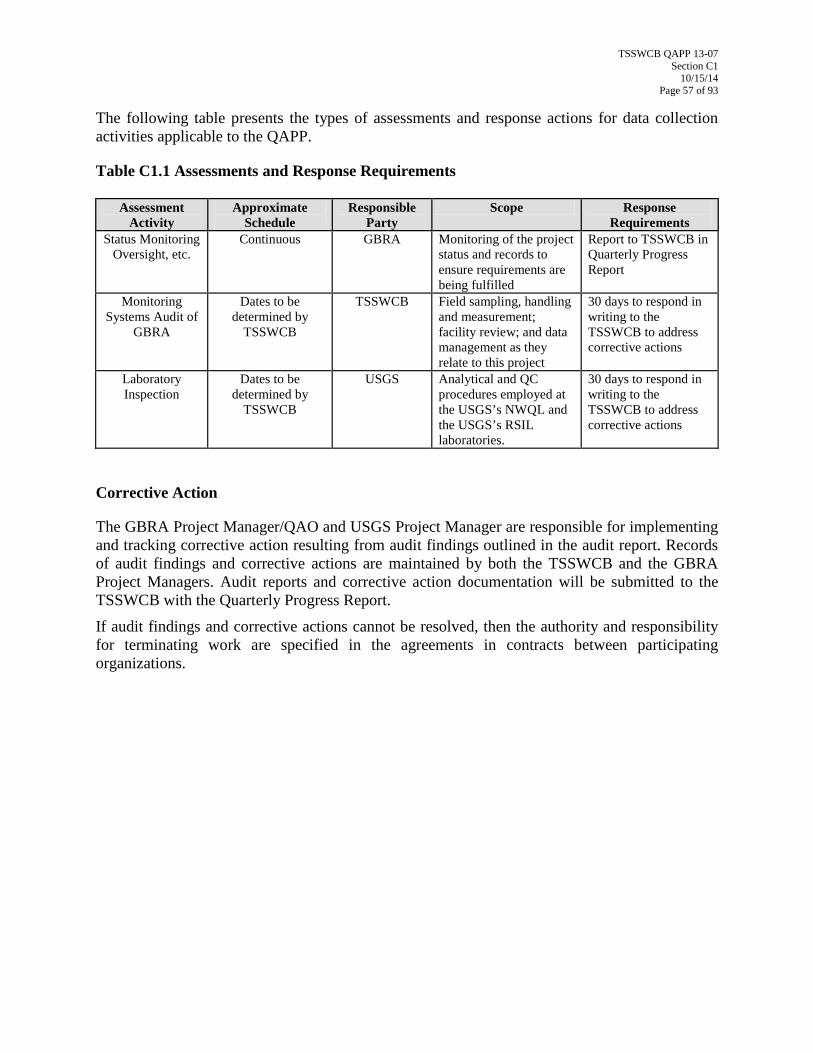
TSSWCB QAPP 13-07 Section C1
10/15/14 Page 57 of 93
The following table presents the types of assessments and response actions for data collection activities applicable to the QAPP.
Table C1.1 Assessments and Response Requirements
Assessment Activity
Approximate Schedule
Responsible Party
Scope Response Requirements
Status Monitoring Oversight, etc.
Continuous GBRA Monitoring of the project status and records to ensure requirements are being fulfilled
Report to TSSWCB in Quarterly Progress Report
Monitoring Systems Audit of
GBRA
Dates to be determined by
TSSWCB
TSSWCB Field sampling, handling and measurement; facility review; and data management as they relate to this project
30 days to respond in writing to the TSSWCB to address corrective actions
Laboratory Inspection
Dates to be determined by
TSSWCB
USGS Analytical and QC procedures employed at the USGS’s NWQL and the USGS’s RSIL laboratories.
30 days to respond in writing to the TSSWCB to address corrective actions
Corrective Action
The GBRA Project Manager/QAO and USGS Project Manager are responsible for implementing and tracking corrective action resulting from audit findings outlined in the audit report. Records of audit findings and corrective actions are maintained by both the TSSWCB and the GBRA Project Managers. Audit reports and corrective action documentation will be submitted to the TSSWCB with the Quarterly Progress Report.
If audit findings and corrective actions cannot be resolved, then the authority and responsibility for terminating work are specified in the agreements in contracts between participating organizations.

TSSWCB QAPP XX-XX Section C2
10/15/14 Page 58 of 93
C2 REPORTS TO MANAGEMENT
Reports to GBRA Project Management
Equipment calibration logs for field equipment contain QC information so that this information can be reviewed by the GBRA Project Manager/QAO. After review, if the GBRA Project Manager/QAO finds no anomalies or questionable data, the process of data transmittal to TCEQ begins. Project status, assessments and significant QA issues will be dealt with by the GBRA Project Manager/QAO who will determine whether it will be included in reports to the TSSWCB Project Manager.
Reports to TSSWCB
All reports detailed in this section are contract deliverables and are transferred to the TSSWCB in accordance with contract requirements.
Quarterly Progress Report - Summarizes the GBRA and USGS’s activities for each task; reports monitoring status, problems, delays, and corrective actions; and outlines the status of each task’s deliverables.
Monitoring Systems Audit Report and Response - Following any audit performed by the GBRA or USGS, a report of findings, recommendations and response is sent to the TSSWCB in the quarterly progress report.

TSSWCB QAPP 13-07 Section D1
10/15/14 Page 59 of 93
D1 DATA REVIEW, VERIFICATION, AND VALIDATION
For the purposes of this document, the term verification refers to the data review processes used to determine data completeness, correctness, and compliance with technical specifications contained in applicable documents (i.e., QAPPs, SOPs, QASMs, analytical methods). Validation refers to a specific review process that extends the evaluation of a data set beyond method and procedural compliance (i.e., data verification) to determine the quality of a data set specific to its intended use.
All field and laboratory will be reviewed and verified for integrity and continuity, reasonableness, and conformance to project requirements, and then validated against the project objectives and measurement performance specifications which are listed in Section A7. Only those data which are supported by appropriate QC data and meet the measurement performance specifications defined for this project will be considered acceptable, and will be reported to TCEQ SWQMIS.

TSSWCB QAPP 13-07 Section D2
10/15/14 Page 60 of 93
D2 VERIFICATION AND VALIDATION METHODS
All field and laboratory data will be reviewed, verified and validated to ensure they conform to project specifications and meet the conditions of end use as described in Section A7 of this document.
Data review, verification, and validation will be performed using self-assessments and peer and management review as appropriate to the project task. The data review tasks to be performed by field and laboratory staff are listed in the first two sections of Table D.2, respectively. Potential errors are identified by examination of documentation and by manual examination of corollary or unreasonable data. If a question arises or an error is identified, the manager of the task responsible for generating the data is contacted to resolve the issue. Issues which can be corrected are corrected and documented. If an issue cannot be corrected, the task manager consults with higher level project management to establish the appropriate course of action, or the data associated with the issue are rejected. Field and laboratory reviews, verifications, and validations are documented.
After the field and laboratory data are reviewed, another level of review is performed once the data are combined into a data set. This review step, as specified in Table D2.1, is performed by the GBRA Project Manager/QAO/Data Manager. Data review, verification, and validation tasks to be performed on the data set include, but are not limited to, the confirmation of laboratory and field data review, evaluation of field QC results, additional evaluation of anomalies and outliers, analysis of sampling and analytical gaps, and confirmation that all parameters and sampling sites are included in the QAPP.
Another element of the data validation process is consideration of any findings identified during the monitoring systems audit conducted by the TSSWCB QAO. Any issues requiring corrective action must be addressed, and the potential impact of these issues on previously collected data will be assessed. After the data are reviewed and documented, the GBRA Project Manager/QAO/Data Manager validates that the data meet the DQOs of the project and are suitable for reporting to TCEQ SWQMIS.
If any requirements or specifications of this project are not met, based on any part of the data review, the responsible party should document the nonconforming activities (with a CAR) and submit the information to the GBRA Project Manager/QAO/Data Manager with the data. This information is communicated to the TSSWCB Project Manager by the GBRA Project Manager. The data is not transmitted to TCEQ SWQMIS.

TSSWCB QAPP 13-07 Section D2
10/15/14 Page 61 of 93
Table D2.1 Data Review Tasks
Field Data Review Responsibility Field data reviewed for conformance with data collection, sample handling and COC, analytical and QC requirements
GBRA Field Technicians
Post-calibrations checked to ensure compliance with error limits GBRA Field Technicians
Field data calculated, reduced, and transcribed correctly GBRA Project Manager Field data reviewed for conformance with data collection, and QC requirements USGS Field Technicians
Post-calibrations checked to ensure compliance with error limits USGS Field Technicians
Field data calculated, reduced, and transcribed correctly USGS Project Manager Laboratory Data Review Responsibility
Laboratory data reviewed for conformance with data collection, sample handling and COC, analytical and QC requirements to include documentation, holding times, sample receipt, sample preparation, sample analysis, project and program QC results, and reporting
USGS QAOs
Laboratory data calculated, reduced, and transcribed correctly USGS QAOs and USGS Project Manager
LOQs consistent with requirements for AWRLs USGS QAOs and USGS Project Manager Analytical data documentation evaluated for consistency, reasonableness and/or improper practices
USGS QAOs and USGS Project Manager
Analytical QC information evaluated to determine impact on individual analyses
USGS QAOs and USGS Project Manager
All laboratory samples analyzed for all parameters USGS QAOs and USGS Project Manager Data Set Review Responsibility
The test report has all required information as described in Section A9 of the QAPP GBRA and USGS Project Managers
Confirmation that field and lab data have been reviewed GBRA and USGS Project Managers Data set (to include field and laboratory data) evaluated for reasonableness and if corollary data agree
GBRA and USGS Project Managers
Outliers confirmed and documented GBRA and USGS Project Managers Field QC acceptable (e.g., field splits and trip, field and equipment blanks) GBRA and USGS Field Technicians
Sampling and analytical data gaps checked and documented
GBRA and USGS Project Managers
Verification and validation confirmed. Data meets conditions of end use and are reportable
GBRA and USGS Project Managers
TSSWCB QAPP 13-07 Section D3
10/15/14 Page 62 of 93
D3 RECONCILIATION WITH USER REQUIREMENTS
Data produced in this project, and data collected by other organizations (i.e., USGS, TCEQ, etc.), will be analyzed and reconciled with project data-quality requirements. Data meeting project requirements will be used in the implementation and adaptive management of the Plum Creek and Geronimo and Alligator Creeks WPPs and will be submitted to TCEQ in SWQMIS for possible use in the development of the biennial Texas Integrated Report for Clean Water Act Sections 305(b) and 303(d).

TSSWCB QAPP 13-07 Refernces 10/15/14
Page 63 of 93
E1 REFERENCES
Cunningham, W.L., and Schalk, C.W., comps., 2011, Groundwater technical procedures of the U.S. Geological Survey: U.S. Geological Survey Techniques and Methods 1–A1, 151 p. (available only online at http://pubs.usgs.gov/tm/1a1/)
Texas Agri-Life Extension, 2012, Geronimo and Alligator Creeks Watershed Protection Plan: Prepared for the Geronimo and Alligator Creeks Watershed Protection Plan by Ward Ling and Mark McFarland (Texas AgriLife Extension Service), Debbie Magin (Guadlupe-Blanco River Authority), and Loren Warrick and Aaron Wendt ( Texas State Soil and Water Conservation Board), 174 p. Accessed April 14, 2014 at http://www.geronimocreek.org/documents/wpp/FinalDraftGACWPP.pdf
Texas Commission on Environmental Quality (TCEQ), 2012, 2012 Texas Integrated Report of Surface Water Quality for Clean Water Act Sections 305(b) and 303(d), variably paged, Accessed on August 28, 2014 at http://www.tceq.texas.gov/waterquality/assessment/waterquality/assessment/12twqi/twqi12.
Turnipseed, D.P., and Sauer, V.B., 2010, Discharge measurements at gaging stations: U.S. Geological Survey Techniques and Methods, Book 3, Chapter A8, 87 p. (Also available at http://pubs.usgs.gov/tm/tm3-a8/)
U.S. Geological Survey, variously dated, National Field Manual for the Collection of Water-Quality Data: Techniques of Water-Resources Investigations, Book 9, Chapters A1-A9, accessed on April 14, 2014 at http://pubs.water.usgs.gov/twri9A
U.S. Geological Survey, 2009, USGS TWSC Quality-Assurance Plan for Water-quality Activities in the Texas Water Science Center, Compiled by Susan Aragon-Long, Stephanie Marr, Mike Canova, Cary Carmen, Kent Becher, and Tim Oden: Accessed at http://tx.cr.usgs.gov/field/plans/MASTER_TWSC_QAP_FINAL.pdf, on April 11, 2014.
U.S. Geological Survey, 2014, USGS Water Mission Area Quality Management Plan for Environmental Projects: Prepared for USEPA, Region VI. Accessed October 28, 2014 at http://tx.cr.usgs.gov/QMP14_USGS_final.doc.

TSSWCB QAPP 13-07appendix 1 10/15/14
Page 64 of 93
Appendix 1 - Example Letter to Document Adherence to the QAPP
TO: (name) (organization) FROM: (name) (organization) Please sign and return this form by (date) to: (address) I acknowledge receipt of the referenced document(s). I understand the document(s) describe quality assurance, quality control, data management and reporting, and other technical activities that must be implemented to ensure the results of work performed will satisfy stated performance criteria. Signature Date Copies of the signed forms should be sent by the GBRA to the TSSWCB Project Manager within 60 days of EPA approval of the QAPP.
TSSWCB QAPP 13-07ppendix 2 10/15/14
Page 65 of 93
Appendix 2 - Sampling Process Design and Monitoring Schedule
Sample Design Rationale The intent of the sample design of this project is to develop isotopic signatures of nitrate-nitrogen from each sample type (SW, GW, SPR, PRE, WW) to identify the most likely sources of elevated nitrate-nitrogen in Plum Creek and Geronimo Creek watersheds. Under their direction, the TSSWCB and GBRA have been tasked with providing data to characterize water quality conditions in support of the 305(b) assessment, and to identify significant long-term water-quality trends. Achievable water-quality objectives and priorities and the identification of water-quality issues were used to develop the workplan, which are in accord with available resources. As part of the PCWP and GCWP Steering Committee process, the TSSWCB and GBRA coordinate closely with other participants to ensure a comprehensive water monitoring strategy within the watershed.
Site Selection Criteria This data collection effort involves monitoring targeted water quality sites, using procedures that are consistent with the TCEQ SWQM program, for the purpose of data entry into the SWQMIS database maintained by the TCEQ. To this end, some general guidelines are followed when selecting sampling sites, as basically outlined below, and discussed thoroughly in the TCEQ SWQM Procedures, Volume 1 (RG-415). Overall consideration is given to accessibility and safety. All monitoring activities have been developed in coordination with the PCWP and GCWP Steering Committees and with the TSSWCB.
1. Stream sites will be selected so that samples can be safely collected from the cross section of flow. If there is not sufficient flow to collect across the cross section, then a grab sample may be collected at the centroid of flow. The centroid is defined as the midpoint of that portion of stream width that contains 50 percent of the total flow. Sites should be selected that best represent the stream segment and not an unusual condition or contaminant source. Backwater areas or eddies should be avoided when selecting a stream site.
2. Because historical water-quality data can be very useful in assessing use attainment or impairment, those historical sites were selected that are on current or past monitoring schedules.
3. Routine monitoring sites were selected to bracket sources of pollution, influence of tributaries, changes in land uses, and hydrological modifications.
4. Sites should be accessible. When possible, stream sites should have a USGS stream flow gage. If not, flow measurements will be made during routine and targeted monitoring visits.
Monitoring Sites
The Monitoring Table for this project is presented on the following pages:
Explanation:
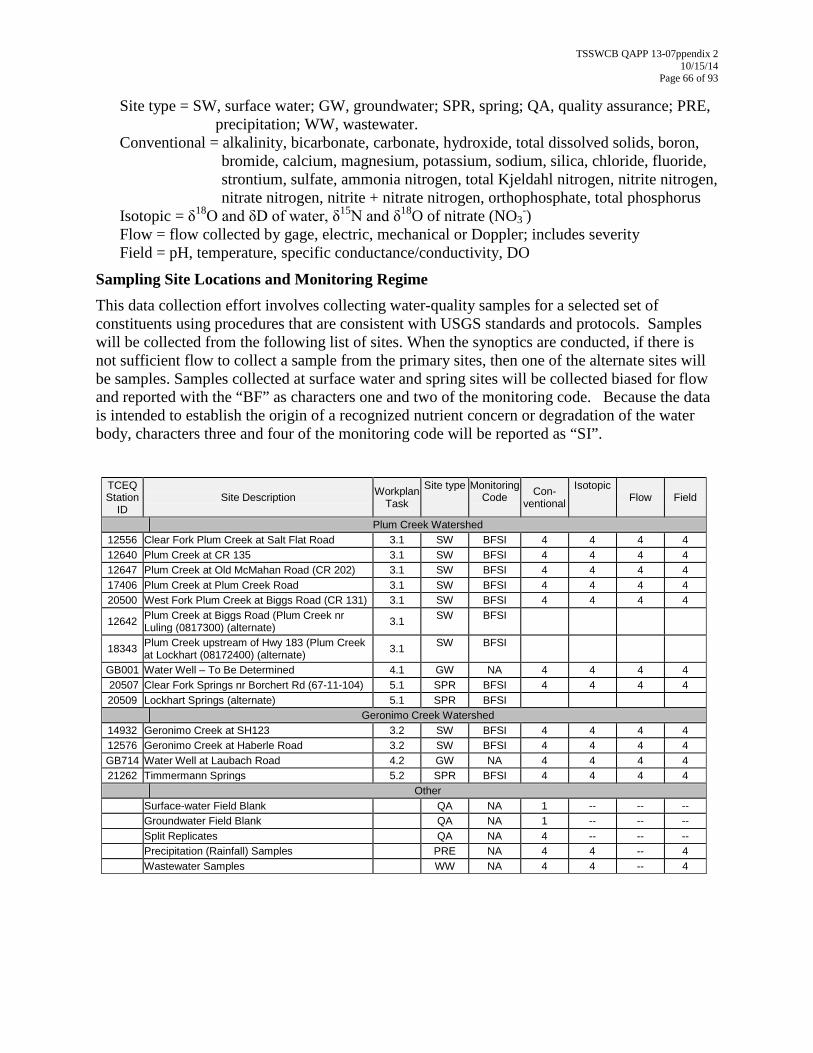
TSSWCB QAPP 13-07ppendix 2 10/15/14
Page 66 of 93
Site type = SW, surface water; GW, groundwater; SPR, spring; QA, quality assurance; PRE, precipitation; WW, wastewater.
Conventional = alkalinity, bicarbonate, carbonate, hydroxide, total dissolved solids, boron, bromide, calcium, magnesium, potassium, sodium, silica, chloride, fluoride, strontium, sulfate, ammonia nitrogen, total Kjeldahl nitrogen, nitrite nitrogen, nitrate nitrogen, nitrite + nitrate nitrogen, orthophosphate, total phosphorus
Isotopic = δ18O and δD of water, δ15N and δ18O of nitrate (NO3-)
Flow = flow collected by gage, electric, mechanical or Doppler; includes severity Field = pH, temperature, specific conductance/conductivity, DO
Sampling Site Locations and Monitoring Regime This data collection effort involves collecting water-quality samples for a selected set of constituents using procedures that are consistent with USGS standards and protocols. Samples will be collected from the following list of sites. When the synoptics are conducted, if there is not sufficient flow to collect a sample from the primary sites, then one of the alternate sites will be samples. Samples collected at surface water and spring sites will be collected biased for flow and reported with the “BF” as characters one and two of the monitoring code. Because the data is intended to establish the origin of a recognized nutrient concern or degradation of the water body, characters three and four of the monitoring code will be reported as “SI”.
TCEQ Station
ID Site Description Workplan
Task
Site type Monitoring Code Con-
ventional
Isotopic Flow Field
Plum Creek Watershed 12556 Clear Fork Plum Creek at Salt Flat Road 3.1 SW BFSI 4 4 4 4 12640 Plum Creek at CR 135 3.1 SW BFSI 4 4 4 4 12647 Plum Creek at Old McMahan Road (CR 202) 3.1 SW BFSI 4 4 4 4 17406 Plum Creek at Plum Creek Road 3.1 SW BFSI 4 4 4 4 20500 West Fork Plum Creek at Biggs Road (CR 131) 3.1 SW BFSI 4 4 4 4
12642 Plum Creek at Biggs Road (Plum Creek nr Luling (0817300) (alternate) 3.1 SW BFSI
18343 Plum Creek upstream of Hwy 183 (Plum Creek at Lockhart (08172400) (alternate) 3.1 SW BFSI
GB001 Water Well – To Be Determined 4.1 GW NA 4 4 4 4 20507 Clear Fork Springs nr Borchert Rd (67-11-104) 5.1 SPR BFSI 4 4 4 4 20509 Lockhart Springs (alternate) 5.1 SPR BFSI
Geronimo Creek Watershed 14932 Geronimo Creek at SH123 3.2 SW BFSI 4 4 4 4 12576 Geronimo Creek at Haberle Road 3.2 SW BFSI 4 4 4 4 GB714 Water Well at Laubach Road 4.2 GW NA 4 4 4 4 21262 Timmermann Springs 5.2 SPR BFSI 4 4 4 4
Other Surface-water Field Blank QA NA 1 -- -- -- Groundwater Field Blank QA NA 1 -- -- -- Split Replicates QA NA 4 -- -- -- Precipitation (Rainfall) Samples PRE NA 4 4 -- 4 Wastewater Samples WW NA 4 4 -- 4

TSSWCB QAPP 13-07 Appendix 3
10/15/14 Page 67 of 93
Appendix 3 - USGS Protocols for collecting water-quality samples (National Field Manual). This document can be accessed online at: http://water.usgs.gov/owq/FieldManual/

TSSWCB QAPP 13-07 Appendix 4
10/15/14 Page 68 of 93
Appendix 4 - USGS Water Discipline Quality Management Plan for Environmental Projects. This document can be accessed online at: http://tx.cr.usgs.gov/QMP14_USGS_final.doc

TSSWCB QAPP 13-07 Appendix 5
10/15/14 Page 69 of 93
Appendix 5 - TWSC Quality-Assurance Plan for Water-Quality Activities in the Texas Water Science Center. This document can be accessed at: http://tx.cr.usgs.gov/field/plans/MASTER_TWSC_QAP_FINAL.pdf

TSSWCB QAPP 13-07 Appendix 6
10/15/14 Page 70 of 93
Appendix 6 - Data Summary Report
Data Summary Data Information
Data Source: Date Submitted: Tag_id Range: Date Range:
Comments Please explain in the space below any data discrepancies including:
• Inconsistencies with AWRL specifications; • Failures in sampling methods and/or laboratory procedures that resulted in
data that could not be reported to the TSSWCB; and • Other discrepancies.
- - - - - - - Data Manager: Date:

TSSWCB QAPP 13-07 Appendix 7
10/15/14 Page 71 of 93
Appendix 7 - USGS Protocols for collecting discharge measurements at gaging locations. This document can be accessed at: http://pubs.usgs.gov/tm/tm3-a8/
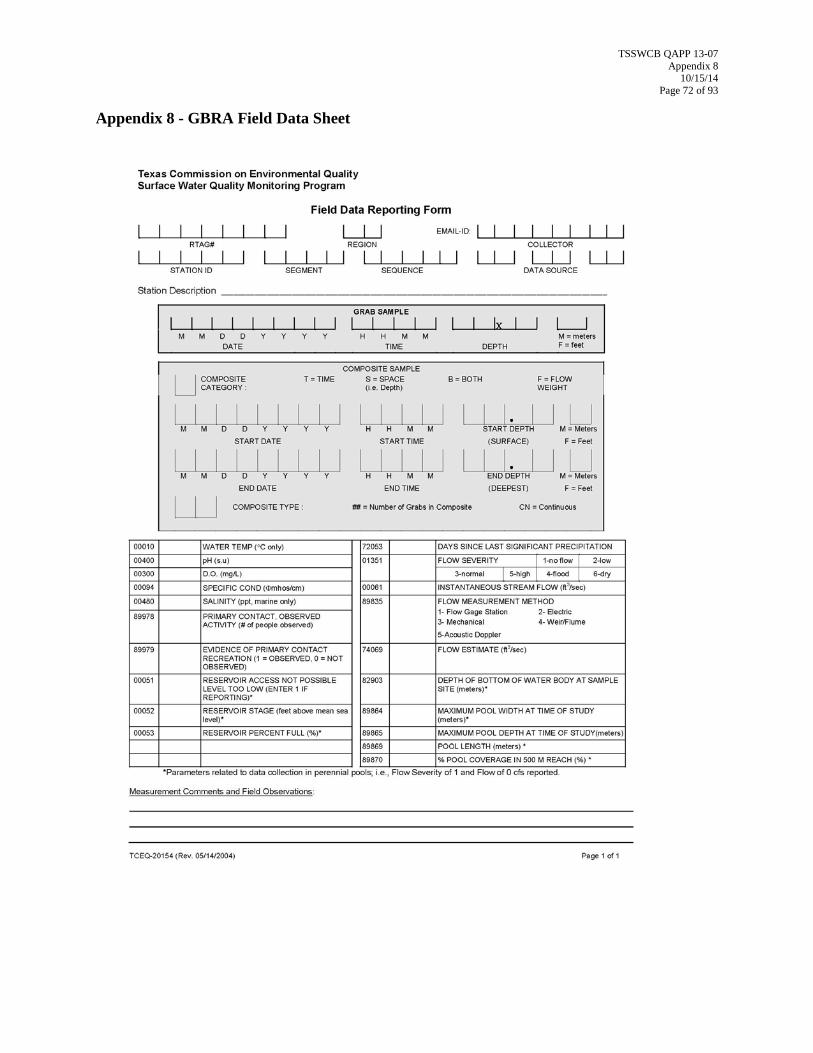
TSSWCB QAPP 13-07 Appendix 8
10/15/14 Page 72 of 93
Appendix 8 - GBRA Field Data Sheet

TSSWCB QAPP 13-07 Appendix 9
10/15/14 Page 73 of 93
Appendix 9 USGS Surface-Water Quality Field Form
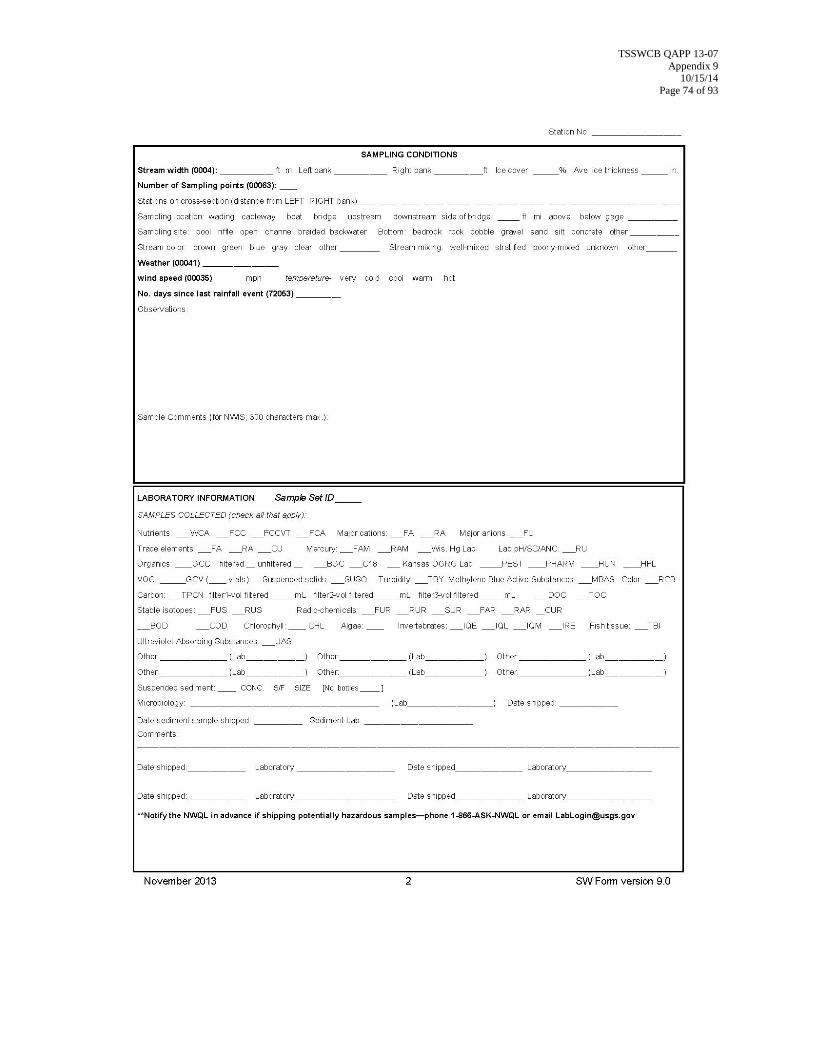
TSSWCB QAPP 13-07 Appendix 9
10/15/14 Page 74 of 93

TSSWCB QAPP 13-07 Appendix 9
10/15/14 Page 75 of 93

TSSWCB QAPP 13-07 Appendix 9
10/15/14 Page 76 of 93

TSSWCB QAPP 13-07 Appendix 9
10/15/14 Page 77 of 93

TSSWCB QAPP 13-07 Appendix 9
10/15/14 Page 78 of 93
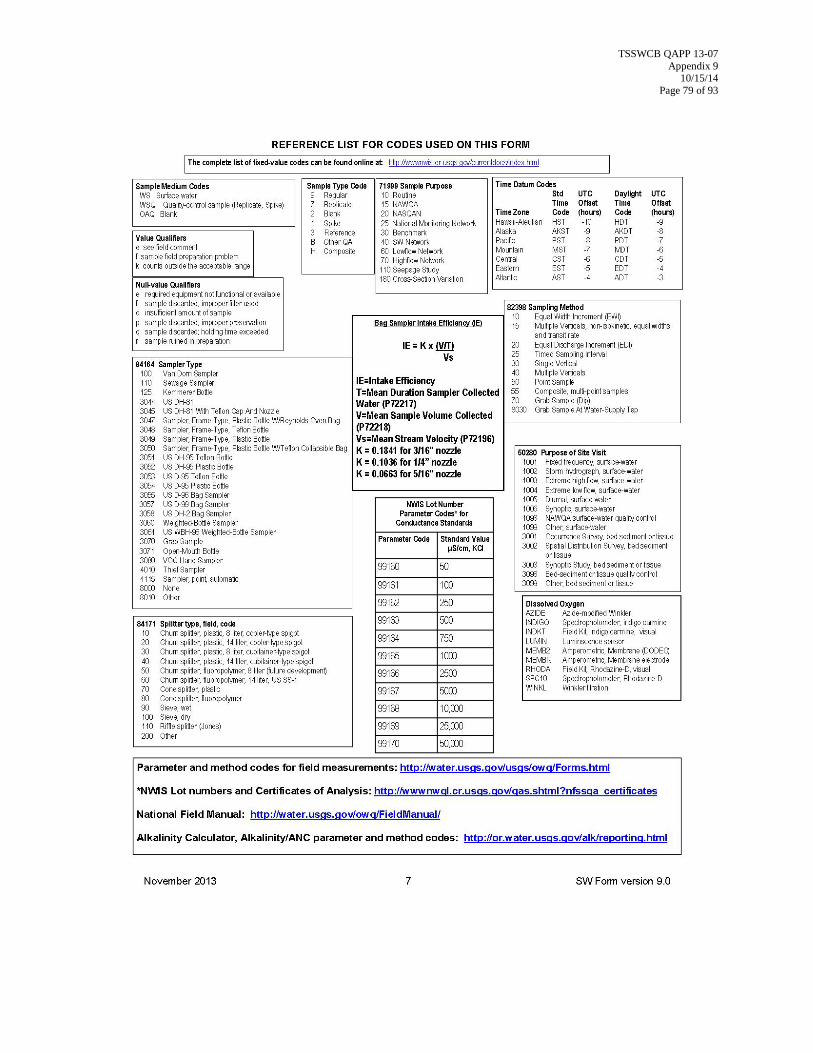
TSSWCB QAPP 13-07 Appendix 9
10/15/14 Page 79 of 93

TSSWCB QAPP 13-07 Appendix 10
10/15/14 Page 80 of 93
Appendix 10 USGS Groundwater Quality Field Form

TSSWCB QAPP 13-07 Appendix 10
10/15/14 Page 81 of 93

TSSWCB QAPP 13-07 Appendix 10
10/15/14 Page 82 of 93
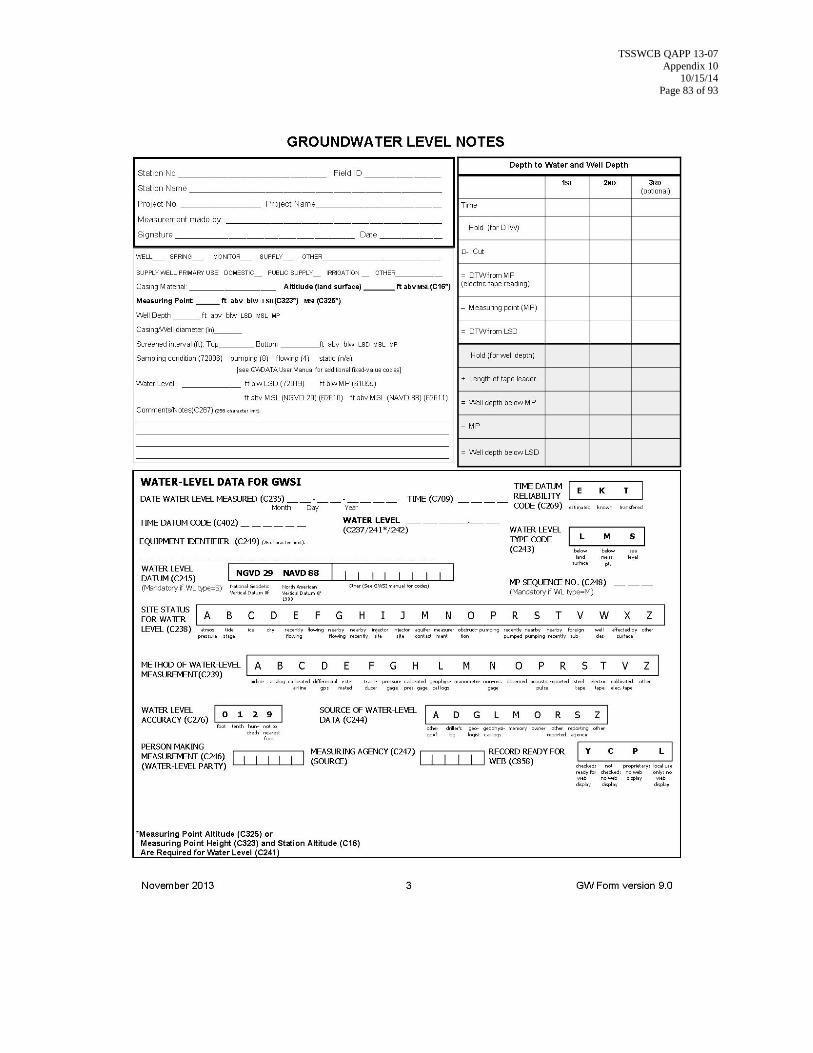
TSSWCB QAPP 13-07 Appendix 10
10/15/14 Page 83 of 93

TSSWCB QAPP 13-07 Appendix 10
10/15/14 Page 84 of 93
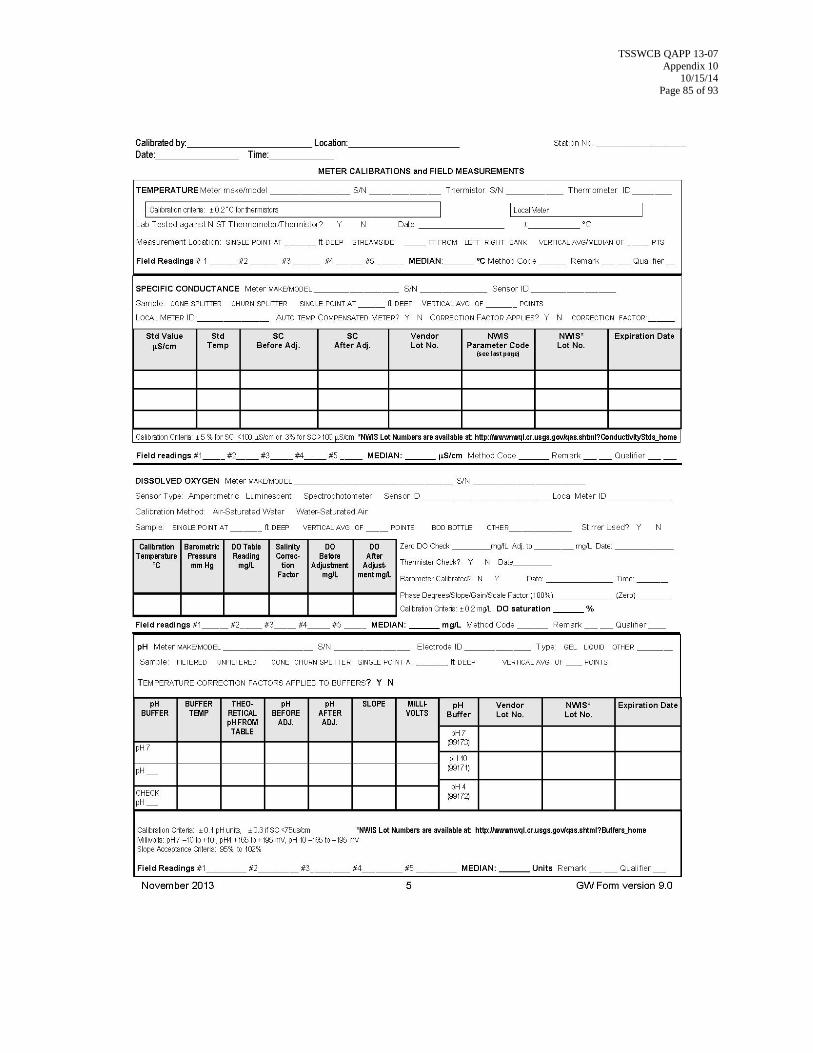
TSSWCB QAPP 13-07 Appendix 10
10/15/14 Page 85 of 93

TSSWCB QAPP 13-07 Appendix 10
10/15/14 Page 86 of 93

TSSWCB QAPP 13-07 Appendix 10
10/15/14 Page 87 of 93

TSSWCB QAPP 13-07 Appendix 10
10/15/14 Page 88 of 93

TSSWCB QAPP 13-07 Appendix 10
10/15/14 Page 89 of 93

TSSWCB QAPP 13-07 Appendix 11
10/15/14 Page 90 of 93
Appendix 11 GBRA Chain of Custody Form

TSSWCB QAPP 13-07 Appendix 12
10/15/14 Page 91 of 93
Appendix 12 USGS Chain of Custody Form for NWQL

TSSWCB QAPP 13-07 Appendix 13
10/15/14 Page 92 of 93
Appendix 13 USGS Chain of Custody Form for RSIL

TSSWCB QAPP 13-07 Appendix 14
10/15/14 Page 93 of 93
Appendix 14 - USGS geospatial requirements/use in reports The final USGS report summarizing the results of the investigation will include geospatial data available from various sources that may be used for cartographic purposes. These sources include local, regional, state, and federal organizations. Maps, figures, and metadata developed for the report will follow the guidelines established by the Federal Geographic Data Committee (FGDC). These guidelines are available at http://fgdc.gov/. The geospatial data used in the report may include, but are not limited to, land use, precipitation, soil type, ecoregion, geology, TCEQ monitoring locations, TCEQ permitted outfall, GBRA monitoring locations, USGS gaging locations, city/county/state boundaries, stream hydrology, locations of wells, springs, reservoirs and lakes, roads, watershed boundaries, river basins, railroads, and recreational areas. This data may be obtained from the USGS, Texas Natural Resources Information System (TNRIS), the Texas Water Development Board (TWDB), or other agencies. The TNRIS data is available at http://www.tnris.org/get-data and the TWDB data is available at http://www.twdb.state.tx.us/mapping/gisdata.asp.