Clean - Rhode Island Island Industry Report 2016.pdfClean Energy Jobs are ... particularly regarding...
30
1
Transcript of Clean - Rhode Island Island Industry Report 2016.pdfClean Energy Jobs are ... particularly regarding...

1

2
Clean Energy Jobs are on the Rise in Rhode Island, Expectations are Exceeded The Rhode Island Office of Energy Resources (OER) and the Executive Office of Commerce are excited by the results in the 2016 Rhode Island Clean Energy Jobs Report.
Governor Gina M. Raimondo and the General Assembly have taken bold steps to craft legislation and implement policy that will result in continued growth throughout Rhode Island’s burgeoning clean energy sector. The 2016 Clean Energy Jobs Report shows that growth in sector employment has outpaced initial expectations. Clean energy employment increased by 40 percent over 2015 levels and now accounts for nearly 14,000 jobs across Rhode Island. These workers and their employers are engaged in a diverse and dynamic range of activities and technologies that include energy efficiency, renewable generation, renewable heating and cooling, and alternative transportation. This remarkable growth suggests that clean energy technologies are catalysts for new job creation, but also are transforming and providing new streams of revenue for traditional industry sectors, such as the building trades. The state’s largest clean energy segment is energy efficiency, which added 2,900 new jobs to the Rhode Island economy during the past year. With some of the nation’s most robust and innovative energy efficiency policies and programs, Rhode Island is demonstrating that the benefits of least cost procurement go beyond reductions in energy consumption and costs, and include significant economic development and job growth opportunities. Moreover, the Report finds that renewable energy jobs grew by 84 percent over 2015 employment levels. These employment gains were partially driven by the state’s first-in-the-nation offshore wind farm, as well as an expansion of the solar industry in Rhode Island. Proposed legislation designed to expand renewable energy opportunities throughout our economy, such as those included in the Governor’s FY17 State Budget proposal to the General Assembly, will support further clean energy employment growth in the coming years. However, there is still a great deal of work to be done. Rhode Island is home to a small but important clean energy innovation sector that is largely comprised of pre-commercial smart grid and energy management firms. These companies, largely located in and around Providence, attract millions in capital investment to the state and represent an opportunity for Rhode Island to attract more innovators to work on the development of critical next-generation technologies. In addition to supporting this ecosystem of innovation activity, the state is prioritizing technology commercialization and new business creation at the University of Rhode Island (URI), Rhode Island College, and the Newport Naval Station, particularly regarding the nexus of ocean and marine science and renewable energy. The Commerce Corporation has also utilized economic
3
development incentives created last year to spur the clean energy sector, awarding an Innovation Voucher to a wind energy company to partner with URI in conducting new R&D, among other projects. The clean energy economy in Rhode Island is still comprised predominately of small businesses. Many of those businesses – in fact, eight in ten companies – reported difficulty hiring qualified applicants for open positions. It is clear that these employment gaps exist and need to be addressed; the state is investing heavily in employer-driven workforce development efforts to help solve this problem, such as Real Jobs RI, and we are deploying incentives to attract and retain top talent in technical fields. We are thankful to Governor Raimondo and the General Assembly for taking on the challenges that confront Rhode Island’s clean energy sector. Investments in this important growth sector of our economy are creating jobs and increasing opportunity for Rhode Islanders, and are putting the Ocean State on the map as a global leader in clean energy technology. We look forward to continuing to unlock the potential that this industry holds for our state and its workers. Sincerely,
Marion Gold Commissioner Office of Energy Resources
Stefan Pryor Rhode Island Secretary of Commerce
\

4
The 2016 Rhode Island Clean Energy Industry Report is an end product of a massive collective effort and collaboration of many stakeholders. The Rhode Island Office of Energy Resources and the Executive Office of Commerce would like to thank all of the respondents of the survey which resulted in the data this report summarizes. Our partners could only gather this data because each respondent’s willingness to share their time and insights. The publication of this report would not be possible without the hard work and dedication of the following individuals: BW Research Partnership Philip Jordan Sarah Lehmann Josh Williams Ryan Young Veronica Williams Rhode Island Office of Energy Resources Staff Shauna Beland Danny Musher Chris Kearns Nick Ucci Commerce RI Staff Annie Ratanasim William Ash Chris Cannata Maris Sagamang In addition, BW Research and OER would like to thank the hundreds of employers that provided feedback for this report.

5
Executive Summary
Rhode Island’s clean economy generated remarkable job growth over the last 12 months. Employment across the state’s clean energy firms increased by 40% over 2015, far exceeding last year’s projected growth of 17%. Clean energy jobs now support about 14,000 workers across the state, and Rhode Island’s clean energy employers project a six percent increase in the clean workforce over the next 12 months. Energy efficiency technologies currently represent six in ten clean energy workers; these firms increased employment by 57%, adding almost 3,000 new jobs across the state. This sector is largely comprised of workers who work with both traditional and energy efficient products, as only a quarter of these employees spend all of their time on energy‐efficiency related work. The dramatic recent job growth in this sector is the result of these technologies and activities becoming more ubiquitous and changing the way traditional building trades operate – more firms are offering energy efficient product lines as the technologies become an integral part of their business, even if it is not their primary business line. However, the state’s energy efficiency sector is experiencing some barriers to growth due to the region’s insufficient labor market. Firms that have been either engaged in the hiring process over the last year or are actively seeking to hire note particular difficulty due to a lack of industry‐specific knowledge, training, and technical skills. Nine in ten firms reported hiring difficulty over the last 12 months, and a quarter note that hiring has been “very difficult”. But while experience and apprenticeships rate as most important among energy efficiency employers, almost half (45%) of hiring firms do not have an existing relationship with the schools and training providers that supply the region’s energy efficiency workers. Though currently only 14% of the clean workforce, renewable energy employment almost doubled over 2015. The workforce grew by 84% in just 12 months, creating 907 new jobs. While it remains a smaller portion of the clean economy, optimism regarding the state’s current offshore wind energy project as well as third‐party ownership and financing of solar projects may signal that renewable generation is on pace to continue this growth in the short term. Installation remains the majority of statewide clean energy work, but nearly all value chain activities saw impressive growth. Installation, engineering, and sales firms each grew by at least 25% over the last 12 months. Installation and maintenance (46%) and trade and distribution (45%) experienced the highest growth, followed by engineering, research, and professional services (28%). Rhode Island’s clean economy is still largely comprised of small businesses. The number of firms that employ one to five energy employees is up by seven percentage points from 2015. Eight in ten clean energy firms reported hiring difficulty, and almost half note that finding qualified workers was “very difficult” over the last 12 months.

6
Clean energy establishments have seen growth among their in‐state customer base; three‐quarters of firms primarily serve in‐state customers – this is up from 68% last year. However, fewer firms are sourcing their supplies from in‐state vendors. In 2015, four in ten firms reported in‐state suppliers, but this declined to 32% this year. Clean energy has quickly become the main source of revenue for more firms across the state. Only a quarter of firms reported that all of their revenue was derived from clean energy work in 2015. In just 12 months, that has increased to four in ten firms that now attribute all of their revenue to clean activities. This is likely due to the maturation of the solar industry, start up activity in smart grid technologies, and the progress made on the construction of the Block Island Wind Farm.

7
In the second annual review of Rhode Island’s clean economy, public commitment by Governor Raimondo’s Administration and legislators continues to produce statewide economic growth and employment opportunities. The state’s Utility Restructuring Act of 1996 created the first public benefits fund in the United States. The Rhode Island Renewable Energy Fund (RIREF) is designed to support the state’s clean economy in four key areas: small‐scale solar, commercial development, pre‐development feasibility studies, and early‐stage commercialization.1 More recently, the state also established a Renewable Energy Growth program to promote grid connected renewable energy technologies. Through a competitive bidding process, the program provides incentives that finance the development, construction, and operation of distributed generation projects in order to achieve statewide goals. During its five years, the program expects to reach a goal of 160 MW, with incremental targets for each year.2 Among the states with the strongest energy efficiency policies and programs, Rhode Island has set annual utility savings targets to begin at 2.5% for electric and 1% for natural gas in 2015, escalating to 2.6% and 1.1% respectively in 2017. Utility companies are required to achieve all cost‐effective energy efficiency measures.3 These government and utility‐led initiatives placed the state fourth in the nation for its leadership in energy efficiency. In fact, Rhode Island received a perfect score for utility policies and programs. With significant funding dedicated towards implementing all cost‐effective efficiency measures, the state achieved the highest electricity savings in the nation for 2015.4 Looking forward, Rhode Island’s Governor, Gina Raimondo, has introduced an Energy Budget Article as part of her FY2017 State Budget proposal to the RI General Assembly. The Energy Budget Article would extend the Renewable Energy Fund beyond its current December 31, 2017 expiration, expand virtual net metering to additional customer classes, update the state’s property tax law for renewable energy installations, and allow third‐party financing as an option under the net metering program. Rhode Island is also preparing to become an industry center for offshore wind, a technology that has seen international growth in countries across Europe and Asia. This past April, Deepwater Wind began construction on the nation’s first offshore wind project off the coast of Rhode Island. The Providence‐based wind firm is drawing from the local talent pool to develop this project; turbine foundations are being manufactured at Quonset Business Park in Rhode
1 Database of State Incentives for Renewables and Efficiency, US Department of Energy, May 2015 2 Database of State Incentives for Renewables and Efficiency, US Department of Energy, August 2015 3 American Council for an Energy‐Efficient Economy, Policy Brief for State Energy Efficiency Resource Standards (EERS), April 2015 4 2015 State Energy Efficiency Scorecard, American Council for an Energy‐Efficient Economy

8
Island, while the state’s project crews assemble and install deck platforms, submarine cables, and turbine parts. Block Island Wind Farm is scheduled to come online this year, and its five turbines will produce 30 MW of electricity for the state.5 Given the results of this year’s industry report, Governor Raimondo, House Speaker Nicholas A. Mattiello, Senate President Teresa Paiva‐Weed, Treasurer Seth Magaziner, Lt. Governor Daniel McKee, and the RI General Assembly should be commended for their efforts and support in advancing the state’s clean energy laws over the last several years, including the launch of the RI Infrastructure Bank and the pending Property Assessed Clean Energy programs scheduled to launch for both commercial and residential markets before the end of the year.
5 Deepwater Milestone: RI work begins on wind farm project, Providence Journal, April 2015

9
Employment Growth Clean energy employment in Rhode Island saw impressive growth over the last year. The state’s commitment to supportive policy and deployment metrics paved the way for a staggering 40% growth over the last 12 months; this far exceeds last year’s projected growth of 17%. Rhode Island is now home to almost 14,000 clean energy workers, and these firms support 3% of statewide employment.6 Clean energy employers project a six percent increase in the clean workforce over the next 12 months. Figure 1. Rhode Island Clean Energy Industry Employment, 2016‐2016
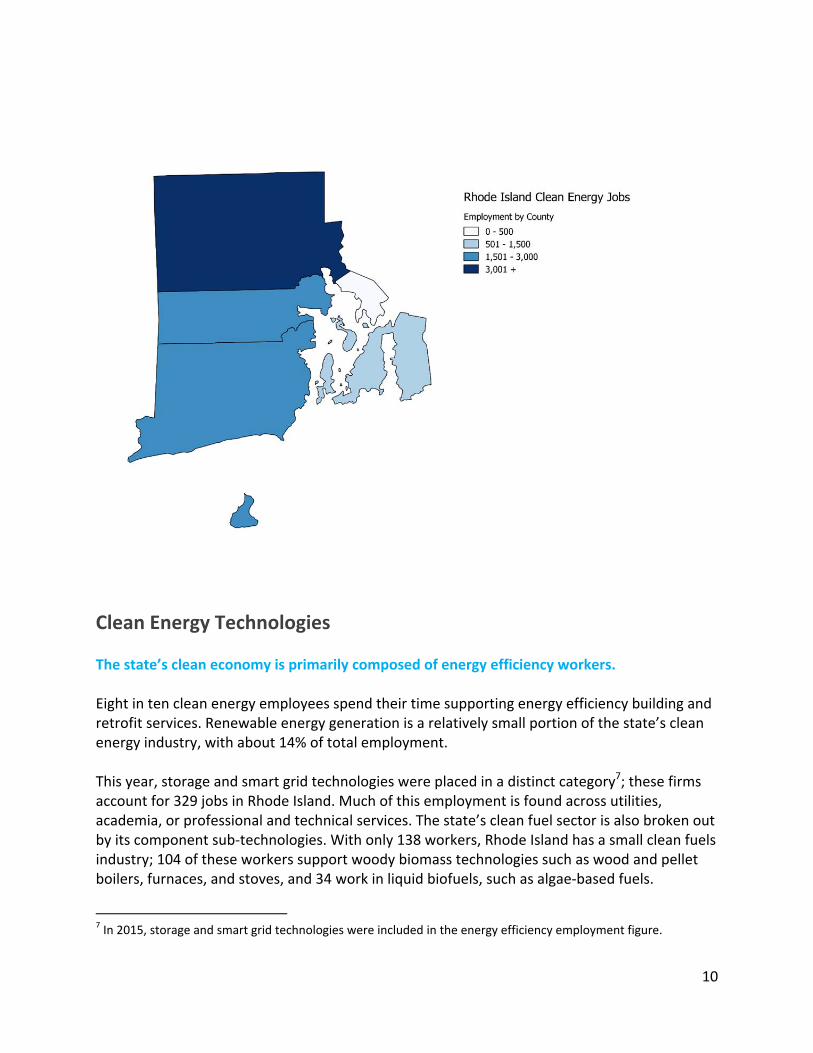
Clean Energy jobs are found in every county of Rhode Island, with the largest concentration in Providence County. See Appendix B for a table of employment by legislative district.
6 Bureau of Labor Statistics, Current Employment Statistics State and Area Employment, total nonfarm, December 2015
9,219 9,832
13,776
2014 2015 2016
10
Clean Energy Technologies The state’s clean economy is primarily composed of energy efficiency workers. Eight in ten clean energy employees spend their time supporting energy efficiency building and retrofit services. Renewable energy generation is a relatively small portion of the state’s clean energy industry, with about 14% of total employment. This year, storage and smart grid technologies were placed in a distinct category7; these firms account for 329 jobs in Rhode Island. Much of this employment is found across utilities, academia, or professional and technical services. The state’s clean fuel sector is also broken out by its component sub‐technologies. With only 138 workers, Rhode Island has a small clean fuels industry; 104 of these workers support woody biomass technologies such as wood and pellet boilers, furnaces, and stoves, and 34 work in liquid biofuels, such as algae‐based fuels.
7 In 2015, storage and smart grid technologies were included in the energy efficiency employment figure.

11
Figure 2. Clean Energy Technology Employment Breakdown, 2016
Renewable generation firms almost doubled total employment in 2015. Though the technology represents a small portion of Rhode Island’s clean economy, renewable energy employment grew by 84%, supporting an additional 907 workers. According to employers, growth is largely due to a consistent policy landscape and programs such as the Renewable Energy Growth Program, as well as increased employment connected to the Block Island Wind Farm. Energy efficiency and clean transportation also made impressive employment gains; in fact, energy efficiency employers added just over 2,900 new jobs to the economy – three times more than the number of renewable energy jobs created. Clean transportation firms grew by just over a quarter, but since the sector is small, a growth of 26% represents about 50 new jobs. Renewable and Efficient Heating and Cooling firms also grew their workforce by an additional 900 new jobs.
58.9%24.9%
14.4%
1.8%
Energy Efficiency
Renewable Heating and Cooling
Renewable Energy Generation
Alternative Transportation

12
Figure 3. Employment Growth by Technology, 2014‐20168
8 For this growth analysis, “other” is not included for 2016, though it was delineated in previous reports.
252
1,986
3,425
8,112
707
201
1,079
2,682
5,163
Other
Clean Transportation
Renewable Energy
Renewable and Efficient Heating andCooling
Energy Efficiency
2015 2016

13
The Rhode Island Solar Industry Rhode Island’s solar industry posted impressive annual employment gains over 2015, now exceeding 1,400 workers.9 Employment is largely focused on deployment, with installation and sales contributing to nearly all of the employment statewide. A small northeastern state with limited space and heavy tree cover, Rhode Island’s solar future will likely mirror that of neighboring Massachusetts, which has seen dramatic solar growth in residential, commercial, and industrial applications, as opposed to large, utility scale projects.10 While the growth is impressive, it does not represent the full potential of the industry in Rhode Island, likely due in large part to the state’s treatment of third‐party owned systems.11 In 2014, 72% of residential solar systems installed nationwide were third‐party owned, suggesting that Rhode Island is missing a potentially significant opportunity to expand its solar generation capacity.12 However, industry experts expect direct ownership to rebound, as more attractive financing options proliferate – low interest loans and Property Assessed Clean Energy (PACE) programs. These programs will address the significant obstacle – upfront capital – that has prevented residential and commercial installations. In fact, Governor Raimondo’s recent budget proposal would not only strengthen the state’s net metering program, but also allow third‐party ownership of systems to participate. Based on the experience of states following the allowance of third party solar ownership (including California, Colorado, Massachusetts, and New Jersey), Rhode Island could expect to at least triple its residential and commercial solar installations and corresponding employment. While third‐party ownership issues present an obstacle, Rhode Island’s incentive programs for distributed solar generation are effective and frequently cited by employers as helpful for both market stimulation and job creation. However, historical and expected future growth for solar technologies in Rhode Island has led to concerns over talent availability. Solar employers in Rhode Island note that the skill level for solar installers is high, with a strong preference for licensed electricians, rather than installers who have gone through a short‐term training program only. Rebound of the state’s construction sector, coupled with strong regional economic growth throughout New England, has created a highly competitive landscape for skilled electrical labor. Because the average rate for a solar installer is around $21 per hour, companies report a battle for talent. Increase in the supply of solar‐trained electricians as well as development of deeper partnerships with training providers, apprenticeship programs, and the electrical union could ease the labor challenges facing solar installation firms in Rhode Island.
9 The Solar Foundation/BW Research Partnership 10 See generally, Massachusetts Clean Energy Industry Report (2011‐2015), available at http://masscec.com. 11 Third party ownership refers primarily to leases and power purchase agreements. 12 GTM Research, U.S. Residential Solar Financing 2015‐2020.

14
Rhode Island’s solar workforce accounts for nearly three‐quarters of renewable generation employment. Supporting roughly 1,500 workers, solar technologies comprise the majority of statewide renewable generation employment. Rhode Island also has a sizeable portion of wind employees; these workers account for almost a quarter of the generation workforce. Almost all renewable generation employees (95%) spend at least half of their time supporting renewable energy‐related business activities; nine in ten workers (91%) spend all of their time on this work. This is exceptionally high compared to other New England states – only six in ten renewable energy workers across Vermont and seven in ten workers in Massachusetts spend all of their time dedicated to generation activities. Already, Rhode Island’s emerging renewable energy market has a higher prevalence of “pure‐play” firms13 compared to mature neighboring markets; this suggests that the clean economy provides a sufficiently reliable source of revenue for firms that provide renewable energy goods and services.
Figure 4. Renewable Energy Generation Employment by Sub‐Technology, 2016
13 Pure‐play firms are firms that are highly concentrated in clean energy work and conduct limited business outside of the clean energy technology sphere.
73.6%
23.6%
1.1% 0.9% Solar
Wind
Bioenergy/ Biomass
Low‐ImpactHydroelectric

15
Block Island Wind Farm Wind energy has increasingly become a source of employment opportunity across Rhode Island; the sector supports almost 500 jobs across the state. While a small percentage of these workers are engaged in land‐based wind turbines, significant job growth has resulted from the development of offshore wind, including the Block Island Wind Farm. Block Island is on track to be the first offshore wind farm in the country, due in large part to the state’s successful legislative process. Rhode Island managed to avoid much of the controversy encountered by neighboring states that have attempted to construct offshore wind generation projects. Using a collaborative approach that capitalized on the University of Rhode Island’s ocean energy expertise, Rhode Island’s process involved a careful review of potential site alternatives, public approval process, and competitive auction of the site. Offshore wind is creating diverse job opportunities for residents across the state. Pre‐construction work employs engineers, environmental scientists, archaeologists, legal specialists, and other permit and planning consultants. These professionals are working to conduct environmental impact assessment models that incorporate bird migrations routes, marine habitats, commercial fishing activity, noise pollution, and the geology of the ocean floor. These studies have been underway for the past six years, and many of these individuals have extensive experience in the marine defense sector as well as an ability to use existing technologies that may eventually be exported to other parts of the country. The Block Island project also fostered a local ecosystem of component manufacturing and assembly. General Electric established a temporary manufacturing facility in Providence that involved over 150 local workers. Their work is largely focused on electrical and mechanical aspects of the wind towers, such as electrical controls and systems, fire suppression and climate control. Additional manufacturing, including steel foundations is also conducted within the state and major logistics operations for cabling and turbines is centered on local ports. In fact, even the boats used to transport workers and equipment to and from the site were built by Blount Boats of Warren, Rhode Island. Project construction is recently underway, as initial foundations were secured at sea. Final site and equipment preparation, logistics, and other support activities will follow. The project developer, Deepwater Wind, currently employs 12 workers in its Rhode Island offices, but they expect over 300 local workers to be involved in the project. The Block Island Wind Farm demonstrates great opportunity for localized employment and economic benefits. In order to maximize such benefits, however, it is critical that local talent is properly qualified. Two of the most important skills for this project are welding and the ability to work at sea. Organized labor is also reported to be especially helpful in meeting the talent needs of this offshore wind project. The University of Rhode Island is also a valuable asset to the region, bringing expertise and experience in oceanography and environmental science. As Rhode Island emerges a leader in offshore wind production, the University’s reach and vision may serve as an opportunity for entrepreneurship and talent export along the Eastern Seaboard. Finally, building on experience with the Block Island project, Rhode Island’s marine trades can play an increasingly important role in the emergence of this industry. Boat builders and operators located in the state have the opportunity to work on projects throughout the region. Professional service firms in the engineering and permitting fields have skills that can easily be exported across state lines, and technology providers now working in the marine defense sector may find opportunity to open new markets for products such as underwater remote operated vehicles and underwater mapping.

16
Rhode Island’s energy efficiency firms are still largely involved in traditional construction and electrical wiring trades. Only a quarter (26%) of the state’s energy efficiency workers spend the majority of their time on efficiency‐related work. Rhode Island’s energy efficiency market may still be in development compared to efficiency firms across Vermont, where seven in ten employees spend at least half of their time supporting the energy efficiency portion of business and 38% spend all of their time on efficiency‐related business. Figure 5. Energy Efficiency Employment by Sub‐Technology, 2016
36.3%
26.7%
11.9%
9.4%
8.3%
7.0%
0.3% LED, CFL, and Other Efficient Lighting
Advanced Building Materials/ Insulation
Traditional HVAC Goods and Services
Renewable Heating and Cooling
Energy Star/ High AFUE HVAC
Other
Energy Star Appliances

17
Energy Efficiency Hiring Needs in Rhode Island
Given the amount of hiring activity – 4,800 new jobs or a 94% increase – found in the energy efficiency sector in Rhode Island, the research team conducted a follow‐on survey of energy efficiency firms in the state that have had recent experience with the region’s labor market.14 Firms that are either actively hiring or have been seeking to hire over the last 12 months are mostly concentrated in the sale, installation, and repair of residential heating and cooling products; these employers represented the majority of respondents (55%), followed by weatherization firms for air‐sealing and insulation (10%). Nine in ten reported hiring difficulty, and about a quarter note that hiring has been “very difficult” over the last year. The most reported reason for difficulty was that many applicants do not have the technical training required for the job; all surveyed firms reported that they have had difficulty finding energy‐efficiency workers with training specific to the position. Other reasons for difficulty include relevant work experience (83%) and technical skills (78%). This difficulty may be attributed to the fact that half of firms looking to hire efficiency workers expect one to three years of work experience in comparable positions. In fact, more traditional firms (with a lower percentage of their work connected to clean energy) note that certifications are not high priority for either manufacturing or entry‐level positions compared to apprenticeships, technical skills, and experience – 55% of firms do not require BPI certification for entry‐level positions and 40% of firms do not have a preference. Of further interesting note, energy efficiency firms focused on heating and cooling systems reported a much stronger need for certification, and more difficulty, as these positions require different, and typically more advanced, skill requirements and expertise with specific product lines (e.g., Mitsubishi or Fujitsu mini‐splits; Veissman or Rinnai heat pumps). Though firms place high importance on industry‐specific training, related work experience, and apprenticeships, many firms reported that they do not have existing relationships (45%) with schools or training providers that supply the labor market with energy efficiency workers. Given these findings, the research team recommends the following: 1. Identify or create a workforce intermediary to organize energy efficiency training, certification, internship
and apprentice, and other workforce related activities. A critical function of the intermediary, in addition
to serving as an information clearinghouse, is facilitating relationships among employers and training
providers.
2. Develop an internship or apprenticeship program similar to the program administered by MassCEC15 or
ReNEW in New York City.16
3. Target existing workers in the building trades to expand experienced laborers’ skill sets in clean
technologies.
4. Develop a marketing plan or targeted awareness program to ensure that businesses in manufacturing
and installation are aware of the various certifications, apprenticeships, and other programs that provide
workers with advanced skill training.
Rhode Island has a fairly small clean transportation industry.
14 Qualifying energy efficiency firms are involved in the sale, installation, or maintenance of energy‐star or other energy efficient products. In order to pass the screener questions, these firms must have either hired workers over the last 12 months or be actively seeking to hire for positions that directly support the energy efficiency portion of business. 15 http://www.masscec.com/work‐clean‐energy/job‐seeker/internship‐program 16 http://www.new‐nyc.org/pages/programs/ReNEW.html

18
Rhode Island has a fairly small clean transportation industry. There are 252 employees working on clean vehicles, with the largest segment repairing hybrid and electric cars or developing and constructing electric vehicle charging stations. Figure 6. Clean Vehicle Employment by Sub‐Technology, 2016
Installation workers comprise just over half of the state’s clean economy. Almost six in ten employees (56%) across the clean workforce are working to install, maintain, and repair clean energy systems across the state. Another 22% of the clean workforce are providing engineering, research, and professional services for the clean economy. Figure 7. Value Chain Breakdown, 201617
17 Though value chain titles are more comprehensive this year they are comparable to the 2015 report as follows: installation is now installation, maintenance, repair and operations; engineering, research, and professional services was previously split into engineering and research and consulting, finance, etc.; sales and distribution is now trade, distribution, and transport.
72.3%
18.0%
9.7%Hybrid and Plug‐in Hybrid
Electric
Natural Gas
55.9%22.2%
10.8%
5.6%5.5%
Installation, maintenance,repair, and operationsEngineering, research, andprofessional servicesTrade, distribution, andtransportManufacturing
Other

19
Clean Energy Innovation in Rhode Island Innovation is a critical component of the clean energy industry, as companies across a wide spectrum of activities develop new technologies to meet global energy needs. Rhode Island has a small but impactful innovation cluster, located primarily in and around Providence. Since 2010, the Rhode Island clean energy innovation cluster attracted nearly $89 million in capital over 20 deals. The majority of the deals and dollars were from early‐stage investment, including Seed, Series A and Series B funding. These deals represent important economic activity in Rhode Island because nearly all of the money invested was attracted from out‐of‐state.18 A review of companies that comprise the innovation core for Rhode Island’s clean energy economy suggests particular strength across the smart grid and data technology spheres – Utilidata and VCharge. These anchor companies can form the backbone of a smart grid innovation hub in Rhode Island. Interviews with innovation firms indicate that their needs differ sharply from more mature, post‐commercial enterprises. While containing business costs and streamlining regulation is important in every industry, clean energy innovation employers reported much greater emphasis on the need for talent‐based strategies that help them to recruit and retain high‐skilled innovators. The most important considerations raised by employers regarding such strategies are the promotion of Rhode Island’s high‐quality of life, stronger K‐12 education, regional university partnerships (both within Rhode Island and throughout New England), provision of incubator space, and increased connectivity among clean energy innovators. The recently enacted student loan forgiveness program for Rhode Island residents was also noted by several employers, though they sought an expansion of the program to allow them to attract highly educated talent from other states as well. Employers also reported capital needs. Several mentioned that other states, including Massachusetts, provide matching grants for United States Department of Energy ARPA‐E applications, or leveraged funding to support private equity and loan transactions. Rhode Island can also benefit from its proximity to two emerging clean energy hubs – Boston, which has become a world leader in storage technologies, and Connecticut, which has a large fuel cell/hydrogen innovation cluster. Both cities are not only easily accessible but also have the talent and technology that overlaps with Rhode Island’s strengths. This proximity can facilitate healthy technology and talent flows that can strengthen each cluster and the regional economy. Finally, employers noted the world‐class activity in marine science and energy at the University of Rhode Island, but lamented the absence of a private sector core of innovative businesses in South County. Given the enormous potential of marine energy – offshore wind, wave and tidal power, algae biofuels – targeted steps could be taken to increase the private sector impact of both the University of Rhode Island and the naval base in Newport.
18 Cleantech Group’s i3 Data Platform

20
The following recommendations are based on investment data and company interviews:
1. Continue to promote talent‐based economic development strategies tailored to attracting innovators to Rhode Island. Such incentives include expanding the student loan repayment program, investing in open space, encouraging smart development in downtown Providence, and developing regional linkages with universities.
2. Promote Rhode Island as a great place to live and work, and tout its existing core of smart grid
and offshore wind activity. Rhode Island has a high quality of life, including a vibrant downtown Providence and abundant natural beauty both inland and at the coast. In addition, it has emerged as a leader in smart grid innovation, particularly focused at the intersection between data and energy.
3. Develop a funding mechanism to leverage federal grants and private investment. Rather than
providing stand‐alone financing of start‐up businesses, Rhode Island should target its investments to leverage outside funding opportunities and make Rhode Island bids more attractive to outside funders.
4. Promote entrepreneurship at URI and Rhode Island College. Rhode Island should examine the
technology and talent transfer at URI and RIC (and the naval base in Newport) to determine how it might foster more innovation and entrepreneurship outside of Providence. The development of incubators, leveraged financing, entrepreneurial training, and emphasis on the importance of start‐up private sector enterprises are all important considerations.
Clean energy employment growth is spread across the state’s value chain activities.
Installation, engineering, and sales firms each grew by at least 25% over the last 12 months. Installation and maintenance (46%) and trade and distribution (45%) experienced the highest growth, followed by engineering, research, and professional services (28%). With only 6% of the clean workforce, manufacturing firms increased employment by just over 2% in 2015.

21
Figure 8. Firm Growth by Value Chain Activity, 2015‐2016
755
776
1,493
3,057
7,695
405
759
1,027
2,382
5,259
Other
Manufacturing
Trade, distribution,and transport
Engineering,research, and…
Installation,maintenance,…
2015 2016

22
Firm Size The clean economy continues to create opportunity for small businesses across Rhode Island. About seven in ten firms employ one to five employees; this is up from 61% last year.19 Figure 9. Firms by Company Size, 2016
Employer Hiring Experience Employers across the state report trouble finding qualified applicants. Eight in ten firms (77%) reported hiring difficulty; 46% reported “Very difficult”. Reported reasons for difficulty include insufficient qualifications, certifications, or education (70%), lack of experience, training, or technical skills (30%), inability to provide competitive wages (30%); about two in ten respondents also noted lack of non‐technical skills such as work ethic, dependability, or critical thinking (20%). Firms report difficulty hiring electricians or construction workers (40%), as well as installation (30%) and technician or technical support positions (30%). Two in ten firms also mentioned engineers (20%) and sales, marketing, and customer service representatives (20%).
19 For comparison, 55% of firms in Vermont, 40% of firms in Massachusetts, 38% of firms in California, and 37% of firms in Illinois reported under six employees.
2.9%
5.9%
8.8%
14.7%
67.6%
50 to 99 employees
25 to 49 employees
11 to 24 employees
6 to 10 employees
1 to 5 employees

23
Figure 10. Hiring Difficulty, 2016
Customers and Vendors Rhode Island’s customer base has become more localized while in‐state suppliers have declined. Three‐quarters of firms reported that their customers are primarily within the state, compared to 68% last year. The state’s clean economy is no longer serving international clients; this is down from 3% in early 2015. While the growing clean economy is ramping up deployment within the state, it seems Rhode Island’s clean energy manufacturing and distribution firms have diminished. Where four in ten firms (43%) reported primarily in‐state vendors and suppliers last year, this number has diminished to 32% today. As solar installations increase in Rhode Island, this trend likely to continue, as the majority of the components (and all of the finished products) are produced outside of Rhode Island.20
20 As Rhode Island continues to explore opportunities for manufacturing in‐state, an adjacent industry analysis to determine the feasibility of growing domestic clean energy product manufacturing may be warranted.
46.2%
30.8%
23.1%
Very difficult
Somewhat difficult
Not at all difficult

24
Figure 11. Customer and Vendor Locations, 2016
Revenue Streams Clean technology is an increasingly larger source of revenue for firms. Because clean technologies generally provide new revenue opportunities for traditional industries across manufacturing, professional service, and building trades, it is rare for firms to derive all of their revenue from clean activities. In 2015, only a quarter of firms (24%) reported that all of their revenue came from clean energy work. In just 12 months, this has increased to four in ten firms that now attribute all of their revenue to clean technologies. Figure 12. Percent of Revenue Attributed to Clean Energy
75.0%
32.0%
7.1%
24.0%
17.9%
40.0%
4.0%
Customers
Vendors
In‐stateIn a bordering state but out of stateIn the United States, but outside of a bordering stateOutside of the United States
41.4%
34.5%
24.1%
All of it (100%)
Half to most of it (50% to 99%)
A quarter to almost half of it(25% to 49%)
Less than a quarter (1% to24%)

25
Clean Energy Policy: Success and Barriers Few firms are aware of state‐level portfolio standards. Half of firms mentioned the Renewable Energy Investment Tax Credit (REITC, unaided) when questioned about specific policies that have contributed to firm success; 29% mentioned state‐level Renewable Portfolio Standards or Energy Efficiency Resource Standards, including Rhode Island’s Renewable Energy Standard (RPS) and Energy Efficiency Program Plan (EERS).21 With an aided question, still half of firms (50%) are aware of the REITC, 44% are aware of EPA’s Clean Power Plan22, and 39% are familiar with a state‐level RPS/EERS. The majority feel the REITC (69%) and RPS/EERS (82%) have increased business prospects; 64% expect the Clean Power Plan to increase business prospects. The most cited barrier to success was financing or material costs, by a quarter of firms. Figure 13. Policies that Contribute to Firm Success, 2016
21 These policies may refer to those within Rhode Island or of neighboring states, as external RPS/EERS legislation may contribute to out‐of‐state exports for Rhode Island’s clean energy firms. Please note that while most other states use an RPS, Rhode Island’s equivalent is called the Renewable Energy Standard (RES). 22 The Clean Power Plan sets a national limit and statewide standards on carbon produced by power plants.
4.2%
25.0%
4.2%
12.5%
16.7%
20.8%
29.2%
50.0%
DK/NA
Other
Grants and loans
Utility rebates
Clean Power Plan or EPA's Clean Power Plan
Other tax exemptions, credits, and rebates
State Renewable Portfolio Standard (RPS)…
Renewable Energy Investment Tax Credit

26
In this second review of Rhode Island’s clean energy economy, results suggest a state that is advancing towards industry leadership and local economic stability. Policy commitment has developed a clean energy cluster that supports 14,000 jobs, or 3% of the statewide labor market. Clean energy firms made impressive employment gains, increasing their payrolls by 40% and far outpacing last year’s growth projection by 23 percentage points. This year’s data indicates a healthy market, though still under development. Employment growth is strong across both technology and value chain activities, which suggests the state is cultivating a locally diverse ecosystem of research, supply, and construction. Meanwhile, clean energy demand has translated to profit, and data suggests that firms have begun to specialize in clean energy goods and services. In 2015 only a quarter of firms reported that all of their revenue was derived from clean energy work; in just 12 months, that has increased to four in ten firms that now attribute all of their revenue to clean activities. Interestingly, fewer firms are sourcing their supplies from within the state, which appears contrary to other data indicators. Though manufacturing employment grew by only 2%, a 45% employment increase across trade and distribution firms in addition to the locally‐based wind project seemingly indicate a diverse set of value chain activities. With statewide policies akin to other mature New England clean economies, Rhode Island may look forward to increasing its share of “pure‐play” energy efficiency workers. Though energy efficiency firms added over 3,500 new jobs to the economy, still only a quarter (26%) of the state’s energy efficiency workers spend the majority of their time on efficiency‐related work. The state may further benefit from improved industry‐academia partnerships that foster talent development and apprenticeships. Despite high reported difficulty in hiring workers, particularly due to lack of training, experience, and technical skills, 45% of hiring firms reported no existing relationships with the schools and training providers that supply energy efficiency workers to the region’s labor market. Rhode Island’s energy efficiency employers also note difficulty in finding qualified workers for support the energy efficiency portion of their business. While clean energy has quickly become a reliable source of revenue for more firms compared to the 2015 report, Rhode Island’s economy is still dominated by small businesses. However, as the market matures, future studies will keep an eye on business expansion, “pure‐play” activity, and the local composition of suppliers and vendors.

27
Data for this year’s report is derived from the comprehensive BW Research Energy Employment Index (EEI). The Index is the result of a rigorous survey effort of traditional and clean energy establishments across all 50 states, based in part on the methodology refined for the 2015 Rhode Island Clean Energy Industry Report. Final employment figures are extrapolated based on the Bureau of Labor Statistics Quarterly Census of Employment and Wages (QCEW, Q2). Though QCEW datasets track energy employment across traditional production, transmission, and distribution subsectors, the current structure of the North American Industry Classification System (NAICS) assigns a portion of the nation’s energy and energy efficiency work into broad categories of non‐energy specific industries, such as construction, wholesale trade, and professional services. Identifying energy‐related employment within these broad industry sectors is particularly important for understanding employment trends across emerging renewable energy and advanced fuel technologies and infrastructures, such as solar, wind, geothermal, biomass, storage, and smart grid. Since rising deployment of efficiency‐related technologies has carved out new opportunities for firms in traditional trades to research, manufacture, or install energy efficient products and upgrades, parsing out this employment is especially useful to determine the level of job growth across the nation’s energy efficiency subsectors. However, energy efficiency and other clean energy workers are not exactly captured through traditional NAICS alone. For example, a subset of semiconductor manufacturers produces solar panels, while others assemble computer components or medical equipment. Even though the NAICS classifications include a “solar electric generation” subsector, important elements of the solar value chain, such as research, installation, manufacturing, sales, and distribution are embedded within these other broad NAICS categories. While federal labor market data alone presents an incomplete picture of the clean energy workforce, inclusion of these additional manufacturing or construction industries in their entirety would result in exaggerated employment figures, while their exclusion underestimates the clean economy and its workforce. The data in this report are neither a replacement of the existing BLS data series nor do we attempt to reclassify the current system of industry codes. The Energy Employment Index instead provides an additional layer of employment analysis and may be viewed as a filter that identifies and apportions energy‐related jobs from within the broad NAICS classifications and into their respective clean energy or energy efficiency technologies and sub‐technologies. The EEI methodology has been used across local, state, and federal energy‐related data collection and analysis for nearly a decade, including The first annual Department of Energy’s U.S. Energy and Jobs Report, The Solar Foundation’s National Solar Job Census series, and other clean energy industry reports for the Commonwealth of Massachusetts, State of Rhode Island, and numerous other nonprofit agencies across the United States. Both the U.S. Departments of Labor and Energy have reviewed the methodology used for this supplemental survey. The survey was conducted with a stratified sampling plan represented by industry code (NAICS), establishment size, and geography; these variables are used to determine the proportion of

28
establishments across energy‐related technologies and value chain activities. Data from the Index is applied to existing the existing QCEW series in order to filter the universe of potential clean energy establishments from industries such as manufacturing and construction and allocate jobs into their component renewable energy or energy efficient technologies. The survey was administered by both telephone and web; Castleton Polling Institute conducted phone calls, while the web instrument was programmed internally. All respondents are given a unique ID in order to prevent duplication. In order to participate, respondents must pass a set of screener questions that determine their involvement in the clean energy economy based on technology and employee time dedicated to the clean energy portion of business. A clean energy firm is defined as being directly involved in the research, development, production, manufacture, installation, sale, or distribution of goods and services related to renewable energy and energy efficiency, including clean fuels and transportation; firms engaged in services such as consulting, finance, tax, and legal services that support the clean economy are also included in this report. The sample is split into two categories, referred to as the known and unknown universes; these are treated entirely separate until the employment figures from each are added together to produce final clean energy employment. The unknown universe encompasses the entire range of NAICS codes that could potentially support clean energy workers – agriculture, mining, utilities, construction, manufacturing, wholesale trade, professional services, repair, and maintenance. The known universe is comprised of establishments previously identified as energy‐related, either with prior research or through industry associations and government programs. These establishments and their associated employment totals are removed from the unknown universe for both sampling and final employment extrapolations. The distribution of QCEW establishments within potential energy‐related industries was carefully analyzed in order to develop representative sampling clusters for the unknown universe. Incidence rates are developed based off employer responses from the unknown universe – the propensity of firms that report they are involved in clean energy work is applied to the QCEW dataset to derive final clean energy establishment and employment totals. For the transport of clean vehicle parts and supplies, this report utilizes a methodology developed by the Department of Energy and the National Renewable Energy Laboratory. Employment related to clean vehicle transport via truck, rail, air, and water was calculated by dividing the value of commodity shipments by the total commodity value for each state. The proportional value of clean vehicle transport was applied to QCEW employment totals for truck, water, air, and rail transportation. As with previous studies, this report excludes any employment in the retail trade NAICS codes – fuel dealers, motor vehicle dealership, appliance and hardware stores, and other retail establishments. The survey was administered between September 15, 2015 and November 24, 2015 and averaged 14 minutes in length.

29
Congressional District
Employment
1 8,338
2 5,438
Senate District Employment
1 2,422
2 940
3 704
4 156
7 900
9 237
10 528
11 230
12 724
13 135
14 670
16 68
17 995
20 257
21 609
22 413
23 135
26 149
29 1,319
30 352
32 142
34 392
35 927
37 34
38 338
County Employment
Bristol County 444
Kent County 2,282
Newport County 1,313
Providence County 8,046
Washington County 1,690

30
House of Representatives
Employment
1 2,436
2 568
4 372
6 961
9 413
10 372
15 149
19 345
20 853
21 122
24 589
25 291
28 74
29 54
31 548
33 562
36 440
38 88
39 54
40 338
44 704
45 304
47 47
48 223
49 257
56 68
63 494
64 176
66 142
67 81
68 223
69 230
70 338
71 81
72 250
73 399
74 129