Clean Energy National Survey - … #18107 Clean Energy National Survey Key findings from a national...
50
Project #18107 Clean Energy National Survey Key findings from a national survey of 1,000 likely voters, including 400 cell phone respondents conducted February 10 - 14 , 2018.
Transcript of Clean Energy National Survey - … #18107 Clean Energy National Survey Key findings from a national...

Project #18107
Clean Energy National Survey
Key findings from a national survey of 1,000 likely voters, including 400 cell phone respondents conducted February 10-14, 2018.

MethodologyPublic Opinion Strategies is pleased to present the key findings from a survey of 1,000 likely voters across the nation, including 400 cell phone respondents, conducted February 10-14, 2018. The margin of error for this survey is +3.1%.
Glen Bolger was the principal researcher. Kyle Clark was the project director, and Jared Beard provided analytical support.

Political Environment
4
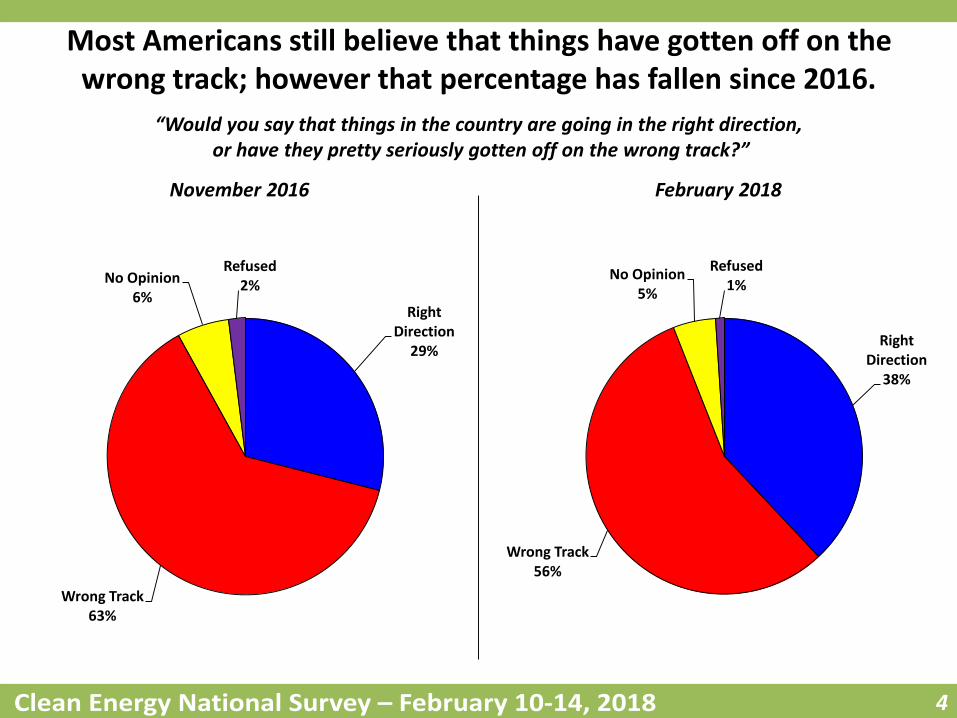
Right Direction
29%
Wrong Track63%
No Opinion6%
Refused2%
“Would you say that things in the country are going in the right direction,or have they pretty seriously gotten off on the wrong track?”
November 2016 February 2018
Most Americans still believe that things have gotten off on the wrong track; however that percentage has fallen since 2016.
Right Direction
38%
Wrong Track56%
No Opinion5%
Refused1%

5
The Republican Candidate
38%
The Democratic Candidate
47%
Undecided/Not Sure
13%
Refused1%
“If the November election for state legislature were being held today, for whom would you vote, the Republican candidate or the Democratic candidate?”
Overall By Gender/Age
Nearly half of voters support the Democratic candidate on the state legislative generic ballot.
32%
49% 49%
19%
37% 35%
51%
34% 34%
69%
50%54%
Men 18-34(13%)
Men 35-54(17%)
Men 55+(18%)
Women18-34(10%)
Women 35-54(19%)
Women 55+(23%)
The Republican Candidate The Democratic Candidate
-19 +15 +15 -50 -13 -19

Issues

7
Health care and education are the mostimportant issues to voters right now.
13%
21%
25%
26%
28%
33%
35%
42%
42%
43%
49%
49%Health Care
Education
Jobs and the Economy
Taxes
Social Security and Medicare
National Security and Fighting Terrorism
Clean Energy^^
The State Budget
Crime
The Opioid Crisis
Energy^
“Thinking now about issues, and after I read each one, please tell me how important that issue is to you on a scale of one to ten, where one means that issue is not at all important to you and ten means that
issue is extremely important to you. Of course, you can choose any number between one and ten.”
Ranked by % 10’s
8.6
8.5
8.5
8.1
7.9
7.8
7.8
7.1
7.1
7.6
7.3
6.3
Mean
Transportation
^Split Sample A, N=501; ^^Split Sample B, N=499

8
“I am going to read you a series of issues, and after I read each one, please tell me how important that issue is to you on a scale of one to ten, where one means that issue is not at all important to you and ten means that issue is extremely important to you. Of course, you can choose any number between one and ten.”
Democrats w/o Degrees 55%
Base Democrats 52%
Women w/o Degrees 51%
Democrat Women 51%
Liberals 50%
Women 65+ 49%
Women 18-34 48%
Democrats 55+ 48%
Minority Women 46%
Democrats 44%
White Democrats 44%
Conservative Democrats 43%
Democrats 18-54 41%
Clinton Voters 40%
African-Americans 39%
Women 55+ 39%
National Mood – Wrong Track 39%
Hispanics 38%
Women 37%
Non-Whites 37%
Urban 37%
Deep South Region 37%
Age 18-34 36%
Age 65+ 35%
Some College Education 35%
Democrats w/ Degrees 35%
Soft Democrats 34%
White Women 34%
High School Education or Less 34%
Pacific Region 34%
Vote History – 1/2 34%
Top Groups – Energy – 10’s (21%)
Minority women and older Independents are most concerned with energy issues, while Democrats w/o college degrees and base Democrats are focused on clean energy issues.
Minority Women 40%
Independents 55+ 36%
Democrats 55+ 33%
Base Democrats 32%
Women 18-34 32%
Democrat Women 32%
Women 65+ 31%
Women w/o Degrees 30%
Non-Whites 29%
Women 55+ 29%
Rural 29%
Moderates 29%
Hispanics 28%
Age 65+ 28%
Democrats w/o Degrees 28%
Deep South Region 28%
South Region 27%
Age 55-64 26%
White Moderates 26%
Outer South Region 26%
Clinton Voters 26%
Democrats 25%
Women 25%
Top Groups – Clean Energy – 10’s (28%)

9
When it comes to environment and energy issues,Americans are most concerned about clean water.
22%
24%
26%
26%
32%
33%
33%
46%
60%Clean Water
Clean Air
Clean Energy
An All-of-the-Above Energy Approach
Climate Change
Renewable Energy
Carbon Emissions
Environmental Stewardship
Greenhouse Gasses
“Thinking now about the environment and energy, I am going to read you a series of issues, and after I read each one, please tell me how important that issue is to you on a scale of one to ten, where on means that issue is not at all important to
you and ten means that issue is extremely important to you. Of course, you can choose any number between one and ten.”
Ranked by % 10’s
8.9
8.4
7.7
7.8
6.7
7.4
7.3
7.0
6.7
Mean

10
“I am going to read you a series of issues, and after I read each one, please tell me how important that issue is to you on a scale of one to ten, where one means that issue is not at all important to you and ten means that issue is extremely important to you. Of course, you can choose any number between one and ten.”
Clean water and clean air are the most important environmental issues to very conservative and somewhat conservative voters.
% of 10’s by Ideology
Very Conservative
(14%)
Somewhat Conservative
(19%)
Clean Energy 12% 25%
Renewable Energy 16% 25%
Climate Change 5% 16%
Environmental Stewardship
6% 21%
Clean Air 27% 36%
Clean Water 43% 48%
Greenhouse Gasses 3% 14%
Carbon Emissions 5% 19%
An All-of-the-AboveEnergy Approach
15% 20%

Clean Energy
12
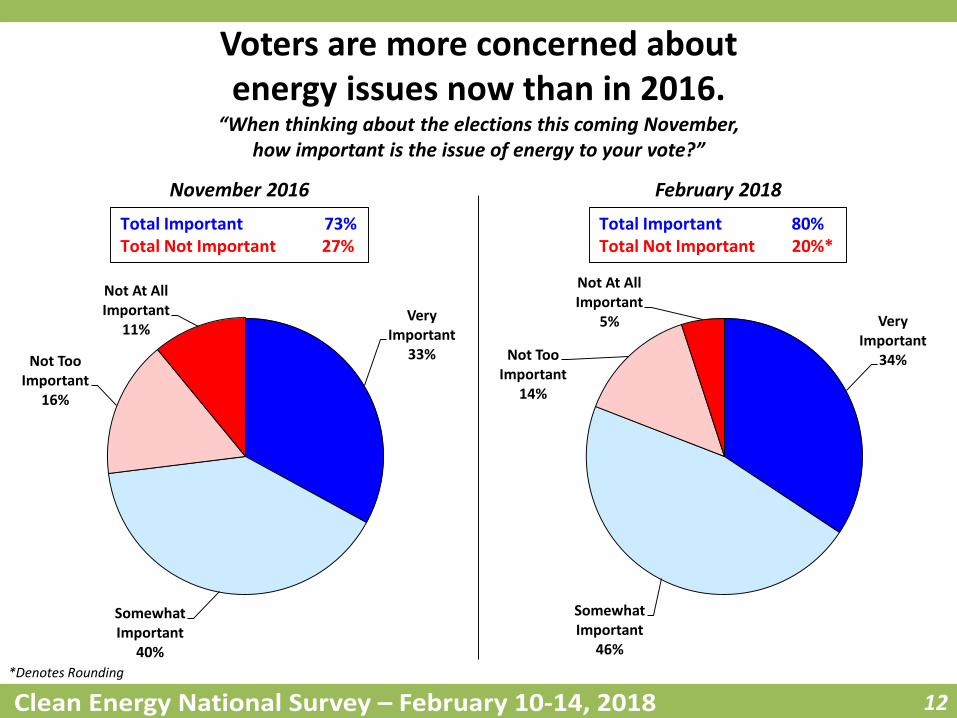
Very Important
33%
Somewhat Important
40%
Not Too Important
16%
Not At All Important
11%
“When thinking about the elections this coming November, how important is the issue of energy to your vote?”
November 2016 February 2018
Voters are more concerned about energy issues now than in 2016.
Very Important
34%
Somewhat Important
46%
Not Too Important
14%
Not At All Important
5%
Total Important 73%Total Not Important 27%
Total Important 80%Total Not Important 20%*
*Denotes Rounding

13
Very Important
34%
Somewhat Important
51%
Not Too Important
10%
Not At All Important
5%
“And, how important is it to you that a candidate for political office share your opinion on energy issues?”
November 2016 February 2018
It is just as important now as it was in 2016 that a candidate for political office shares the voters’ opinion on energy issues.
Very Important
35%
Somewhat Important
49%
Not Too Important
10%
Not At All Important
5%
Total Important 85%Total Not Important 15%
Total Important 85%*Total Not Important 15%
*Denotes Rounding

14
“When thinking about the elections this coming November, how important is the issue of energy to your vote?”
Democrats 55+ 57%
Base Democrats 55%
White Democrats 51%
Democrat Women 51%
Liberals 50%
Minority Women 49%
Democrats w/ Degrees 49%
Conservative Democrats 49%
Democrats 48%
Democrats w/o Degrees 47%
National Mood – Wrong Track 46%
Clinton Voters 46%
Women 55+ 45%
Women 65+ 44%
Democrat Men 44%
African-Americans 43%
Democrats 18-54 43%
Age 55-64 41%
Age 65+ 41%
Independents 55+ 41%
Outer South Region 41%
Soft Democrats 40%
Non-Whites 40%
Women 18-34 40%
Grad. School/Prof. Degree 40%
Women w/o Degrees 40%
Urban 40%
South Region 39%
New England Region 39%
Top Groups – Very Important (34%)
Older Democrats and base Democrats are focused on energy issues and it is important to them that a candidate shares their views.
Conservative Democrats 61%
Democrats 55+ 59%
Base Democrats 53%
Minority Women 52%
Democrat Women 52%
White Democrats 51%
Democrats w/o Degrees 51%
Democrats 50%
Liberals 50%
Democrats w/ Degrees 49%
African-Americans 47%
Democrat Men 47%
Clinton Voters 47%
Soft Democrats 46%
National Mood – Wrong Track 46%
Women 65+ 44%
Democrats 18-54 44%
Non-Whites 43%
Women 55+ 43%
Women w/o Degrees 42%
Urban 41%
Northeast Region 40%
Mid-Atlantic Region 40%
Deep South region 40%
South Region 38%
Women 38%
Age 55-64 38%
Age 65+ 38%
Independents w/o Degrees 38%
Cell Phone Respondents 38%
New England Region 38%
Neighbor’s Vote – Clinton 38%
Top Groups – Very Important (35%)
“And, how important is it to you that a candidate for political office share your opinion on energy issues?”

15
0-2542%
26-5012%
51-753%
76-1002%
Don't Know/
Refused41%
“What percent of your state’s electricity currently comes from renewable sources like wind, solar, hydro, and biomass?”
0-2537%
26-5019%
51-756%
76-1003%
Don't Know/
Refused35%
Voters believe that a higher percentage of their state’s electricity comes from renewable resources now than in 2016.
November 2016 February 2018

16
Percent of State’s Electricity Voters Say Comes from Renewable Sources

17
0-2513%
26-5029%
51-7519%
76-10021%
Don't Know/
Refused17%
“And, what do you think is the right amount of energy for your state to generate from renewable sources like wind, solar, hydro, and biomass?”
0-2514%
26-5031%
51-7520%
76-10025%
Don't Know/
Refused9%
A quarter of voters now believe that 76-100 percent of their state’s electricity should come from renewable resources.
November 2016 February 2018

18
Percent of State’s Electricity Voters Say Should Come from Renewable Sources
19
41%
70%76%
27%
61%
23%13% 10%
39%
7%
35%
16% 13%
31% 28%
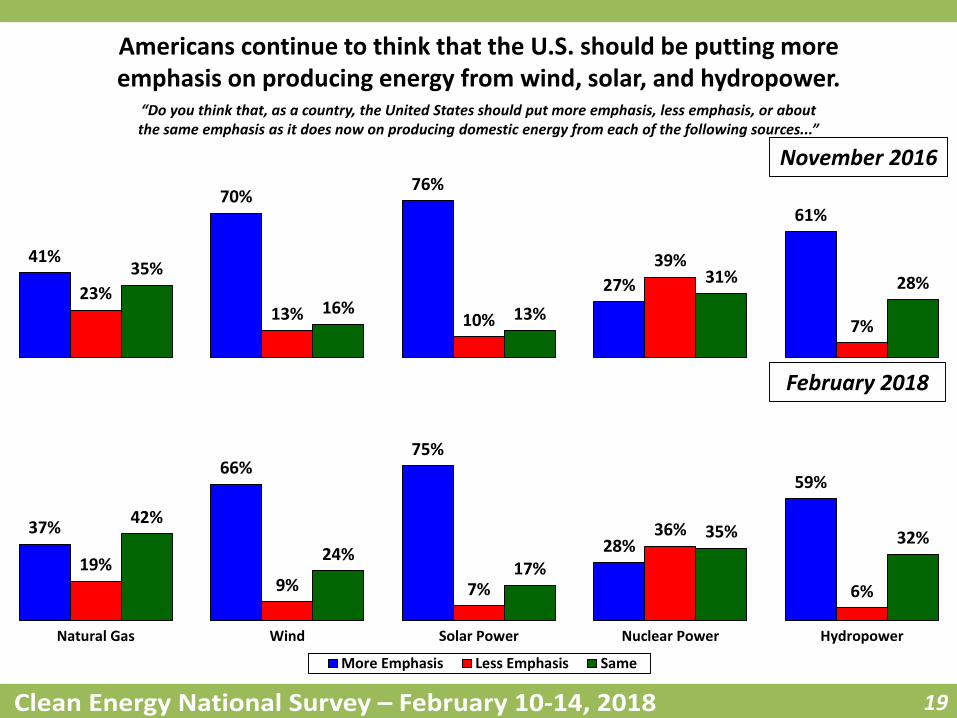
“Do you think that, as a country, the United States should put more emphasis, less emphasis, or about the same emphasis as it does now on producing domestic energy from each of the following sources...”
37%
66%75%
28%
59%
19%9% 7%
36%
6%
42%
24%17%
35% 32%
Natural Gas Wind Solar Power Nuclear Power Hydropower
More Emphasis Less Emphasis Same
Americans continue to think that the U.S. should be putting more emphasis on producing energy from wind, solar, and hydropower.
November 2016
February 2018

20
Emphasis on Producing Domestic Energy by Region

21
Emphasis by Base GOP & Soft GOP
52%41%
52%
33%
56%
8%18% 16%
28%
6%
39% 40%30%
36% 33%
Natural Gas Wind Solar Power Nuclear Power Hydropower
More Emphasis Less Emphasis Same
Base GOPers favor putting more emphasis on hydropower the most; while soft GOPers want to see more on solar power.
42%48%
61%
32%
57%
10% 15% 13%
29%
7%
47%37%
26%38% 35%
Soft GOP (18%)
Base GOP (18%)

22
Emphasis by Independents (17%)
29%
65%70%
25%
56%
27%
11% 10%
38%
7%
44%
23%19%
32% 34%
Natural Gas Wind Solar Power Nuclear Power Hydropower
More Emphasis Less Emphasis Same
Independents want more emphasis placed on developing energy from solar power, wind, and hydropower sources.

23
Emphasis by Base Dems & Soft Dems
38%
82%91%
26%
62%
19%
4% 1%
40%
4%
43%
13% 8%
32% 29%
Natural Gas Wind Solar Power Nuclear Power Hydropower
More Emphasis Less Emphasis Same
Democrats strongly support placing more emphasis on producing energy from solar power and wind sources.
25%
84%91%
21%
65%
33%
3% 1%
42%
5%
41%
13%7%
36%27%
Soft Dems (21%)
Base Dems (25%)

24
50%
34% 32%
16%
9%13%
39%
59%
34%39%
27%23%
Geothermal Biomass Clean Coal^ Coal^^
More Emphasis Less Emphasis Same
“Do you think that, as a country, the United States should put more emphasis, less emphasis, or about the same emphasis as it does now on producing domestic energy from each of the following sources...”
Americans want to see more emphasis placed on producing domestic energy from geothermal sources and less emphasis placed on coal.
^Split Sample A, N=501; ^^Split Sample B, N=499

25
Emphasis on Producing Domestic Energy By Region
^Split Sample A, N=501; ^^Split Sample B, N=499

26
Emphasis by Base GOP & Soft GOP
33%23%
59%
39%
13%19%
8%19%
45% 41%34% 39%
Geothermal Biomass Clean Coal^ Coal^^
More Emphasis Less Emphasis Same
GOPers would like to see more emphasis placed on clean coal.
44%33%
56%
19%12% 13% 9%
42%35%
42%33%
39%
Soft GOP (18%)
Base GOP (18%)
^Split Sample A, N=501; ^^Split Sample B, N=499

27
Emphasis by Independents (17%)
52%
32%
17%
11%7%
16%
47%
69%
34% 33% 31%
18%
Geothermal Biomass Clean Coal^ Coal^^
More Emphasis Less Emphasis Same
Independents are adamantly against coal and clean coal but support the development of geothermal sources of energy.
^Split Sample A, N=501; ^^Split Sample B, N=499

28
Emphasis by Base Dems & Soft Dems
56%
40%
21%13%
7% 9%
58%
71%
28%38%
18% 13%
Geothermal Biomass Clean Coal^ Coal^^
More Emphasis Less Emphasis Same
A majority of Democrats want to see more emphasis on geothermal energy and less emphasis on clean coal and coal.
59%
39%
12%2%6% 9%
63%
86%
32%42%
21%13%
Soft Dems (21%)
Base Dems (25%)
^Split Sample A, N=501; ^^Split Sample B, N=499

29
78% 78%
69%64% 62%
17% 17% 18%
30% 28%
Base GOP(18%)
Soft GOP(18%)
Independent(17%)
Soft Dem(21%)
Base Dem(25%)
Yes Vote No Vote
70% of voters would support an initiative to Minimize Regulation on the Energy Market and Eliminate Legal Energy Monopolies.
A yes vote supports this initiative to require the
legislature to establish an open, competitive retail
electric energy market, reduce energy market regulations,
and prohibit energy monopolies.
70%
23%A no vote opposes this initiative to require the
legislature to establish an open and competitive retail
energy market.
“If an initiative to Minimize Regulations on the Energy Market and Eliminate Legal Energy Monopolies is on the ballot in your state in November, how would you vote if the language reads...”
…and…
By Party
+61 +61 +51 +34 +34

30
Americans prefer a system for purchasing electricity where people have a choice of where they purchase it and what kind of electricity.
The current system, in which nearly everyone purchases their electricity from one monopoly utility.14%
83%A new system that allows people to have a
choice of where they purchase electricity and what kind of electricity, such as clean energy.
“Now, I would like to read you two options about purchasing electricity, and please tell me which one you prefer...”
…or…

31
Voters believe that America can create a new electricity system that benefits the environment and opens up markets to competition.
America can create a new electricity system that benefits the environment, accelerates the availability of new technology, and creates more choices by opening
up markets to competition, giving consumers more choices instead of just their monopoly utility.
79%
19%The current electricity monopoly system works
fine as it is, and change will only end up creating confusion, reducing reliability,
and resulting in higher costs for consumers.
“Now, I would like to read you two options about purchasing electricity, and please tell me which one comes closest to your own opinion.”
…or…
32
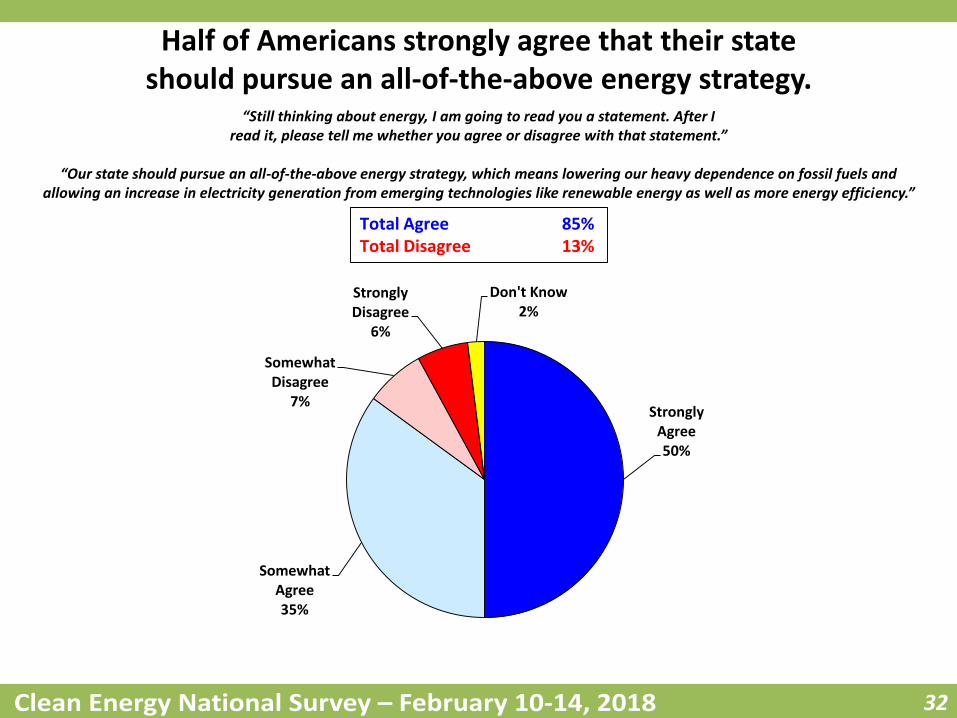
Strongly Agree50%
Somewhat Agree35%
Somewhat Disagree
7%
Strongly Disagree
6%
Don't Know2%
“Still thinking about energy, I am going to read you a statement. After I read it, please tell me whether you agree or disagree with that statement.”
“Our state should pursue an all-of-the-above energy strategy, which means lowering our heavy dependence on fossil fuels and allowing an increase in electricity generation from emerging technologies like renewable energy as well as more energy efficiency.”
Half of Americans strongly agree that their state should pursue an all-of-the-above energy strategy.
Total Agree 85%Total Disagree 13%

33
Two-thirds of voters believe net metering is fair.
Some people say net metering is fair because it encourages the development of solar resources,
and other customers benefit from the extra solar energy that goes onto the electricity grid.
67%
26%Other people say net metering is unfair because solar
customers use the electricity grid, too, and needto pay a fair rate for their use. They say that
otherwise, solar customers’ use of electricity grid becomes subsidized by non-solar customers.
“Changing topics slightly… As you may know, thirty-eight states have a policy called net metering that allows homeowners, businesses, local school districts, and other organizations to get full retail credit for the extra energy their rooftop solar panels produce. This extra solar energy goes onto the electricity grid for the utility company to sell at the full retail rate to other customers.
I am going to read you two statements about this, and please tell me which one comes closer to your own point of view.”
…or…

Message Testing

35
58%
5%
58%
47%
7%
44%
6%
33%
9%
90%
10%
94%
4%*
84%
14%
83%*
16%
75%
22%
Very Important Total Important Not At All Important Total Not Important
52%
52%
44%
43%
7%
33%
7%
89%
11%
93%
6%*
87%*
12%
85%
15%*
80%
19%*
“Now I am going to read you a list of policies that advocates have prioritized to help expand our state’s commitment to clean energy. After I read each one, please tell me whether you think that
policy is very important, somewhat important, not too important or not important at all.”
Ranked by % Very Important
Energy efficiency upgrades to reduce the amount of power we need to generate and purchase.
Net metering policies that enable homeowners to invest in their own rooftop solar.
Support for these clean energy policies remains strong.
Community renewable projects like solar that enable consumers to share the benefits and save money on their
bills.
Data access for consumers with smart meters so they can monitor their personal energy usage.
Permit third‐party sales so that consumers can buy their electricity from someone other than a utility.
November 2016 February 2018
*Denotes Rounding

36
56%
41%
5%
22%
17%
92%*
7%
87%
12%
66%
33%
“Now I am going to read you a list of policies that advocates have prioritized to help expand our state’s commitment to clean energy. After I read each one, please tell me whether you think
that policy is very important, somewhat important, not too important, or not important at all.”
Ranked by % Very Important
Protecting property owners’ rights to lease their land for renewable energy protection.^^
Providing tax incentives for those who buy electric vehicles.
Over half of Americans believe it is very important to protectthe ability of property owners to produce energy on their land.
Protecting property owners’ ability to produce energy on their land.^
*Denotes Rounding; ^Split Sample A, N=501; ^^Split Sample B, N=499

37
Democrats(46%)
Community renewable projects like solar that enable consumers to share the benefits and save money on their bills.
64%
Energy efficiency upgrades to reduce the amount of power we need to generate and purchase.
63%
Protecting property owners’ ability to produce energy on their land.^
55%
Net metering policies that enable homeowners to invest in their own rooftop solar.
50%
Republicans(36%)
Protecting property owners’ ability to produce energy on their land.^
53%
Energy efficiency upgrades to reduce the amount of power we need to generate and purchase.
39%
Protecting property owners’ rights to lease their land for renewable energy production.^^
39%
Net metering policies that enable homeowners to invest in their own rooftop solar.
38%
Ranked by % Very Important
Top Messages Among Key Groups
^Split Sample A, N=501; ^^Split Sample B, N=499

38
Independents(17%)
Protecting property owners’ ability to produce energy on their land.^
63%
Energy efficiency upgrades to reduce the amount of power we need to generate and purchase.
53%
Community renewable projects like solar that enable consumers to share the benefits and save money on their bills
52%
Protecting property owners’ rights to lease their land for renewable energy production.^^
46%
Ranked by % Very Important
Top Messages Among Key Groups
^Split Sample A, N=501; ^^Split Sample B, N=499

39
Much More Likely
8%Somewhat More Likely
14%
Somewhat Less Likely
26%
Much Less Likely39%
No Difference
8%
Don't Know2%
Refused3%
“Would you be more likely or less likely to vote for a candidate for political office if you learned that the candidate OPPOSES increasing the development and use of clean energy in the United States?”
November 2016 February 2018^
Three quarters of voters say they are less likely to support a candidate who opposes increasing the development and use of clean energy, a ten point bump since 2016.
Much More Likely
4%Somewhat More Likely
13%
Somewhat Less Likely
31%
Much Less Likely44%
No Difference
6%
Don't Know2%
Refused1%
Total More Likely 22%Total Less Likely 65%
Total More Likely 17%Total Less Likely 75%
^Split Sample A, N=501

40
24%
33%
11%7%
11%
64%
54%
78%
90%
84%
Base GOP(19%)
Soft GOP(18%)
Independent(17%)
Soft Democrat(20%)
Base Democrat(25%)
More Likely Less Likely
By Party
The majority of voters across party lines say they are less likely to support a candidate who opposes increasing the development and use of clean energy.
“Would you be more likely or less likely to vote for a candidate for political office if you learned that the candidate OPPOSES increasing the development and use of clean energy in the United States?”
-40 -21 -67 -83 -73

41
Three quarters of Americans believe candidates who support clean energy policies care more about their family’s future.
Candidate A, who supports policies favorable to transitioning your
community towards more clean energy.75%
19% Candidate B, who prefers keepingthings the way they are now.
“Who do you think cares more about your family’s future...”
…or…
42
64%
54%
52%
13%
48%
8%
47%
92%
8%
92%
8%
75%*
24%
84%*
15%
88%
11%
68%
5%
58%
5%
56%
11%
59%
9%
51%
7%
89%
10%
88%
11%
78%
21%
84%*
16%
82%
16%
Strongly Agree Total Agree Strongly Disagree Total Disagree
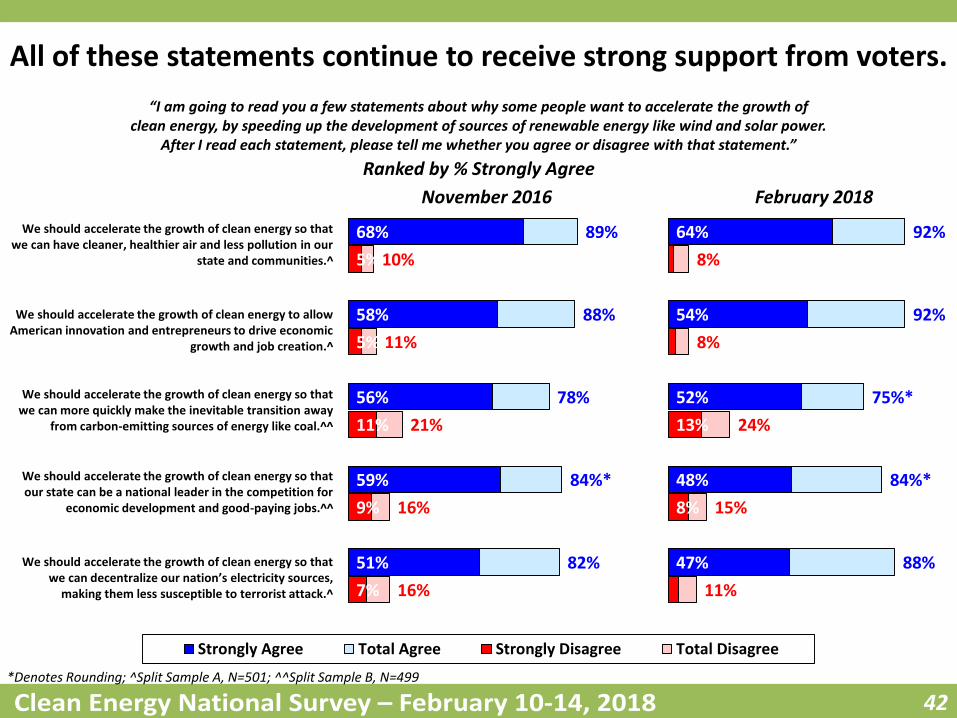
“I am going to read you a few statements about why some people want to accelerate the growth of clean energy, by speeding up the development of sources of renewable energy like wind and solar power.
After I read each statement, please tell me whether you agree or disagree with that statement.”
Ranked by % Strongly Agree
We should accelerate the growth of clean energy to allow American innovation and entrepreneurs to drive economic
growth and job creation.^
We should accelerate the growth of clean energy so that we can more quickly make the inevitable transition away
from carbon-emitting sources of energy like coal.^^
All of these statements continue to receive strong support from voters.
We should accelerate the growth of clean energy so that we can have cleaner, healthier air and less pollution in our
state and communities.^
We should accelerate the growth of clean energy so that our state can be a national leader in the competition for
economic development and good-paying jobs.^^
We should accelerate the growth of clean energy so that we can decentralize our nation’s electricity sources,
making them less susceptible to terrorist attack.^
November 2016 February 2018
*Denotes Rounding; ^Split Sample A, N=501; ^^Split Sample B, N=499
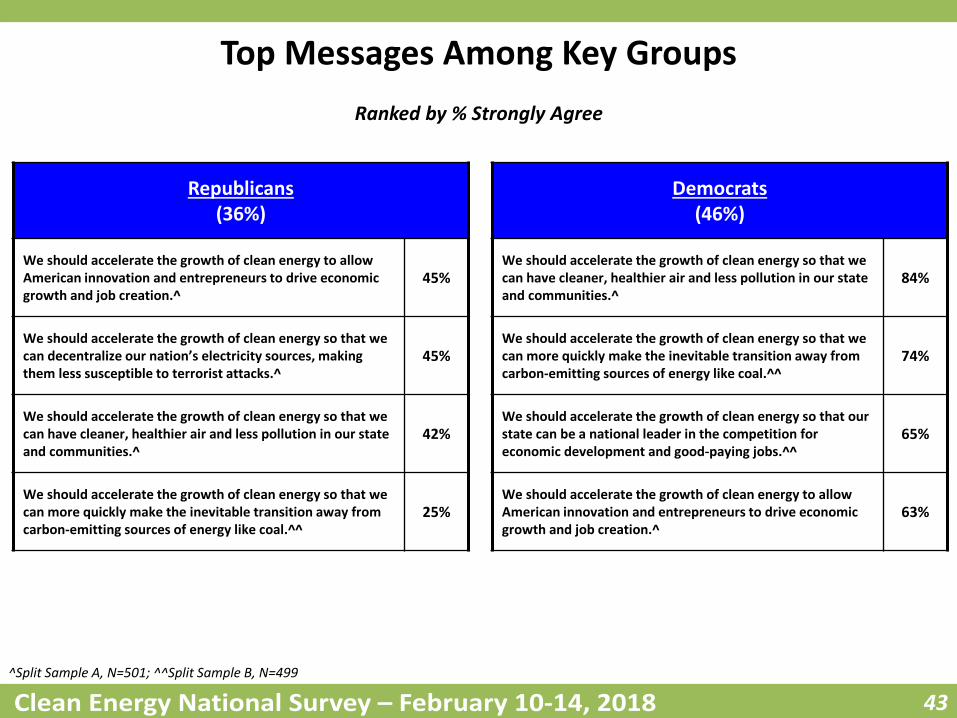
43
Democrats(46%)
We should accelerate the growth of clean energy so that we can have cleaner, healthier air and less pollution in our state and communities.^
84%
We should accelerate the growth of clean energy so that we can more quickly make the inevitable transition away from carbon-emitting sources of energy like coal.^^
74%
We should accelerate the growth of clean energy so that our state can be a national leader in the competition for economic development and good-paying jobs.^^
65%
We should accelerate the growth of clean energy to allow American innovation and entrepreneurs to drive economic growth and job creation.^
63%
Republicans(36%)
We should accelerate the growth of clean energy to allow American innovation and entrepreneurs to drive economic growth and job creation.^
45%
We should accelerate the growth of clean energy so that we can decentralize our nation’s electricity sources, making them less susceptible to terrorist attacks.^
45%
We should accelerate the growth of clean energy so that we can have cleaner, healthier air and less pollution in our state and communities.^
42%
We should accelerate the growth of clean energy so that we can more quickly make the inevitable transition away from carbon-emitting sources of energy like coal.^^
25%
Ranked by % Strongly Agree
Top Messages Among Key Groups
^Split Sample A, N=501; ^^Split Sample B, N=499

44
Independents(17%)
We should accelerate the growth of clean energy so that we can have cleaner, healthier air and less pollution in our state and communities.^
57%
We should accelerate the growth of clean energy so that we can decentralize our nation’s electricity sources, making them less susceptible to terrorist attacks.^
53%
We should accelerate the growth of clean energy so that our state can be a national leader in the competition for economic development and good-paying jobs.^^
53%
We should accelerate the growth of clean energy to allow American innovation and entrepreneurs to drive economic growth and job creation.^
49%
Ranked by % Strongly Agree
Top Messages Among Key Groups
^Split Sample A, N=501; ^^Split Sample B, N=499

45
60%
9%
42%
11%
84%
16%
77%
21%
Strongly Agree Total Agree Strongly Disagree Total Disagree
52%
8%
35%
13%
82%
18%
74%
24%
“I am now going to read you some proposals dealing with energy. After I read each statement, please tell me whether you agree or disagree with that particular statement.”
Ranked by % Strongly Agree
Americans support requiring utility monopolies to have clean energy as one of the sources of power they generate.
Where utilities have a monopoly on providing power to consumers, they should be required to have clean energy
as one of the sources of power they generate.
We should increase state government funding for basic research into clean energy technology without picking
winners and losers, launching a “space race” –style effort to reach new energy frontiers.
November 2016 February 2018

46
More Than $20/ Month
1%
$20/ Month23%
$15/ Month11%
$10/ Month20%
$5/ Month12%
$1/ Month23%
Less than $1/ Month
1%
Nothing/Not Willing
7%
Unsure/Refused
2%
“Thinking again about renewable energy... The cost of renewable energy is coming down dramatically, but using renewableenergy does still cost more. How much more would you be willing to pay per month in higher electricity prices?”
A majority of voters say they would be willing to pay ten dollars or more per month for electricity that comes from renewable energy.
$5 or less 43%$10-15 31%$20+ 24%

47
Much More Likely
8%
Somewhat More Likely
9%
Somewhat Less Likely
27%
Much Less Likely47%
No Difference
5%
Don't Know3%
Refused1%
“Would you be more likely or less likely to vote for a candidate for political office if you learned thatthe candidate OPPOSES increasing the development and use of clean energy in the United States?”
After messaging, 75% of Americans still say theywould be less likely to vote for a candidate who
opposes increasing the development of clean energy.
Total More Likely 17%Total Less Likely 75%*
*Denotes Rounding; ^Split Sample A, N=501; ^^Split Sample B, N=499
Much More Likely
4%Somewhat More Likely
13%
Somewhat Less Likely
31%
Much Less Likely44%
No Difference
6%
Don't Know2%
Refused1%
Total More Likely 17%Total Less Likely 75%
Post-Messaging^^Pre-Messaging^

48
• Support for clean energy remains high. While it is not a top issue to voters in importance, it is one that crosses partisan lines. There are clear messages that resonate well with Republicans, and the issue also attracts Independents.
• Voters are more concerned about energy issues now than in our November 2016 post-election survey, and say it is important that candidates share their views on energy issues.
• Americans, including base and soft Republicans, continue to say that the country should be putting more emphasis on producing energy from wind, solar, and hydropower. They also want more emphasis on natural gas. Base GOPers remain supportive of coal, with “clean coal” testing 31 net points better than just “coal.” Soft GOPers like “clean coal” but despise “coal.” Independents are negative to both.
• Conservatives want more competition. Testing the Nevada 2016 ballot measure on minimizing regulation on energy markets/eliminating legal energy monopolies tests off the charts, and does particularly well with Republican voters.
• Voters also overwhelmingly want people to have a choice in electricity markets. An “all of the above” energy strategy is widely supported.
The Bottom Line

49
• Support for specific clean energy policy ideas test well across party lines as well. Conservative voters respond well to private property messages.
• Candidates who oppose increasing the development and use of clean energy run a significant risk of losing voters – even Republicans. Independents are also very much at risk to these candidates.
• Messaging shows that voters respond well to accelerating the growth of clean energy for three main reasons – a cleaner environment, innovation that drives economic growth and job creation, and carbon (that latter does not resonate with Republicans).
• In a year fraught with electoral peril for Republicans, clean energy issues provide a boost with key voter groups, including Independents.
The Bottom Line

Glen [email protected]
For more information about this presentation or about Public Opinion Strategies, please give us a call.